-
Diabetes is a common chronic disease worldwide, with an estimated global prevalence of 9.3% in 2019, and it is recognized as an independent risk factor for cardiovascular and cerebrovascular diseases (CVD)[1]. Cerebral infarction (CI), the most common cerebrovascular manifestation in patients with diabetes, is associated with high morbidity and mortality[2,3]. Individuals with diabetes are more likely to develop ischemic stroke, and hyperglycemia is believed to aggravate cerebral infarction and adversely affect clinical prognosis[4-7]. Numerous studies have proposed a strong association between hyperglycemia and ischemic stroke, suggesting that hyperglycemia is an independent risk factor for ischemic stroke and that glycemic control may be a key strategy to reduce this risk[8,9] However, most current epidemiological studies have assessed fasting blood glucose (FBG) at single or limited time points over short periods, overlooking long-term dynamic changes in FBG[10-13]. Consequently, data on the association between long-term glycemic control and cerebral infarction in a large-scale population remain limited. This study aimed to examine the association between long-term glycemic control and the risk of cerebral infarction in patients with diabetes over an extended follow-up period in a large-scale cohort.
-
The Kailuan Study is an ongoing prospective cohort study conducted in the Kailuan community of Tangshan, China, designed to investigate risk factors for chronic diseases[14-16]. Between July 2006 and October 2007, a total of 101,510 participants—81,110 men and 20,400 women aged over 18 years—were recruited from 11 hospitals in the Kailuan community. All participants completed questionnaires and underwent health assessments, with follow-up occurring biennially since 2006.
For the present study, FBG trajectory patterns were derived using data collected from 2006 to 2012 to predict the risk of incident cerebral infarction occurring after 2012. A total of 12,846 participants diagnosed with type 2 diabetes in 2006 and/or 2008 and who attended at least two surveys between 2006 and 2012 were initially enrolled. Diabetes was defined as fasting glucose ≥ 7.0 mmol/L, use of glucose-lowering medications, or self-reported history of diabetes. Participants with fewer than two FBG measurements (n = 792) were excluded, resulting in 12,054 individuals included for FBG trajectory identification. An additional 842 participants diagnosed with cerebral infarction in or before 2012 or lost to follow-up after 2012 were excluded. Ultimately, 11,212 participants were included in the final analysis of the association between the FBG trajectories and the risk of cerebral infarction (Figure 1). The study was conducted in accordance with the Declaration of Helsinki and approved by the ethics committee of Kailuan General Hospital. Written informed consent was obtained from all participants or their legal representatives.
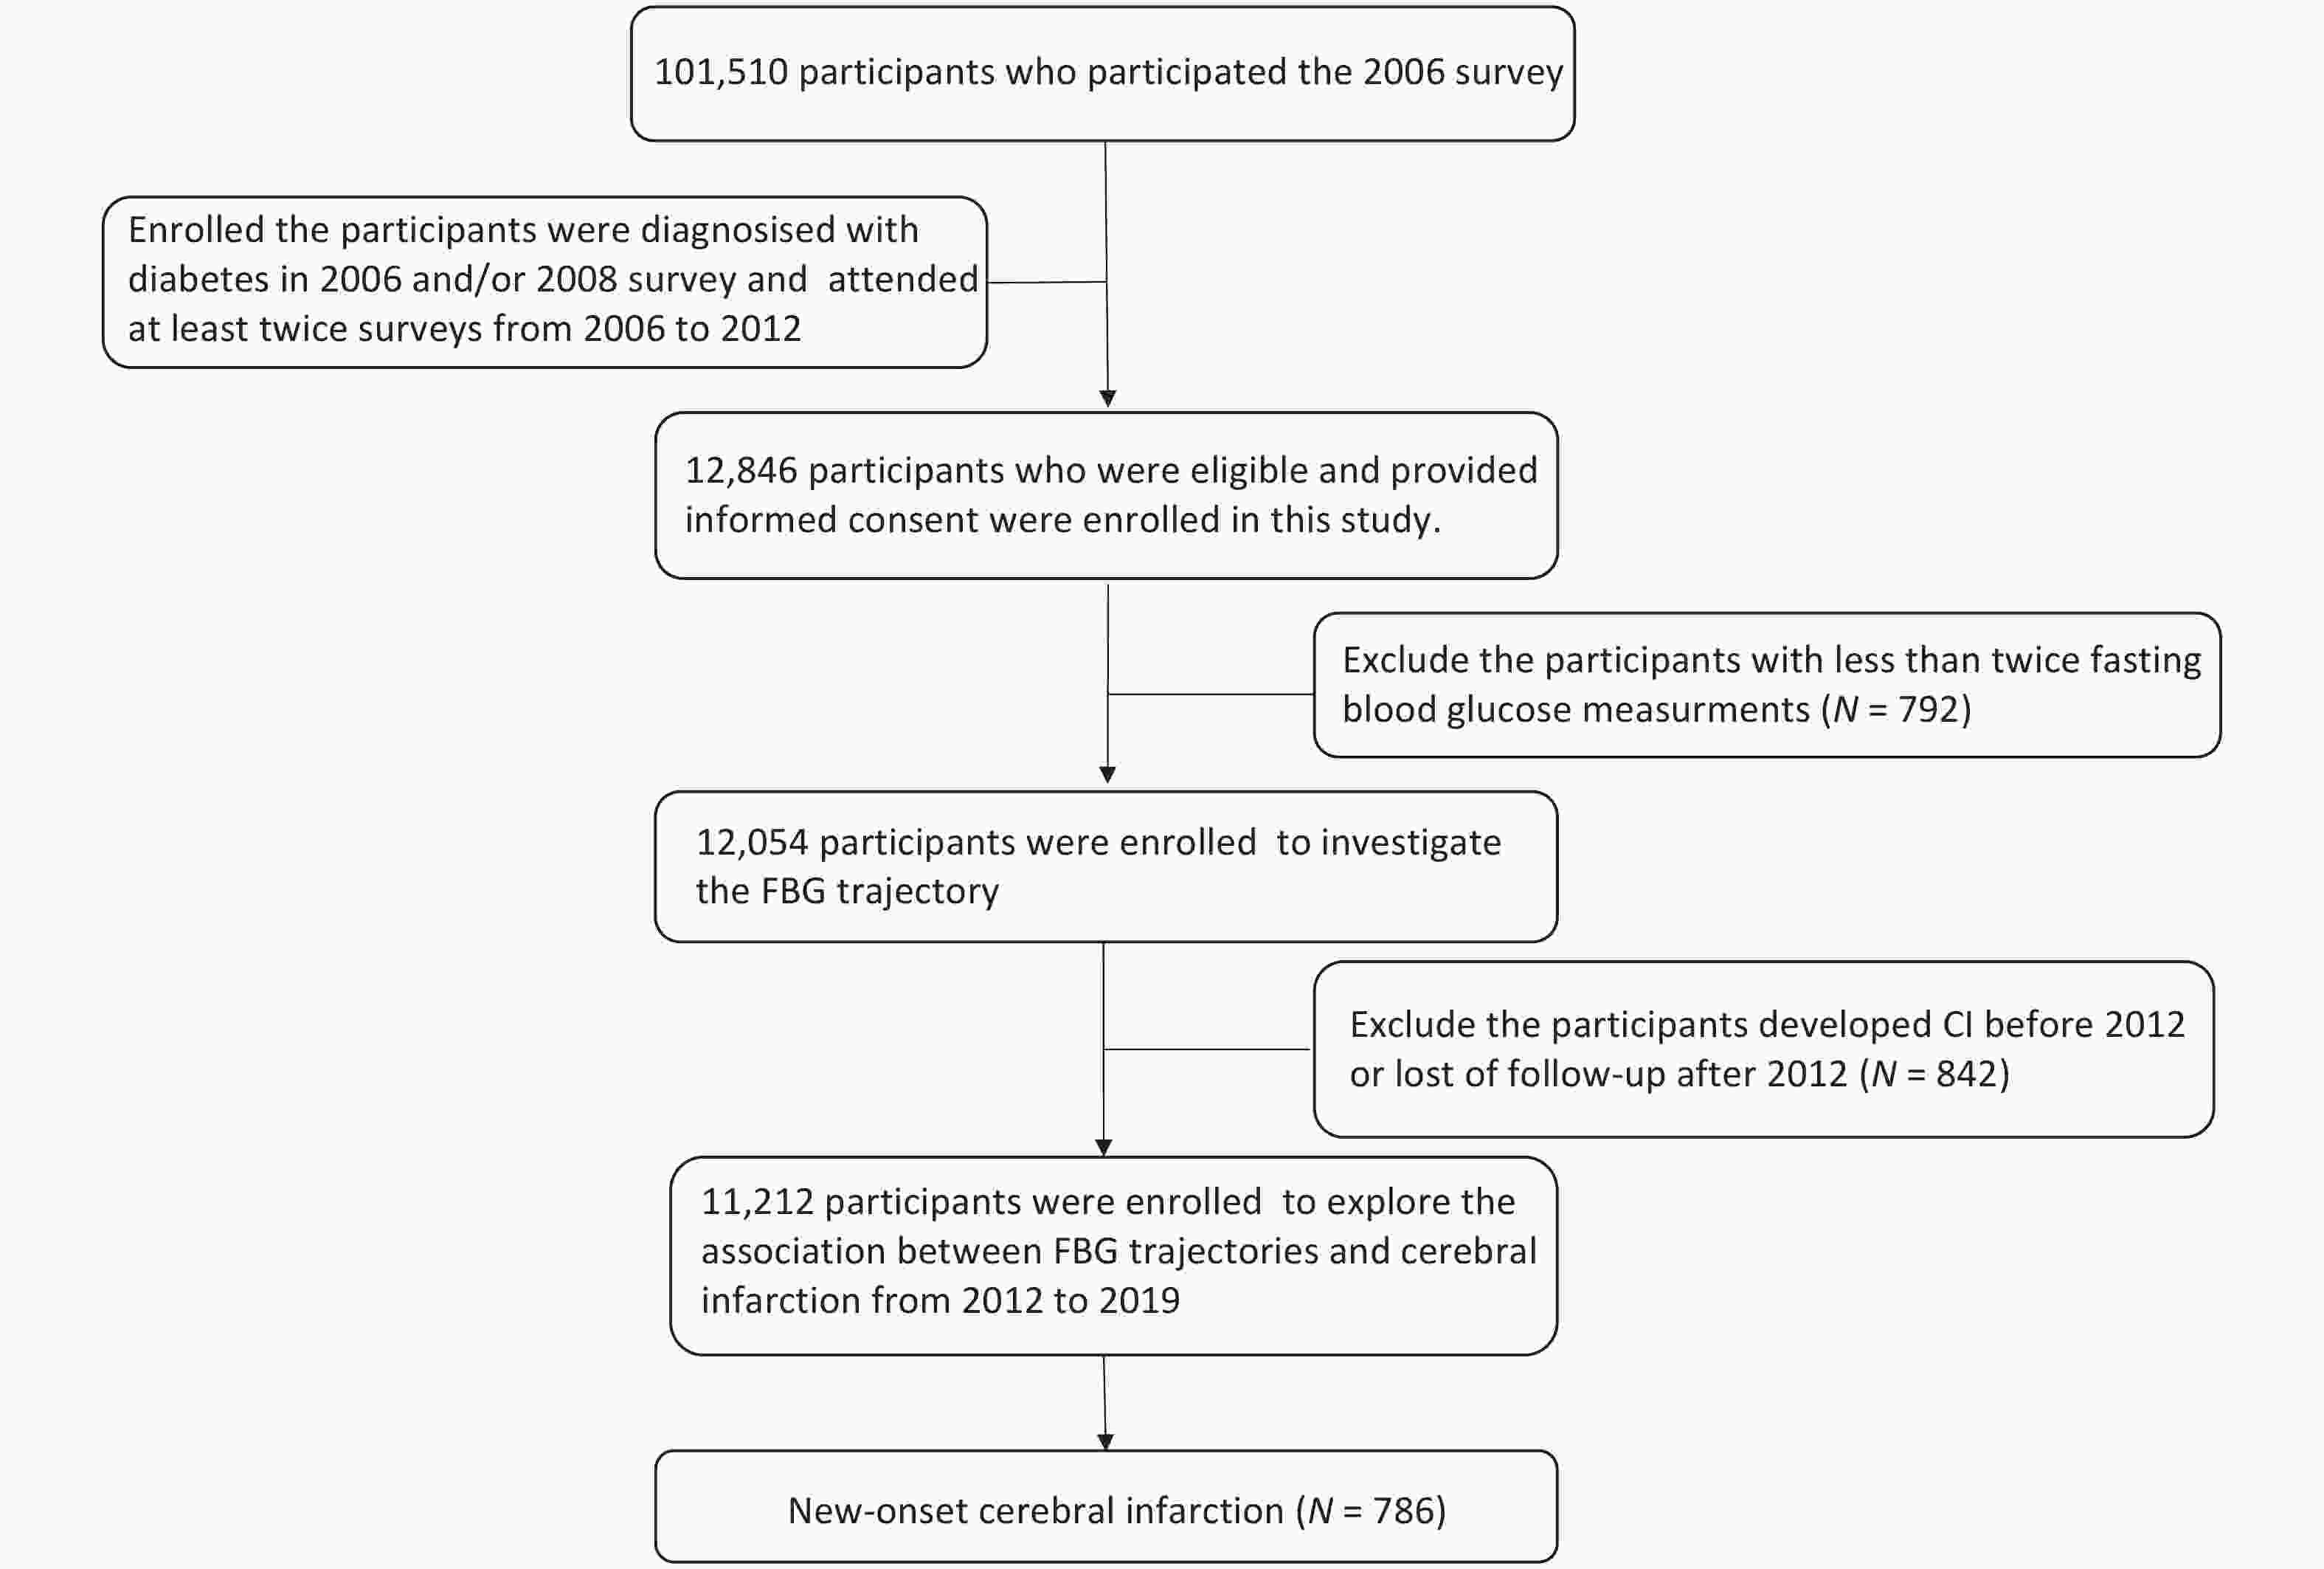
Figure 1. The study flow chart. FBG, fasting blood glucose; CI, cerebral infarction.
-
Data on potential covariates were collected during the 2006 survey and updated every 2 years. Demographic and clinical characteristics—including age, sex, education status, smoking status, drinking status, physical activity, and medical history (including hypertension, diabetes mellitus, hyperlipidemia) as well as active treatment with anti-diabetic agents, anti-hypertensive agents, and lipid-lowering agents—were collected using a standardized questionnaires. Smoking status was categorized as current, former, or never smoker. Drinking status was defined as current, former, or never drinker. Physical activity was classified as inactive (none), moderately active (< 80 min per week), or very active (≥ 4 times per week for ≥ 20 min per session). Education level was grouped as middle school or below and college or above. Medical conditions, including hypertension and hyperlipidemia, were defined by (1) documented or self-reported history, (2) use of relevant medications, or (3) clinical or laboratory findings (blood pressure ≥ 140/90 mm Hg on repeated measurements for hypertension; serum total cholesterol ≥ 5.7 mmol/L, triglycerides ≥ 1.7 mmol/L, or low-density lipoprotein cholesterol level ≥ 4.1 mmol/L for hyperlipidemia)[17]. Body mass index (BMI) was calculated as weight (kg) divided by height squared (m2). Blood pressure (BP) was measured by trained nurses, with the average of three readings recorded. Serum levels of total cholesterol (TC), triglycerides (TG), high-density lipoprotein cholesterol (HDL), low-density lipoprotein cholesterol (LDL), uric acid, and high-sensitivity C-reactive protein (hs-CRP) were measured using an auto-analyzer (Hitachi 747; Hitachi, Tokyo, Japan) at the central laboratory of Kailuan Hospital.
-
FBG levels were measured repeatedly at baseline and during the 2008, 2010, and 2012 surveys. Fasting blood samples, collected in the morning after an 8–12 h overnight fast, were transferred into vacuum tubes containing ethylenediaminetetraacetic acid (EDTA). Plasma was separated immediately and stored at 4 °C. Blood glucose concentrations were measured within 4 hours of sample collection. An automatic analyzer (Hitachi 747; Hitachi, Tokyo, Japan) was used to measure the FBG levels using the hexokinase/ glucose-6-phosphate dehydrogenase method. The coefficient of variation for blind quality control specimens was 2.0%. Diabetes was defined as an FBG ≥ 7.0 mmol/L, self-reported physician diagnosis, or use of antidiabetic medications.
-
The primary outcome was the first occurrence of CI, diagnosed based on the World Health Organization criteria and confirmed by brain computed tomography or magnetic resonance imaging[18]. Outcomes were confirmed through a review of the medical records of potential CI cases identified using the International Classification of Diseases (ICD) code and/or a questionnaire completed by a panel of three cardiologists. ICD-10 code 163 was used to identify potential cerebral infarctions (I63). To retrieve these cases, survey participants were linked to the Municipal Social Insurance Institution and all 11 discharge registers of Kailuan Hospital, which collectively covered all participants in the Kailuan study. Mortality information was obtained from provincial vital statistical offices.
-
Follow-up person-time was calculated for each participant from the 2006 survey (baseline) until the date of cerebral infarction diagnosis, death, loss to follow-up, or end of follow-up (December 31, 2019), whichever occurred first. Of the participants, 450 (3.3%) were lost to follow-up due to migration or other reasons but were included in the trajectory analyses as they contributed person-time.
FBG trajectories from 2006 to 2012 were identified using latent mixture modelling with the PROC Traj procedure[19,20]. A censored normal model was applied for the continuous FGB variable. Model fit was evaluated using the Bayesian Information Criterion (BIC). Models with five trajectories were initially fitted and compared with models having four, three, two, and one trajectory. The four-trajectory model was determined to be the best fit and was further evaluated with different functional forms. Quadratic and linear terms were considered and evaluated based on their significance levels (P < 0.05), starting with the highest polynomial. The final model included three trajectories with quadratic terms and one with a linear term.
The Kolmogorov-Smirnov test was used to assess the normality of continuous variables, which were expressed as means ± standard deviations (SD). One-way analysis of variance (ANOVA) was conducted to compare continuous variables. The chi-squared test was used to evaluate intergroup differences in categorical variables. Kaplan-Meier estimates were generated to calculate cumulative risks, with group comparisons performed using the log-rank test. The proportional hazards assumption was verified using Schoenfeld residuals and found to be satisfied (P > 0.05), allowing retention of standard Cox proportional hazards models. Associations between FBG trajectories and outcomes were assessed using Cox proportional hazards models by calculating hazard ratios (HR) and 95% confidence intervals (95% CI) satisfying the proportional hazard assumption. Adjustments were made for potential confounders, including age, sex, smoking status, drinking status, education level, physical activity, history of hypertension and hyperlipidemia, BMI, HDL cholesterol, uric acid, hs-CRP, and competing risks between death and cerebral infarction outcomes. To investigate whether the potential association between FBG trajectory and CI can be modified by age and sex, we assessed the interactions between FBG trajectory and these factors after adjusting for the aforementioned covariates. Subgroup analyses stratified by age and sex were performed.
Multiple sensitivity analyses were conducted. To assess whether the association could be attributed to a single FBG measurement during follow-up, additional adjustments were made for the first and last FBG measurements, separately. Given that several participants received antidiabetic treatment, this factor was also adjusted for. To minimize the possibility of reverse causality, a lag analysis was conducted by excluding incident cerebral infarctions occurring within the first year of follow-up. All statistical tests were two-sided with statistical significance defined as P < 0.05. All analyses were performed using SAS, version 9.4 (SAS Institute, Inc., Cary, NC, USA).
-
Of the 12,054 participants included in the FBG trajectory analysis, 7,264 (82.3%) were men. The mean age of the participants was 55.2 years. Four distinct FBG trajectories were identified based on FBG concentrations and their changes over the six-year follow-up period (Figure 2). From 2006 to 2012, the majority of participants (73.2%, n = 8,824) maintained lower FBG concentrations, with mean values ranging from 6.9 to 7.5 mmol/L; this group was categorized as having a low-stable pattern. A second group (16.3%, n = 1,967), referred to as the moderate-increasing pattern, started with moderately elevated FBG levels, which increased from 9.1 mmol/L in 2006 to 11.6 mmol/L in 2012. The elevated-decreasing pattern was characterized by initially high FBG concentrations that decreased over time, from 15.4 mmol/L in 2006 to 8.6 mmol/L in 2012, and included 5.8% of participants (n = 700). Finally, 4.7% of participants (n = 563) consistently exhibited high FBG concentration ranging from 12.9 mmol/L in 2006 to 16.7 mmol/L in 2012, and were categorized under the elevated-stable pattern (Supplementary Table S1).

Figure 2. The fasting blood glucose trajectories derived from 38,272 FBG measurements in 12,054 participants who were diagnosed with diabetes in 2006 and/or 2008 survey and had at least twice fasting blood glucose measurements from 2006 to 2012.
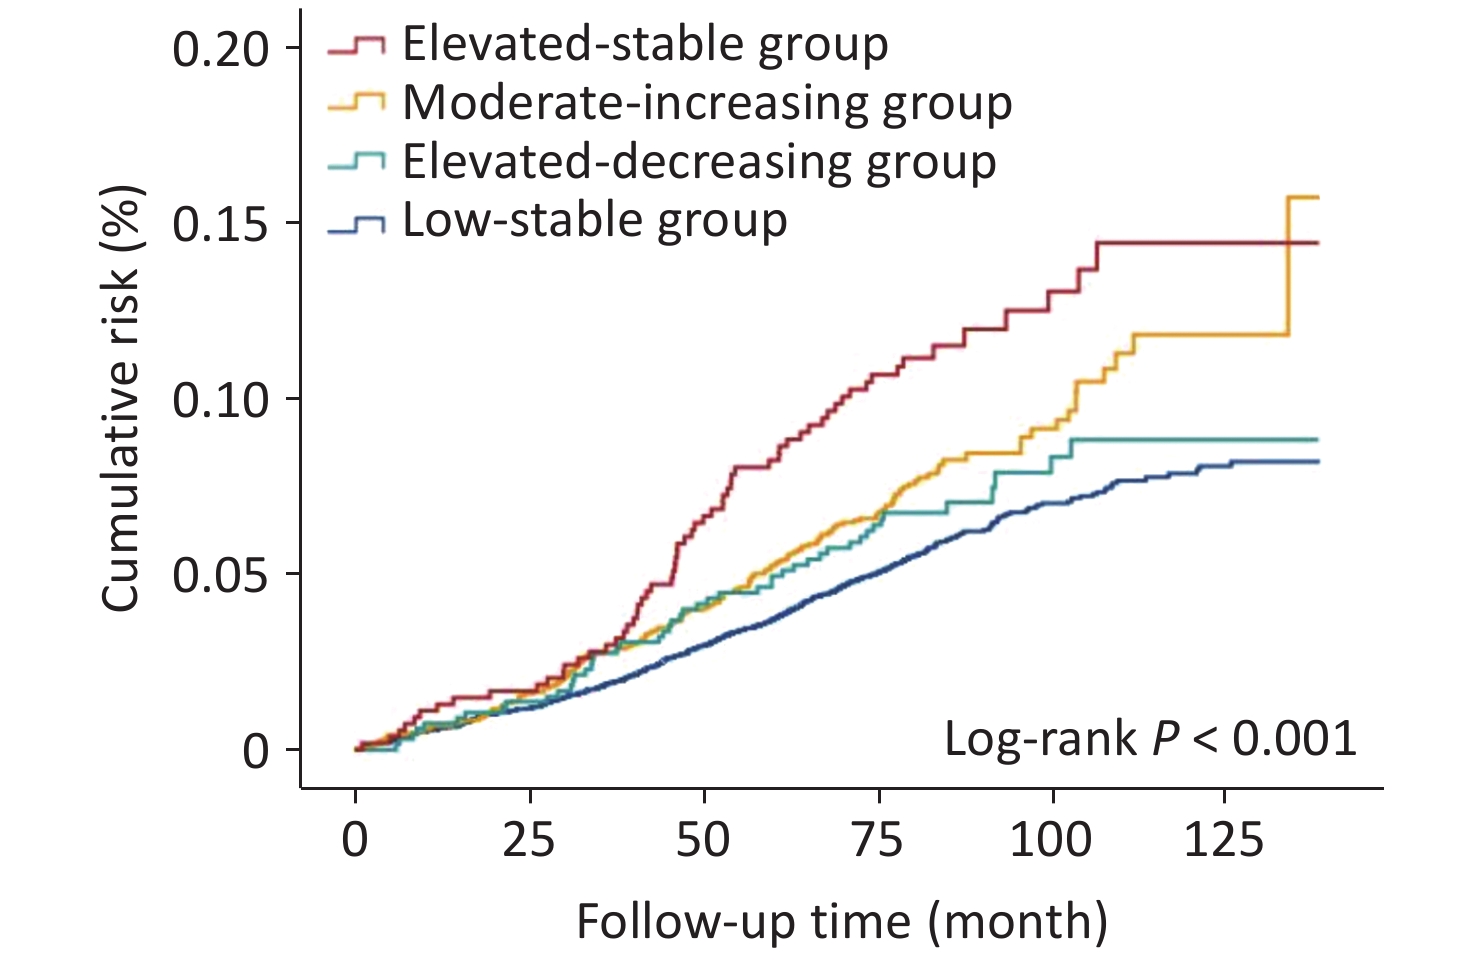
Baseline characteristics of participants, stratified by FBG trajectories from 2006 to 2012, are presented in Table 1. Over a median follow-up of 6.9 years, 786 cerebral infarction events were recorded. Kaplan-Meier cumulative risk curves for outcomes according to FBG trajectory patterns, are shown in Figure 3. Patients with different trajectory patterns exhibited significantly different outcome risks (Log-Rank P < 0.001). Compared with individuals in the low-stable group, adjusted HRs were 1.37 (95% CI 1.15–1.65) for the moderate-increasing group, 1.23 (95% CI 0.91–1.66) for the elevated-decreasing group, and 2.08 (95% CI 1.59–2.71) for elevated-stable group, after adjusting for the potential confounders (Table 2). Additional adjustments for the first or last FBG measurement from 2006 to 2012 or for antidiabetic treatment did not substantially alter these findings (Table 3).
Characteristics Low-stable
(n = 8,824)Moderate-increasing
(n = 1,967)Elevated-decreasing
(n = 700)Elevated-stable
(n = 563)P value Number (%) of participants Males 7,264 (82.3) 1,626 (82.7) 555 (79.3) 452 (80.3) 0.120 Smoking status < 0.001 Never 5,966 (67.6) 1,279 (65.0) 481 (68.7) 374 (66.4) Ex-smoker 420 (4.8) 94 (4.8) 55 (7.9) 28 (5.0) Current smoker 2,438 (27.6) 594 (30.2) 164 (23.4) 161 (28.6) Drinking status 0.003 Never 6,283 (71.2) 1,403 (71.3) 523 (74.7) 425 (75.5) Ex-drinker 120 (1.4) 20 (1.0) 18 (2.6) 7 (1.2) Current drinker 2,421 (27.4) 544 (27.7) 159 (22.7) 131 (23.3) Physical exercises 0.220 0Inactive 2,212 (25.1) 516 (26.2) 162 (23.1) 157 (27.9) Moderately active 5,224 (59.2) 1,174 (59.7) 430 (61.4) 315 (56.0) Very active 1,388 (15.7) 277 (14.1) 108 (15.4) 91 (16.2) Education status 0.002 Middle school or below 8,328 (94.4) 1,884 (95.8) 676 (96.6) 544 (96.6) College or above 496 (5.6) 83 (4.2) 24 (3.4) 19 (3.4) Hypertension 5,449 (61.8) 1,207 (61.4) 405 (57.9) 324 (57.6) 0.060 Hyperlipidemia 5,764 (65.3) 1,364 (69.3) 533 (76.1) 395 (70.2) < 0.001 On anti-diabetic treatment 3,278 (37.2) 1,145 (58.2) 473 (67.6) 364 (64.7) < 0.001 Mean characteristic Age (year) 55.4 ± 10.4 55.3 ± 9.8 55.5 ± 9.8 54.4 ± 9.4 0.200 BMI (kg/m2) 26.3 ± 3.4 26.7 ± 3.5 25.3 ± 3.5 26.1 ± 3.6 < 0.001 Systolic BP (mm Hg) 138.2 ± 19.5 138.2 ± 19.6 136.8 ± 19.0 136.0 ± 19.5 0.040 Diastolic BP (mm Hg) 86.3 ± 11.1 86.3 ± 11.4 85.4 ± 11.3 84.5 ± 10.6 0.002 LDL-cholesterol (mmol/L) 2.42 ± 0.86 2.35 ± 0.85 2.37 ± 0.94 2.41 ± 0.83 0.020 Total cholesterol (mmol/L) 5.16 ± 1.06 5.21 ± 1.04 5.42 ± 1.08 5.36 ± 1.09 < 0.001 Triglycerides (mmol/L) 1.8 (1.2–2.5) 1.9 (1.3–2.7) 2.0 (1.5–3.0) 2.0 (1.4–3.0) < 0.001 HDL-cholesterol (mmol/L) 1.53 ± 0.41 1.51 ± 0.44 1.58 ± 0.49 1.56 ± 0.44 < 0.001 FBG (mmol/L) 7.2 ± 1.7 9.3 ± 2.1 15.3 ± 2.5 13.3 ± 3.3 < 0.001 Uric acid (umol/L) 293.2 ± 88.4 279.6 ± 85.3 261.6 ± 90.4 266.5 ± 83.8 < 0.001 Hs-CRP (mg/L) 2.0 (1.0–4.0) 1.5 (0.8–3.0) 2.5 (1.2–5.0) 2.0 (1.0–4.0) 0.047 Note. BMI, body mass index; BP, blood pressure; FBG, fasting blood glucose; Hs-CRP, hypersensitive C-reactive protein; LDL, low-density lipoprotein; HDL, high-density lipoprotein. Reported values are number of participants (%) or arithmetic means (± SD). Hypertension was defined as a SBP ≥ 140 mmHg or a DBP ≥ 90 mmHg, a history of hypertension, or treatment with antihypertensive medications Hyperlipidemia was defined as serum a total cholesterol ≥ 5.7 mmol/L, triglyceride ≥ 1.7 mmol/L, or low-density lipoprotein cholesterol level ≥ 4.1 mmol/L, a history of hyperlipidemia, or treatment with lipid-lowering medications. Table 1. Baseline characteristics of participants by fasting blood glucose trajectory groups
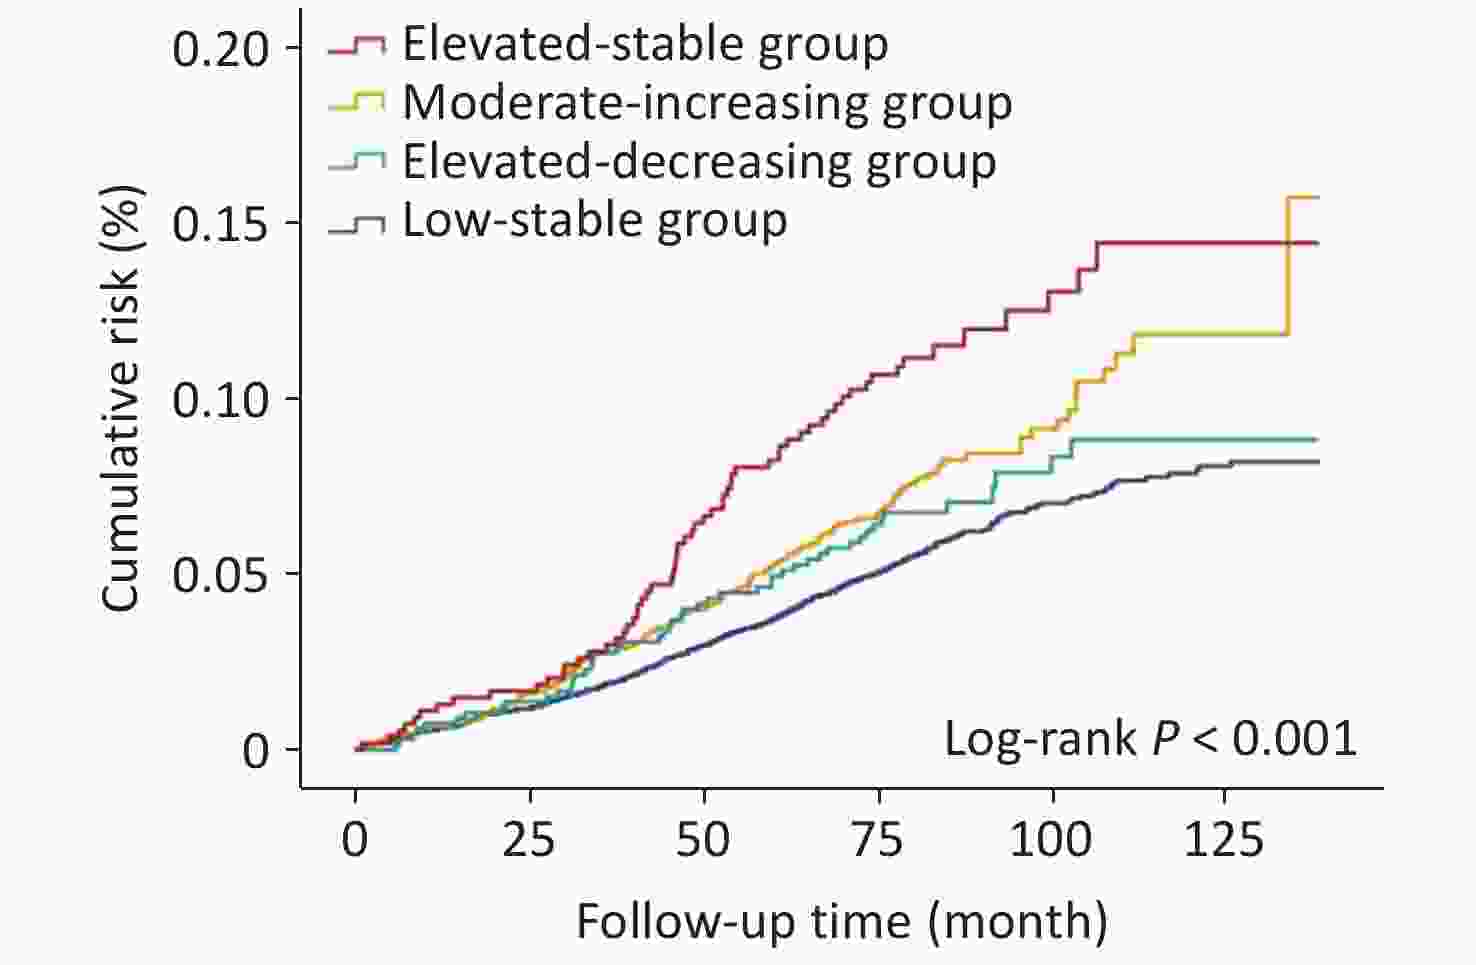
Figure 3. Cumulative risk of CI during a median follow-up of 6.9 years in the study population. Keplan-Meier cumulative risk curves for CI in the individuals with diabetes with different glucose trajectory patterns.
Outcome Events (N, %) Crude model HR (95% CI) Adjusted model HR (95% CI) Cerebral infraction Low-stable 513(6.2) Reference Reference Moderate-increasing 155 (8.4) 1.39 (1.16−1.67) 1.37 (1.15−1.65) Elevated-decreasing 48 (7.7) 1.21 (0.90−1.63) 1.23 (0.91−1.66) Elevated-stable 63 (12.2) 1.95 (1.50−2.54) 2.08 (1.59−2.71) Note. FBG, Fasting blood glucose; HR, Hazard ratio; CI, Confidence interval. Adjustments were made for age, smoking status, drinking status, education level, physical activity, history of hypertension and hyperlipidemia, BMI, HDL-cholesterol, Uric acid, and Hs-CRP. Table 2. Adjusted HR and 95% CIs for risk of cerebral infraction according to the FBG trajectory patterns
Group Low-stable Moderate-increasing Elevated-decreasing Elevated-stable Sensitivity 1 Reference 1.42 (1.18−1.72) 1.21 (0.88−1.67) 2.07 (1.56−2.75) Sensitivity 2 Reference 1.34 (1.11−1.61) 1.19 (0.88−1.61) 2.01 (1.54−2.63) Sensitivity 3 Reference 1.29 (1.06−1.56) 0.97 (0.64−1.47) 1.75 (1.23−2.48) Sensitivity 4 Reference 1.17 (0.89−1.53) 1.05 (0.71−1.57) 1.84 (1.02−2.91) Note. *FBG, Fasting blood glucose; HR, Hazard ratio; CI, Confidence interval; Data shown were HR (95% CI). Sensitivity 1: Excluding participants who developed cerebral infraction during the first-year follow-up (2013). Sensitivity 2: Further adjustments made for the participants with anti-diabetic treatment. Sensitivity 3: Further adjustments made for the first measurement of FBG. Sensitivity 4: Further adjustments made for the last measurement of FBG. Table 3. Sensitivity analysis
In addition, similar results were observed in a one-year lag analysis excluding cerebral infarction events occurring within the first year of follow-up (Table 2). In subgroup analyses stratified by sex, the association was significant in men but not in women. However, no significant interaction was found between FBG trajectories and sex in relation to cerebral infarction risk (Table 4) (P > 0.05).
Sex Events (N, %) Crude model HR (95% CI) Adjusted model HR (95% CI) Males Low-stable 447 (6.6) Reference Reference Moderate-increasing 133 (8.8) 1.36 (1.12−1.65) 1.35 (1.11−1.64) Elevated-decreasing 41 (8.3) 1.23 (0.90−1.70) 1.26 (0.91−1.74) Elevated-stable 55 (13.2) 1.99 (1.51−2.64) 2.09 (1.57−2.78) Females Low-stable 66 (4.4) Reference Reference Moderate-increasing 22 (6.7) 1.57 (0.97−2.54) 1.57 (0.97−2.54) Elevated-decreasing 7 (5.4) 1.17 (0.53−2.56) 1.15 (0.51−2.59) Elevated-stable 8(7.9) 1.81 (0.86−3.80) 2.13 (1.002−4.53) Note. *FBG, Fasting blood glucose; HR, Hazard ratio; CI, Confidence interval; BMI, Body mass index; HDL, high-density lipoprotein; Hs-CRP, hypersensitive C-reactive protein. Adjustments were made for age, smoking status, drinking status, education level, physical activity, history of hypertension and hyperlipidemia, BMI, HDL-cholesterol, Uric acid, and Hs-CRP. Table 4. Subgroup analysis by sex
-
In this longitudinal study, four FBG trajectory patterns were identified in a large cohort of patients with diabetes: low, moderate, elevated-decreasing, and elevated-stable. These patterns were strongly associated with the subsequent risk of cerebral infarction. Participants with consistently high FBG levels (elevated-stable pattern) exhibited nearly double the risk of CI compared with those maintaining FBG levels around 7.0 mmol/L (low-stable pattern). Conversely, participants with initially high FBG levels that ubsequently decreased (elevated-increasing pattern) showed no significantly greater risk of CI than those with consistently high FBG levels (elevated-stable pattern).
The elevated-stable and moderate-stable patterns were associated with a higher risk of cerebral infarction during a seven-year follow-up compared with the low-stable pattern, even after adjustment for single FBG measurements. These findings suggest that sustained exposure to high glycemic levels may play a critical role in the development of ischemic stroke in patients with diabetes. The beneficial effects of maintaining a low FBG level on cerebral infarction outcomes align with previous research[21]. Hemoglobin A1c (HbA1c) levels, which reflect average blood glucose over the preceding 8–12 weeks, have been widely used to assess glycemic control[22-24]. Selvin et al. reported a robust association between HbA1c levels and risk of incident stroke over long follow-up[23], indicating that both short- and long-term blood glycemic control are significantly associated with cerebral infarction risk.
Some participants exhibited higher FBG levels at the onset of the study, which gradually decreased during the follow-up, indicating a marked improvement in glycemic control. This subgroup of participants demonstrated a relatively lower risk of cerebral infarction compared to those with persistently elevated FBG levels. Despite a diagnosis of diabetes, the risk of cerebral infarction may be substantially reduced when FBG levels are well controlled. These findings are consistent with a previous study examining the association between FBG trajectory and myocardial infarction (MI). The incidence of the outcome in “Elevated-decreasing” group is relatively lower than that in other groups[25]. Elevated FBG levels can damage vascular endothelium through multiple pathways, including arginase-1[26], and CXCR7[27], promoting atherosclerosis (AS), a common pathogenesis of ischemic CVD such as MI and cerebral infarction[28,29]. Antonio et al. demonstrated that oscillations in glucose levels have a more specific triggering effect than constant high glucose levels on plasma 3-nitrotyrosine and 24-h urinary excretion rates of free 8-iso prostaglandin F2 (PGF2), two well-recognized markers of oxidative stress[30]. Another study found that endothelial cells exposed to intermittent high glucose-stimulated greater production of reactive oxygen species overproduction with protein kinase C (PKC)-dependent activation of the NAD(P)H oxidase pathway, leading to the development of vascular injury in diabetes[7]. These findings support the hypothesis that effective glycemic control may serve as a protective strategy against ischemic CVD.
The association between FBG trajectories and cerebral infarction was significant in men but not in women. This disparity may be attributed to the limited number of women in the study cohort. Additionally, several studies have reported sex-related differences in the pathophysiology of ischemic cardiovascular diseases[31,32]. Yao et al. found that Chinese women with diabetes are less susceptible to coronary heart disease and stroke than men[33]. Therefore, sex-specific differences in this association warrant further investigation in future studies.
The strengths of this study include its large population-based cohort and long-term follow-up period. Repeated assessments of FBG levels were conducted, and changes in FBG levels were used to estimate the risk of cerebral infarction. However, several limitations must be acknowledged. First, HbA1c levels, a more robust indicator of glycemic control, were not available in the Kailuan study. Second, the study population was primarily drawn from the Kailuan community, which may limit generalizability of the identified trajectory patterns to other populations. The predominance of male participants and the specific age range of the cohort may further restrict generalizability to female individuals and older populations. Future studies with a more balanced sex distribution are warranted to explore the potential sex-specific effects and enhance generalizability. Third, detailed data on medication types (e.g., insulin, oral agents, and GLP-1 agonists) were unavailable in the Kailuan dataset. Fourth, the observational nature of the study precludes causal inferences, necessitating further experimental or genetic studies, such as Mendelian randomization. Fifth, long- and short-term variabilities were not directly compared; future analyses could quantify glucose variability to assess its independent effects. Finally, the study population consisted primarily of male coal miners, resulting in a gender imbalance. Further studies are required to validate these findings.
-
Four distinct FBG trajectories were identified, each associated with varying risks of cerebral infarction in patients with diabetes. Effective control of FBG levels was found to reduce the risk of cerebral infarction. These findings underscore the importance of long-term glycemic control in mitigating cerebral infarction risk and highlight the need for timely interventions to optimize FBG levels and decrease disease risk.
Association of Longitudinal Change in Fasting Blood Glucose with Risk of Cerebral Infarction in a Patients with Diabetes
doi: 10.3967/bes2025.052
- Received Date: 2024-11-28
- Accepted Date: 2025-04-09
-
Key words:
- Diabetes /
- Cerebral infarction /
- Fasting blood glucose trajectory /
- Glycemic control
Abstract:
&These authors contributed equally to this work.
| Citation: | Taiyang Luo, Xuan Deng, Xueyu Chen, Yuhe Liu, Shuohua Chen, Haoran Sun, Ziwei Yin, Shouling Wu, Yong Zhou, Xingdong Zheng. Association of Longitudinal Change in Fasting Blood Glucose with Risk of Cerebral Infarction in a Patients with Diabetes[J]. Biomedical and Environmental Sciences. doi: 10.3967/bes2025.052

|

 Quick Links
 DownLoad: