


-
Rotavirus gastroenteritis (RVGE) is caused by rotavirus (RV) infection and is the leading cause of severe dehydrating gastroenteritis among infants and young children globally[1]. RV is mainly transmitted through the fecal-oral route and is characterized by vomiting, diarrhea, and fever[2]. Before the introduction of the RV vaccine in 2006, RVGE was estimated to cause over 500 000 deaths and 2 million hospitalizations of children worldwide annually[3]. Between 2007 and 2012, G1P[8], G2P[4], G3P[8], G4P[8], G9P[8], and G12P[8] strains accounted for more than 70% of global RV genotypes[4].
In China, prior to the launch of the RV vaccine in 2000, RVGE accounted for 28% and 46% of diarrhea-related outpatient and inpatient cases in children aged <5 years[5]. Owing to improvements in socioeconomic status and hygiene, along with the introduction of RV vaccines, RVGE mortality in 2012 was 70% lower than that in 2003[6], and the proportion of RVGE among all infectious diarrhea cases declined[7]. However, National Notifiable Diseases Reporting System (NNDRS) data have shown an upward trend in RVGE in recent years[8]. A meta-analysis found that the overall prevalence of RVGE in stool samples obtained in surveillance settings in China from 2019 to 2023 was 19%, with G9P[8] being the predominant genotype in G-P combinations, accounting for 78% of RV infections, followed by G8P[8] (31%) and G3P[8] (8%) genotypes[9].
By 2022, 121 countries and regions will include RV vaccines in their immunization programs, with a final dose coverage of 51% by 2023[10]. As the earliest World Health Organization-prequalified RV vaccine (in 2008), the oral pentavalent reassortant rotavirus attenuated live vaccine (RotaTeq, RV5) has shown good safety with vaccine effectiveness (VE) levels of 90% and 45% among children under five years in low and high mortality countries, respectively[3]. RV5 was licensed in China in 2018[1], and coverage among children aged <5 years was approximately 20%–40% for this non-program (family paid) vaccine[11,12]. According to immunization information systems in the study areas, from 2021 to 2023, the average rotavirus vaccination rates were 32% in Guangdong, 42% in Wuhan (Hubei), and 30% in Chaoyang (Beijing).
Previous real-world studies in China found that the RV5 VE against RVGE in children aged < 5 years varied between 30% and 90%[13-15]. These studies generally focused on a single region and had modest sample sizes. Medical health big data platforms such as hospital information systems (HISs) and electronic health records (EHRs) are frequently used in real-world studies[16-18]. Medical big data platforms can enhance the representativeness and generalizability of research findings by providing access to well-characterized populations across diverse regions and tiers of healthcare institutions[19]. Unlike previous single-region studies, research based on healthcare big data platforms requires the use of statistical methods, such as propensity score matching (PSM), to control for bias and confounding introduced by multi-source data[20]. Furthermore, Test-negative design (TND) case-control studies[21] that can mitigate biases have been widely used to evaluate the VEs of influenza[22], coronavirus Disease 2019 (COVID-19)[23], and RV vaccines[13,24]. This methodology effectively mitigates confounding and bias from differences in healthcare-seeking behaviors/access and differences in vaccination and community-level disease risk between cases and controls[25].
We obtained data from HISs and EHRs in three areas of China and used a PSM-TND study to determine more representative and less biased VE estimates than those previously available in China. Herein, we report the methods and results of our study.
-
This study was conducted in one region of northern China (Chaoyang District, Beijing) and two regions of southern China (Guangdong Province and Wuhan City, Hubei Province). Three areas were selected for data availability analysis. We obtained demographic, clinical diagnostic, and pathogen detection information from children aged < 5 years who were brought to medical attention for acute gastroenteritis (AGE) between January 1, 2020, and April 30, 2024, and were tested for RV. Data were sourced from the multipoint trigger platform of Guangdong (a big data platform for data sharing among medical institutions across the province), supplemented with additional inpatient data from Guangdong Maternal and Children’s Hospital, the HIS of one hospital in Chaoyang District, Beijing, and two hospitals in Wuhan (all 29 participating hospitals were tertiary hospitals). RV vaccination status was obtained through the respective immunization program information systems by matching unique national identification (ID) numbers. The test-negative design case-control study is an efficient and accurate method for evaluating VE by comparing the vaccination ratio between RV-positive and RV-negative AGE subjects. PSM is a method used to calculate the probability of each individual receiving a certain treatment (or outcome) and then match the individuals in the treatment group (case group) and the control group based on this probability, making the two groups comparable in key variables. Our PSM-TND study used a 1:2 PSM of cases to controls to estimate VE against RV infection based on EHR data and vaccination information. Propensity scores were based on the enrollment age, visit month, and province.
-
Inclusion criteria for enrollment were: (1) age at visit between 8 weeks (two weeks after the earliest age for receiving the first dose of RV5) to 4 years; (2) with a diagnosis recorded in the EHR as one of the following (diagnostic name[ICD10 code]): other bacterial intestinal infections [A04](except antibiotic-associated colitis [A04.700x002]), viral and other specified intestinal infections [A08], bacterial intestinal infections (other and unspecified) [A09.000], infectious causes of gastroenteritis and colitis (other and unspecified) [A09.000x001], infectious gastroenteritis [A09.001], infectious colitis [A09.002], infectious diarrhea [A09.004], acute infectious gastroenteritis [A09.007]; and (3) tested for RV with polymerase chain reaction (PCR) nucleic acid testing or enzyme-linked immunosorbent assay (ELISA) antigen testing. Potential subjects whose rotavirus vaccination information was unclear after matching, who were out of the inclusion age range, who received their most recent dose less than 14 days before the AGE visit, or who were vaccinated out of compliance with the immunization schedule (see below) were excluded. For children with more than one AGE medical visit during the study period, we used the first visit for analysis.
-
The vaccination schedule included the 1st dose at 6-12 weeks of age, with an interval of 4-10 weeks between each dose, and the third dose before 32 weeks of age. We defined vaccination status as: 1-dose vaccinated if the child received a single dose between 6 weeks and 12 weeks of age and ≥14 days before the visit date; 2-dose vaccinated if the child received two doses, with the 2nd dose between 10 weeks and 22 weeks of age and ≥14 days before the visit date; 3-dose vaccinated if the child received three doses with the third dose between 14 weeks and 32 weeks of age and ≥14 days before the visit date.
We combined 1- and 2-dose vaccinated subjects because the number of children receiving fewer than three doses was relatively small. We calculated propensity score-matched (1:2 ratio of cases to controls) 1-2 dose and 3-dose RV5 VE against any medically attended RVGE infection (inpatient or outpatient), outpatient-only medically attended RVGE, and RVGE hospitalization.
-
We estimated VE in 3-dose recipients by time since the third dose (< 5 months, ≥ 5 months – < 1 year, and ≥ 1 year between the last dose date and the visit date). To reduce the influence of vaccination age on VE (for example, VE in children who are younger when vaccinated may be lower because their immune system is less mature[26]), we calculated VE by time since the third dose separately for children who received the third dose before turning five months of age and children who received their third dose at five months of age or older.
-
Sensitivity analyses stratified by province were conducted using PSM for visit month and age.
-
The target sample size was calculated using formulas (1)–(7), in which p0 and p1 represent the vaccination rates of the control and case groups, respectively. The target sample size was determined based on the maximum sample size required, assuming a VE of 50% as the predefined parameter for calculation, ensuring sufficient statistical power under the most conservative efficacy scenario[27,28]. Conservatively assuming a 1:4 case:control match to compensate for exclusion caused by issues such as missing data (estimated at 20%), and using α = 0.05, μα = 1.96, β = 0.20, μβ =0.84, in the formula below, our minimum target sample size was 3 130. The final sample size was based on the number of subjects available on the data platforms during the study period and was greater than the minimum target sample size. The maximum ratio that reached equilibrium after PSM matching was 1:2, which was lower than the initial sample size calculation setting of 1:4 and represents a conservative match ratio.
$$ n=\frac{{\left[{\mu }_{\alpha }\sqrt{2pq}+{{\mu }}_{{\beta }}\sqrt{p1q1+p0q0}\right]}^{2}}{{\left(p1-p0\right)}^{2}} $$ (1) $$ q0=1-p0 $$ (2) $$ p1=p0\times OR/\left[1+p0\times \left(OR-1\right)\right] $$ (3) $$ q1=1-p1 $$ (4) $$ p=\left(p1 +p0\right)/2 $$ (5) $$ q=1-p $$ (6) $$ VE=\left(1-OR\right)\times 100 {\text{%}} $$ (7) -
Variables with non-normal distributions were reported as medians and interquartile ranges (IQRs), while the enumerated data were presented as numbers and percentages. Bivariate analyses were performed to assess the differences between cases and controls, and to identify potential confounders using the χ2 test or Fisher’s exact test. Patients in healthcare settings, who sought care for AGE symptoms, were categorized into case/control groups based on positive/negative rotavirus test results. We compared the RV vaccination rates between the two groups to evaluate the association between vaccination and RVGE[25]. To reduce the confounding bias caused by the separate sources of research subjects (different medical institutions in different regions), we used propensity score caliper matching to calculate a less biased VE. We divided the total population into an outpatient subgroup, an inpatient subgroup, and subgroup who received 0 or 3 doses (further divided into subgroups who received the 3rd dose before turning 5 months of age and after turning 5 months of age). PSM was conducted separately for the total population and the subgroups. We used logistic regression to calculate the conditional probability of the study subjects being assigned to the case group or control group under potential confounding factors (age and visit month as continuous variables; province as a categorical variable (Guangdong, Beijing, Hubei); and an interaction term between age and province) and then balanced the distribution of these factors between the two groups within the total population and each subgroup[29]. We used a caliper value of 0.2 standard mean difference (SMD) between the two groups before and after matching, as calculated based on the mean and standard deviation (SD) of the two groups. SMD less than 0.1 is generally considered a balanced distribution. All tests were two-tailed, and statistical significance was set at P < 0.05.
Microsoft Office Excel 2019 (Redmond, WA, USA) was used to clean the data, and R statistics (4.3.1) was used to perform statistical analysis. PSM was performed using the MatchIt software package.
-
The study was approved by the Chinese Center for Disease Control and Prevention Institutional Review Board [(2024) No. 202406].
-
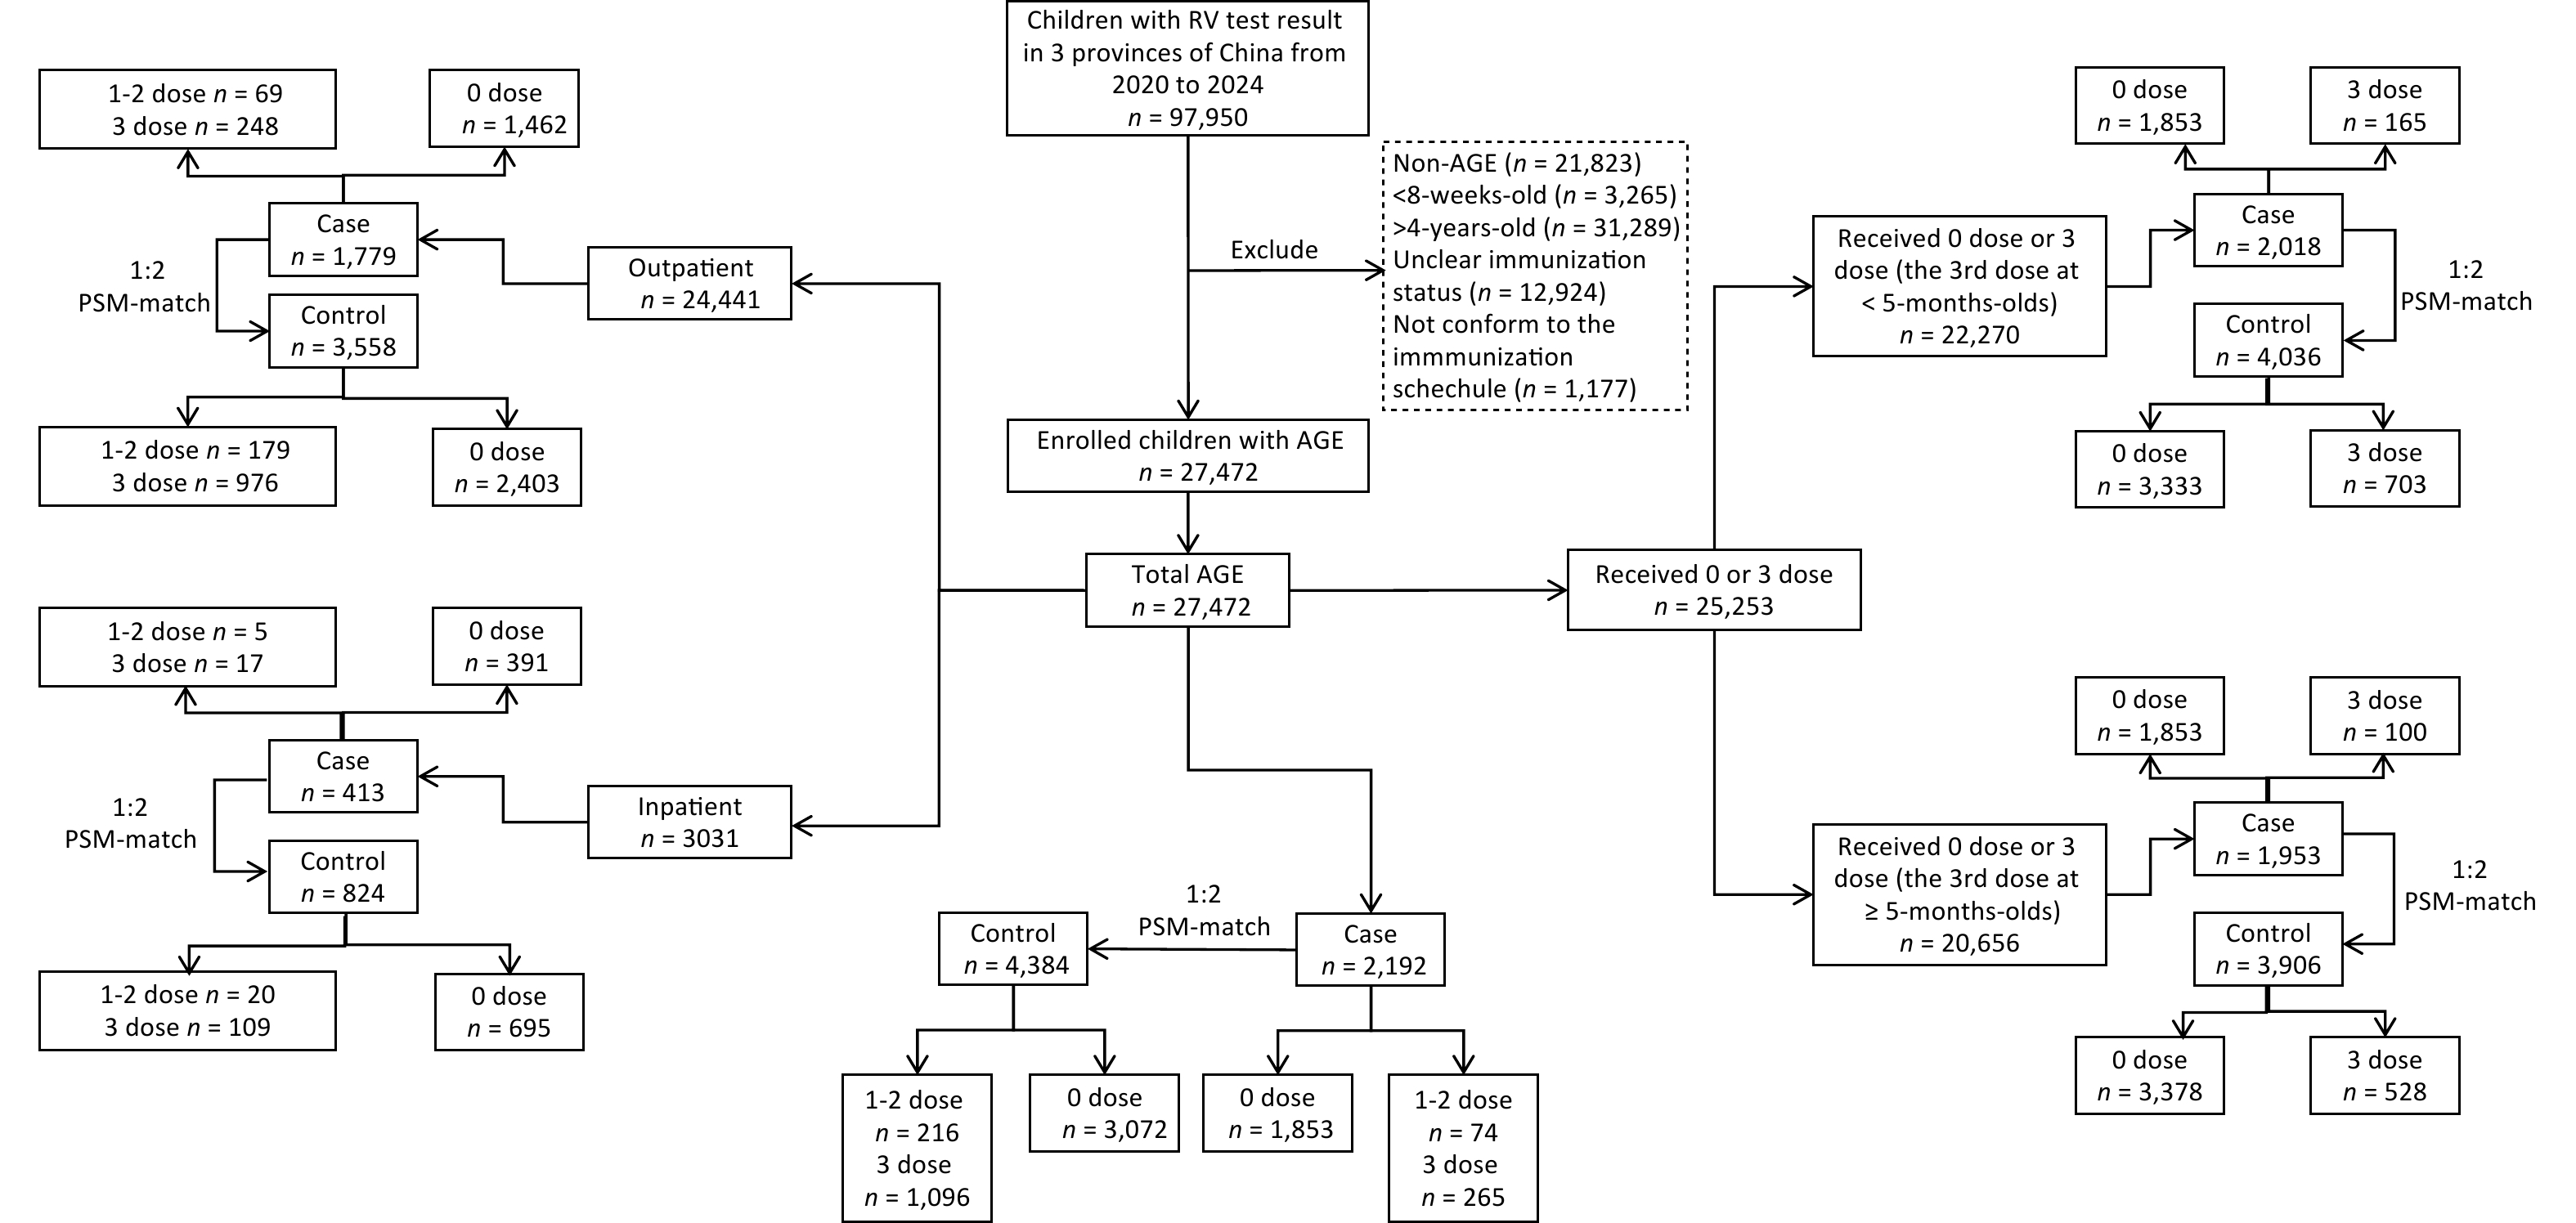
A total of 97,950 patients with AGE were tested for RV during the study period. After excluding 70,478 potential subjects who did not meet the enrollment criteria, data for 27 472 children aged 8 weeks to 4 years at the visit date were included in the analytic dataset. In the 1:2 PSM-matches, 2,192 RV-positive cases were matched to 4,384 RV-negative controls; 1,779 outpatient cases were matched to 3,558 outpatient controls, and 413 inpatient cases were matched to 824 inpatient controls (one case could not be matched with two controls). Among those who received 0 or 3 doses, 2,108 cases were matched to 4,036 controls (for children who received the third dose before turning five months old), and 1,953 cases were matched to 3,906 controls (for children who received the third dose at five months of age or older) (Figure 1).
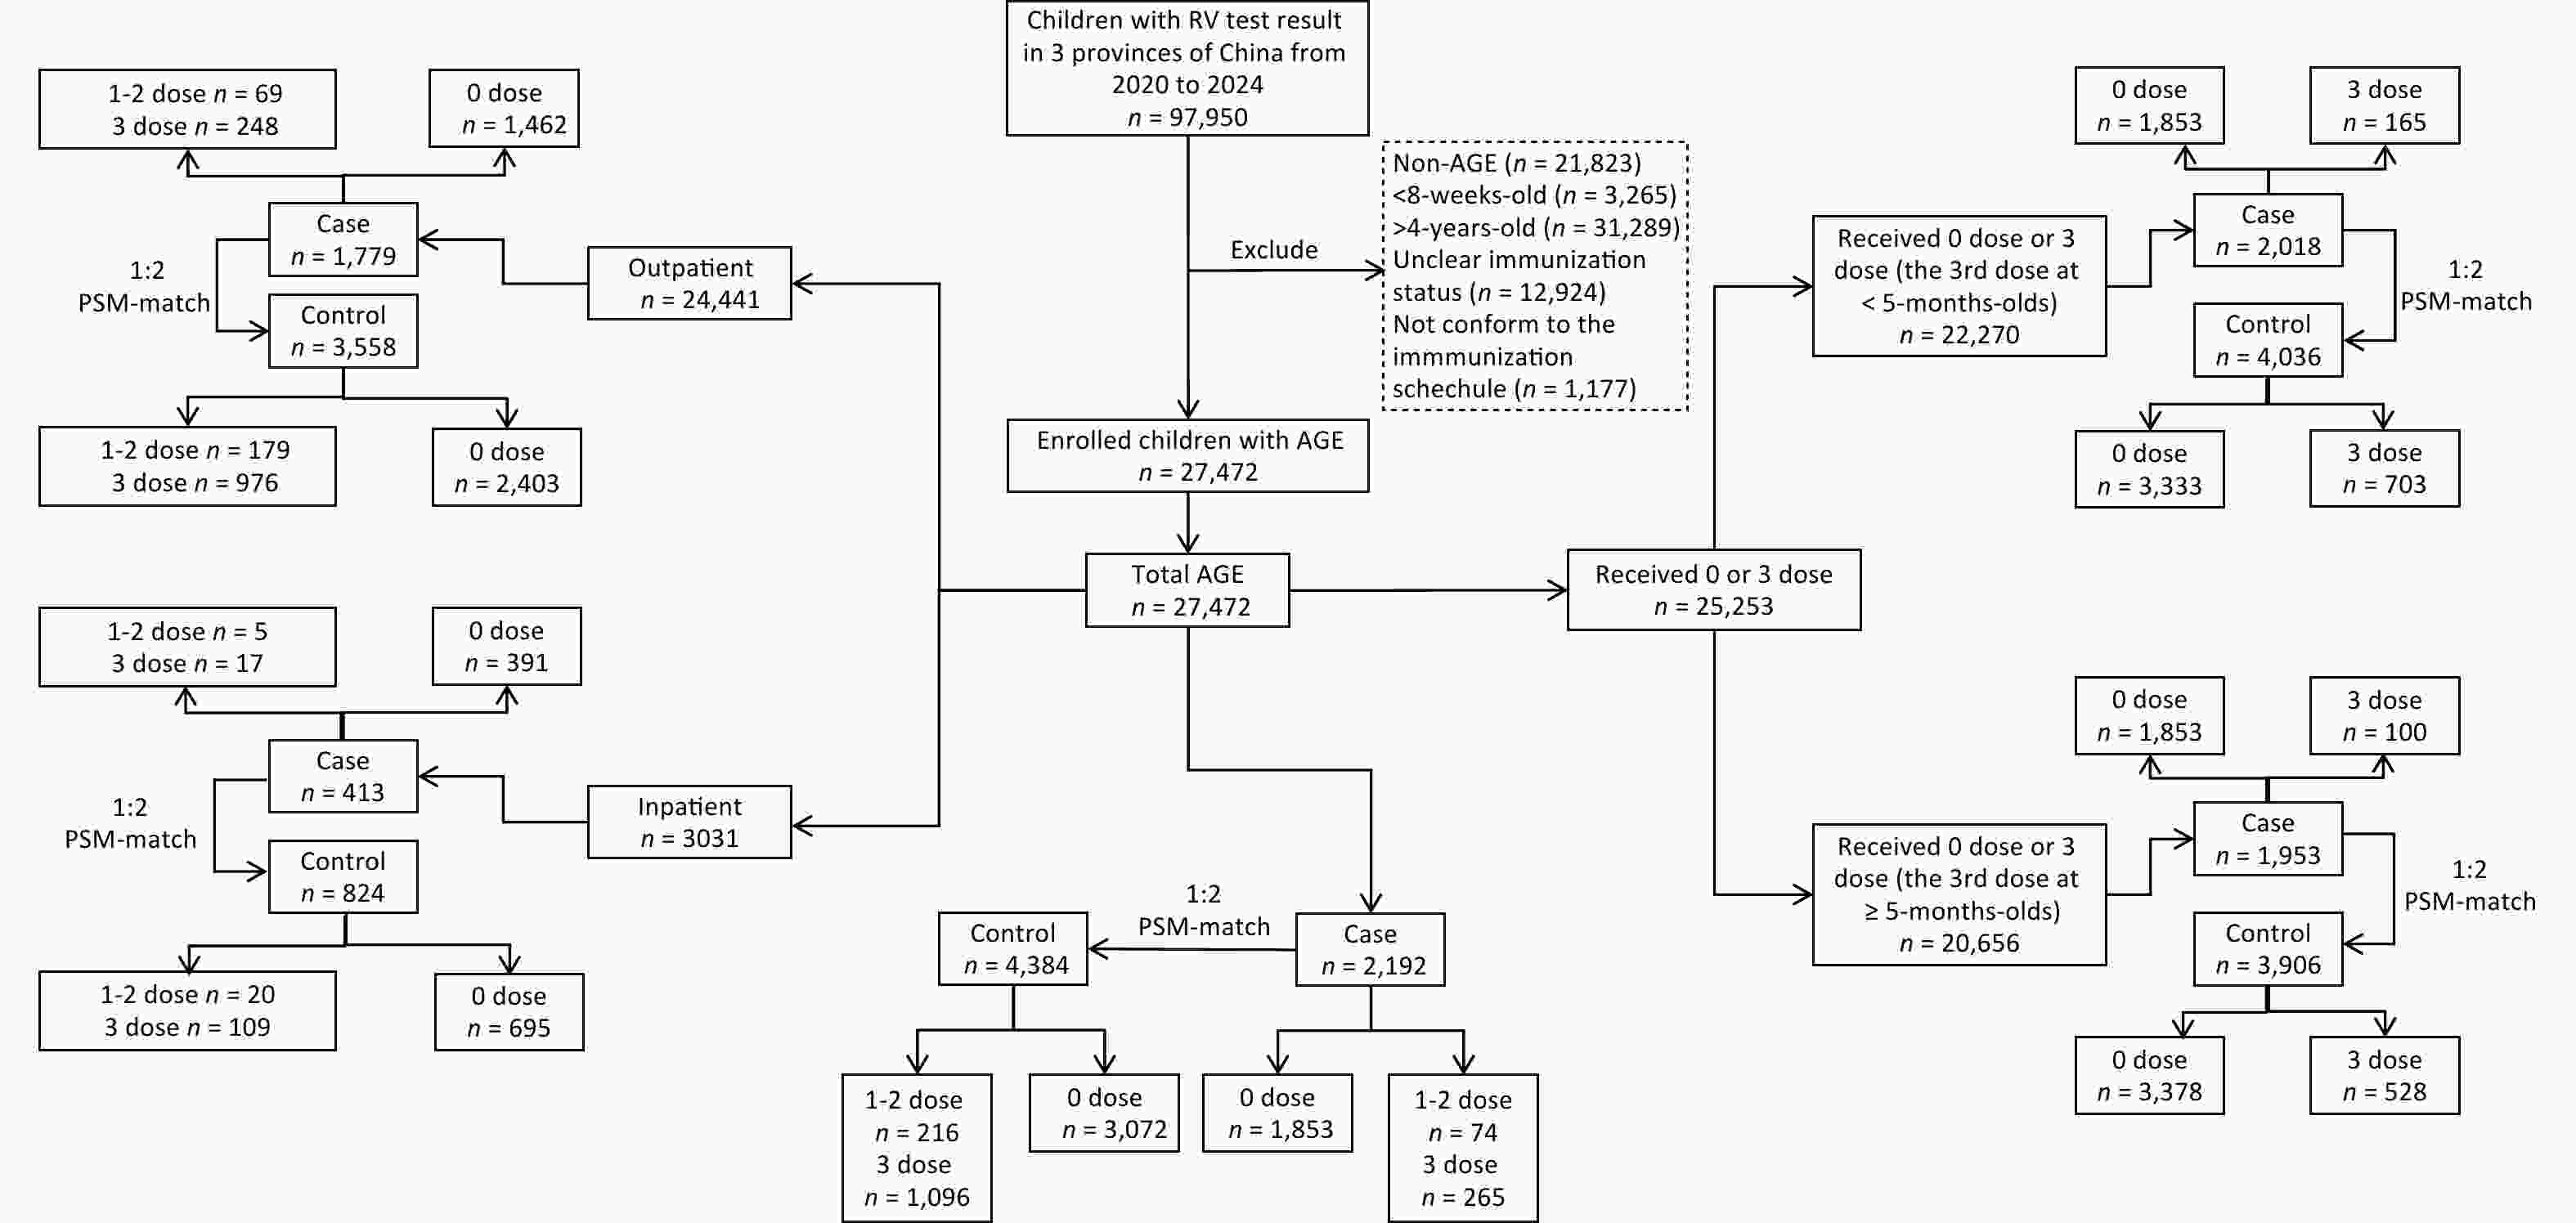
Figure 1. Study flow chart. Shown are the inclusions and exclusions of subjects, the propensity-score matchings between cases and controls, and the vaccination statuses of cases and controls.
Among the 27,472 subjects in our analytic data set, 59.01% (16,211) were male; the median (IQR) age was 1.13 (0.61, 2.14) years; 7.98% (2 192) were rotavirus positive; 4.11% (1 129) received 1 vaccine dose, 3.97% (1 090) received 2 doses, and 27.59% (7,580) received 3 doses. The median (IQR) age was 0.9 (1.7, 3.0) years for outpatients versus 0.6 (1.1, 2.0) years for inpatients. After excluding cases without corresponding symptom information, the median (IQR) diarrhea duration was 4 (2, 8) days (outpatients) vs. 5 (3, 7) days (inpatients), the median (IQR) maximum daily diarrheal episodes was 5 (4, 8) episodes (outpatients) vs. 7 (5, 10) episodes (inpatients), the median (IQR) vomiting duration was 1 (1, 2) days (outpatients) vs. 2 (1, 3) days (inpatients), the median (IQR) maximum daily vomiting episodeswas 3 (2, 4) episodes (outpatients) vs. 2 (2, 4) episodes (inpatients). Statistically significant differences were observed in the province, age, patient source (inpatient/outpatient), visit month, vaccination dose, and time since the third dose between the case and control groups (Table 1).
Variable Cases N (%) Controls N (%) χ2 P value Province Guangdong 155 (7.07) 2,555 (10.11) 20.91 < 0.01 Beijing 627 (27.62) 6,982 (27.62) Hubei 1,410 (64.32) 15,743 (62.27) Age (t=-24.62, P< 0.001) 8 weeks - < 1 year-old 487 (22.22) 11,771 (46.56) 483.81 < 0.01 1 year - ≤4 years-old 1,705 (77.78) 13,509 (53.44) Sex Male 1,323 (60.36) 14,888 (58.89) 1.79 0.18 Female 869 (39.64) 10,392 (41.11) In-patient/out-patient In-patient 413 (18.84) 2,618 (10.36) 147.96 < 0.01 Out-patient 1,779 (81.16) 22,662 (89.64) Visit month Jan 227 (10.36) 1,618 (6.40) 1,355.84 < 0.01 Feb 296 (13.50) 1,611 (6.37) Mar 574 (26.19) 2,225 (8.80) Apr 374 (17.06) 2,342 (9.26) May 157 (7.16) 2,178 (8.62) Jun 94 (4.29) 2,480 (9.81) Jul 82 (3.74) 2,631 (10.41) Aug 84 (3.83) 2,439 (9.65) Sep 79 (3.60) 2,298 (9.09) Oct 67 (3.06) 2,253 (8.91) Nov 77 (3.51) 1,772 (7.01) Dec 81 (3.70) 1,433 (5.67) Doses administered 0 1,853 (84.53) 15,820 (62.58) 424.13 < 0.01 1 34 (1.55) 1,095 (4.33) 2 40 (1.82) 1,050 (4.15) 3 265 (12.09) 7,315 (28.94) Time since the third dose < 5 months 61 (23.02) 2,357 (32.22) 17.62 < 0.01 5 months - < 1 year 83 (31.32) 2,479 (33.89) ≥1 year 121 (45.66) 2,479 (33.89) Note. Jan, January; Feb, February; Mar, March; Apr, April; May, May; Jun, June; Jul, July; Aug, August; Sep, September; Oct, October; Nov, November; Dec, December. Table 1. Characteristics of children with AGE, prior to propensity score matching
-
After 1:2 PSM based on enrollment age, visit month, province, and age*province, there were no statistically significant differences in enrollment age, visit month, and province, except among children who received the third dose before turning five months old, with SMDs all below 0.1 (Table 2).
Variable Before matching After matching Cases
Mean (SD)Controls
Mean (SD)P SMD Cases
Mean (SD)Controls
Mean (SD)P SMD Total group N 2,192 25,280 2,192 4,384 Age 2.12 (1.28) 1.47 (1.17) < 0.01 0.53 2.12 (1.28) 2.08 (1.36) 0.27 0.03 Visit month 4.49 (2.96) 6.51 (3.18) < 0.01 0.66 4.49 (2.96) 4.41 (2.87) 0.32 0.03 Province < 0.01 0.11 0.07 0.06 Guangdong 155 (7.07) 2,555 (10.11) 155 (7.07) 266 (6.07) Beijing 627 (28.60) 6,982 (27.62) 627 (28.60) 1,182 (26.96) Hubei 1,410 (64.32) 15,743 (62.27) 1,410 (64.32) 2,936 (66.97) 0 and 3 dose group Third dose at < 5 months of age N 2,018 20,252 2,018 4,036 Age 2.18 (1.27) 1.57 (1.21) < 0.01 0.49 2.18 (1.27) 2.15 (1.36) 0.40 0.02 Visit month 4.37 (2.91) 6.48 (3.19) < 0.01 0.69 4.37 (2.91) 4.34 (2.87) 0.70 0.01 Province < 0.01 0.12 0.49 0.03 Guangdong 131 (6.49) 1,981 (9.78) 131 (6.49) 235 (5.82) Beijing 583 (28.89) 5,765 (28.47) 583 (28.89) 1,145 (28.37) Hubei 1,304 (64.62) 12,506 (61.75) 1,304 (64.62) 2,656 (65.81) Third dose at ≥5 months of age N 1,953 18,703 1,953 3,906 Age 2.21 (1.27) 1.62 (1.24) < 0.01 0.47 2.21 (1.27) 2.18 (1.35) 0.38 0.02 Visit
month4.31 (2.85) 6.45 (3.18) < 0.01 0.71 4.31 (2.85) 4.27 (2.81) 0.53 0.02 Province < 0.01 0.14 0.04 0.07 Guangdong 124 (6.35) 1,885 (10.08) 124 (6.35) 206 (5.27) Beijing 560 (28.67) 5,194 (27.77) 560 (28.67) 1,044 (26.73) Hubei 1,269 (64.98) 11,624 (62.15) 1,269 (64.98) 2,656 (68.00) Inpatient group N 413 2,618 413 824 Age 2.57 (1.27) 1.86 (1.24) < 0.01 0.57 2.57 (1.27) 2.47 (1.28) 0.19 0.08 Visit month 3.43 (1.97) 6.25 (3.30) < 0.01 1.04 3.43 (1.97) 3.37 (1.99) 0.63 0.03 Province < 0.01 0.23 0.41 0.08 Guangdong 35 (8.47) 396 (15.13) 35 (8.47) 53 (6.42) Beijing 2 (0.48) 34 (1.30) 2 (0.48) 4 (0.48) Hubei 376 (91.04) 2,188 (83.58) 376 (91.04) 769 (93.10) Out-patient group N 1,779 22,662 1,779 3,558 Age 2.01 (1.25) 1.42 (1.15) < 0.01 0.49 2.01 (1.25) 2.00 (1.36) 0.79 0.01 Visit month 4.73 (3.10) 6.54 (3.17) < 0.01 0.58 4.73 (3.10) 4.70 (3.01) 0.77 0.01 Province < 0.01 0.13 0.02 0.08 Guangdong 120 (6.75) 2,159 (9.53) 120 (6.75) 183 (5.14) Beijing 625 (35.13) 6,948 (30.66) 625 (35.13) 1,196 (33.61) Hubei 1,034 (58.12) 13,555 (59.81) 1,034 (58.12) 2,179 (61.24) Note. * PSM was based on the enrollment age and visit month. SD, standard deviation; SMD, standard mean difference. Table 2. Characteristics of cases (RV positive) and controls (RV negative) before and after propensity matching*
After PSM for enrollment age, visit month, province, and age*province (interaction term), conditional logistic regression showed that the 3-dose VE (95% CI) point estimate of 67.2% (60.3%–72.9%) was higher than the 1-2 dose VE (95% CI) point estimate of 57.6 (39.8%–70.2%); however, the partially overlapping CIs indicated no statistically significant difference between these two estimates (Table 3). Sensitivity analyses stratified by province yielded consistent results (Supplementary Table S2). The average interval between the 3rd dose and AGE diagnosis was 330 days for inpatients and 398 days for outpatients. Among children who received a third dose, VE among children who received a third dose before turning five months of age decreased by time since the third dose and remained > 61% ≥ 1 year after the third dose, although the overlapping CIs suggest that the difference was not statistically significant (Table 4).
Cases n (%) Controls n (%) Propensity score-matched
OR (95%CI)Propensity score-matched
VE (95%CI)Any medically attended RVGE infection Vaccination dose n =2,192 n = 4,384 0 doses 1,853 (82.91%) 2,978 (66.62%) 1 or 2 dose 39 (1.74%) 109 (2.44%) 0.42 (0.30−0.60) 57.6 (39.8−70.2) 3 doses 298 (13.33%) 1,258 (28.14%) 0.33 (0.27−0.40) 67.2 (60.3−72.9) In-patient group Vaccination doses n=413 n=824 0 doses 391 (94.67%) 695 (84.34%) 1 or 2 doses 5 (1.21%) 20 (2.43%) 0.37 (0.09−1.47) 62.8 (−47.1−90.6) 3 doses 17 (4.12%) 109 (13.23%) 0.31 (0.16−0.59) 69.4 (41.3−84.0) Out-patient group Vaccination dose n = 1,779 n = 3,558 0 doses 1,462 (82.18%) 2,403 (67.54%) 1 or 2 doses 69 (3.88%) 179 (5.03%) 0.43 (0.30−0.61) 57.5 (38.9−70.5) 3 doses 248 (13.94%) 976 (27.43%) 0.35 (0.29−0.43) 64.5 (56.6−71.0) Note. OR, odds ratio; VE, vaccine effectiveness. Table 3. Vaccine effectiveness of RV5 against RVGE stratified by clinical outcomes.
Cases n (%) Controls n (%) Propensity score-matched
OR (95%CI)Propensity score-matched
VE (95%CI)Received the 3rd dose at < 5−months−old group Time since the 3rd dose n =2,018 n =4,036 0 doses 1,853 (91.82%) 3,333 (82.58%) < 5 months 39 (1.93%) 191 (4.73%) 0.30 (0.19−0.46) 70.4 (53.9−81.1) 5 months − < 1 year 53 (2.63%) 208 (5.15%) 0.35 (0.24−0.50) 65.4 (49.8−76.1) ≥1 year 73 (3.62%) 304 (7.53%) 0.37 (0.27−0.51) 63.0 (49.1−73.0) Received the 3rd dose at ≥5−months−old group Time since the 3rd dose n =1,953 n =3,906 0 doses 1,853 (94.88%) 3,378 (86.48%) < 5 months 22 (1.13%) 124 (3.17%) 0.31 (0.17−0.54) 69.3 (45.9−82.6) 5 months − < 1 year 30 (1.54%) 166 (4.25%) 0.25 (0.15−0.41) 75.1 (58.7−85.0) ≥1 year 48 (2.46%) 238 (6.09%) 0.38 (0.26−0.56) 61.7 (44.2−73.8) Note. OR, odds ratio; VE, vaccine effectiveness. Table 4. Vaccine effectiveness of 3 doses of RV5 against RVGE stratified by the time since the 3rd dose.
-
There were significant differences in enrollment age, visit month, and province between the case and control groups before PSM. After 1:2 PSM for enrollment age, visit month, province, and age*province, except among outpatients, all SMDs were below 0.1 (Table 2).
After PSM for enrollment age, visit month, province, and age*province, conditional logistic regression showed that the point estimates for VE (95%CI) were higher against hospitalization (1 or 2 doses: 62.8% (-47.1%–90.6%); 3 doses: 69.4% (41.3%–84.0%)) than against outpatient visits [1 or 2 doses: 57.5% (38.9%-70.5%); 3 doses: 64.5% (56.6%–71.0%)], regardless of the number of doses. However, overlapping CIs indicate that these differences were not statistically significant (Table 3).
-
We used a propensity-matched, test-negative-design case-control study to estimate the effectiveness of the pentavalent RV5 among children aged < 5 years using electronic health record data from 29 hospitals in three provinces of China. Three doses of RV5 provided greater protection against RVGE (VE = 67.2%) than one or two doses. VE against RV infection at least one year after the third dose remained above 61%. VE was greater for RVGE hospitalization than for medically attended RVGE outpatient visits (VE = 69.4% vs. VE = 64.5%).
The 3-dose PSM-VE of 67.2% found in our study was lower than VE findings in the United States and Europe (94.5% against hospitalization and emergency care) [30] but higher than VE findings from South Asia (48.3% against severe RVGE) [31]. The effectiveness was similar to the efficacy findings from a phase III randomized clinical trial (70%) in China[32], lower than the VE study findings in Shanghai (85%)[13] and Taiwan (93%)[14], and higher than that in a VE study in Guangdong province (64.1%)[15]. There are several possible explanations for this discrepancy. First, RV5 VE is apparently higher in regions with higher vaccination rates[1,33]. RV5 coverage in China was variable, with relatively higher coverage in regions with higher levels of socioeconomic development. Second, studies with small sample sizes may introduce sampling errors and instability in the results[34]. The sample size of our study was significantly larger than that of the other two studies because of access to a population-based data platform. Third, differences in VE may be related to circulating RV genotypes. The most prevalent G-P combination among children aged <5 years changed from G9P[8][35-37] to G8P[8] in Guangdong[15], Beijing[38], and Hubei[39] after 2020. Our study showed that RV5 has a protective effect against the G8P[8] and G9P[8] genotypes observed in the three regions of our study. Since RV5 consists of G1, G2, G3, G4, and P1A[8], there may be cross-protection against the G8 genotype, which is not included in the vaccine[15]. Finally, environmental enteropathy, a relatively common subclinical disease in developing countries, is associated with poverty and unsanitary living environments and can affect the immune response to oral RV vaccines[40].
Consistent with most real-world RV VE studies[41], we found that the 3-dose VE[42] was greater than the 1-2-dose VE. However, these findings are inconsistent. For example, the 3-dose VE in 8-month-old children was shown to be 89%-94% in the United States, which was lower than the 2-dose VE (90%-100%)[43]. Another study found no significant difference between the 3-dose VE (87%) and 2-dose VE (88%) in children aged < 4 years in the United States[44]. Partial RV5 vaccination provides significant protection[3,45], but full vaccination generally has greater protection, as we found.
Although 3-dose VE decreased by time since the third dose in children who received a third dose before turning 5 months old, the VE point estimate remained > 61% ≥ 1 year after the third dose, suggesting that RV5 VE has good persistence in young children. Owing to the late launch of RV5 in China, our study was unable to investigate the duration of protection provided by the vaccine over a longer period. However, a long-term US study demonstrated that strong long-term RV5 protection persisted for seven years after vaccination[46]. The decline in VE might not be entirely caused by declining vaccine-induced antibodies. Some of the decrease could be explained by a higher incidence of natural asymptomatic and mild infections (and thus preferential immune boosting) among unvaccinated controls compared to vaccine recipients, the so-called spurious waning[21] caused by leaky vaccines[47].
Our study found that VE against RVGE hospitalization was greater than VE against medically attended outpatient RVGE, and hospitalized cases demonstrated consistently higher median values than outpatients for diarrhea duration, maximum daily diarrheal episodes, and vomiting duration (not statistically tested due to the limited sample size). This finding is consistent with those of previous studies[48], as RV5 has been shown to be more protective against severe RVGE[3,14,49]. VE against severe RVGE and hospitalization were similar, and both were greater than VE against RV infection[50]. Our study found that RV5 provided better protection against RVGE hospitalizations in patients with more severe symptoms.
Our study has several strengths. By using big data platforms from three geographically distant provinces, we were able to put together a large sample size, enhancing precision and representativeness. Our use of PSM in this TND case-control study likely reduced the influence of confounding factors, making the results more reliable.
Our study had several limitations. Our study was observational; therefore, we reported associations rather than causal ones. The data source for Guangdong is a multi-point trigger platform, including data targeting various age groups, while the data in Beijing and Hubei come from children’s hospitals targeting younger ages. This heterogeneity in hospitals and geographic locations may be associated with differences in healthcare-seeking behaviors and introduce an unknown bias into the results; however, we used PSM to mitigate key potentially confounding variables, including provinces. The hospitals in the study did not conduct RV genotype testing, which precluded genotype analysis. However, based on genotype research in China, we believe that our study estimates the protective effects of RV5 against locally prevalent genotypes. We did not conduct a questionnaire survey and could not obtain parental demographic characteristics (e.g., socioeconomic status and breastfeeding practices) that could serve as potential confounding factors. The small sample size of patients receiving either 1 or 2 doses prevented a meaningful comparison between the two dosing regimens. The limited number of cases with symptom information precluded the evaluation of the VE of RV5 by symptoms owing to insufficient sample size. However, VE against hospitalized RVGE can partially compensate for this deficiency, as inpatient status represents severe RVGE because admitted children must have been ill enough to require hospitalization. We were unable to assess VE in rural China because the RV vaccine coverage is too low in rural areas to conduct a reasonably precise VE study. Urban-rural stratification could not be matched in the analytical dataset because of the systematic de-identification protocols implemented, which removed all personally identifiable information (including residential classification markers derived from ID numbers) during data preprocessing. This limitation of available data makes it impossible to provide separate VE analysis for rural and urban settings or for economically disadvantaged areas where the disease burden may be higher. Current research indicates that the VE of RV vaccines is generally better in urban areas than in rural areas, primarily due to the influence of vaccination coverage, sanitation conditions, and medical resources[3,51]. Such limitations underscore the difficulty of generalizing the results to rural settings and the desirability of conducting VE studies in rural and economically disadvantaged settings. Our study was unable to assess the duration of protection over an extended period because of limited data; therefore, studies with longer follow-up periods are needed. Our study was conducted during the COVID-19 pandemic, and public health and social measures likely decreased the circulation of rotaviruses. However, this reduction in circulation is unlikely to be associated with the RV vaccination status.
We found that RV5 VE in our real-world study was lower than the vaccine efficacy in clinical trials and observational studies in developed countries and domestic regions with high economic levels. The coverage rate in the present study was low (30 %). The influence of coverage in relation to herd immunity on VE has been described in studies in Belgium, Finland, and the United Kingdom (UK)[52]. Studies exploring the impact of coverage on the VE may shed light on this phenomenon. In general, TND studies are the most efficient, with coverages between approximately 20% and 80%, as observed in our study.
Our study showed that the RV5 vaccine has a strong protective effect in Chinese children aged < 5 years, with good persistence up to 1 year after the completion of vaccination. VE was greater during hospitalization than during medically attended RVGE outpatient visits. Full 3-dose series VE was greater than that after partial vaccination. Families and providers should strive to complete the vaccination series as recommended.
Effectiveness of Pentavalent Rotavirus Vaccine — a Propensity Score Matched Test Negative Design Case-Control Study Using Medical Big Data in Three Provinces of China
doi: 10.3967/bes2025.056
- Received Date: 2025-02-13
- Accepted Date: 2025-05-07
-
Key words:
- . Rotavirus vaccine /
- Vaccine effectiveness /
- Test-negative design /
- Propensity score matching
Abstract:
The authors declare that they have no competing financial interests or personal relationships that may have influenced the work reported in this study.
This study was approved by the Chinese Center for Disease Control and Prevention Institutional Review Board [(2024) No. 202406].
| Citation: | Yuexin Xiu, Lin Tang, Fuzhen Wang, Lei Wang, Zhen Li, Jun Liu, Dan Li, Xueyan Li, Yao Yi, Fan Zhang, Lei Yu, Jingfeng Wu, Zundong Yin. Effectiveness of Pentavalent Rotavirus Vaccine — a Propensity Score Matched Test Negative Design Case-Control Study Using Medical Big Data in Three Provinces of China[J]. Biomedical and Environmental Sciences. doi: 10.3967/bes2025.056

|

 Quick Links
 DownLoad: