
-
Fasting blood glucose (FBG) levels are widely used in clinical practice to detect type 2 diabetes mellitus (T2DM) and prediabetes. Recent studies have shown that FBG trajectories are associated with diseases such as hypertension, cardiovascular disease (CVD), and cancer[1-3]. Factors influencing FBG levels are complex and are closely related to family history, lifestyle, and environmental factors. Previous studies mainly focused on lifestyle patterns[4,5]. However, environmental factors, particularly occupational hazards, also affect FBG levels. Several studies have shown that occupational hazards, such as high temperature, noise, and dust exposure, are related to changes in FBG levels[6-9]. However, studies exploring the relationships between occupational risk factors, combined occupational exposure, and changes in FBG levels remain limited.
Several methods have been applied to analyze combinations of occupational hazards, such as environmental risk scores (ERS), Bayesian kernel machine regression (BKMR), and weighted quartile sum regression (WQS)[10,11]. Although BKMR and WQS can solve high-dimensionality and collinearity problems, the incorporation of high-dimensional data with high hardware requirements remains a constantly evolving topic in statistical research. In WQS, converting data into quartiles can result in data loss[10,12]. In comparison, ERS is a simple tool for assessing the risk of exposure to multiple harmful factors and can integrate the disease risk of exposure to multiple pollutant mixtures; this easy-to-operate tool supports new research results and addresses the need for better risk stratification from a single pollutant to a multiple pollutant framework[11,13].
Hence, a cohort of occupational hazards and blood glucose changing trajectories from 2017 to 2022 in steelworkers was built to analyze the relationship between single exposure and a combination of occupational hazard factors and long-term changes in FBG levels. In addition, we evaluated the dose-response relationship between cumulative exposure to occupational hazard factors and the changing trajectory of FBG levels. Our study provides a basis for blood glucose level control and the prevention of adverse outcomes in Chinese male steelworkers.
-
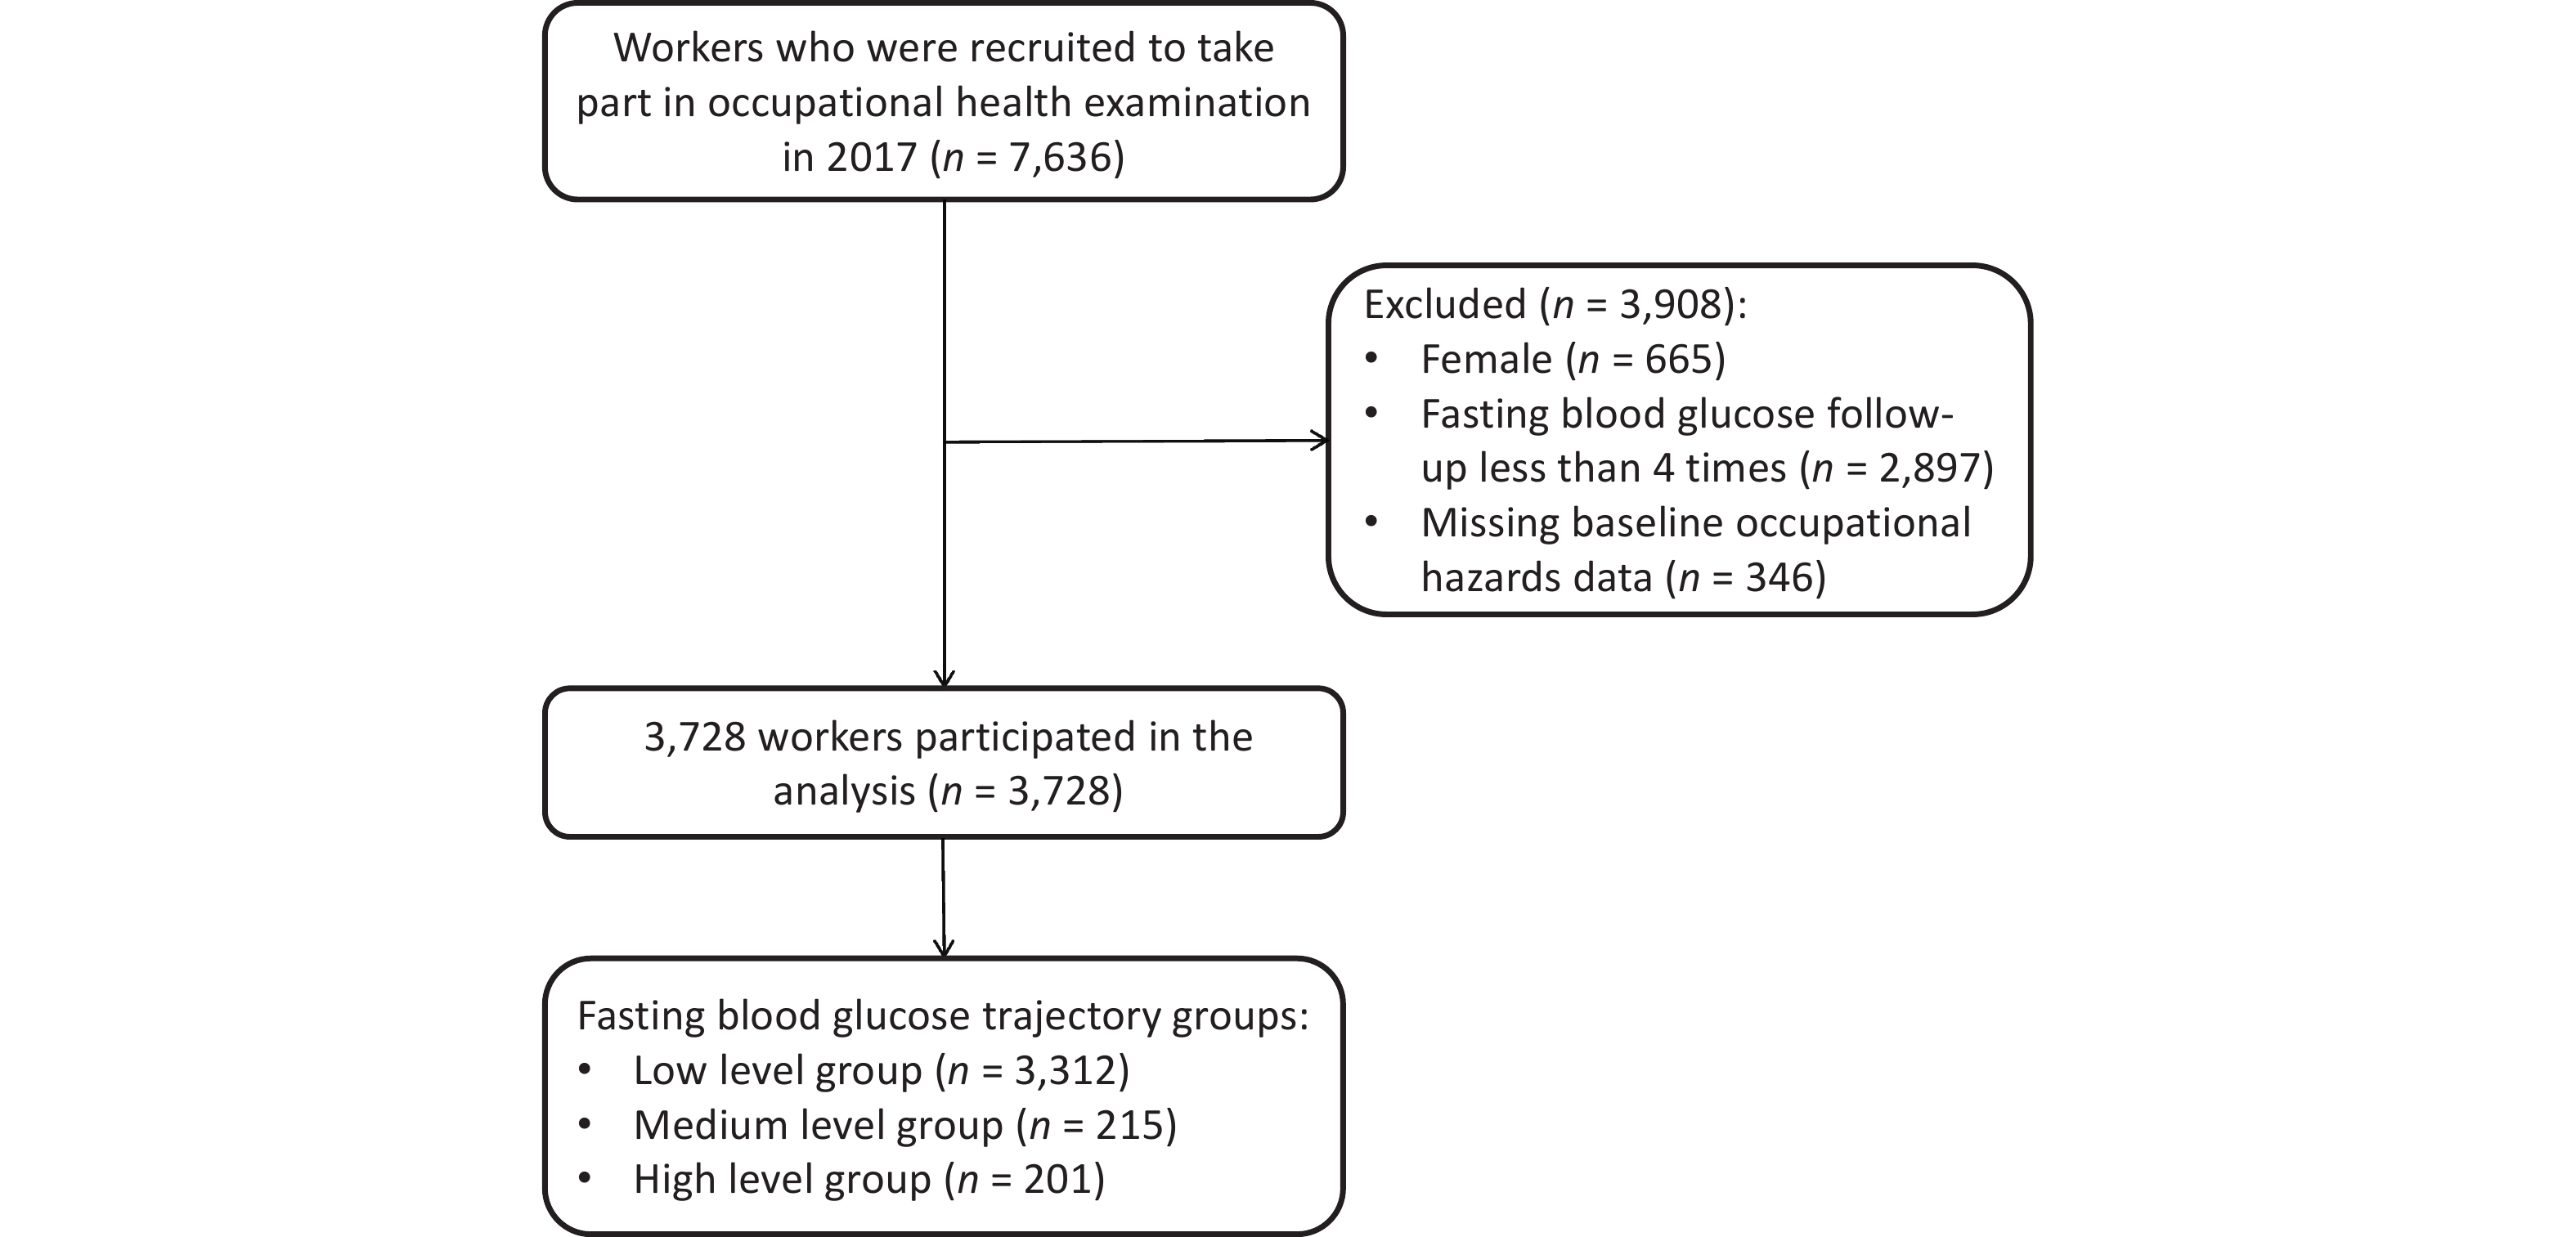
A cohort of occupational hazard factors and blood glucose levels was constructed using data from the Tang Gang Occupational Cohort (TGOC). The TGOC is a registered occupational population health effects longitudinal cohort (ChiCTR2400083306). A total of 7,636 workers aged 18–60 years who were eligible for occupational health examinations were recruited from 13 departments (hot rolling, iron making, cold rolling, hot rolling, and steelmaking) at Tangshan Iron and Steel Group Co., Ltd. from February 2017 to June 2017. The main occupational hazards in factories include high temperatures, noise, dust, and carbon monoxide (CO). The five-wave follow-up was completed between 2018 and 2022. The exclusion criteria were as follows: 1) FBG follow-up of less than four times; 2) missing baseline occupational hazard data; and 3) female sex. Female workers were excluded as they mainly engage in auxiliary work at Tanggang and are rarely exposed to occupational hazard factors. Finally, 3,728 male workers who underwent at least five physical examinations between 2017 and 2022 were included to analyze the relationship between occupational hazard factors and FBG trajectory. Based on the sample size calculation formula for the cohort study, each group (occupational hazard exposure and nonexposure) required 587 participants. Considering a 10% loss to follow-up rate, 646 participants were included in each group. In total, 3,728 workers met the sample size requirements.
-
A unified structured questionnaire was completed by well-trained investigators through a one-on-one survey. The questionnaire collected data on demographic information (age, nationality, monthly family income per capita, education level, and marital status), behavioral habits (smoking, drinking, dietary habits, and physical activity [PA]), personal and family disease history (diabetes and hypertension), medication history, occupational history (factory category, factory entry date, work categories, and shift work status), and use of protective equipment (usage of dustproof masks, noise-proof earplugs, and cooling drinks). PA and dietary habit data were collected using the International Physical Activity Questionnaire (IPAQ) and Food Frequency Questionnaire (FFQ), which included 15 items.
-
Height and weight were measured and recorded by a professional nurse, using a height and weight measurement instrument (HGM301, China). Participants were required to remain standing while wearing light clothing and no shoes. The precision of height and weight was 0.1 cm and 0.1 kg respectively [body mass index (BMI) = weight (kg) / height2 (m2)].
Fasting venous blood (5 mL) was collected after 6–8 h of overnight fasting and placed in anticoagulant tubes. FBG levels were measured using the glucose oxidase method in the same laboratory using an automatic blood chemical analyzer (Hitachi 7600-020, Japan).
-
Data on occupational high temperatures, noise, dust, and CO exposure were obtained from annual monitoring reports of occupational hazard factors of companies[14]. Temperature measurements were performed at multiple points in the workplace using a wet-bulb black globe temperature gauge (WBGT) according to standard procedures[15]. High-temperature exposure was defined according to the GBZ/T229.3-2010 Classification of Occupational Hazards at Workplaces Part 3: Occupational Exposure to Heat Stress[16]. Noise was measured using the HS6288B Noise Spectrum Analyzer, and noise exposure was determined according to the GBZ/T229.4-2010 Classification of Occupational Hazards at Workplaces Part 4: Occupational Exposure to Noise[17,18]. Dust was measured using a Dust Sampler with a sampling time of 45 min at each sampling point, and dust exposure was determined according to GBZ-T192.1-2007 Determination of Dust in the Air of Workplace Part 1: Total Dust Concentration[19]. CO was measured using a portable CO infrared analyzer (Model GXH-3011A), and CO exposure was determined according to the GBZ2.1-2007 Occupational Exposure Limits for Hazardous Agents in the Workplace Part 1: Chemical Hazardous Agents[20,21].
Cumulative exposure to occupational hazards was measured using a Job Exposure Matrix for steelworkers. Cumulative exposure measurements (CEM) for occupational hazards were calculated using the following formula:
$$ \text{CEM} =\sum \text{L}=\text{L}_{ {1}} {\text{T}}_{ {1}} {+\text{L}}_{ {2}} {\text{T}}_{ {2}} + {\cdots + \text{L}}_{ {\text{n}}} {\text{T}}_{ {\text{n}}} $$ (1) where: Ln is the exposure of the hazard factor at Tn time.
-
Nationality was divided into Han and other groups. Marital status included unmarried, married, and other (divorced, widowed, or remarried). Educational levels were divided into three groups: middle school and below; high school and secondary specialty schools; and college and above. Smoking and alcohol consumption were defined according to World Health Organization[14]. According to the IPAQ classification standard[22], the tensity of PA is classified as low, medium, and high. Product-line factories included hot rolling, cold rolling, and ironmaking, while the others were auxiliary factories. Owing to the product process reforms in 1998 and 2007, the factory entry era was divided into three groups (before 1998, 1998–2007, and after 2007). Shift work was defined as a system of irregular working hours in which one or more teams perform tasks continuously for 24 h by working in shifts[14]. The FFQ dietary score ranges from 15 to 60 points, based on the plant-based diet index (PDI)[23]; higher PDI scores indicate healthier plant-based foods and better dietary quality. The diagnostic criteria for diabetes and hypertension were as follows: 1) pre-existing diagnosis of hypertension or diabetes by second-level hospital diagnosis; and 2) taking medication for hypertension or diabetes.
-
Means and standard deviations (SD) were used to describe continuous data with a normal distribution, whereas numbers with percentages (%) were used for categorical data. Comparisons between groups were performed using the chi-square or Fisher’s exact test. Univariate repeated-measures analysis of variance was performed to evaluate changes in FBG levels over time. Missing values for monthly family income per capita and marital status were determined by using multiple interpolations.
Group-based trajectory modeling (GBTM) was used to identify the different patterns of FBG trajectories in the TGOC from 2017 to 2022. The optimal number of patterns in the trajectories was determined based on the following criteria[24,25]: (1) the absolute value of the Bayesian information criterion (BIC) of the model was closest to 0; (2) the average posterior probability (AvePP) of each group was ≥ 0.7; and (3) the sample size of each group was > 5% of the total participants. The shape of the trajectory for each group was determined by a stepwise procedure that started with all groups set to a cubic order, and the change in the BIC and significance of the parameters were then compared.
The ERS assesses the risk of exposure to multiple hazard factors in epidemiologic studies[11,26]. The ERS calculation procedure was as follows: (1) the relationships between cumulative occupational hazard exposure and FBG trajectory were analyzed using nonconditional logistic regression with adjusted age, nationality, education level, monthly family income per capita, work category, shift work, BMI, PA, smoking, drinking, PDI, usage of dustproof masks, usage of noise-proof earplugs, usage of cooling drinks, personal and family disease history, and medication history. (2) ERS was calculated by summing up using a regression coefficient (weight) of 10 times and grouped according to ERS quintiles. ERS1 calculates the weight using 10 times the regression coefficient of each hazard factor as a single hazard factor, whereas ERS2 calculates the weight using 10 times the regression coefficient from a multiple-hazard-factor model that includes all the hazard factors simultaneously.
Multinomial logistic regression models were used to compare the effects of occupational hazard factors and ERS on FBG trajectories in 3,728 participants. Model 1 was unadjusted and Model 2 was adjusted for age, nationality, education level, monthly family income per capita, factory entry date, work categories, shift work, usage of dustproof masks, usage of cooling drinks, usage of noise-proof earplugs, personal and family disease history, medication history, BMI, PA, smoking, drinking, and PDI scores. Odds ratios (ORs) and 95% confidence intervals (CIs) were calculated to assess the risk associated with exposure to each occupational hazard and ERS for different FBG trajectories. The chi-square trend test was used to analyze the relationship between cumulative exposure to occupational hazards and ERS and FBG levels. Finally, the association between occupational hazards and FBG trajectories was further analyzed by stratification and subgroups based on factory category, factory entry date, age, education level, shift work, and BMI. The CEM and PDI scores were divided into groups according to quantity and tertile, respectively. Additionally, we conducted a sensitivity analysis using the same method after excluding patients with diabetes.
Statistical analysis was performed using R 4.4.1 and SPSS 23.0, and a statistical difference of P < 0.05 was considered statistically significant.
-
A total of 3,728 male workers were included in this study (Figure 1), with an average age of 42 years (range, 23–57 years); 61.5% were aged > 40 years. A total of 90% of the participants were of Han nationality and married. 56.2% had attended high school or secondary specialized school, and 55.9% had worked for ≥ 20 years. The proportions of participants exposed to noise, dust, high temperature, and CO were 56.6%, 55.6%, 61.6%, and 51.8%, respectively. The study population was married and educated, had a higher monthly family income per capita, and was younger than the population lost to follow-up (
Supplementary Table S1 ).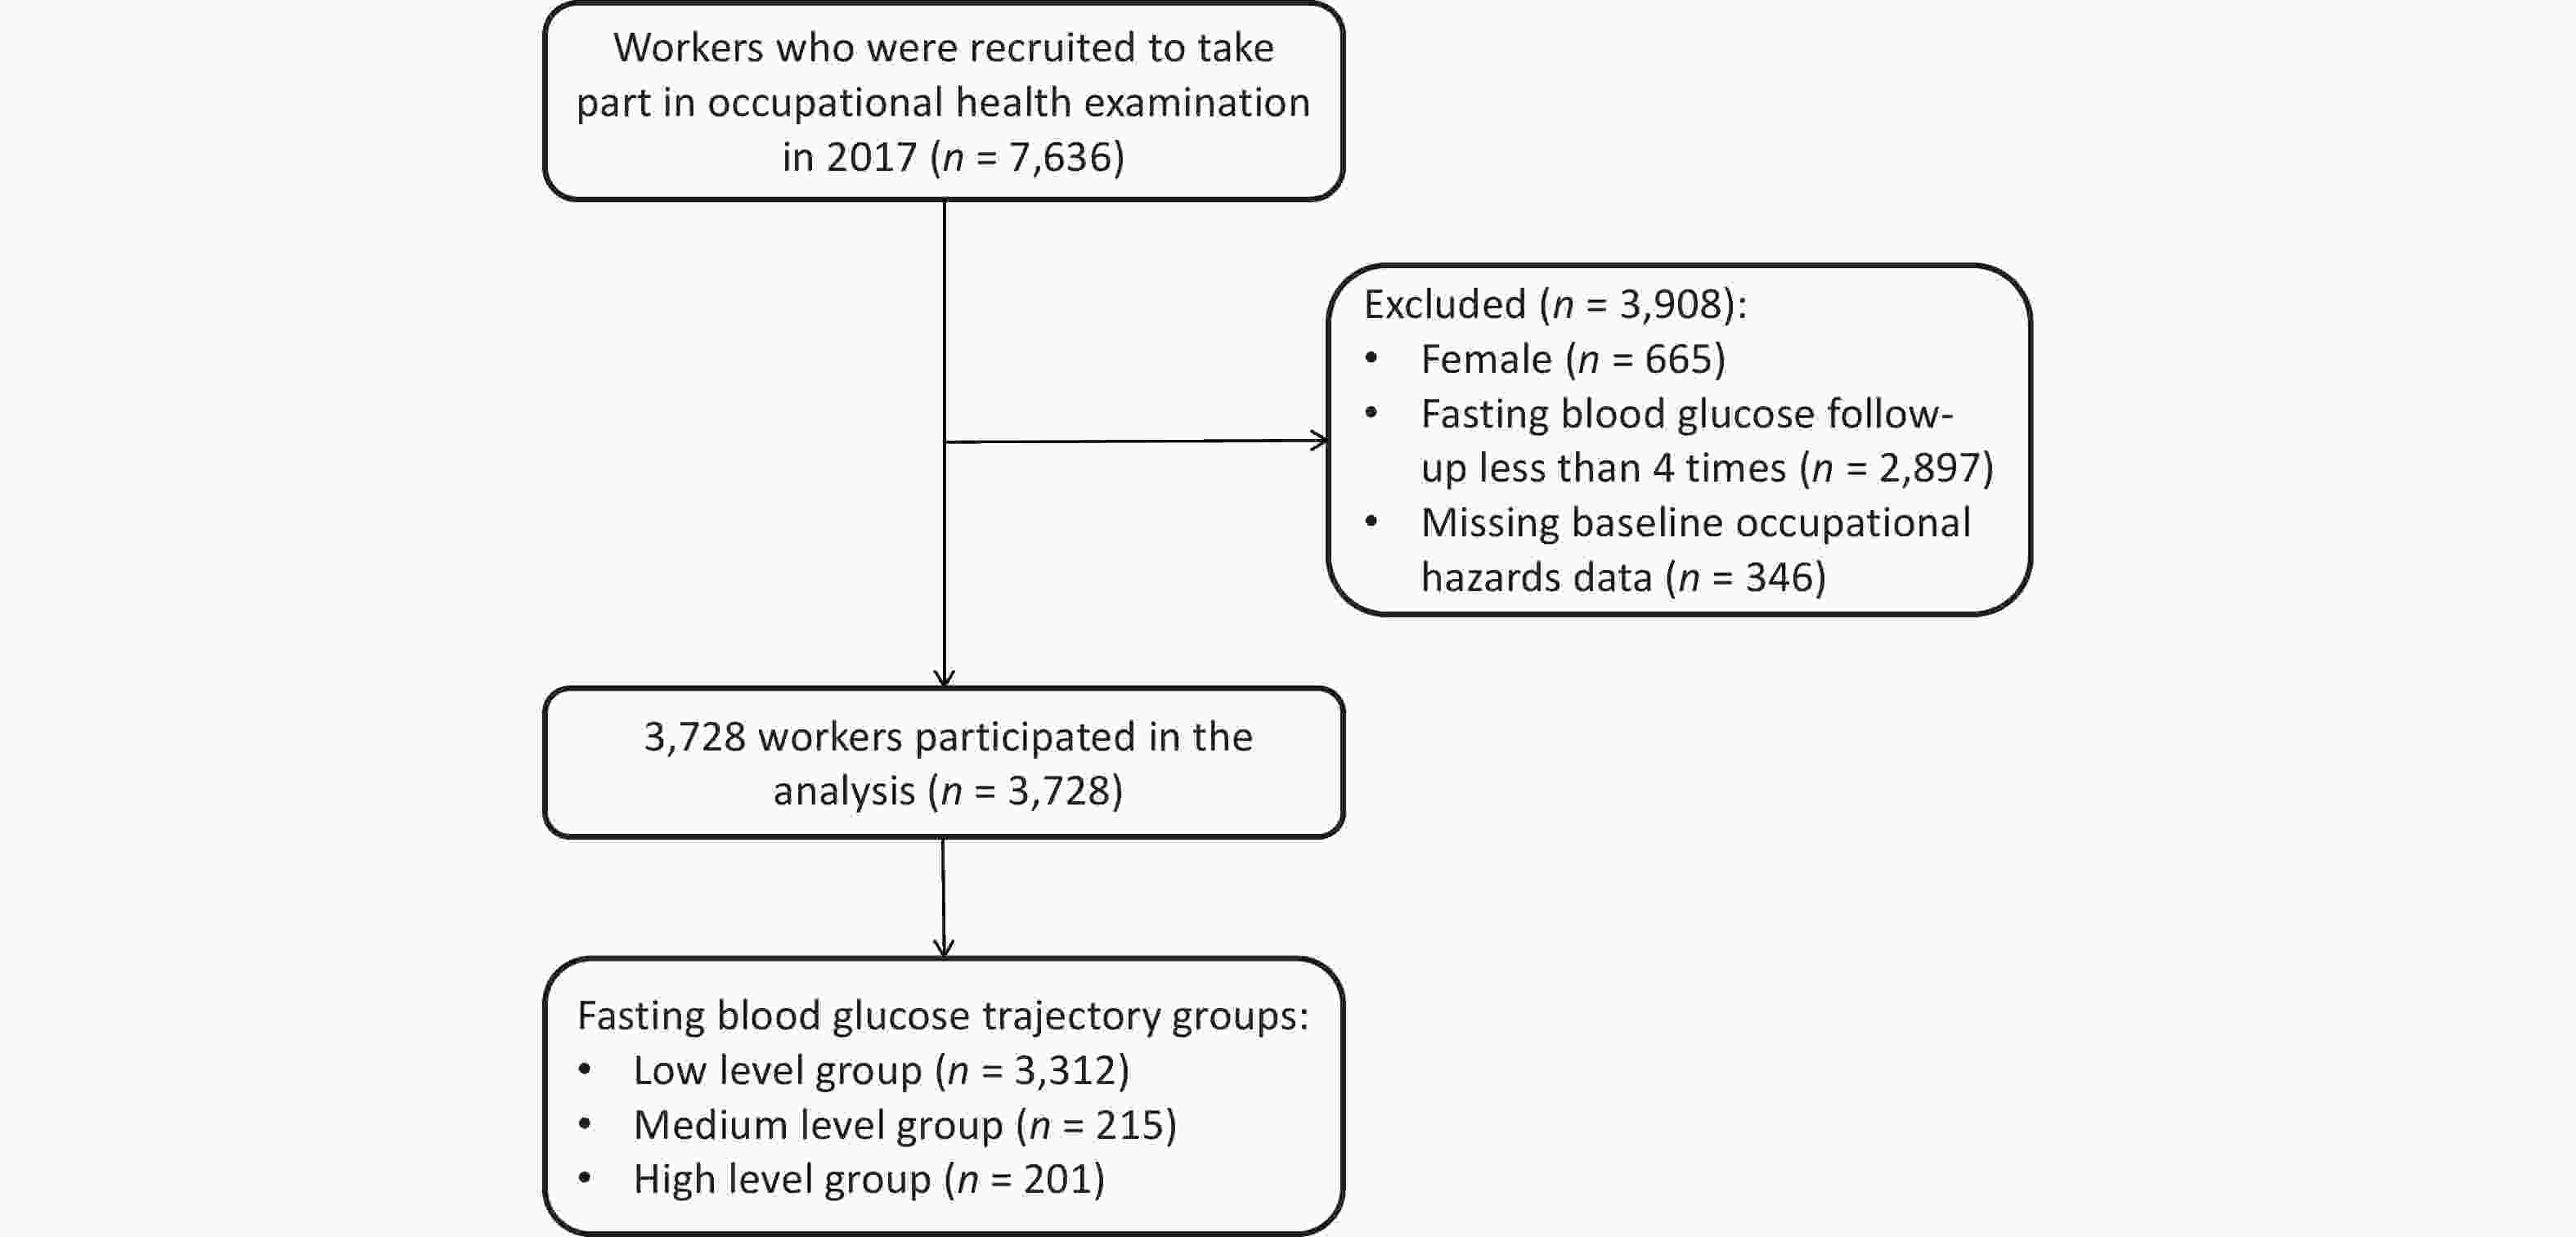
Figure 1. Flow chart of the study population.
-
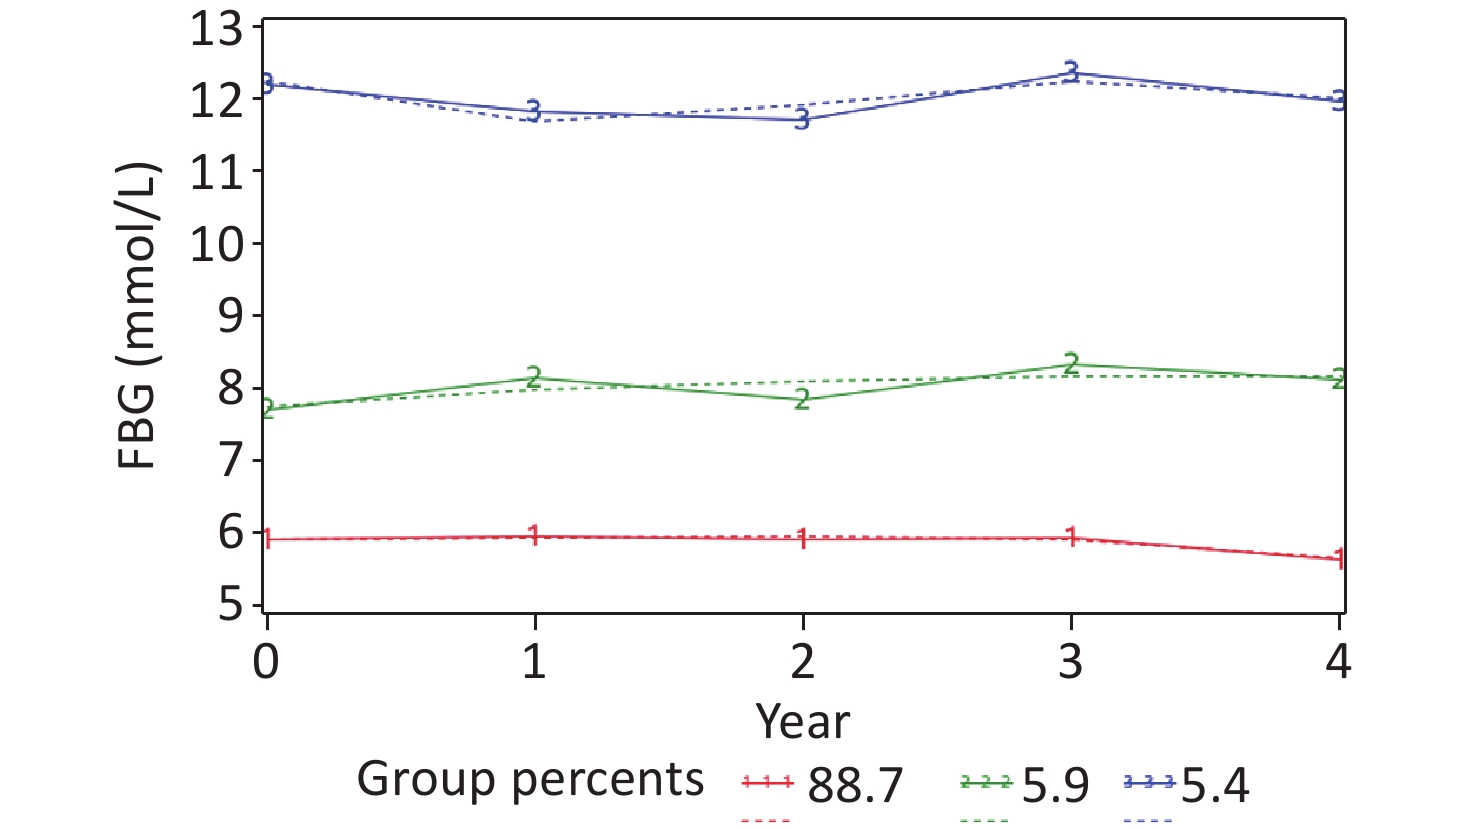
The average FBG level from 2017 to 2022 was 6.03 ± 1.1 mmol/L, 6.04 ± 1.2 mmol/L, 5.77 ± 1.1 mmol/L, 5.8 6 ± 1.2 mmol/L, 5.34 ± 1.4 mmol/L, and 5.36 ± 1.5 mmol/L respectively. A statistically significant change was noted in FBG levels over time (F = 377.530, P < 0.001). Based on the GBTM, three different trajectories were identified according to the BIC, sample size proportion, and AvePP (
Table S2 and Figure 2). FBG of around 5.8 mmol/L at five-time points was defined as the "low-level group" (trajectory 1: n = 3,312, 88.7%). FBG of around 8 mmol/L at five-time points was defined as the "medium-level group" (trajectory 2: n = 215, 5.9%). FBG of about 12 mmol/L at five-time points was defined as the "high-level group" (trajectory 3: n = 201, 5.4%).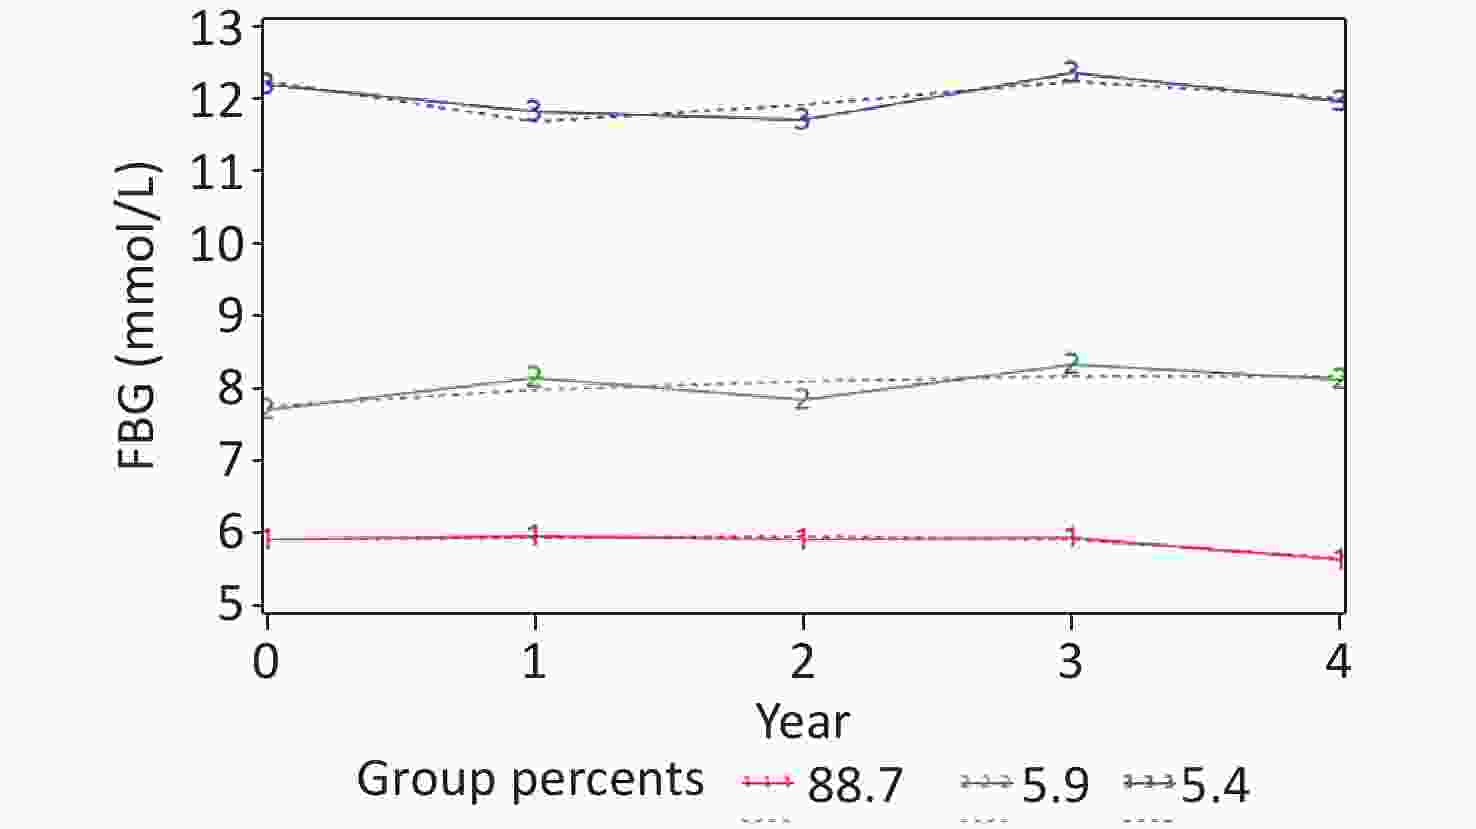
Figure 2. Trajectories in FBG.
-
There were significant differences in the factory category, age, education level, factory entry date, shift work, diabetes, hypertension, medication history, family history of diabetes, and BMI among the three FBG trajectories. The proportion of participants with diabetes, hypertension, obesity, and medication use in Trajectory 3 was higher than those in Trajectories 1 and 2 (Table 1).
Variables Low-level group
(n = 3,312)Medium-level group
(n = 215)High-level group
(n = 201)χ² P-value Product-line factories, n (%) 1,645 (49.7) 107 (49.8) 76 (37.8) 10.709 0.005 Age (years), n (%) 72.399 < 0.001 < 30 263 (7.9) 5 (2.3) 5 (2.5) 30− 1,073 (32.4) 51 (23.7) 40 (19.9) 40− 1,464 (44.2) 121 (56.3) 89 (44.3) ≥ 50 512 (15.5) 38 (17.7) 67 (33.3) Han, n (%) 3,222 (97.3) 209 (97.2) 195 (97.0) 0.054 0.974 married, n (%) 2,987 (90.2) 194 (90.2) 186 (92.5) 6.916 0.140 education level, n (%) 35.974 < 0.001 middle school or below 628 (19.0) 72 (33.5) 54 (26.9) high school or secondary specialized school 1,891 (57.1) 110 (51.2) 111 (55.2) college or above 793 (23.9) 33 (15.3) 36 (17.9) monthly family income per capita (¥), n (%) 1.731 0.785 < 2000 1,686 (50.9) 102 (47.4) 105 (52.3) 2000−2999 1,119 (33.8) 74 (34.4) 66 (32.8) ≥ 3000 507 (15.3) 39 (18.2) 30 (14.9) entry factory date, n (%) 28.111 < 0.001 before 1998 1,988 (60.0) 148 (68.8) 154 (76.6) 1998−2007 957 (28.9) 52 (24.2) 35 (17.4) after 2007 367 (11.1) 15 (7.0) 12 (6.0) work categories, n (%) 28.615 0.432 ironworker 126 (3.8) 9 (4.2) 11 (5.5) steelworker 241 (7.3) 18 (8.4) 11 (5.5) others 2,945 (88.9) 188 (87.4) 179 (89.0) Years of service, n (%) 28.519 < 0.001 1− 128 (3.9) 3 (1.4) 4 (2.0) 5− 263 (7.9) 12 (5.6) 9 (4.5) 10− 1,118 (33.8) 59 (27.4) 48 (23.9) ≥ 20 1,803 (54.4) 141 (65.6) 140 (69.6) shift work, n (%) 10.038 0.040 never 542 (16.4) 30 (14.0) 32 (15.9) ever 483 (14.6) 33 (15.3) 45 (22.4) present 2,287 (69.0) 152 (70.7) 124 (61.7) diabetes, n (%) 0 (0.0) 13 (6.0) 102 (50.7) 1,639.004 < 0.001 hypertension, n (%) 416 (12.6) 34 (15.8) 57 (28.4) 41.201 < 0.001 medication history, n (%) 0 (0.0) 13 (6.0) 27 (13.4) 375.310 < 0.001 family history of diabetes, n (%) 346 (10.4) 37 (17.2) 50 (24.9) 45.387 < 0.001 smoking, n (%) 1,989 (60.1) 132 (61.4) 128 (63.7) 1.150 0.563 drinking, n (%) 2,506 (75.7) 173 (80.5) 161 (80.1) 4.363 0.113 PDI, n (%) 1.941 0.747 low 1,095 (33.0) 71 (33.0) 76 (37.8) medium 1,108 (33.5) 72 (33.5) 63 (31.3) high 1,109 (33.5) 72 (33.5) 62 (30.9) PA, n (%) 3.755 0.440 low 329(9.9) 28 (13.0) 20 (10.0) medium 486(14.7) 30 (14.0) 23 (11.4) high 2,497(75.4) 157 (73.0) 158 (78.6) BMI (kg/m2), n (%) 37.082 < 0.001 < 24 1,176 (35.5) 48 (22.4) 41 (20.4) 24− 1,448 (43.7) 102 (47.4) 104 (51.7) ≥ 28 688 (20.8) 65 (30.2) 56 (27.9) usage of dustproof masks, n (%) 2,398 (72.4) 163 (75.8) 142 (70.6) 1.546 0.462 usage of cooling drinks, n (%) 2,722 (82.2) 181 (84.2) 166 (82.6) 0.565 0.754 usage of noise-proof earplugs, n (%) 1,588 (47.9) 111 (51.6) 95 (47.3) 1.159 0.560 Note. PDI, the plant-based diet index; PA, physical activity; BMI, body mass index. Table 1. Baseline characteristics according to FBG trajectory groups
-
Figure 3A and Table S3 show that participants exposed to high temperatures were prone to elevated FBG trajectories; however, no significant relationship was observed between occupational noise, dust, CO exposure, and FBG trajectories. The FBG trajectory level increased with increasing cumulative high-temperature exposure (Ptrend < 0.001) (
Supplementary Table S7 ).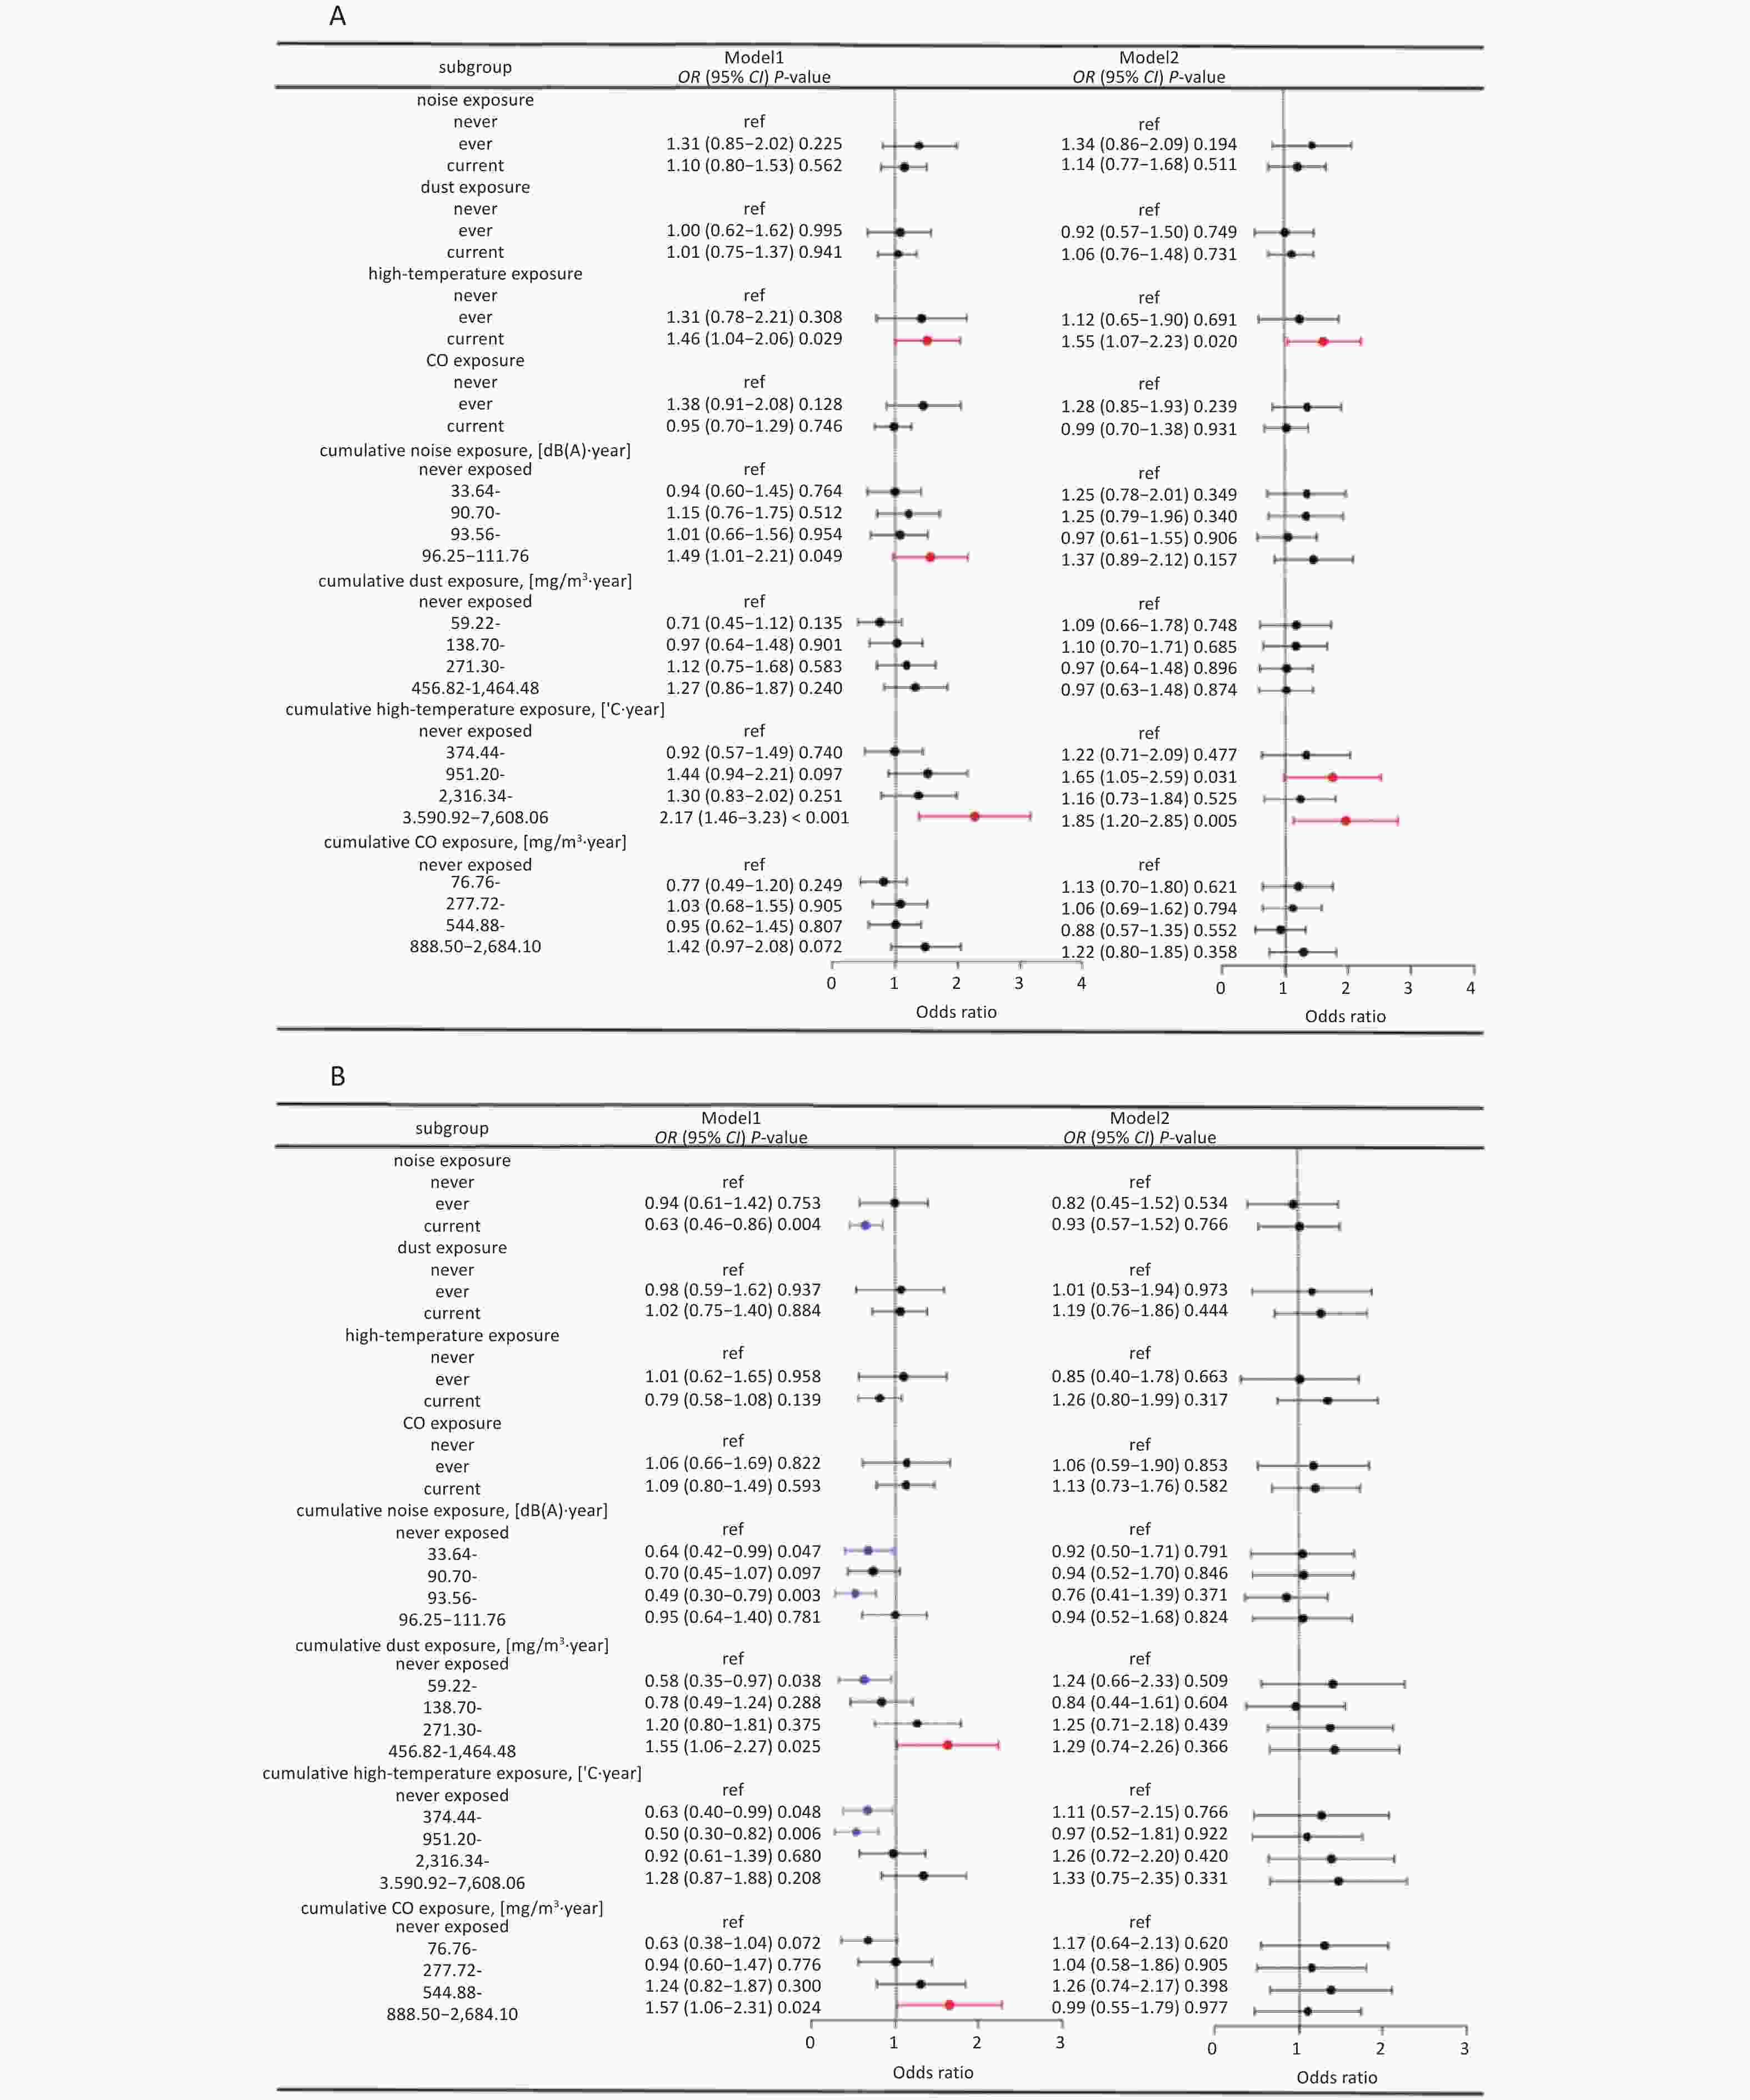
Figure 3. Association with occupational hazards and FBG trajectories by Logistic regression analysis. (A) compares the medium- and low-level groups, and (B) compares the high- and low-level groups.
Compared to participants not exposed to noise, the risk of a median FBG trajectory with noise exposure decreased before adjusting for age and other factors. However, no relationship was found between occupational noise and the median FBG trajectory after adjusting for age and other factors. Furthermore, no statistically significant differences were noted between occupational exposure and high FBG trajectories, regardless of whether other factors were unadjusted or adjusted (P > 0.05) (Figure 3B and
Supplementary Table S4 ). The risk of a median or high FBG trajectory increased with cumulative dust or CO exposure (both P = 0.009) (Supplementary Table S8 ). -
The association between occupational hazards and FBG trajectories was inconsistent across factory categories, factory entry date, age, education level, shift work, and BMI. Working in a product-line factory, the entry factory dates after 1998, being aged ≥ 40 years, being in the ever-shift group, and high-temperature exposure can increase the risk of median or high FBG trajectories. Working in a product-line factory, factory entry dates after 1998, educated to junior high school and below, and noise exposure decreased the risk of median or high FBG levels (Supplementary Tables S9–S20).
-
The ERS1 and ERS2 were constructed using single occupational hazards and FBG trajectories using logistic regression analysis (Table 2). The median ERS1 and ERS2 scores in the medium- and low-level were 5.3 (range, 0–11.8), and 5.0 (range, 0–14.7), respectively. In the high-versus low-level groups, the median ERS1 and ERS2 were 3.9 (range, 0–10.5), and 4.2 (range, 0–10.3), respectively.
Variables Medium-level groupa High-level groupa ERS1 ERS2 ERS1 ERS2 cumulative noise exposure, [dB(A)·year] never exposed 0.0 0.0 0.0 0.0 33.64– 2.3 1.3 0.8 0.8 90.70– 2.2 1.9 0.6 0.3 93.56– 0.3 0.1 2.8 2.0 96.25–111.76 3.2 4.0 0.7 0.6 cumulative dust exposure, [mg/m3·year] never exposed 0.0 0.0 0.0 0.0 59.22– 0.8 0.1 2.1 1.4 138.70– 0.9 0.4 1.7 2.6 271.30– 0.3 1.7 2.2 1.0 456.82–1,464.48 0.4 1.1 2.6 1.8 cumulative high–temperature exposure, [°C·year] never exposed 0.0 0.0 0.0 0.0 374.44– 2.0 1.7 1.0 1.8 951.20– 5.0 4.8 0.3 0.6 2,316.34– 1.5 2.2 2.3 3.6 3,590.92–7,608.06 6.2 7.0 2.8 3.7 cumulative CO exposure, [mg/m³·year] never exposed 0.0 0.0 0.0 0.0 76.76– 1.2 0.2 1.5 0.6 277.72– 0.6 0.8 0.4 1.1 544.88– 1.3 2.0 2.3 2.0 888.50–2,684.10 2.0 1.6 0.1 1.6 Note. ERS1 was constructed using ten times the regression coefficients of occupational hazards in the single occupational hazard model as weights, and ERS2 was constructed using ten times the regression coefficients of occupational hazards in the multiple occupational hazard model as weights. a represents a low–level of FBG group as a reference. Table 2. The weight of occupational hazards in the ERS
The FBG trajectory levels increased with increasing ERS1 and ERS2 levels (both Ptrend < 0.05) (Supplementary Table S7). Figure 4A and Supplementary Table S5 show that the risk of developing medium-level FBG in the highest ERS1 and ERS2 was irrespectively 2.17 times (1.39–3.40) and 2.06 times (1.31–3.24) with comparison to that in the lowest group in Model 1. After adjusting for factors such as age, BMI, drinking, and smoking, the risk of developing medium-level FBG decreased from 2.17 (1.39–3.40) to 1.90 (1.17–3.10) in the highest ERS1 group, and from 2.02 (1.28–3.18) to 1.77 (1.07–2.95) in the ERS2 group with scores of 6.1–8.4.

Figure 4. The relationship between ERS and FBG trajectories by Logistics regression analysis. (A) compares the medium-level and low-level groups, and (B) compares the high-level and low-level groups.
The risk of elevated FBG levels did not increase with an increase in ERS (Supplementary Table S8). In Model 2, Figure 4B and Supplementary Table S6 demonstrate that the risk of high-level FBG in the highest ERS1 score and ERS2 of 4.7–6.7 score is 2.21 times (1.09–4.45) and 2.59 times (1.25–5.33) compared to that in the lowest group.
-
After excluding participants with confirmed diabetes, the analysis showed stable results (Supplementary Table S21–S22). However, after adjusting for covariates, the high-level group is more likely to have a high-temperature exposure compared to the low-level group (P = 0.023, OR = 1.85, 95% CI: 1.09–3.14), whereas there was no association before the exclusion.
-
Our study analyzed the longitudinal FBG changing trajectories from 2017 to 2022 among male steelworkers in the TGOC region. The FBG trajectories of the steelworkers were categorized into three groups. Single and multiple occupational hazards are related to the FBG trajectory, particularly high temperatures and noise, which play important roles in FBG trajectories. In addition, our findings may help identify high-risk individuals with high FBG levels and provide measures to minimize the increase in FBG levels.
FBG levels increased with cumulative high-temperature exposure in our study. These results are consistent with those of previous studies[7,27,28]. A possible explanation for this observation is that high temperatures are unfavorable for heat dissipation in the body. As the temperature rises, the body's temperature regulation ability weakens, leading to fluid loss and resulting in pathological blood concentration, which, in turn, increases FBG levels. This increase is harmful to glucose metabolism and tends to gradually increase the degree of damage[7,29,30].
Our study showed that occupational noise exposure can decrease FBG trajectory. Our findings contradict those of previous cohort studies showing a positive correlation between noise exposure and high FBG[6,31]. A possible explanation for this finding is that there may have been a more pronounced healthy worker effect in the study population. The reference group consisted of workers who were not exposed to hazard factors, whereas the exposed group had stricter pre-employment or on-the-job health examination requirements. Those who do not meet the occupational health examination eligibility criteria are restricted from engaging in work that involves noise exposure. Therefore, individuals who worked with occupational risk factors for a long time are more likely to have better physical health or have already adapted to these factors.
Compared to the low-level group, the other two groups had higher ERS. Essentially, the larger the ERS, the higher the FBG level. Moreover, the combined effect of these occupational hazards was greater than the single-factor effects. Many cross-sectional studies have demonstrated that exposure to multiple occupational hazards increases the risk of diseases such as diabetes and hypertension[7,32,33]. A 2019 review indicated that exposure to multiple occupational hazards can have significant adverse effects on health[34]. However, the underlying mechanism remains unclear. One possible explanation is that simultaneous exposure to multiple occupational hazards may significantly affect hypoglycemic mechanisms in the body. Exposure to multiple occupational hazards not only affects the concentration and activity of pancreatic beta cells but also leads to abnormal excitation of the sympathetic nervous system, which can negatively affect blood glucose regulation and result in elevated blood glucose levels[7,33,35].
The association between occupational hazards and FBG trajectories was inconsistent across factory categories, factory entry date, age, education level, shift work, and BMI. Workers in productline factories are more likely to be exposed to occupational hazards than those in auxiliary factories. Shift work and obesity have been confirmed as risk factors for T2DM and can affect FBG levels. Shift work disrupts the body's circadian rhythm or triggers metabolic disorders that increase the risk of T2DM[36,37] and may also alter blood glucose levels by decreasing insulin sensitivity and reducing glucose tolerance[38].
This study had several strengths. First, we utilized a prospective cohort with stable populations, detailed information on various occupational exposures, and a comprehensive questionnaire survey for potential confounders such as diet and PA. Second, we used the ERS to evaluate single and combined exposure to multiple occupational hazard factors, as well as the effects of occupational exposure on FBG trajectories. However, this study had some limitations. First, the ERS only considered the additive effect of various occupational hazard factors, neglecting the antagonistic and multiplicative interaction effects between them. These interactions can be further analyzed by applying the BKMR and other methods. Second, the healthy worker effect may have led to underestimation of the relationship between exposure and outcomes. Third, considering the influence of drugs on FBG levels, we only adjusted for medication history. However, after excluding patients with diabetes, the results of the repeated analyses remained stable. Finally, when the blood glucose trajectories were divided into five groups, the upward and downward trajectories were observed. Owing to the population sample size limitations, our study selected only three groups of trajectories. It is recommended that the sample size be expanded in future studies to include more trajectory group analyses.
-
Our study revealed an association between high temperature, noise exposure, and FBG levels. As ERS increases, the risk of elevated FBG levels also increases. Our study provides a basis for blood glucose control and prevention among male steelworkers.
Occupational Hazard Factors And The Trajectory Of Fasting Blood Glucose Changes In Chinese Male Steelworkers Based On Environmental Risk Scores: A Prospective Cohort Study
doi: 10.3967/bes2025.058
Funds:
This study was supported by the Key Research and Development Program of the Ministry of Science and Technology of China, the Key Research and Development Program of Hebei Province, the Joint Fund for Iron and Steel of the Natural Science Foundation of Hebei Province, and National Science Foundation for Regional Joint Fund of China (Project Nos. 2016YF0900605, 192777129D, H2016209058, and U22A20364).
- Accepted Date: 2025-02-24
-
Key words:
- Fasting blood glucose /
- Occupational hazards /
- Group-based trajectory modeling /
- Environmental risk scores /
- Steelworkers
Abstract:
The authors declare no conflict of interest.
This study was approved by the Medical Ethics Committee of North China University of Science and Technology (approval number: 16040). All participants who completed the baseline and follow-up surveys signed an informed consent form.
| Citation: | Mingxia Zou, Wei Du, Qin Kang, Yuhao Xia, Nuoyun Zhang, Liu Feng, Feiyue Li, Tiancheng Ma, Yajing Bao, Hongmin Fan. Occupational Hazard Factors And The Trajectory Of Fasting Blood Glucose Changes In Chinese Male Steelworkers Based On Environmental Risk Scores: A Prospective Cohort Study[J]. Biomedical and Environmental Sciences. doi: 10.3967/bes2025.058

|

 Quick Links
 DownLoad: