


-
Influenza virus infections decreased worldwide during the coronavirus disease 2019 (COVID-19) pandemic[1,2], reportedly because of public health interventions and influenza vaccination[3,4]. Early in the pandemic in South Korea, the government’s effective response suppressed severe acute respiratory syndrome coronavirus 2 (SARS-CoV-2) infections. This was followed by international policies emphasizing advanced public health and medical systems, real-time disaster communications, epidemiological investigations of infected people, and superior COVID-19 diagnostic capabilities[5,6]. These measures are believed to have affected COVID-19 and influenza activity.
Despite this decreasing trend, according to the World Health Organization (WHO), approximately one billion cases of seasonal influenza affect 5%–15% of the world’s population each year[7]. Thus, influenza vaccination protects individuals with compromised immune systems, reducing the chances of contracting influenza as well as the hospitalization and mortality rates in the event of infection[7]. To prevent a “twindemic,” in which the two diseases occur simultaneously, vaccination against influenza should be considered[7]. South Korea officially declared the end of the COVID-19 pandemic on May 11, 2023, 3 years and 4 months after the first confirmed case on January 20, 2020[8]. According to the results of several studies, the COVID-19 pandemic has led to an increase in the influenza vaccination rate[9]. However, previous studies have primarily focused on data from the initial phase of the pandemic up to 2020, making it difficult to accurately assess the influenza vaccination rate fluctuations throughout the pandemic[10]. As the criteria for eligibility for free vaccination changed after the introduction of the COVID-19 vaccination in February 2021[11], data for the entire pandemic should be comprehensively reviewed. Therefore, our aim in this study was to compare and confirm the trends in influenza vaccine uptake before and during the COVID-19 pandemic, including a demographic and sociological survey to investigate the factors influencing vaccination behavior. Our purpose was to understand the impact of the pandemic on influenza vaccination behavior from 2011 to 2022 and to identify vulnerable groups.
-
The data used in this study were obtained from the Korea Community Health Survey (KCHS) conducted by the Korea Disease Control and Prevention Agency between 2011 and 2022[12,13]. The KCHS has been conducted every year since 2008 to produce statistics for establishing and evaluating health policies based on the health status of residents. The survey is administered as a face-to-face computer-assisted personal interview to adults aged ≥ 19 years in households selected by random sampling. Basic information is collected, including sex, age, region of residence, marital status, education, economic activities, previous medical history (hypertension and type 2 diabetes), physical measurements (i.e., body mass index [BMI]), health behaviors, vaccinations, and medical utilization[12,13]. Excluding data with missing values, a nationally representative sample of 2,426,139 individuals was used for analysis. The KCHS data for the years covered by this study were anonymized, and written informed consent was obtained from all participants prior to the study. The study protocol was approved by the Institutional Review Board of the Korea Disease Control and Prevention Agency (2010-02CON-22-P, 2011-05CON04-C, 2012-07CON-01-2C, 2013-06EXP-01-3C, 2014-08EXP-09-4CA, and 2016-10-01-TA). Ethical considerations were upheld, adhering to the Declaration of Helsinki.
-
Considering that the first confirmed case of SARS-CoV-2 infection in South Korea was reported on January 20, 2020, and the WHO declared COVID-19 a pandemic on March 11, 2020, we defined the pre-pandemic period from 2011 to 2019 and the pandemic period from 2020 to 2022[14]. Individuals were asked targeted questions regarding their influenza vaccination history, such as “Have you been vaccinated against influenza in the last year?” Based on the responses, an individual was defined as vaccinated if they had received at least one dose of the influenza vaccine.
-
We utilized data on the South Korean adult population based on the KCHS. In the following covariates, only the variables needed for analysis were selected: age (19–29, 30–49, 50–64, 65–74, and ≥ 75 years), sex (men/women), residential area (urban/rural), BMI group (underweight, normal weight, pre-obesity, or obesity), educational level (elementary school or lower, middle school, high school, or college or higher), household income (lowest, second, third, or highest quartile), economic activity status, occupational category (employer or owner, wage and salary worker, or unemployed), marital status, hypertension, diabetes, and unmet healthcare needs. According to the guidelines of the WHO Western Pacific Branch and the Korean Society for the Study of Obesity, the participants were classified as underweight (< 18.5 kg/m2), normal weight (18.5–22.9 kg/m2), pre-obesity (23.0–24.9 kg/m2), and obesity (≥ 25.0 kg/m2)[15]. The rate of unmet healthcare needs is the number of people who did not make it when they wanted to go to the hospital (excluding dentistry), divided by the number of respondents surveyed.
-
We analyzed the impact of the COVID-19 pandemic on the influenza vaccination rate and compared the various factors associated with this impact by utilizing a weighted linear regression model. The aim was to predict how different variables influence the likelihood of individuals receiving the influenza vaccine. Specifically, we considered vaccination status as the dependent variable and associated factors as the independent variables. The results of the statistical analysis are presented with weighted odds ratios (ORs) and 95% confidence intervals (CIs). To ensure the validity and reliability of the key findings, a stratified analysis was conducted accounting for age, sex, region of residence, BMI group, education, household income, economic activity, occupational categories, marital status, hypertension, diabetes, and unmet healthcare needs. Additionally, we calculated the interaction of each risk factor and determined the ratio of odds ratios (ROR) both before and during the pandemic to identify groups more susceptible to variations in the vaccination rate. SAS software (version 9.4; SAS Institute, Cary, NC, USA) was used for statistical analysis. A two-sided P-value of ≤ 0.05 was deemed statistically significant[16].
-
Table 1 presents the basic characteristics of the study population participating in the KCHS from 2011 to 2022. We conducted an in-depth analysis of a comprehensive cohort comprising 2,426,139 South Korean adults who provided complete responses to the questionnaire. A larger proportion of women (weighted prevalence: 54.17% [95% CI: 54.11 to 54.23]) participated compared with men.
Total Study period 2011–2013 2014–2016 2017–2019 2020 2021 2022 Overall, n 2,426,139 519,248 642,803 632,565 217,963 222,119 191,441 Weighted rate (95% CI) Age, years, weighted % (95% CI) 19–29 9.14 (9.10
to 9.17)2.26 (2.22
to 2.30)11.41 (11.34
to 11.49)10.59 (10.52
to 10.67)11.50 (11.37
to 11.64)10.87 (10.74
to 11.00)10.61 (10.47
to 10.74)30–49 31.89 (31.83
to 31.95)37.91(37.78
to 38.05)34.12 (34.01
to 34.24)29.59 (29.48
to 29.70)27.18 (26.99
to 27.36)27.05 (26.86
to 27.23)26.60 (26.41
to 26.80)50–64 30.70 (30.64
to 30.76)33.36 (33.23
to 33.48)29.47 (29.36
to 29.58)30.33 (30.22
to 30.44)30.55 (30.36
to 30.75)30.36 (30.17
to 30.55)29.42 (29.22
to 29.63)65–74 16.57 (16.52
to 16.61)17.21 (17.11
to 17.31)15.17 (15.08
to 15.26)16.49 (16.39
to 16.58)16.93 (16.77
to 17.08)17.64 (17.49
to 17.80)18.10 (17.93
to 18.27)≥75 11.71(11.67
to 11.75)9.26 (9.18
to 9.34)9.82 (9.75
to 9.90)13.00 (12.92
to 13.08)13.84 (13.70
to 13.99)14.07 (13.93
to 14.22)15.27 (15.11
to 15.43)Sex, weighted % (95% CI) Men 45.83 (45.77
to 45.89)45.03 (44.90
to 45.17)46.54 (46.42
to 46.66)45.94 (45.82
to 46.06)46.00 (45.79
to 46.21)46.10 (45.89
to 46.30)44.76 (44.53
to 44.98)Women 54.17 (54.11
to 54.23)54.97 (54.83
to 55.10)53.46 (53.34
to 53.58)54.06 (53.94
to 54.18)54.00 (53.79
to 54.21)53.90 (53.70
to 54.11)55.24 (55.02
to 55.47)Region of residence, weighted % (95% CI) Urban 57.02 (56.96
to 57.09)55.22 (55.09
to 55.36)58.06 (57.93
to 58.18)57.42 (57.30
to 57.55)56.77 (56.56
to 56.97)57.00 (56.79
to 57.20)57.45 (57.23
to 57.67)Rural 42.98 (42.91
to 43.04)44.78 (44.64
to 44.91)41.94 (41.82
to 42.07)42.58 (42.45
to 42.70)43.23 (43.03
to 43.44)43.00 (42.80
to 43.21)42.55 (42.33
to 42.77)BMI group, weighted % (95% CI) * Underweight (<18.5 kg/m2) 4.63 (4.61
to 4.66)4.63 (4.57
to 4.69)5.12 (5.07
to 5.18)4.39 (4.34
to 4.44)4.11 (4.03
to 4.20)4.36 (4.28
to 4.45)4.73 (4.64
to 4.83)Normal weight (18.5–22.9 kg/m2) 42.35 (42.29
to 42.41)44.70 (44.56
to 44.83)44.26 (44.14
to 44.38)39.97 (39.85
to 40.09)40.77 (40.57
to 40.98)40.80 (40.59
to 41.00)41.03 (40.81
to 41.25)Pre-obesity (23.0–24.9 kg/m2) 24.69 (24.63
to 24.74)25.66 (25.54
to 25.78)24.38 (24.28
to 24.49)24.41 (24.30
to 24.52)24.58 (24.40
to 24.76)24.59 (24.41
to 24.77)24.22 (24.03
to 24.41)Obesity (≥25.0 kg/m2) 28.33 (28.27
to 28.39)25.01 (24.90
to 25.13)26.23 (26.12
to 26.34)31.23 (31.12
to 31.35)30.53 (30.34
to 30.73)30.25 (30.06
to 30.44)30.02 (29.81
to 30.23)Education, weighted % (95% CI) Elementary school or lower education 22.58 (22.53
to 22.63)27.05 (26.93
to 27.17)21.96 (21.86
to 22.06)22.04 (21.93
to 22.14)20.89 (20.72
to 21.06)20.08 (19.91
to 20.25)19.14 (18.96
to 19.31)Middle school 11.92 (11.88
to 11.96)13.80 (13.70
to 13.89)11.54 (11.46
to 11.62)11.68 (11.60
to 11.76)11.38 (11.25
to 11.52)10.95 (10.82
to 11.08)10.65 (10.51
to 10.79)High school 29.84 (29.78
to 29.89)31.93 (31.81
to 32.06)29.62 (29.50
to 29.73)29.28 (29.17
to 29.39)29.56 (29.37
to 29.75)29.35 (29.16
to 29.54)27.61 (27.41
to 27.81)College or higher education 35.66 (35.60
to 35.72)27.22 (27.10
to 27.34)36.88 (36.76
to 37.00)37.01 (36.89
to 37.12)38.17 (37.97
to 38.37)39.62 (39.41
to 39.82)42.60 (42.38
to 42.82)Household income, weighted % (95% CI) Lowest quartile 17.05 (17.00
to 17.09)18.44 (18.34
to 18.55)19.42 (19.32
to 19.52)15.88 15.79
to 15.97)15.29 (15.14
to 15.44)14.76 (14.61
to 14.90)13.81 (13.66
to 13.97)Second quartile 33.48 (33.42
to 33.54)36.16 (36.03
to 36.29)35.85 (35.73
to 35.96)31.88 (31.77
to 32.00)31.56 (31.37
to 31.76)30.94 (30.74
to 31.13)28.67 (28.47
to 28.88)Third quartile 26.48 (26.43
to 26.54)26.86 (26.73
to 26.98)28.00 (27.89
to 28.11)26.86 (26.76
to 26.97)24.90 (24.72
to 25.08)24.27 (24.09
to 24.45)23.47 (23.28
to 23.66)Highest quartile 22.99 (22.94
to 23.05)18.54 (18.44
to 18.65)16.73 (16.64
to 16.82)25.38 (25.27
to 25.49)28.25 (28.06
to 28.43)30.04 (29.85
to 30.23)34.05 (33.83
to 34.26)Economic activity, weighted % (95% CI) Yes 63.16 (63.09
to 63.22)64.69 (64.56
to 64.82)64.26 (64.15
to 64.38)63.51 (63.39
to 63.63)61.20 (61.00
to 61.41)62.96 (62.75
to 63.16)56.56 (56.34
to 56.78)No 36.84 (36.78
to 36.91)35.31 (35.18
to 35.44)35.74 (35.62
to 35.85)36.49 (36.37
to 36.61)38.80 (38.59
to 39.00)37.05 (36.84
to 37.25)43.44 (43.22
to 43.66)Occupational categories, weighted % (95% CI) Employer or owner 24.89 (24.84
to 24.94)29.44 (29.32
to 29.57)24.84 (24.74
to 24.95)23.91 (23.80
to 24.01)21.79 (21.62
to 21.96)21.88 (21.70
to 22.05)22.96 (22.77
to 23.15)Wage and salary worker 38.19 (38.13
to 38.25)35.18 (35.05
to 35.31)39.30 (39.18
to 39.42)39.48 (39.36
to 39.60)39.41(39.21
to 39.62)41.08 (40.87
to 41.28)33.60 (33.39
to 33.82)Unemployed 36.92 (36.86
to 36.98)35.37 (35.24
to 35.50)35.85 (35.74
to 35.97)36.61 (36.49
to 36.73)38.80 (38.59
to 39.00)37.05 (36.84
to 37.25)43.44 (43.22
to 43.66)Marital status, weighted % (95% CI) Yes 70.30 (70.24
to 70.36)82.69 (82.59
to 82.79)69.40 (69.29
to 69.51)67.98 (67.86
to 68.09)63.26 (63.06
to 63.46)63.31 (63.11
to 63.51)63.52 (63.31
to 63.74)No 29.70 (29.64
to 29.76)17.31 (17.21
to 17.41)30.60 (30.49
to 30.71)32.02 (31.91
to 32.14)36.74 (36.54
to 36.94)36.69 (36.49
to 36.89)36.48 (36.26
to 36.69)Hypertension, weighted % (95% CI) Yes 26.42 (26.36
to 26.47)25.51 (25.39
to 25.63)24.34 (24.24
to 24.45)27.30 (27.19
to 27.41)27.42 (27.23
to 27.61)28.52 (28.34
to 28.71)29.37 (29.16
to 29.57)No 73.58 (73.53
to 73.64)74.49 (74.37
to 74.61)75.66 (75.55
to 75.76)72.70 (72.59
to 72.81)72.58 (72.39
to 72.77)71.48 (71.29
to 71.66)70.63 (70.43
to 70.84)Diabetes, weighted % (95% CI) Yes 10.74 (10.70
to 10.78)9.72 (9.64
to 9.80)9.73 (9.66
to 9.80)11.02 (10.95
to 11.10)11.61 (11.48
to 11.74)12.31 (12.17
to 12.45)13.19 (13.04
to 13.34)No 89.26 (89.22
to 89.30)90.28 (90.20
to 90.36)90.27 (90.20
to 90.34)88.98 (88.90
to 89.05)88.39 (88.26
to 88.52)87.69 (87.55
to 87.83)86.81 (86.66
to 86.96)Unmet healthcare needs, weighted % (95% CI) Insufficient 9.35 (9.31
to 9.39)13.23 (13.14
to 13.33)11.59 (11.51
to 11.66)8.22 (8.15
to 8.29)5.06 (4.97
to 5.16)4.82 (4.73
to 4.91)5.18 (5.08
to 5.28)Sufficient 90.65 (90.61
to 90.69)86.77 (86.67
to 86.86)88.41 (88.34
to 88.49)91.78 (91.71
to 91.85)94.94 (94.84
to 95.03)95.18 (95.09
to 95.27)94.82 (94.72
to 94.92)Note. BMI, body mass index; CI, confidence interval; KCHS, Korea Community Health Survey. * According to the Asia-Pacific guidelines, BMI was divided into four groups. Table 1. General characteristics of South Korean adults based on data obtained from the KCHS, 2011–2022
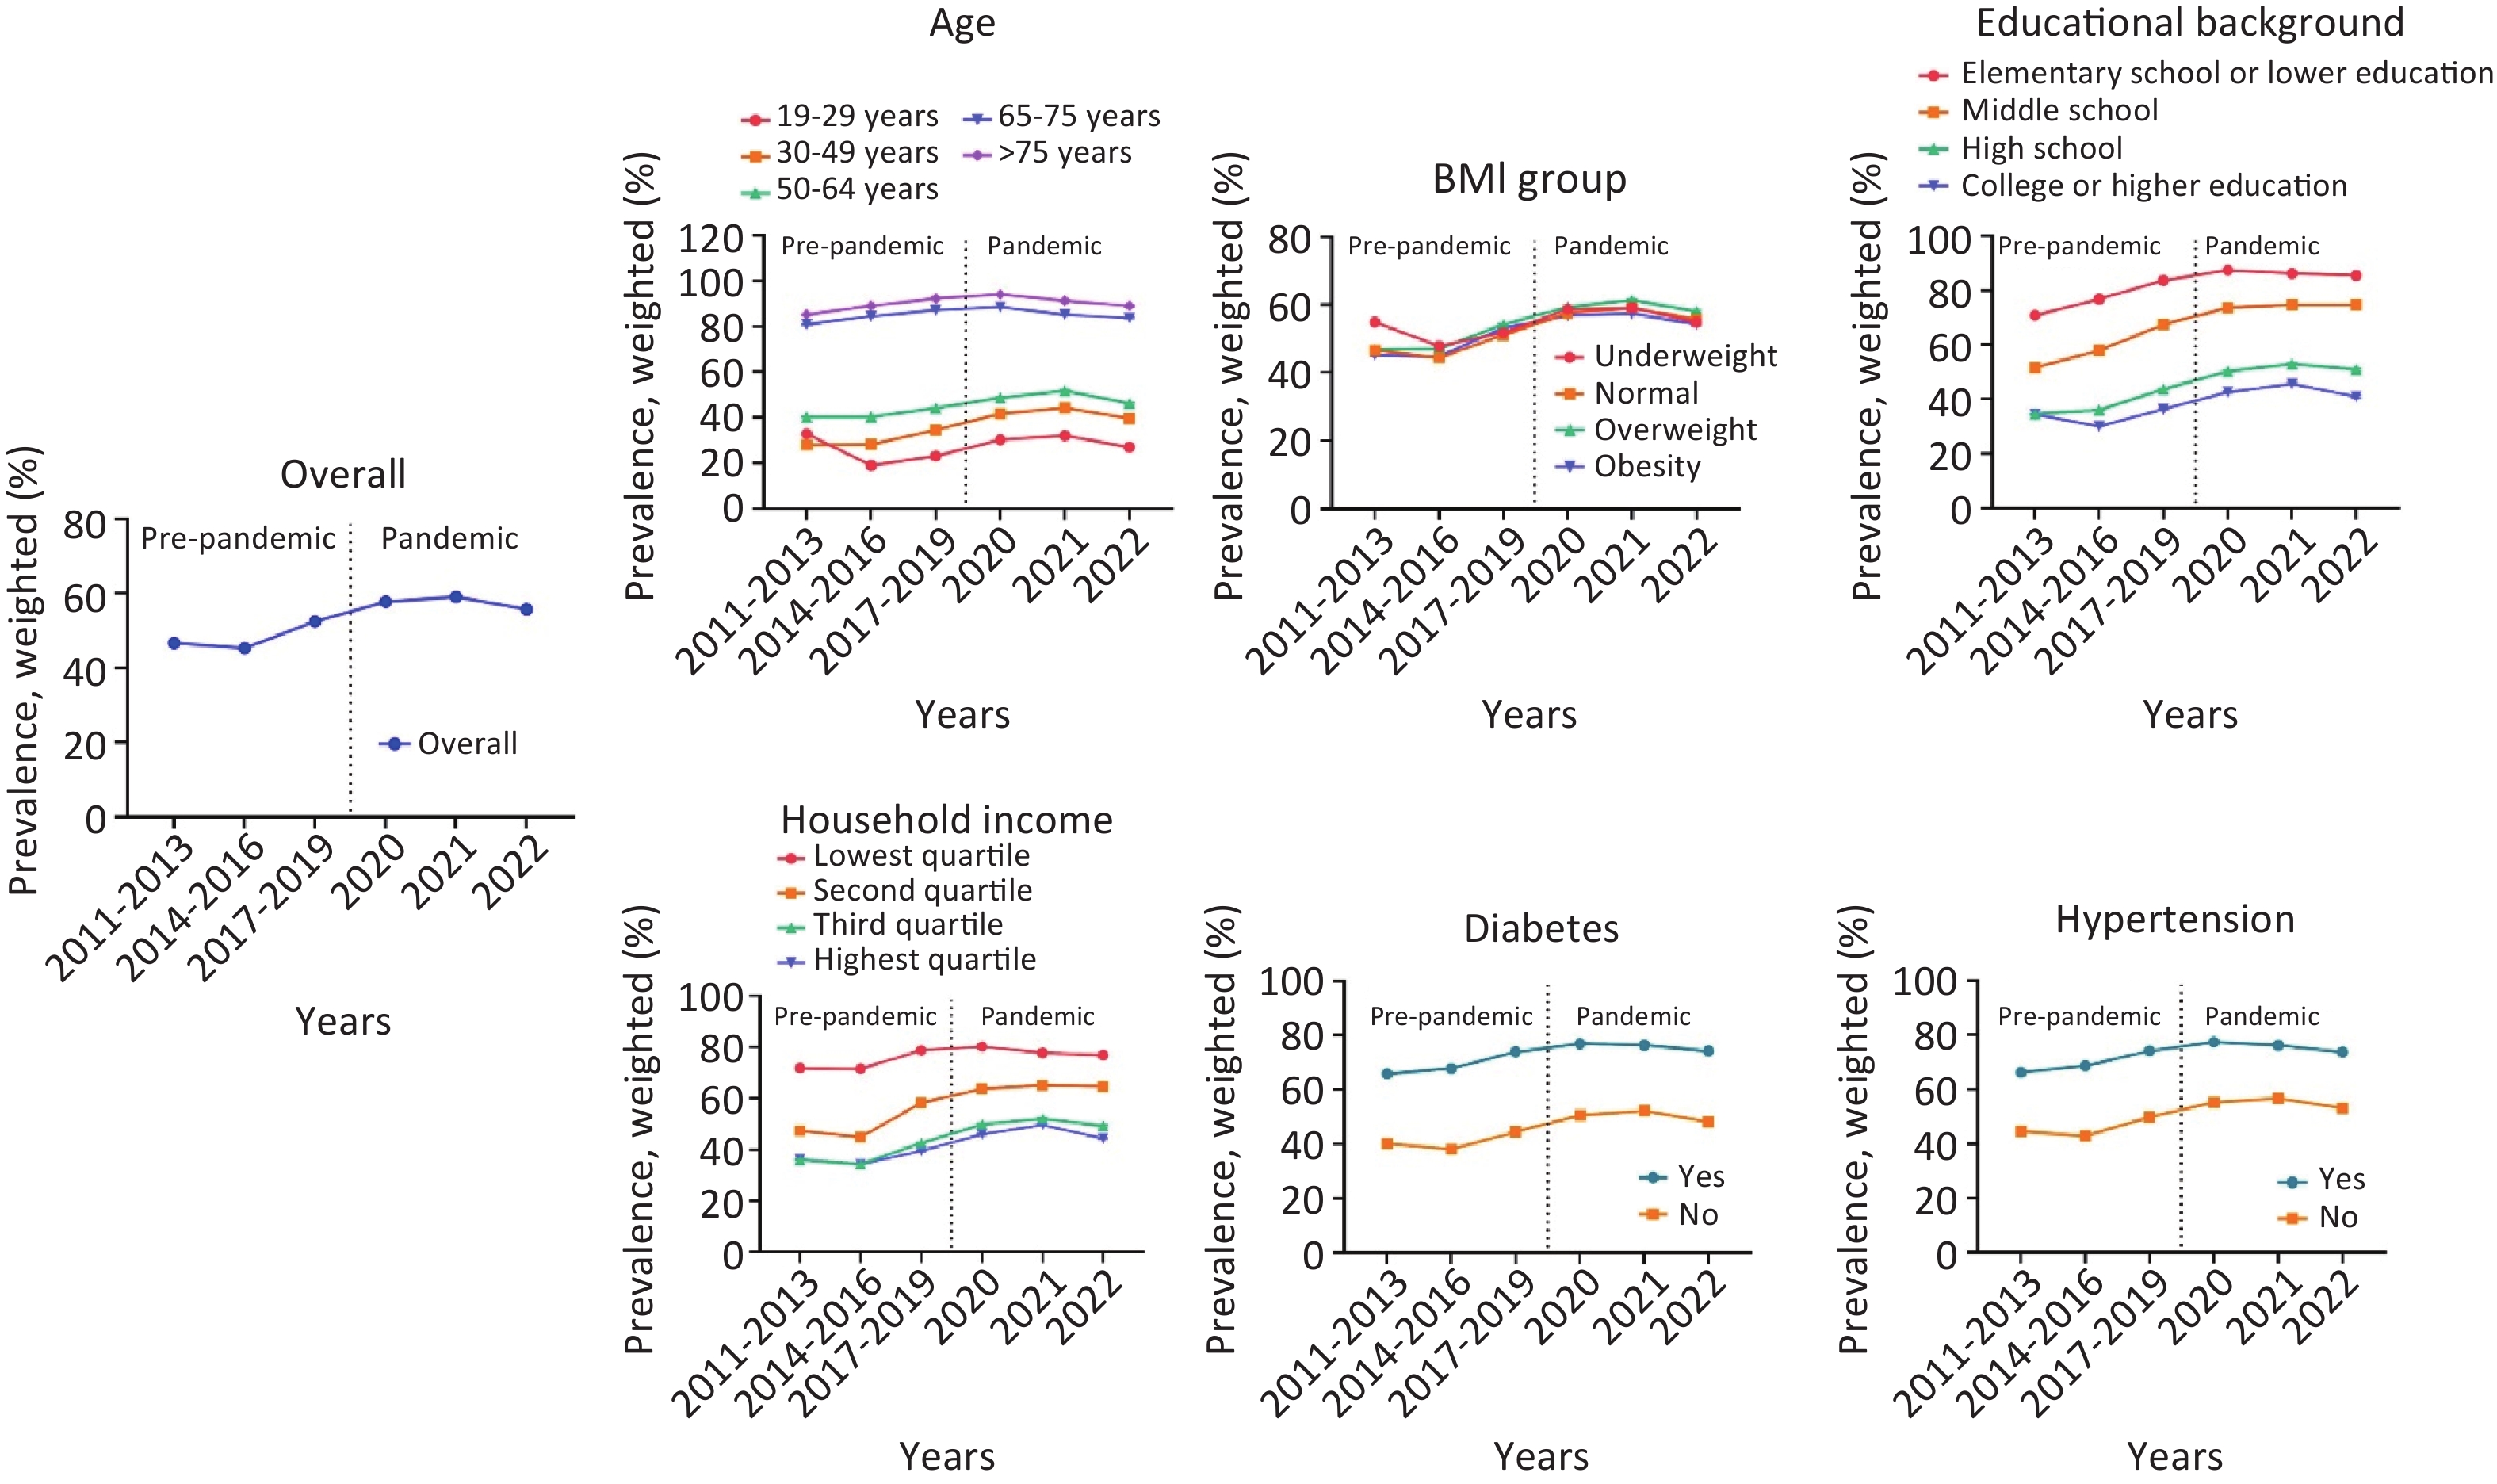
Table 2 and Figure 1 show trends in the prevalence of influenza vaccination before and during the pandemic. Changes in influenza vaccination rates showed an overall increasing trend both before and during the first year of the pandemic. However, a subsequent decrease in influenza vaccination rates was observed during the pandemic (βdiff: −1.34 [95% CI: −1.46 to −1.22]) compared with before the pandemic. Factors that contributed to a reduction in influenza vaccination rates during the pandemic compared with pre-pandemic are as follows: age ≥ 75 years (βdiff: −4.44 [95% CI: −4.65 to −4.22]), women (βdiff: −2.18 [95% CI: −2.34 to −2.02]), rural residence (βdiff: −2.52 [95% CI: −2.70 to −2.34], obesity (βdiff: −3.42 [95% CI: −3.64 to −3.20], elementary school or lower educational level (βdiff: −5.59 [95% CI: −5.79 to −5.39], lack of economic activity (βdiff: −1.75 [95% CI: −1.94 to −1.56]), being an employer or owner (βdiff: −2.40 [95% CI: −2.64 to −2.16], being married (βdiff: −4.07 [95% CI: −4.33 to −3.82], diagnosis of hypertension (βdiff: −3.76 [95% CI: −3.96 to −3.55]), diagnosis of diabetes (βdiff: −3.84 [95% CI: −4.16 to −3.51]), and the presence of unmet healthcare needs (βdiff: −1.52 [95% CI: −1.64 to −1.39]. Conversely, factors that led to an increase in influenza vaccination rates during the pandemic included being 19–29 years old (βdiff: 3.03 [95% CI: 2.61 to 3.44]), being underweight (βdiff: 3.08 [95% CI: 2.52 to 3.64]), college or higher educational level (βdiff: 0.90 [95% CI: 0.70 to 1.09]), being unmarried (βdiff: 4.87 [95% CI: 4.64 to 5.10]), and the absence of unmet healthcare needs (βdiff: 4.87 [95% CI: 4.64 to 5.10]).
Year Before pandemic During the pandemic Trends in the pre-pandemic era, β (95% CI) Trends in the pandemic era, β (95% CI) βdiff between 2011–2019 and 2020–2022 (95% CI) 2011–2013 2014–2016 2017–2019 2020 2021 2022 Overall 46.68 (46.55 to 46.82) 45.30 (45.18 to 45.42) 52.50 (52.38 to 52.63) 57.76 (57.55 to 57.96) 59.12 (58.91 to 59.32) 55.78 (55.56 to 56.01) 3.06 (2.97 to 3.15) 1.73 (1.65 to 1.80) −1.34 (−1.46 to −1.22) Age, years 19–29 32.90 (32.05 to 33.75) 19.03 (18.75 to 19.32) 23.16 (22.84 to 23.47) 30.39 (29.82 to 30.96) 32.16 (31.57 to 32.75) 27.12 (26.50 to 27.73) −0.79 (−1.14 to −0.43) 2.24 (2.03 to 2.45) 3.03 (2.61 to 3.44) 30–49 28.06 (27.86 to 28.26) 28.28 (28.09 to 28.47) 34.59 (34.38 to 34.81) 41.77 (41.37 to 42.16) 44.33 (43.93 to 44.73) 39.61 (39.19 to 40.04) 3.24 (3.09 to 3.39) 2.64 (2.50 to 2.78) −0.60 (−0.80 to −0.39) 50–64 40.37 (40.14 to 40.60) 40.38 (40.16 to 40.60) 44.23 (44.01 to 44.46) 48.77 (48.39 to 49.15) 51.80 (51.42 to 52.18) 46.25 (45.84 to 46.66) 1.96 (1.80 to 2.12) 1.58 (1.44 to 1.72) −0.38 (−0.59 to −0.17) 65–74 80.97 (80.72 to 81.23) 84.51 (84.28 to 84.73) 87.30 (87.10 to 87.51) 88.54 (88.22 to 88.87) 85.32 (84.97 to 85.67) 83.71 (83.32 to 84.10) 3.16 (2.99 to 3.32) −1.15 (−1.28 to −1.02) −4.30 (−4.51 to −4.09) ≥75 85.30 (84.99 to 85.62) 89.14 (88.90 to 89.39) 92.35 (92.17 to 92.53) 94.07 (93.80 to 94.34) 91.29 (90.98 to 91.61) 89.15 (88.79 to 89.51) 3.49 (3.32 to 3.67) −0.94 (−1.06 to −0.82) −4.44 (−4.65 to −4.22) Sex Men 43.01 (42.81 to 43.21) 40.53 (40.36 to 40.71) 47.42 (47.24 to 47.60) 52.25 (51.94 to 52.56) 53.81 (53.51 to 54.12) 51.63 (51.30 to 51.97) 2.39 (2.25 to 2.52) 1.93 (1.82 to 2.05) −0.46 (−0.63 to −0.28) Women 49.69 (49.51 to 49.87) 49.45 (49.28 to 49.62) 56.82 (56.66 to 56.99) 62.45 (62.17 to 62.73) 63.66 (63.38 to 63.93) 59.15 (58.85 to 59.44) 3.69 (3.56 to 3.81) 1.51 (1.41 to 1.61) −2.18 (−2.34 to −2.02) Region of residence Urban 41.13 (40.95 to 41.31) 39.49 (39.34 to 39.65) 46.55 (46.39 to 46.71) 52.40 (52.12 to 52.68) 54.72 (54.44 to 54.99) 50.89 (50.59 to 51.18) 2.90 (2.78 to 3.02) 2.20 (2.09 to 2.30) −0.70 (−0.86 to −0.54) Rural 53.53 (53.33 to 53.73) 53.34 (53.15 to 53.52) 60.53 (60.35 to 60.72) 64.78 (64.48 to 65.09) 64.95 (64.65 to 65.25) 62.40 (62.07 to 62.73) 3.60 (3.46 to 3.73) 1.08 (0.97 to 1.19) −2.52 (−2.70 to −2.34) BMI group Underweight (<18.5 kg/m2) 54.87 (54.24 to 55.50) 47.83 (47.29 to 48.37) 51.81 (51.22 to 52.40) 58.61 (57.60 to 59.63) 59.07 (58.09 to 60.05) 54.87 (53.84 to 55.89) −1.37 (−1.80 to −0.94) 1.70 (1.34 to 2.06) 3.08 (2.52 to 3.64) Normal weight (18.5–22.9 kg/m2) 46.60 (46.39 to 46.80) 44.39 (44.21 to 44.57) 51.03 (50.83 to 51.22) 57.49 (57.17 to 57.82) 59.09 (58.77 to 59.42) 55.64 (55.29 to 55.99) 2.29 (2.15 to 2.43) 2.24 (2.12 to 2.36) −0.05 (−0.23 to 0.14) Pre−obesity (23.0–24.9 kg/m2) 46.82 (46.55 to 47.08) 46.98 (46.73 to 47.22) 54.20 (53.95 to 54.45) 59.28 (58.86 to 59.70) 61.28 (60.87 to 61.69) 58.08 (57.63 to 58.53) 3.78 (3.60 to 3.97) 1.94 (1.79 to 2.10) −1.84 (−2.08 to −1.60) Obesity (≥25.0 kg/m2) 45.19 (44.91 to 45.46) 44.78 (44.54 to 45.02) 53.16 (52.94 to 53.38) 56.76 (56.39 to 57.14) 57.40 (57.02 to 57.77) 54.28 (53.87 to 54.68) 4.30 (4.13 to 4.48) 0.88 (0.74 to 1.02) −3.42 (−3.64 to −3.20) Education Elementary school or lower education 70.79 (70.56 to 71.03) 76.79 (76.57 to 77.01) 83.64 (83.44 to 83.83) 87.39 (87.08 to 87.69) 86.20 (85.88 to 86.52) 85.42 (85.06 to 85.78) 6.42 (6.27 to 6.57) 0.83 (0.71 to 0.95) −5.59 (−5.79 to −5.39) Middle school 51.61 (51.25 to 51.98) 57.90 (57.54 to 58.25) 67.41 (67.08 to 67.75) 73.66 (73.11 to 74.21) 74.67 (74.12 to 75.22) 74.68 (74.08 to 75.27) 7.91 (7.66 to 8.16) 2.80 (2.59 to 3.01) −5.11 (−5.43 to −4.78) High school 34.59 (34.36 to 34.82) 35.99 (35.77 to 36.21) 43.65 (43.42 to 43.87) 50.30 (49.91 to 50.68) 52.98 (52.60 to 53.37) 50.92 (50.49 to 51.34) 4.59 (4.43 to 4.75) 3.11 (2.96 to 3.25) −1.48 (−1.70 to −1.27) College or higher education 34.40 (34.15 to 34.65) 30.08 (29.89 to 30.26) 36.26 (36.07 to 36.46) 42.57 (42.24 to 42.91) 45.64 (45.31 to 45.97) 40.91 (40.57 to 41.25) 1.45 (1.30 to 1.61) 2.35 (2.23 to 2.47) 0.90 (0.70 to 1.09) Household income Lowest quartile 71.74 (71.45 to 72.02) 71.44 (71.19 to 71.69) 78.68 (78.42 to 78.93) 80.15 (79.72 to 80.58) 77.67 (77.22 to 78.12) 76.79 (76.28 to 77.30) 3.50 (3.31 to 3.69) −0.57 (−0.74 to −0.40) −4.07 (−4.33 to −3.82) Second quartile 47.27 (47.04 to 47.49) 44.87 (44.67 to 45.07) 58.23 (58.01 to 58.44) 63.73 (63.37 to 64.09) 65.06 (64.70 to 65.42) 64.66 (64.26 to 65.06) 5.59 (5.43 to 5.74) 2.55 (2.41 to 2.69) −3.03 (−3.24 to −2.83) Third quartile 35.99 (35.74 to 36.25) 34.30 (34.08 to 34.52) 42.55 (42.32 to 42.79) 49.82 (49.40 to 50.24) 52.00 (51.58 to 52.42) 49.23 (48.76 to 49.69) 3.46 (3.29 to 3.63) 3.01 (2.85 to 3.16) −0.45 (−0.68 to −0.22) Highest quartile 36.10 (35.80 to 36.40) 34.28 (33.99 to 34.56) 39.47 (39.23 to 39.71) 45.95 (45.56 to 46.34) 49.64 (49.26 to 50.01) 44.31 (43.93 to 44.69) 1.96 (1.77 to 2.15) 2.41 (2.27 to 2.55) 0.45 (0.21 to 0.69) Economic activity Yes 39.66 (39.49 to 39.82) 38.54 (38.39 to 38.69) 45.77 (45.62 to 45.93) 51.62 (51.35 to 51.89) 54.12 (53.86 to 54.38) 48.23 (47.93 to 48.53) 3.19 (3.08 to 3.31) 1.88 (1.78 to 1.98) −1.31 (−1.47 to −1.16) No 59.56 (59.33 to 59.78) 57.45 (57.25 to 57.66) 64.21 (64.02 to 64.41) 67.44 (67.12 to 67.76) 67.62 (67.30 to 67.94) 65.62 (65.30 to 65.95) 2.51 (2.36 to 2.66) 0.76 (0.64 to 0.88) −1.75 (−1.94 to −1.56) Occupational categories Employer or owner 45.32 (45.07 to 45.57) 46.25 (46.01 to 46.50) 53.16 (52.91 to 53.41) 57.17 (56.73 to 57.62) 58.30 (57.86 to 58.74) 56.43 (55.97 to 56.89) 3.91 (3.74 to 4.09) 1.51 (1.35 to 1.67) −2.40 (−2.64 to −2.16) Wage and salary worker 34.89 (34.67 to 35.11) 33.64 (33.46 to 33.83) 41.28 (41.09 to 41.48) 48.55 (48.21 to 48.88) 51.89 (51.57 to 52.21) 42.63 (42.24 to 43.01) 3.45 (3.31 to 3.60) 2.08 (1.96 to 2.21) −1.37 (−1.56 to −1.18) Unemployed 59.54 (59.32 to 59.77) 57.42 (57.21 to 57.62) 64.17 (63.97 to 64.37) 67.44 (67.12 to 67.76) 67.62 (67.30 to 67.94) 65.62 (65.30 to 65.95) 2.50 (2.35 to 2.65) 0.78 (0.66 to 0.89) −1.72 (−1.91 to −1.53) Marital status Yes 44.20 (44.05 to 44.35) 47.45 (47.30 to 47.60) 55.05 (54.91 to 55.20) 61.41 (61.15 to 61.67) 63.05 (62.80 to 63.30) 59.49 (59.21 to 59.76) 5.43 (5.32 to 5.53) 2.22 (2.13 to 2.32) −3.21 (−3.35 to −3.07) No 58.55 (58.23 to 58.88) 40.42 (40.20 to 40.64) 47.09 (46.87 to 47.30) 51.46 (51.12 to 51.81) 52.34 (52.00 to 52.68) 49.34 (48.97 to 49.71) −3.63 (−3.82 to −3.44) 1.25 (1.12 to 1.38) 4.87 (4.64 to 5.10) Hypertension Yes 65.75 (65.49 to 66.00) 67.79 (67.56 to 68.02) 73.90 (73.70 to 74.11) 76.90 (76.56 to 77.24) 76.41 (76.08 to 76.74) 74.21 (73.85 to 74.57) 4.17 (4.01 to 4.33) 0.41 (0.29 to 0.54) −3.76 (−3.96 to −3.55) No 40.15 (40.00 to 40.31) 38.06 (37.93 to 38.20) 44.47 (44.32 to 44.61) 50.52 (50.28 to 50.77) 52.22 (51.97 to 52.46) 48.12 (47.86 to 48.39) 2.29 (2.19 to 2.40) 1.99 (1.90 to 2.08) −0.30 (−0.44 to −0.16) Diabetes Yes 66.27 (65.86 to 66.68) 68.68 (68.31 to 69.04) 74.09 (73.77 to 74.42) 77.34 (76.83 to 77.86) 76.19 (75.68 to 76.69) 73.72 (73.18 to 74.26) 3.99 (3.73 to 4.25) 0.16 (−0.03 to 0.35) −3.84 (−4.16 to −3.51) No 44.57 (44.43 to 44.72) 42.78 (42.65 to 42.91) 49.83 (49.70 to 49.96) 55.18 (54.96 to 55.40) 56.72 (56.50 to 56.94) 53.06 (52.82 to 53.30) 2.77 (2.68 to 2.87) 1.77 (1.68 to 1.85) −1.01 (−1.13 to −0.88) Unmet healthcare needs Insufficient 43.51 (43.14 to 43.88) 41.61 (41.26 to 41.96) 46.82 (46.39 to 47.25) 54.56 (53.63 to 55.49) 54.53 (53.58 to 55.47) 52.34 (51.36 to 53.33) 1.46 (1.18 to 1.75) 2.57 (2.26 to 2.89) 1.11 (0.69 to 1.53) Sufficient 47.17 (47.02 to 47.31) 45.78 (45.65 to 45.91) 53.01 (52.88 to 53.14) 57.93 (57.71 to 58.14) 59.35 (59.14 to 59.56) 55.97 (55.74 to 56.20) 3.12 (3.02 to 3.21) 1.60 (1.52 to 1.68) −1.52 (−1.64 to −1.39) Note. BMI, body mass index; CI, confidence interval; KCHS, Korea Community Health Survey. The beta values were multiplied by 100, owing to their minimal number. The figures in bold represent significant variance (P < 0.05). Table 2. Trends in the prevalence of influenza vaccination and β–coefficients before and during the COVID-19 pandemic (weighted % [95% CI]), based on data obtained from the KCHS
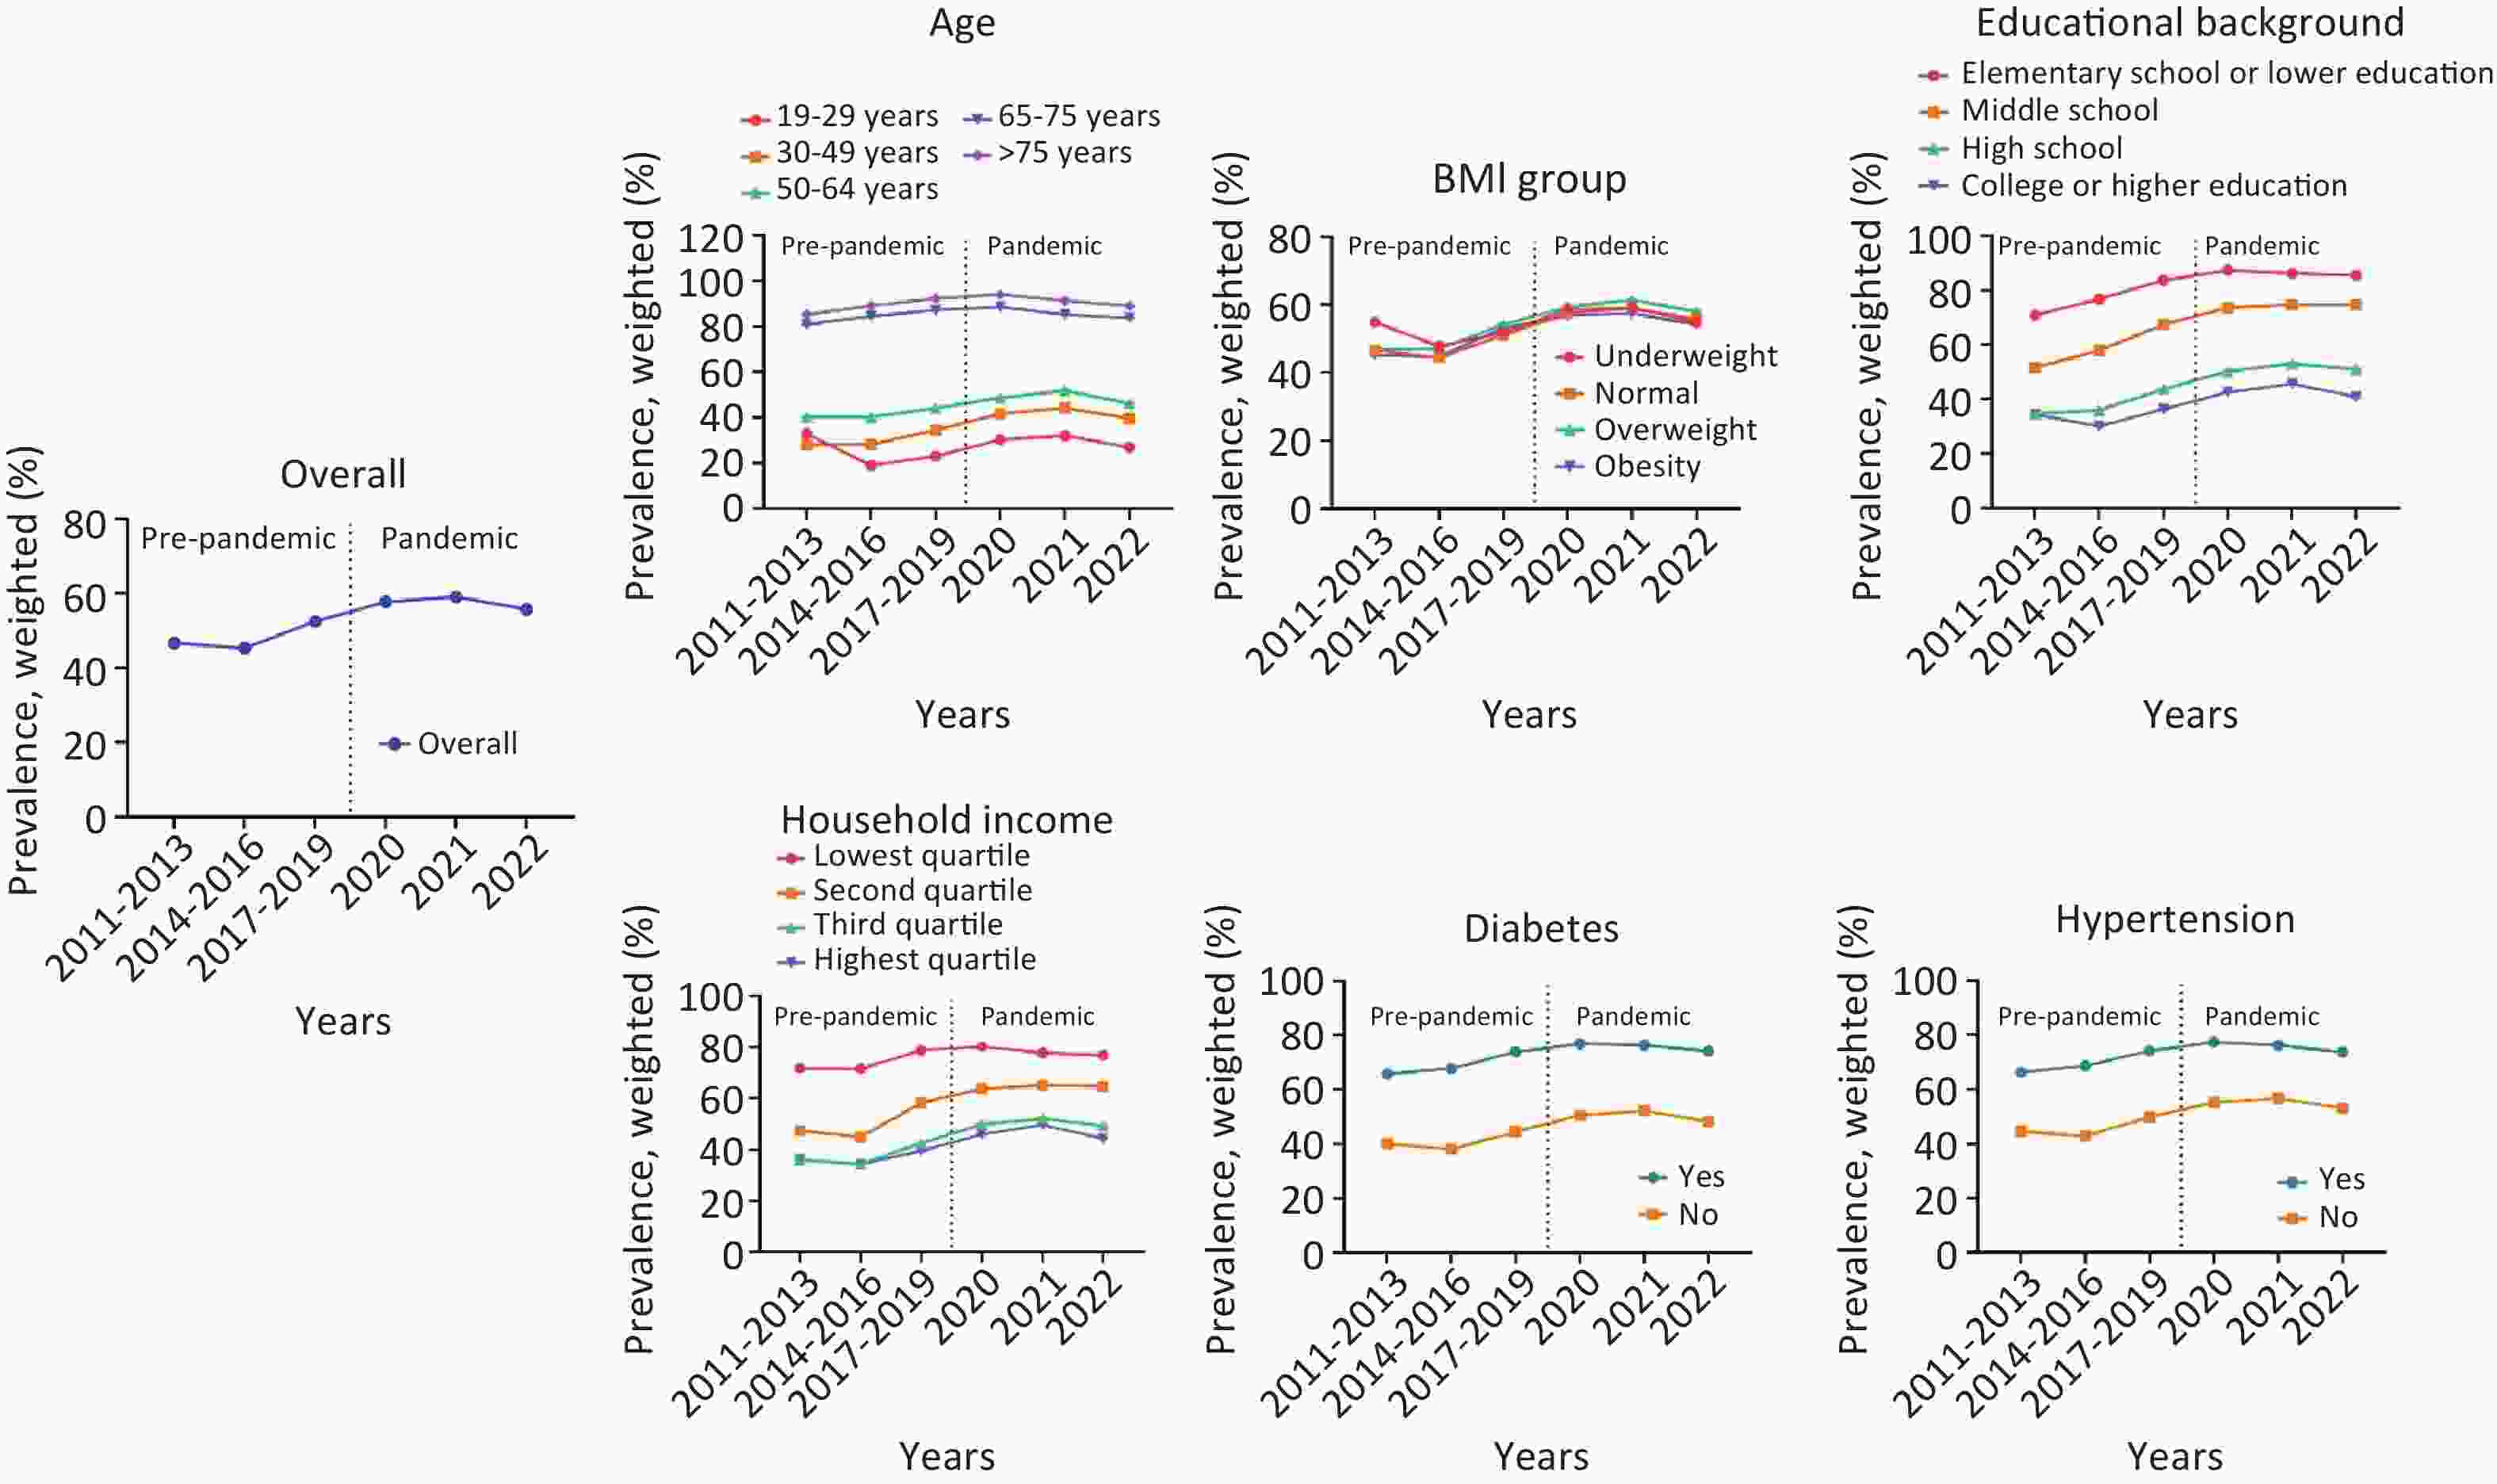
Figure 1. Nationwide trends in the prevalence of influenza vaccination before and during the COVID-19 pandemic (n=2,426,139).
Table 3 displays the ORs from an analysis conducted to investigate the annual trends of influenza vaccination rates in greater depth. The alterations in trends over the years, encompassing all factors, demonstrated a tendency to diminish from 2014 to 2016 compared with 2011 to 2013, followed by an increase from 2017 to 2019. Subsequently, there was a gradual increase until 2021, followed by a decrease in 2022 compared with 2021. When analyzing the years 2014–2016 in relation to 2011–2013, there was a sharp decrease in vaccination among those aged 19–29 years (OR: 0.48 [95% CI: 0.46 to 0.50]) and an increase in those aged ≥ 75 years (OR: 1.42 [95% CI: 1.37 to 1.47]). There was a decrease in vaccination in those who were underweight (OR: 0.75 [95% CI: 0.73 to 0.78]) and unmarried (OR: 0.48 [95% CI: 0.47 to 0.49]) and an increase in those with elementary school or lower education (OR: 1.37 [95% CI: 1.34 to 1.39]. When analyzing 2017–2019 in relation to 2014–2016, there was an increasing trend in all factors, especially age ≥ 75 years (OR: 1.47 [95% CI: 1.42 to 1.52], elementary school or lower education (OR: 1.54 [95% CI: 1.52 to 1.57]), and the second quartile of household income (OR: 1.71 [95% CI: 1.69 to 1.73]). When 2020 was analyzed in relation to 2017–2019, there was an increasing trend in all factors; in particular, there was a significant increase in vaccination among those aged 19–29 years (OR: 1.45 [95% CI: 1.40 to 1.50]). When analyzing 2021 in relation to 2020, most factors were similar. However, there was a significant decrease in vaccination among those aged 65–74 years (OR: 0.75 [95% CI: 0.72 to 0.79]) and ≥ 75 years (OR: 0.66 [95% CI: 0.62 to 0.70]). When analyzing 2022 in relation to 2021, there was a decreasing trend in all factors. In particular, there was a significant decrease in vaccination among those aged ≥ 75 years (OR: 0.78 [95% CI: 0.74 to 0.83], those who were economically active (OR: 0.79 [95% CI: 0.78 to 0.80]), and wage and salary workers (OR: 0.69 [95% CI: 0.68 to 0.70]).
2014–2016 versus 2011–2013 (reference) P-value 2017–2019 versus 2014–2016 (reference) P-value 2020 versus 2017–2019 (reference) P-value 2021 versus 2020 (reference) P-value 2022versus 2021 (reference) P-value Overall 0.95 (0.94
to 0.95)< 0.001 1.34 (1.33
to 1.34)< 0.001 1.24 (1.23
to 1.25)< 0.001 1.06 (1.05
to 1.07)< 0.001 0.87 (0.86
to 0.88)< 0.001 Age, years 19–29 0.48 (0.46
to 0.50)< 0.001 1.28 (1.25
to 1.32)< 0.001 1.45 (1.40
to 1.50)< 0.001 1.09 (1.05
to 1.13)< 0.001 0.79 (0.75
to 0.82)< 0.001 30–49 1.01 (0.99
to 1.03)0.116 1.34 (1.32
to 1.36)< 0.001 1.36 (1.33
to 1.38)< 0.001 1.11 (1.09
to 1.14)< 0.001 0.82 (0.80
to 0.84)< 0.001 50–64 1.00 (0.99
to 1.01)0.953 1.17 (1.16
to 1.19)< 0.001 1.20 (1.18
to 1.22)< 0.001 1.13 (1.11
to 1.15)< 0.001 0.80 (0.78
to 0.82)< 0.001 65–74 1.28 (1.25
to 1.31)< 0.001 1.26 (1.23
to 1.29)< 0.001 1.12 (1.08
to 1.17)< 0.001 0.75 (0.72
to 0.79)< 0.001 0.88 (0.85
to 0.92)< 0.001 ≥75 1.42 (1.37
to 1.47)< 0.001 1.47 (1.42
to 1.52)< 0.001 1.31 (1.25
to 1.39)< 0.001 0.66 (0.62
to 0.70)< 0.001 0.78 (0.74
to 0.83)< 0.001 Sex Men 0.90 (0.89
to 0.91)< 0.001 1.32 (1.31
to 1.34)< 0.001 1.21 (1.20
to 1.23)< 0.001 1.07 (1.05
to 1.08)< 0.001 0.92 (0.90
to 0.93)< 0.001 Women 0.99 (0.98
to 1.01)0.058 1.35 (1.33
to 1.36)< 0.001 1.26 (1.25
to 1.28)< 0.001 1.05 (1.04
to 1.07)< 0.001 0.83 (0.81
to 0.84)< 0.001 Region of residence Urban 0.93 (0.93
to 0.94)< 0.001 1.33 (1.32
to 1.35)< 0.001 1.26 (1.25
to 1.28)< 0.001 1.10 (1.08
to 1.12)< 0.001 0.86 (0.84
to 0.87)< 0.001 Rural 0.99 (0.98
to 1.01)0.168 1.34 (1.33
to 1.36)< 0.001 1.20 (1.18
to 1.22)< 0.001 1.01 (0.99
to 1.03)0.453 0.90 (0.88
to 0.91)< 0.001 BMI group Underweight (<18.5 kg/m2) 0.75 (0.73
to 0.78)< 0.001 1.17 (1.14
to 1.21)< 0.001 1.32 (1.26
to 1.38)< 0.001 1.02 (0.96
to 1.08)0.529 0.84 (0.80
to 0.89)< 0.001 Normal weight (18.5–22.9 kg/m2) 0.92 (0.91
to 0.93)< 0.001 1.31 (1.29
to 1.32)< 0.001 1.30 (1.28
to 1.32)< 0.001 1.07 (1.05
to 1.09)< 0.001 0.87 (0.85
to 0.89)< 0.001 Pre-obesity (23.0–24.9 kg/m2) 1.01 (0.99
to 1.02)0.385 1.34 (1.32
to 1.36)< 0.001 1.23 (1.21
to 1.26)< 0.001 1.09 (1.06
to 1.11)< 0.001 0.88 (0.85
to 0.90)< 0.001 Obesity (≥25.0 kg/m2) 0.98 (0.97
to 1.00)0.027 1.40 (1.38
to 1.42)< 0.001 1.16 (1.14
to 1.18)< 0.001 1.03 (1.00
to 1.05)0.020 0.88 (0.86
to 0.90)< 0.001 Education Elementary school or lower education 1.37 (1.34
to 1.39)< 0.001 1.54 (1.52
to 1.57)< 0.001 1.36 (1.31
to 1.40)< 0.001 0.90 (0.87
to 0.94)< 0.001 0.94 (0.90
to 0.98)0.001 Middle school 1.29 (1.26
to 1.32)< 0.001 1.50 (1.47
to 1.54)< 0.001 1.35 (1.31
to 1.40)< 0.001 1.05 (1.01
to 1.10)0.010 1.00 (0.96
to 1.04)1.000 High school 1.06 (1.05
to 1.08)< 0.001 1.38 (1.36
to 1.40)< 0.001 1.31 (1.28
to 1.33)< 0.001 1.11 (1.09
to 1.14)< 0.001 0.92 (0.90
to 0.94)< 0.001 College or higher education 0.82 (0.81
to 0.83)< 0.001 1.32 (1.31
to 1.34)< 0.001 1.30 (1.28
to 1.32)< 0.001 1.13 (1.11
to 1.15)< 0.001 0.83 (0.81
to 0.84)< 0.001 Household income Lowest quartile 0.99 (0.97
to 1.01)0.124 1.48 (1.45
to 1.50)< 0.001 1.10 (1.06
to 1.13)< 0.001 0.86 (0.83
to 0.89)< 0.001 0.95 (0.92
to 0.99)0.011 Second quartile 0.91 (0.90
to 0.92)< 0.001 1.71 (1.69
to 1.73)< 0.001 1.26 (1.24
to 1.28)< 0.001 1.06 (1.04
to 1.08)< 0.001 0.98 (0.96
to 1.01)0.141 Third quartile 0.93 (0.92
to 0.94)< 0.001 1.42 (1.40
to 1.44)< 0.001 1.34 (1.32
to 1.37)< 0.001 1.09 (1.07
to 1.12)< 0.001 0.90 (0.87
to 0.92)< 0.001 Highest quartile 0.92 (0.91
to 0.94)< 0.001 1.25 (1.23
to 1.27)< 0.001 1.30 (1.28
to 1.33)< 0.001 1.16 (1.13
to 1.19)< 0.001 0.81 (0.79
to 0.83)< 0.001 Economic activity Yes 0.95 (0.95
to 0.96)< 0.001 1.35 (1.33
to 1.36)< 0.001 1.26 (1.25
to 1.28)< 0.001 1.11 (1.09
to 1.12)< 0.001 0.79 (0.78
to 0.80)< 0.001 No 0.92 (0.91
to 0.93)< 0.001 1.33 (1.31
to 1.35)< 0.001 1.15 (1.14
to 1.17)< 0.001 1.01 (0.99
to 1.03)0.443 0.91 (0.90
to 0.93)< 0.001 Occupational categories Employer or owner 1.04 (1.02
to 1.05)< 0.001 1.32 (1.30
to 1.34)< 0.001 1.18 (1.15
to 1.20)< 0.001 1.05 (1.02
to 1.08)< 0.001 0.93 (0.90
to 0.95)< 0.001 Wage and salary worker 0.95 (0.93
to 0.96)< 0.001 1.39 (1.37
to 1.40)< 0.001 1.34 (1.32
to 1.36)< 0.001 1.14 (1.12
to 1.17)< 0.001 0.69 (0.68
to 0.70)< 0.001 Unemployed 0.92 (0.91
to 0.93)< 0.001 1.33 (1.31
to 1.34)< 0.001 1.16 (1.14
to 1.18)< 0.001 1.01 (0.99
to 1.03)0.443 0.91 (0.90
to 0.93)< 0.001 Marital status Yes 1.14 (1.13
to 1.15)< 0.001 1.36 (1.35
to 1.37)< 0.001 1.30 (1.28
to 1.32)< 0.001 1.07 (1.06
to 1.09)< 0.001 0.86 (0.85
to 0.87)< 0.001 No 0.48 (0.47
to 0.49)< 0.001 1.31 (1.30
to 1.33)< 0.001 1.19 (1.17
to 1.21)< 0.001 1.04 (1.02
to 1.06)< 0.001 0.89 (0.87
to 0.91)< 0.001 Hypertension Yes 1.10 (1.08
to 1.11)< 0.001 1.35 (1.33
to 1.37)< 0.001 1.18 (1.15
to 1.20)< 0.001 0.97 (0.95
to 1.00)0.044 0.89 (0.87
to 0.91)< 0.001 No 0.92 (0.91
to 0.92)< 0.001 1.30 (1.29
to 1.31)< 0.001 1.28 (1.26
to 1.29)< 0.001 1.07 (1.06
to 1.09)< 0.001 0.85 (0.84
to 0.86)< 0.001 Diabetes Yes 1.12 (1.09
to 1.14)< 0.001 1.30 (1.27
to 1.34)< 0.001 1.19 (1.15
to 1.24)< 0.001 0.94 (0.90
to 0.98)0.002 0.88 (0.84
to 0.91)< 0.001 No 0.93 (0.92
to 0.94)< 0.001 1.33 (1.32
to 1.34)< 0.001 1.24 (1.23
to 1.25)< 0.001 1.06 (1.05
to 1.08)< 0.001 0.86 (0.85
to 0.87)< 0.001 Unmet healthcare needs Insufficient 0.93 (0.91
to 0.95)< 0.001 1.24 (1.21
to 1.26)< 0.001 1.36 (1.31
to 1.42)< 0.001 1.00 (0.95
to 1.05)0.961 0.92 (0.87
to 0.97)0.002 Sufficient 0.95 (0.94
to 0.95)< 0.001 1.34 (1.33
to 1.35)< 0.001 1.22 (1.21
to 1.23)< 0.001 1.06 (1.05
to 1.07)< 0.001 0.87 (0.86
to 0.88)< 0.001 Note. BMI, body mass index; CI, confidence interval; KCHS, Korea Community Health Survey; OR, odds ratio. The figures in bold represent a significant variance (P < 0.05). Table 3. Weighted OR as an annual trend for influenza vaccination rates (weighted % [95% CI]), based on data obtained from the KCHS
Table 4 shows the risk factors for the vulnerable group among the influenza-vaccinated population, expressed as the ROR. Differences were observed among those who were susceptible to influenza vaccination: those aged 65–74 years (ROR: 0.69 [95% CI: 0.67 to 0.71]; reference 19–29 age group), rural dwellers (ROR: 0.88 [95% CI: 0.87 to 0.89]; reference urban), who had obesity (ROR: 0.88 [95% CI: 0.87 to 0.89]; reference normal weight), an educational level of high school graduation (ROR: 1.23 [95% CI: 1.20 to 1.25]; reference college or higher education), being in the lowest quartile of household income (ROR: 0.88 [95% CI: 0.86 to 0.90]; reference highest quartile), no economic activity (ROR: 0.89 [95% CI: 0.88 to 0.90]; reference yes), being unemployed (ROR: 0.83 [95% CI: 0.81 to 0.84]; reference wage and salary worker), being married (ROR: 1.46 [95% CI: 1.44 to 1.47]; reference no), diagnosis of hypertension (ROR: 0.88 [95% CI: 0.87 to 0.89]; reference no), and diagnosis of diabetes (ROR: 0.87 [95% CI: 0.86 to 0.89]; reference no).
Variables Overall (2011–2022) Before pandemic (2011–2019) During pandemic (2020–2022) Ratio of ORs (95% CI),
during pandemic versus before pandemic (reference)Weighted OR (95% CI) P-value Weighted OR (95% CI) P-value Weighted OR (95% CI) P-value Weighted OR (95% CI) P-value Age 19–29 1.00 (reference) 1.00 (reference) 1.00 (reference) 30–49 1.59 (1.57 to 1.60) < 0.001 1.60 (1.59 to 1.62) < 0.001 1.67 (1.64 to 1.71) < 0.001 1.04 (1.02 to 1.07) < 0.001 50–64 2.58 (2.56 to 2.61) < 0.001 2.74 (2.71 to 2.77) < 0.001 2.23 (2.19 to 2.27) < 0.001 0.82 (0.80 to 0.83) < 0.001 65–74 18.61 (18.39 to 18.83) < 0.001 20.59 (20.31 to 20.88) < 0.001 14.26 (13.95 to 14.59) < 0.001 0.69 (0.67 to 0.71) < 0.001 ≥75 28.60 (28.21 to 28.99) < 0.001 29.95 (29.47 to 30.43) < 0.001 25.41 (24.74 to 26.11) < 0.001 0.85 (0.82 to 0.88) < 0.001 Sex Men 1.00 (reference) 1.00 (reference) 1.00 (reference) Women 1.50 (1.50 to 1.51) < 0.001 1.51 (1.50 to 1.51) < 0.001 1.52 (1.51 to 1.54) < 0.001 1.01 (0.99 to 1.02) 0.053 Region of residence Urban 1.00 (reference) 1.00 (reference) 1.00 (reference) Rural 1.79 (1.79 to 1.80) < 0.001 1.86 (1.85 to 1.87) < 0.001 1.64 (1.63 to 1.66) < 0.001 0.88 (0.87 to 0.89) < 0.001 BMI group Normal weight 1.00 (reference) 1.00 (reference) 1.00 (reference) Underweight 1.07 (1.06 to 1.08) < 0.001 1.10 (1.08 to 1.11) < 0.001 1.00 (0.98 to 1.03) 0.777 0.91 (0.89 to 0.94) < 0.001 Pre-obesity 1.12 (1.12 to 1.13) < 0.001 1.13 (1.12 to 1.13) < 0.001 1.09 (1.08 to 1.10) < 0.001 0.97 (0.96 to 0.98) < 0.001 Obesity 1.06 (1.05 to 1.06) < 0.001 1.07 (1.07 to 1.08) < 0.001 0.95 (0.94 to 0.96) < 0.001 0.88 (0.87 to 0.89) < 0.001 Education College or higher education 1.00 (reference) 1.00 (reference) 1.00 (reference) Middle school 7.34 (7.29 to 7.39) < 0.001 7.47 (7.41 to 7.53) < 0.001 8.60 (8.45 to 8.74) < 0.001 1.15 (1.13 to 1.17) < 0.001 High school 3.12 (3.09 to 3.14) < 0.001 3.06 (3.03 to 3.08) < 0.001 3.74 (3.68 to 3.81) < 0.001 1.23 (1.20 to 1.25) < 0.001 Elementary school or lower education 1.29 (1.29 to 1.30) < 0.001 1.28 (1.27 to 1.29) < 0.001 1.39 (1.37 to 1.40) < 0.001 1.08 (1.07 to 1.10) < 0.001 Household income Highest quartile 1.00 (reference) 1.00 (reference) 1.00 (reference) Lowest quartile 4.58 (4.54 to 4.62) < 0.001 5.00 (4.96 to 5.05) < 0.001 4.41 (4.33 to 4.48) < 0.001 0.88 (0.86 to 0.90) < 0.001 Second quartile 1.69 (1.68 to 1.70) < 0.001 1.69 (1.67 to 1.70) < 0.001 2.11 (2.09 to 2.14) < 0.001 1.25 (1.23 to 1.27) < 0.001 Third quartile 1.01 (1.01 to 1.02) < 0.001 1.03 (1.02 to 1.04) < 0.001 1.17 (1.15 to 1.18) < 0.001 1.13 (1.12 to 1.15) < 0.001 Economic activity Yes 1.00 (reference) 1.00 (reference) 1.00 (reference) No 2.05 (2.04 to 2.06) < 0.001 2.12 (2.11 to 2.13) < 0.001 1.88 (1.86 to 1.90) < 0.001 0.89 (0.88 to 0.90) < 0.001 Occupational categories Wage and salary worker 1.00 (reference) 1.00 (reference) 1.00 (reference) Employer or owner 1.63 (1.62 to 1.64) < 0.001 1.72 (1.71 to 1.74) < 0.001 1.45 (1.44 to 1.47) < 0.001 0.84 (0.83 to 0.86) < 0.001 Unemployed 2.52 (2.51 to 2.54) < 0.001 2.65 (2.64 to 2.67) < 0.001 2.19 (2.16 to 2.21) < 0.001 0.83 (0.81 to 0.84) < 0.001 Marital status No 1.00 (reference) 1.00 (reference) 1.00 (reference) Yes 1.09 (1.08 to 1.09) < 0.001 1.00 (0.99 to 1.01) 0.247 1.46 (1.45 to 1.48) < 0.001 1.46 (1.44 to 1.47) < 0.001 Hypertension No 1.00 (reference) 1.00 (reference) 1.00 (reference) Yes 3.45 (3.43 to 3.47) < 0.001 3.54 (3.52 to 3.57) < 0.001 3.12 (3.09 to 3.16) < 0.001 0.88 (0.87 to 0.89) < 0.001 Diabetes No 1.00 (reference) 1.00 (reference) 1.00 (reference) Yes 2.84 (2.81 to 2.86) < 0.001 2.90 (2.88 to 2.93) < 0.001 2.54 (2.50 to 2.58) < 0.001 0.87 (0.86 to 0.89) < 0.001 Unmet healthcare needs Insufficient 1.00 (reference) 1.00 (reference) 1.00 (reference) Sufficient 1.24 (1.23 to 1.25) < 0.001 1.18 (1.17 to 1.19) < 0.001 1.18 (1.15 to 1.20) < 0.001 1.00 (0.98 to 1.02) 0.886 Note. BMI, body mass index; CI, confidence interval; KCHS, Korea Community Health Survey; OR, odds ratio. The figures in bold represent significant variance (P<0.05). Table 4. Ratio of weighted ORs for risk factors for the vulnerable group among influenza-vaccinated people before and during COVID-19 (weighted % [95% CI]), based on data obtained from the KCHS
-
We investigated a 12-year trend in influenza vaccine uptake from 2011 to 2022 and assessed the differences in vaccination rates before and during the COVID-19 pandemic (N = 2,426,139). Influenza vaccination rates increased steadily from 2011 (before the pandemic) to 2021 (during the pandemic), but a decrease in vaccination was observed in 2022. Vaccination rate decreased during the pandemic, especially among older adults (≥ 65 years), patients with chronic disease, and those with low levels of education and income. These findings suggest the need to develop tailored policy proposals for seasonal influenza to prepare for another potential large-scale spread of infectious diseases[17].
In South Korea, vaccination is free for individuals aged ≥ 65 years and children between 6 months and 12 years under the national influenza vaccination support initiative.18 The priority vaccination recommendation list encompasses individuals at a heightened risk of transmitting influenza to vulnerable populations and those prone to severe complications upon infection. The data presented in Table 3 show that vaccination rates decreased in 2021 compared with 2020, even though free vaccination was offered to individuals aged ≥ 65 years. In particular, a decrease in vaccination rates was observed in 2021 among high-risk groups with conditions such as hypertension and diabetes. These figures suggest a perceptible impact of the pandemic on attitudes toward influenza vaccination[9]. In particular, clinical results at initiating COVID-19 vaccination in 2021 could not determine the impact of double vaccination against COVID-19 and influenza vaccines on high-risk groups[19,20].
Overall, vaccination rates increased compared to pre-pandemic, except in 2022. However, the rate decreased among vulnerable groups eligible for free vaccination, indicating a voluntary refusal. Moreover, a decline in vaccination rates was noted among individuals with unmet healthcare needs. Overall, it is plausible that high-risk individuals avoided healthcare facilities owing to the heightened risk of SARS-CoV-2 exposure, leading to inevitable vaccine hesitancy[21].
In 2022, influenza vaccination rates declined across all demographics, with a particularly notable decrease among the old and high-risk groups. This trend underscores the influence of the prevailing societal sentiments. In 2021, concerns regarding the side effects of COVID-19 vaccination garnered attention in South Korea[22]. As the media grappled with reporting on these side effects, irrespective of the vaccine recipient, it contributed to growing societal hesitancy toward vaccination[23]. Such perceptions may have mirrored those surrounding influenza vaccination. Studies in the U.S. have reported that misinformation about vaccines has deepened distrust of healthcare systems, and a lack of information about vaccine benefits has reduced confidence in vaccines[24]. Studies in Hong Kong have reported that non-pharmaceutical interventions (including border restrictions, quarantine and isolation, social distancing, and changes in population behavior) significantly reduced influenza transmission during the COVID-19 pandemic[25,26]. South Korea also saw a significant reduction in COVID-19 transmission and influenza infections owing to government interventions[27]. This may have led to decreased people’s awareness of the risk of infection and reduced vaccination rates.
There are studies from different nations on influenza vaccination rates.9,28 The findings of an analysis contrasting vaccination rates before and during the pandemic for older adults (≥ 65 years) in numerous countries are outlined as follows: an 8.5% increase in the U.K., 13.0% in Spain, 5.4% in the U.S., and 9.0% in Australia[29]. Most nations exhibited a rise in vaccination rates during the pandemic compared with before. Conversely, South Korea documented a reduction of 10.2% in vaccination rates during the pandemic. This result could have stemmed from our investigation encompassing all individuals aged ≥ 19 years.
This study has several limitations. First, to investigate the global impact of COVID-19 on influenza vaccine uptake, additional studies are needed with data from South Korea and those pertaining to various ethnic groups and countries. Nevertheless, this study is meaningful because of the large nationally representative sample (N = 2,426,139). Second, because we used KCHS data, which included only adults ≥ 19 years, it was not possible to determine the trend among minors. However, as the impact of influenza vaccines is more severe in older adults, the current study is also sufficiently valuable. Third, the data were based on voluntary surveys of respondents, which cannot describe causal relationships among variables. Fourth, we were unable to account for the incidence of influenza infection, preventing us from assessing its influence on the trends in influenza vaccination rates.30 This may raise concerns about data reliability; however, this has already been verified through several other studies31 and should not affect the present results. Fifth, this study was conducted after the official declaration of the end of the pandemic on May 11, 2023. It is necessary to continuously monitor and analyze the trends in influenza vaccine uptake while conducting further studies in the future.
Despite these limitations, the present study has several notable strengths. We used large-scale, nationally representative population-based data to examine influenza vaccine uptake in South Korean adults. The trends of influenza vaccination according to various factors such as age, sex, residential area, educational level, income status, hypertension, diabetes, and unmet healthcare needs were identified. These factors were important in influenza vaccination during the pandemic[32].
Before the COVID-19 pandemic, the uptake of influenza vaccines in South Korea was already high owing to factors such as the annual vaccination recommendation and the expansion of the scope of free vaccination[10]. However, despite the expansion of free vaccination programs during the pandemic, influenza vaccination rates declined among older adults and economically vulnerable groups. This underscores the need for new and improved policies to address this issue. Efforts should be made to improve various policy proposals and awareness to increase the vaccination rate again now that the pandemic is over[33]. To mitigate similar challenges in the future, it is necessary to not only improve the production capacity of medical supplies, such as vaccines and treatments but also to ensure the availability of infrastructure that facilitates their active administration. As this study highlights, active policy proposals should be made for older adults and high-risk individuals[34]. As public health measures have been eased, the overall population antibody levels and virus mutations have decreased, increasing the risk of influenza infection. We also suggest the importance of public health measures because the higher the chance of exposure to the virus, the higher the infection rate[30,35,36]. It is important to pay special attention to personal quarantine and to follow personal hygiene advice, such as washing hands frequently and not touching the eyes, nose, and mouth with unwashed hands[37]. Additionally, a follow-up study on individuals who have undergone vaccination for both influenza and COVID-19 should be conducted to help develop a vaccine for new infectious diseases in the future.
-
We investigated the impact of the COVID-19 pandemic on the tendency of influenza vaccine uptake trends in South Korea. Influenza vaccination rates increased steadily from 2011, before the pandemic, to 2020, during the pandemic, but a significant decrease was observed in 2022. Despite implementing the national influenza vaccination support initiative, the vaccination rate declined among older adults and high-risk population groups. It is suggested that the pandemic preparedness measures and social environment influenced this decline. Increased focus on research and continued development of infectious disease control strategies for high-risk populations is essential.
National Trends in Influenza Vaccination Rates in South Korea Before and During the COVID-19 Pandemic, 2011–2022
doi: 10.3967/bes2025.061
- Received Date: 2024-11-06
- Accepted Date: 2025-04-07
-
Key words:
- Influenza vaccination /
- COVID-19 pandemic /
- South Korea /
- Epidemiology
Abstract:
The authors declare that they have no competing interests.
The Korea Community Health Survey data for the years covered by this study were anonymized, and written informed consent was obtained from all participants prior to the study. The study protocol was approved by the Institutional Review Board of the Korea Disease Control and Prevention Agency (2010-02CON-22-P, 2011-05CON04-C, 2012-07CON-01-2C, 2013-06EXP-01-3C, 2014-08EXP-09-4CA, and 2016-10-01-TA), the local law of state-approved statistics (approval, 117075), and the Enforcement Regulation (Article 2, Paragraph 2, Item 1) of the Bioethics and Safety Act by the South Korean government. Ethical considerations were upheld, adhering to the Declaration of Helsinki.
&These authors contributed equally to this work.
| Citation: | Kyeongeun Kim, Kyeongmin Lee, Yejun Son, Seoyoung Park, Raphael Udeh, Jiseung Kang, Hayeon Lee, Soeun Kim, Jaeyu Park, Hyeon Jin Kim, Damiano Pizzol, Lee Smith, Jiyoung Hwang, Dong Keon Yon. National Trends in Influenza Vaccination Rates in South Korea Before and During the COVID-19 Pandemic, 2011–2022[J]. Biomedical and Environmental Sciences. doi: 10.3967/bes2025.061

|

 Quick Links
 DownLoad: