
-
Type 2 diabetes mellitus (T2DM) is a global epidemic affecting nearly 425 million individuals worldwide. A recent report by the International Diabetes Federation (IDF) estimates that this number will rise to 783.2 million by 2045[1]. Vitamin D has recently attracted significant attention due to its pleiotropic effects on skeletal health[2]. Observational studies have consistently reported lower serum 25-hydroxyvitamin D [25-[OH]-D] concentrations in populations[2]. Vitamin D modulates glycemic control, insulin secretion, and insulin sensitivity[3], and regulates serum calcium concentrations[4]. Insulin synthesis and secretion are calcium-dependent processes that are indirectly influenced by vitamin D[5]. In addition, vitamin D regulates nuclear peroxisome proliferator-activated receptors (PPARs)[6], which reduce the expression of pro-inflammatory cytokines involved in insulin resistance, such as interleukin (IL)-1, IL-6, and tumor necrosis factor (TNF)-α[7,8].
However, several randomized controlled trials (RCTs) and Mendelian randomization (MR) analyses have not supported a causal relationship, indicating the need for caution when considering vitamin D supplementation in diabetes prevention strategies[9-11]. These inconsistencies may result from variations in study design, including differences in vitamin D dose, supplementation duration, and form (vitamin D2 or D3)[12]. Furthermore, the efficacy of vitamin D supplementation may vary depending on individual health status, such as diabetic versus non-diabetic condition, type of diabetes (type 1 or 2), and the presence of comorbidities and multimorbidities[13]. Supplementation strategies differ in clinical settings, and a consensus regarding their comparative efficacy has yet to be established, complicating clinical decision making.
Although several systematic reviews and meta-analyses have assessed some positive effects of oral vitamin D supplementation in the treatment of T2DM, none have quantitatively evaluated the impact of different supplementation strategies[14-17]. Unlike traditional pairwise meta-analyses, which are limited to direct comparisons between interventions evaluated in RCTs, network meta-analyses synthesize both direct and indirect evidence. This methodology allows for comparison of multiple interventions, even in the absence of head-to-head trials, and provides a relative ranking of treatment options[18]. Therefore, in this study, we aimed was to evaluate the effects of different vitamin D supplementation forms and doses on fasting blood glucose (FBG), hemoglobin A1c (HbA1c), fasting insulin (FIN), and homeostasis model assessment of insulin resistance (HOMA-IR) in individuals with T2DM, using a network meta-analysis to determine the relative efficacy of available vitamin D dosing strategies.
-
This study was conducted in accordance with the Preferred Reporting Items for Systematic Reviews and Meta-Analyses for Network Meta-Analysis (PRISMA-NMA)[19]. The protocol for this systematic review and meta-analysis was registered with the International Prospective Register of Systematic Reviews (PROSPERO) (CRD42024619491).
-
PubMed, EMBASE, Cochrane Library, and Web of Science were systematically searched from inception to September 12, 2024, using the following terms and their synonyms: “Diabetes Mellitus, Type 2,” “Vitamin D,” “Cholecalciferol,” “Ergocalciferols,” and “Randomized Controlled Trials.” The search strategy combined Medical Subject Headings (MeSH) and free-text terms. The search was restricted to articles published in English. Detailed search strategies for all databases are provided in Supplementary Method S1.
-
Studies were included in the analysis if they met all of the following: (i) conducted on adults (≥ 18 y) with T2DM (excluding other types of diabetes); (ii) participants in the study group received oral vitamin D2 or D3 in any form; (iii) the control group received placebo rather than oral vitamin D; (iv) reported at least one of the following outcomes: serum FBG, 25-(OH)-D, HbA1c, FIN, or HOMA-IR; and (v) RCTs.
-
Studies were excluded based on the following criteria: (i) ineligible study designs, including case reports, case series, conference abstracts, or other observational studies; (ii) inclusion of participants with type 1 diabetes, gestational diabetes, prediabetes, diabetes-related complications, or conditions that could alter vitamin D metabolism; (iii) sample size of fewer than 10 participants; (iv) duplicate publications; (v) follow-up duration of less than 3 months; and (vi) intramuscular administration of vitamin D.
-
All references retrieved from electronic database searches were imported into EndNote X9, and duplicates were automatically removed. Two authors (Xiujuan Zhang and Hongfei Wang) independently screened the titles and abstracts, and reviewed full texts when necessary. Discrepancies were resolved by discussion with the corresponding author.
-
Two authors (Xiujuan Zhang and Hongfei Wang) independently extracted data using a standardized, predesigned data extraction form. Inter-reviewer agreement on study selection and quality assessment was evaluated using the kappa coefficient. Extracted data included: study characteristics (study name, year of publication, registration ID, country, and follow-up duration), participant characteristics [sample size, intervention, percentage of female participants, mean age, and body mass index (BMI)], outcome measures [FBG, 25-(OH)-D, HbA1c, FIN, and HOMA-IR], and methodological quality metrics. Unit conversions were standardized as follows: FBG: 1 mg/dL = 0.0555 mmol/L; 25-(OH)-D: 1 ng/mL = 2.5 nmol/L; and serum insulin: 1 pmol/L = 0.167 μIU/mL. For missing data, we contacted corresponding authors to obtain raw values. Net changes in standard deviations (SDs) were calculated using the Cochrane-recommended formula:
$$ \begin{aligned} SD\left(netchange\right)= \sqrt{\begin{aligned} {SD\left(baseline\right)}^{2}+{SD\left(endpoint\right)}^{2}- 2R\times SD\left(baseline\right)\times SD\left(endpoint\right) \end{aligned}} \end{aligned}$$ with a correlation coefficient (R) of 0.5[20]. When outcomes were reported as medians, standard errors, or interquartile ranges (IQRs), standard methods were used to derive the required values[21].
-
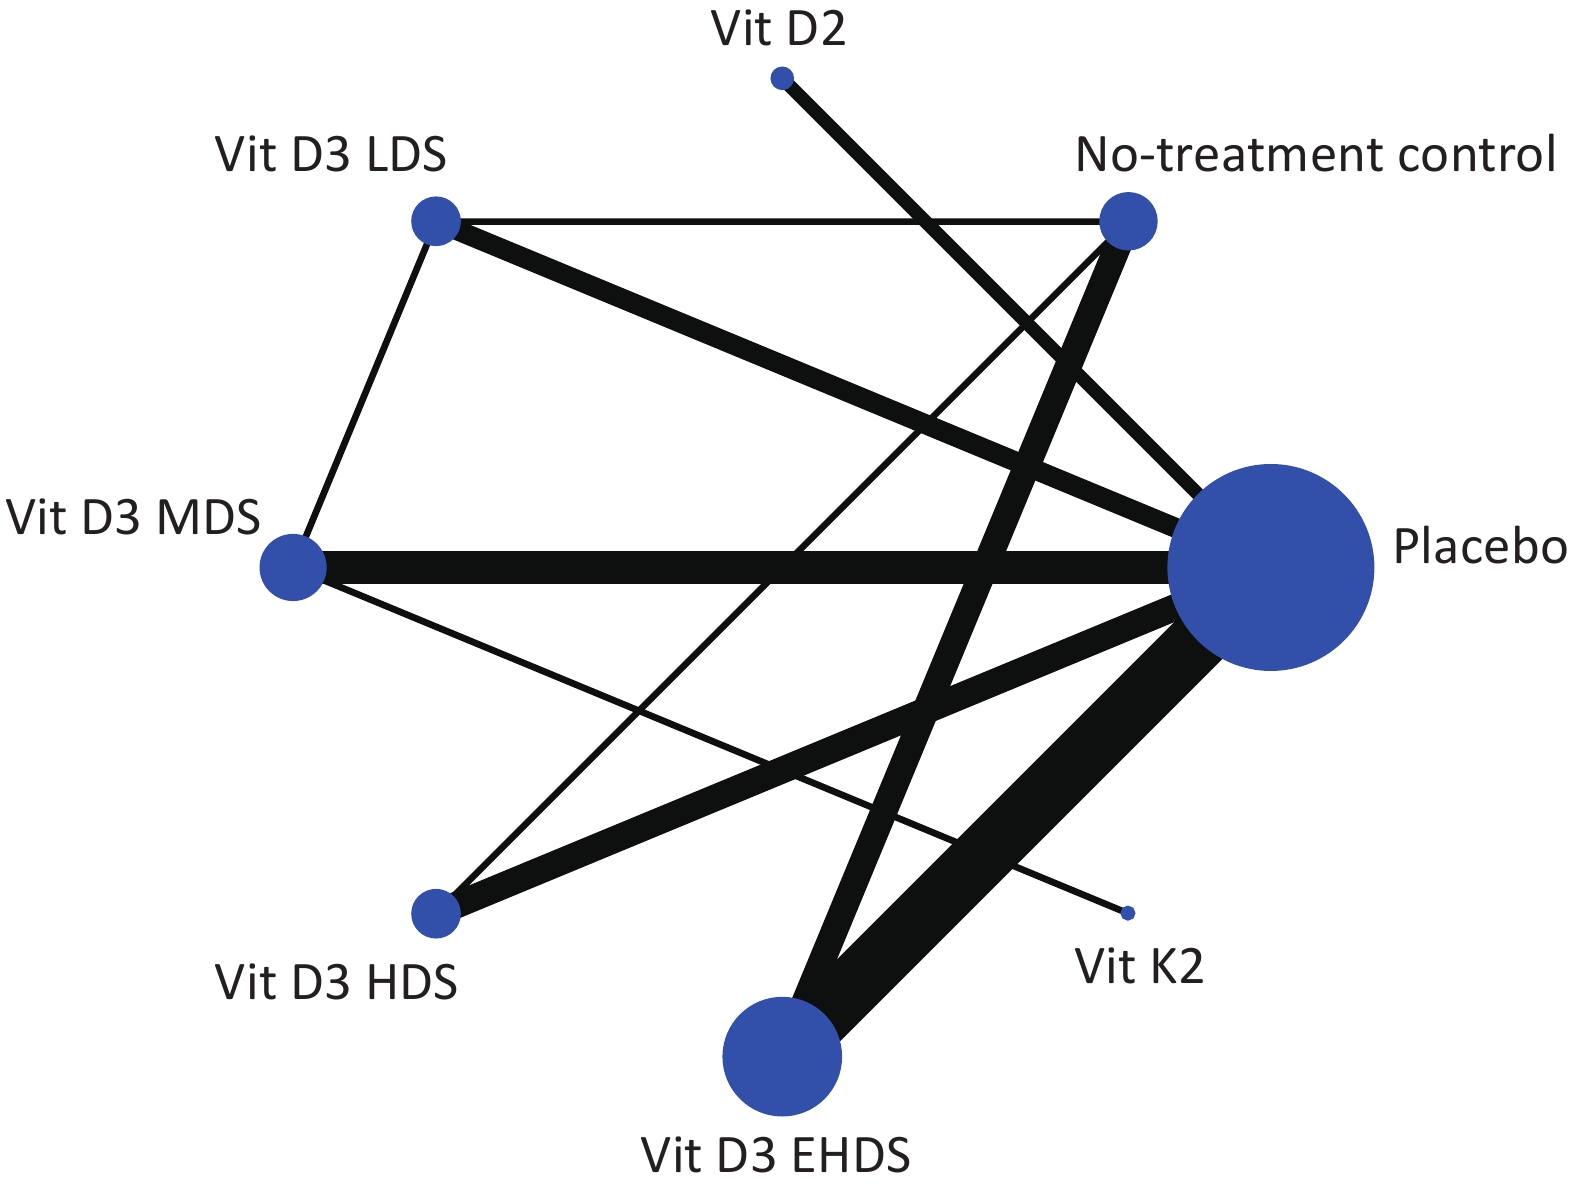
Network plots were created to visualize the evidence for each outcome assessed. Nodes represent treatments (e.g., vitamin D₂, vitamin D₃, vitamin K₂, and placebo), and lines represent direct comparisons. Node size is proportional to the total number of participants receiving a treatment, and line width reflects the number of direct comparisons between treatments.
-
Two independent authors assessed risk of bias in the included RCTs using the revised Cochrane Risk of Bias Tool (RoB 2)[22], evaluating the following domains: (i) bias arising from the randomization process, (ii) bias due to deviations from intended interventions, (iii) bias due to missing outcome data, (iv) bias in measurement of outcomes, and (v) bias in selection of reported results. Each domain was rated as “low risk,” “some concerns,” or “high risk.” Overall risk was classified as: “low risk of bias” if all domains were rated low; “some concerns” if at least one domain had some concerns but none were high risk; and “high risk of bias” if one or more domains were rated high risk or multiple domains had some concerns[23]. Disagreements were resolved through discussion or consultation with the corresponding author.
-
The included studies differed in vitamin D dosage and frequency of administration. To enhance comparability, intermittent vitamin D intake was converted to a daily dose by calculating the average daily intake. The mean differences (MDs) and corresponding 95% confidence intervals (CIs) were calculated for all outcomes, as all were continuous variables. Owing to heterogeneity in regimens, such as varying dosages and administration frequencies, a standard random effects model was applied to yield more conservative estimates of effect size. A random effects network meta-analysis was performed using the “mvmeta” command[24]. Prior to network meta-analysis, global and local inconsistency were evaluated using the design-by-treatment model and the node-splitting method, respectively[25,26]. Based on the inconsistency results, an appropriate model was selected for the network meta-analysis of each outcome. Treatment strategies were then ranked based on cumulative ranking probabilities, calculated using the surface under the cumulative ranking curve (SUCRA)[27]. A loop inconsistency assessment was also performed to evaluate the robustness of the pooled estimates[28]. Prediction intervals and I² statistics were used to quantify between-study heterogeneity[29-31]. Funnel plots and Egger test were used to evaluate publication bias and small-study effects[32]. Sensitivity analyses were conducted after excluding studies at high risk of bias. A network contribution plot was used to assess the contribution of each study to the network estimates and to examine the stability and credibility of the results. All statistical analyses for the network meta-analysis were performed using Stata, version 17.0 (StataCorp LP, College Station, Texas, USA).
-
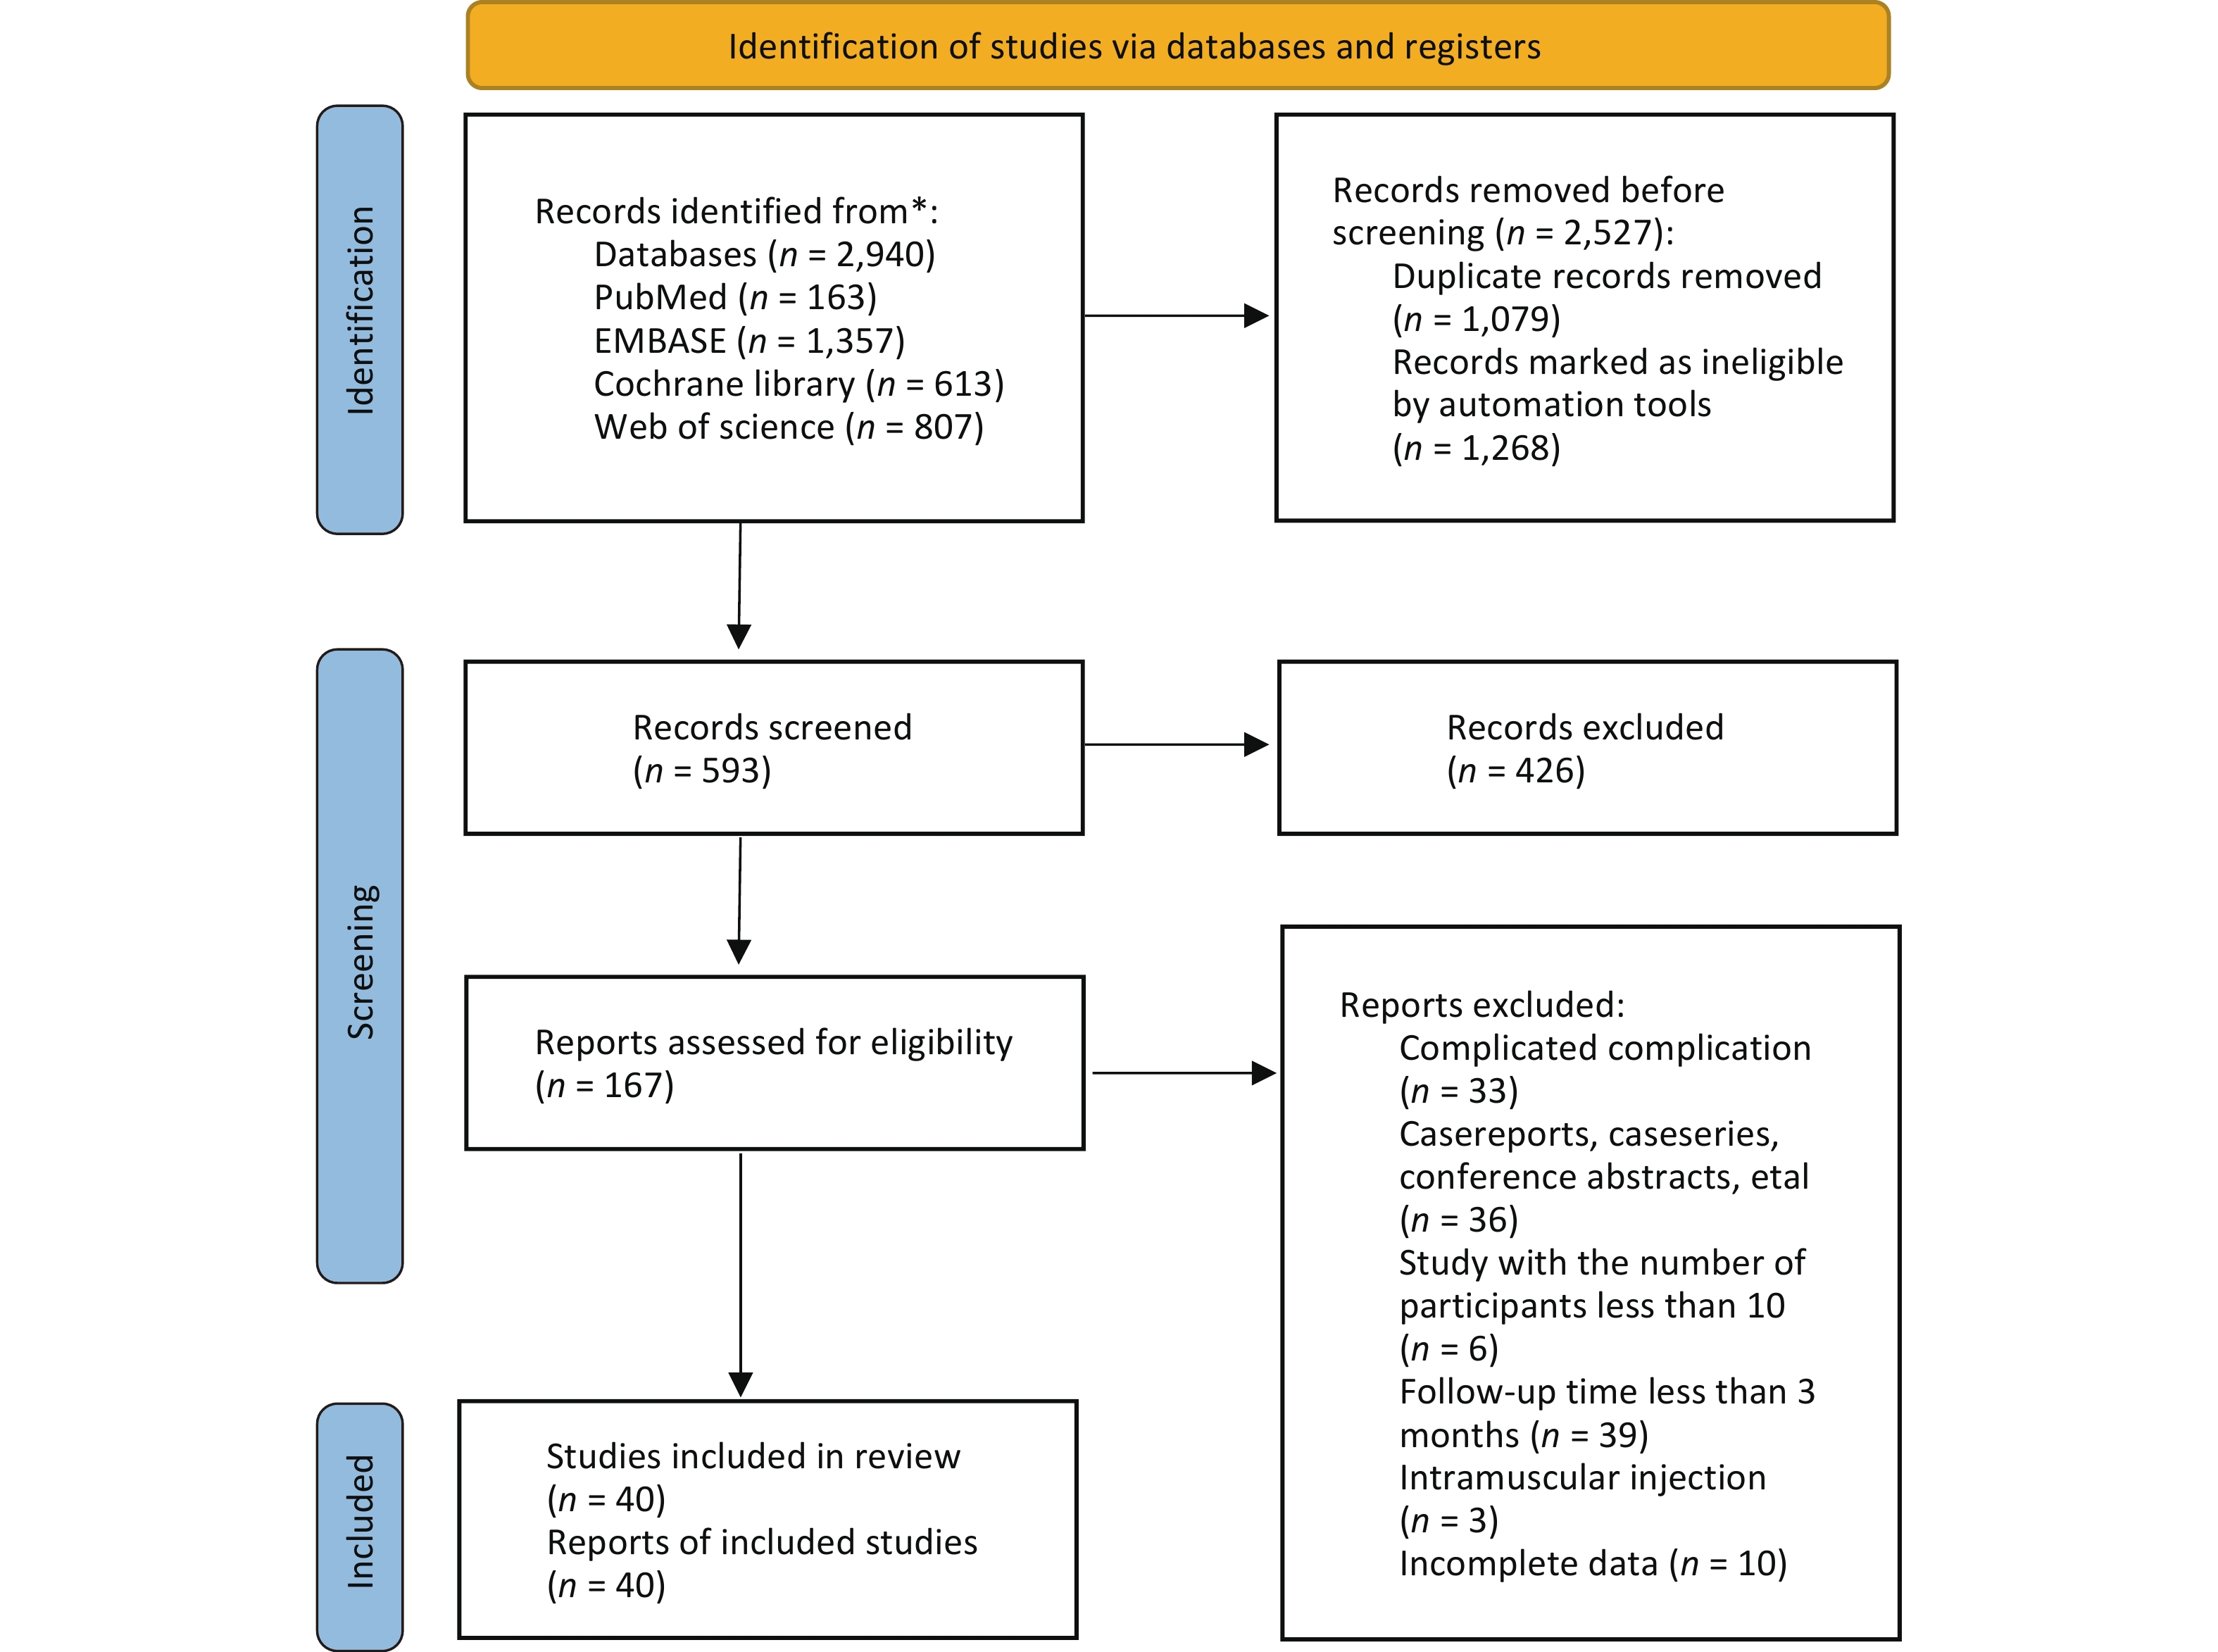
A total of 2,940 potentially relevant studies were identified across the four target databases. Of these, 1,079 duplicates and 1,268 studies deemed ineligible by automated tools were removed using EndNote software. The titles and abstracts of the remaining 167 studies were screened, leading to the exclusion of 127 studies. Ultimately, 40 studies were included in the network meta-analysis[33-72]. The study selection process is illustrated in Figure 1.
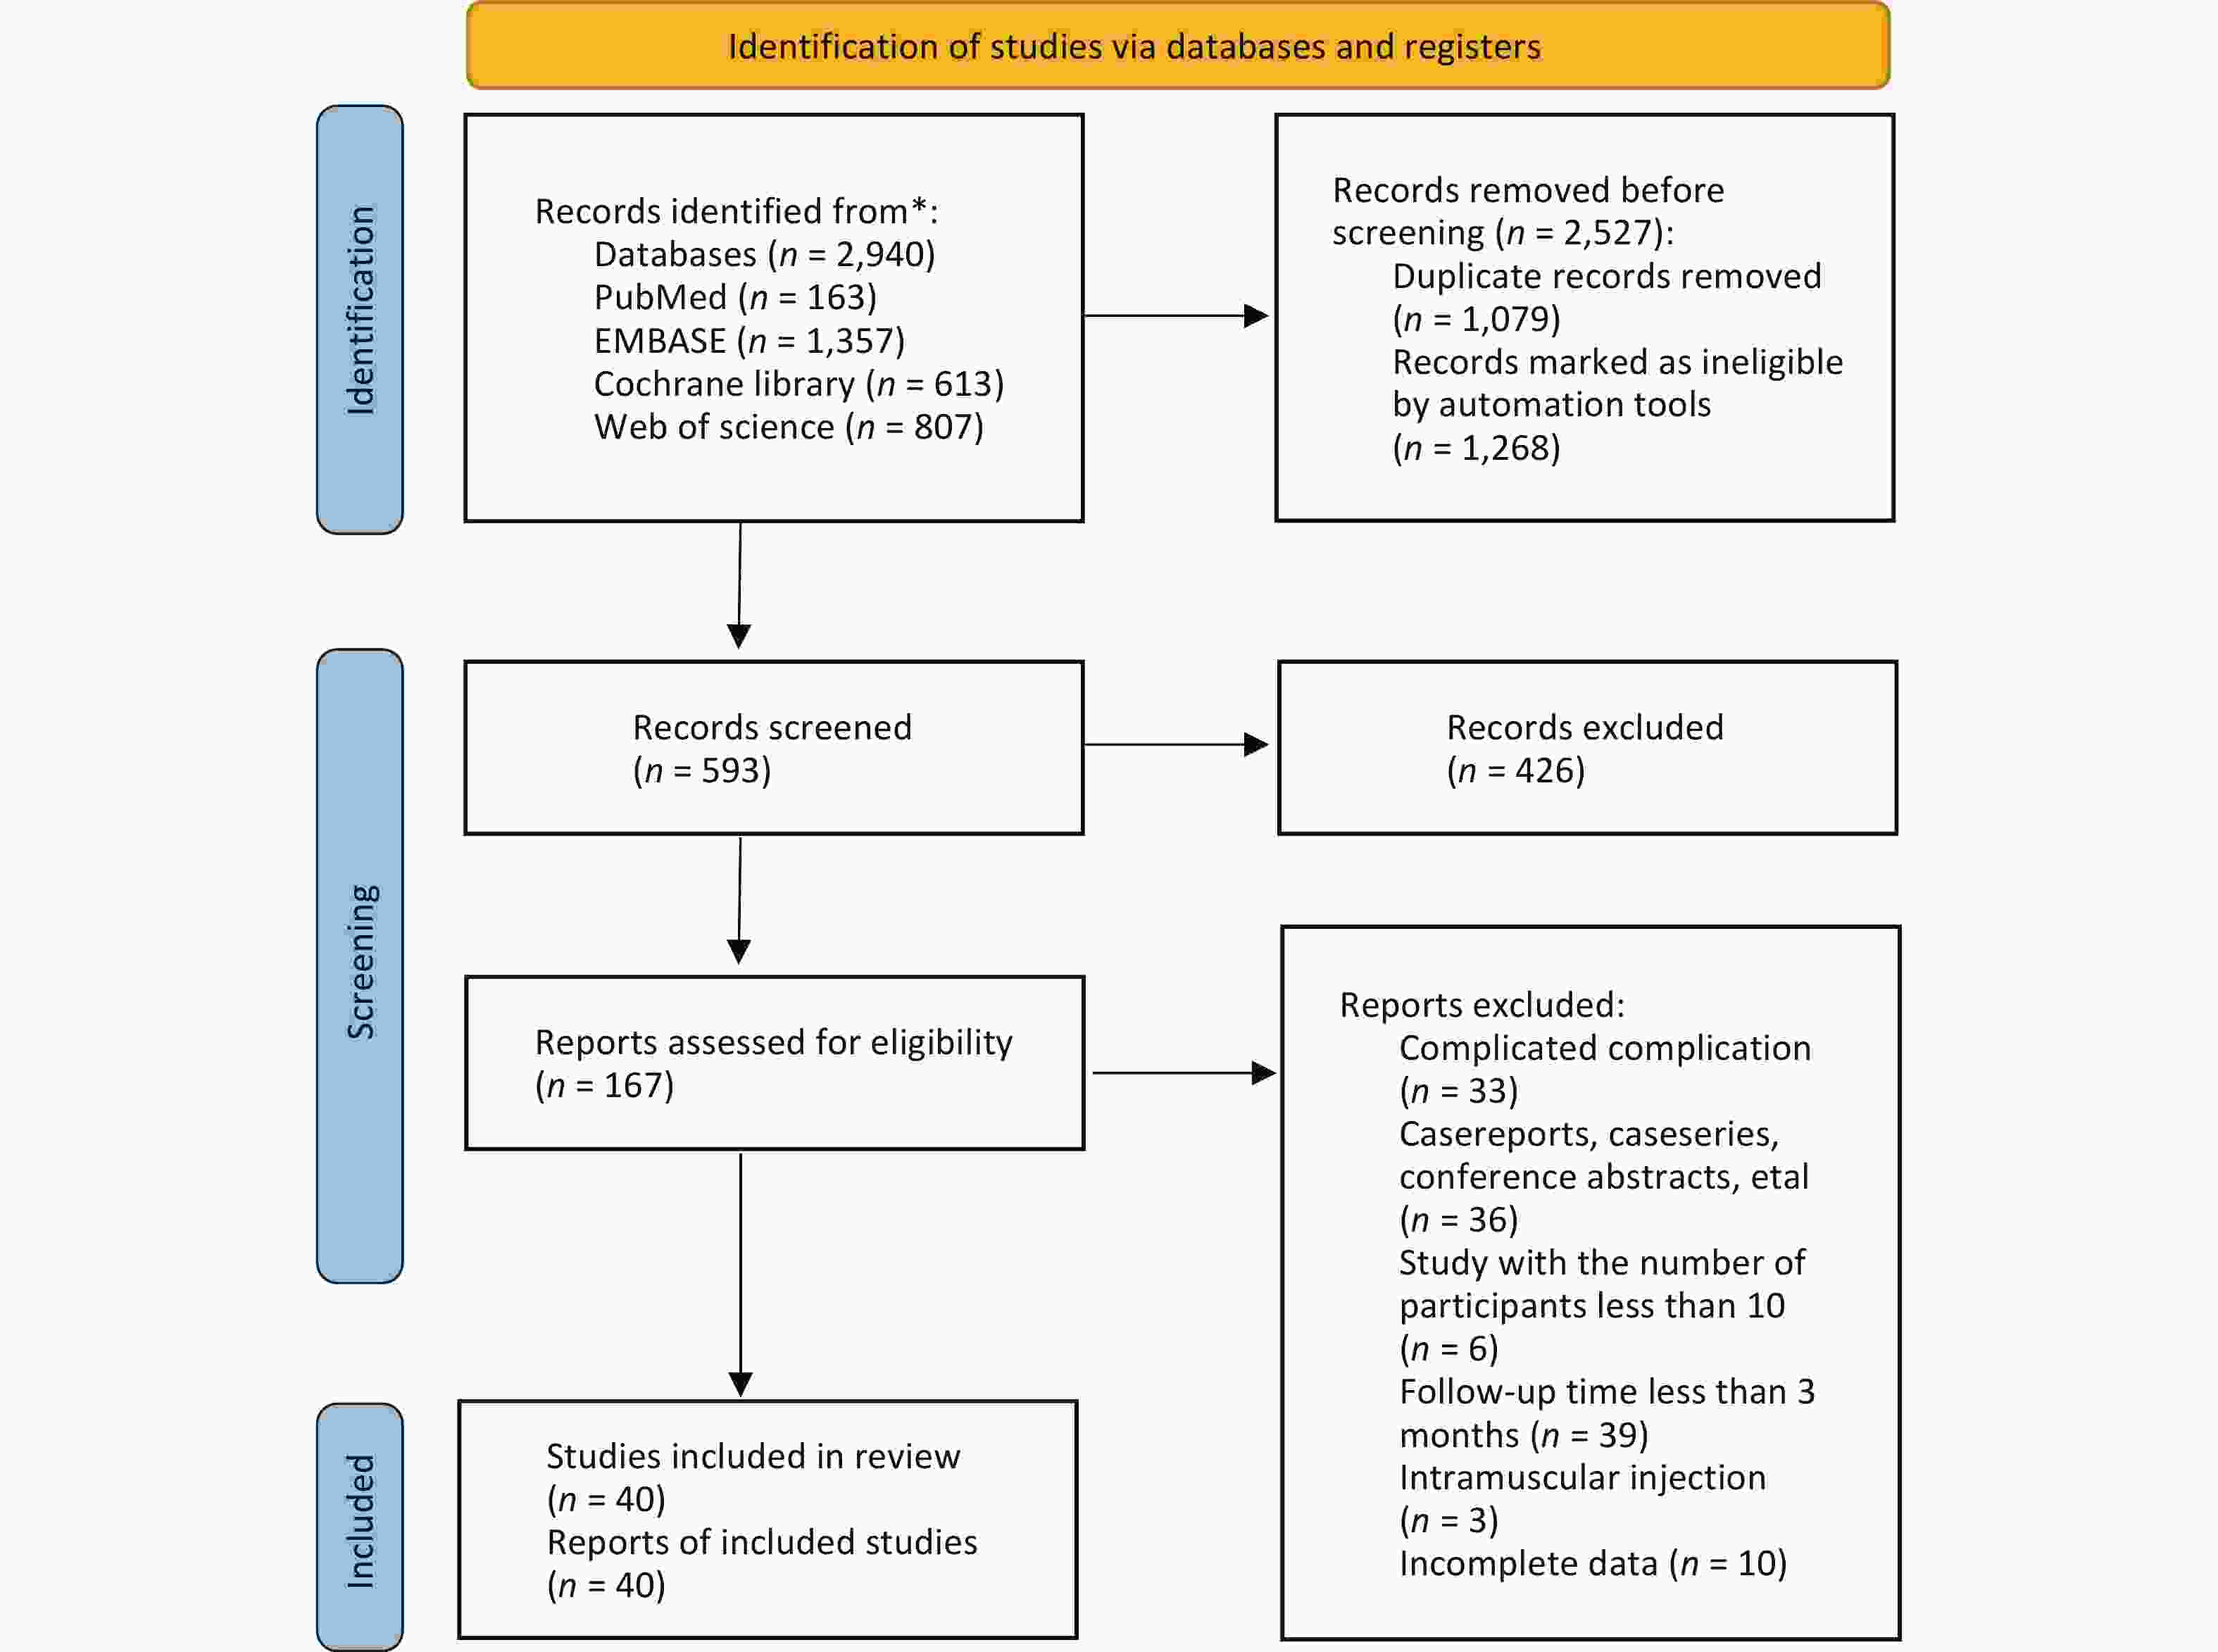
Figure 1. Flowchart of study retrieval and selection.
-
All included studies were published between 2009 and 2024. The sample sizes ranged from 15 to 1,121 participants, with a combined total of 4,181 participants. Various dosage strategies of vitamin D supplementation were reported. These were categorized as low (< 1,000 IU/day; LDS), medium (1,000–2,000 IU/day; MDS), high (2,000–4,000 IU/day; HDS), and extremely high (≥ 4,000 IU/day; EHDS). Baseline characteristics of all included studies are summarized in Supplementary Table S1. Evidence plots for FBG are shown in Figure 2; evidence for 25-(OH)-D, HbA1c, FIN, and HOMA-IR is presented in Supplementary Figure S1. Three studies administered fortified yogurt[34,58,65], and three administered vitamin D2[40,54,55]. Vitamin D was administered daily in 26 studies[33-39,41-43,49,51-55,58,61-65,67-69,71], weekly in 12 studies[40,44,45,47,48,50,57,59,60,66,70,72], biweekly in one study[46], a and as a single dose in one study. In the latter, a second dose was administered four weeks later if serum 25-(OH)-D was < 100 nmol/L[56]. Results of the risk of bias assessment are shown in Supplementary Figure S2. Eight studies (20%) were judged to have “some concerns”[35,38,41,45,52,53,61,70], and ten studies (25%) were judged to have “high risk”[33,36,46,48,59,60,66,67,71,72]. Most studies were considered to be at low risk of bias.
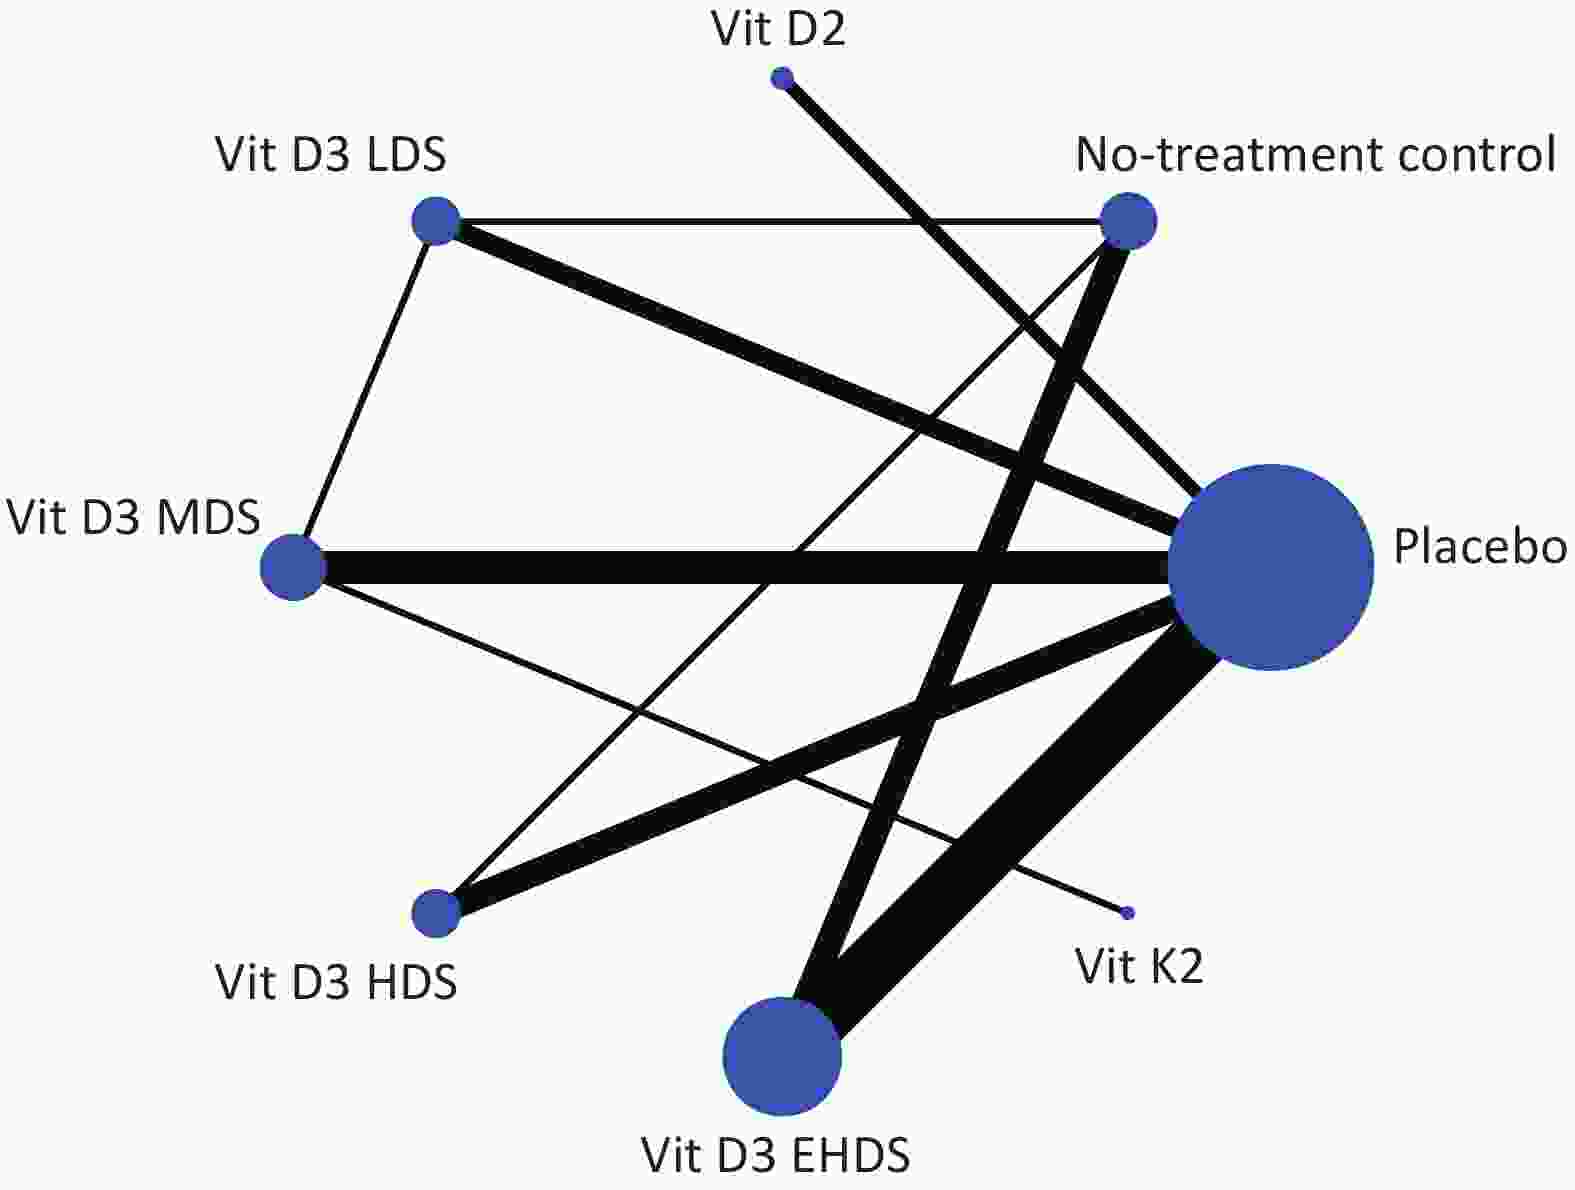
Figure 2. Evidence plots of FBG; LDS, low dose strategy; MDS, medium dose strategy; HDS, high dose strategy; EHDS, extremely high dose strategy; FBG, fasting blood glucose.
-
A network meta-analysis of FBG levels was performed using a consistency model, as no significant global or local inconsistency was detected (Supplementary Figure S3, Table S2). As shown in Figure 3, pooled results indicated that vitamin D2 significantly reduced FBG levels compared to placebo (MD: –0.81; 95% CI: –1.47 to –0.16) and no treatment (MD: –1.13; 95% CI: –1.92 to –0.33). EHDS also reduced FBG levels compared to no treatment (MD: –0.56; 95% CI: –0.99 to –0.13). No other comparisons among strategies reached statistical significance. Estimated ranking probabilities for all treatment strategies are shown in Figure 4; numerical results are also presented in Figure 4. Forest plot results are shown in Supplementary Figure S4. Supplementary Figure S5 presents the direct and indirect contributions of each study to the overall results.
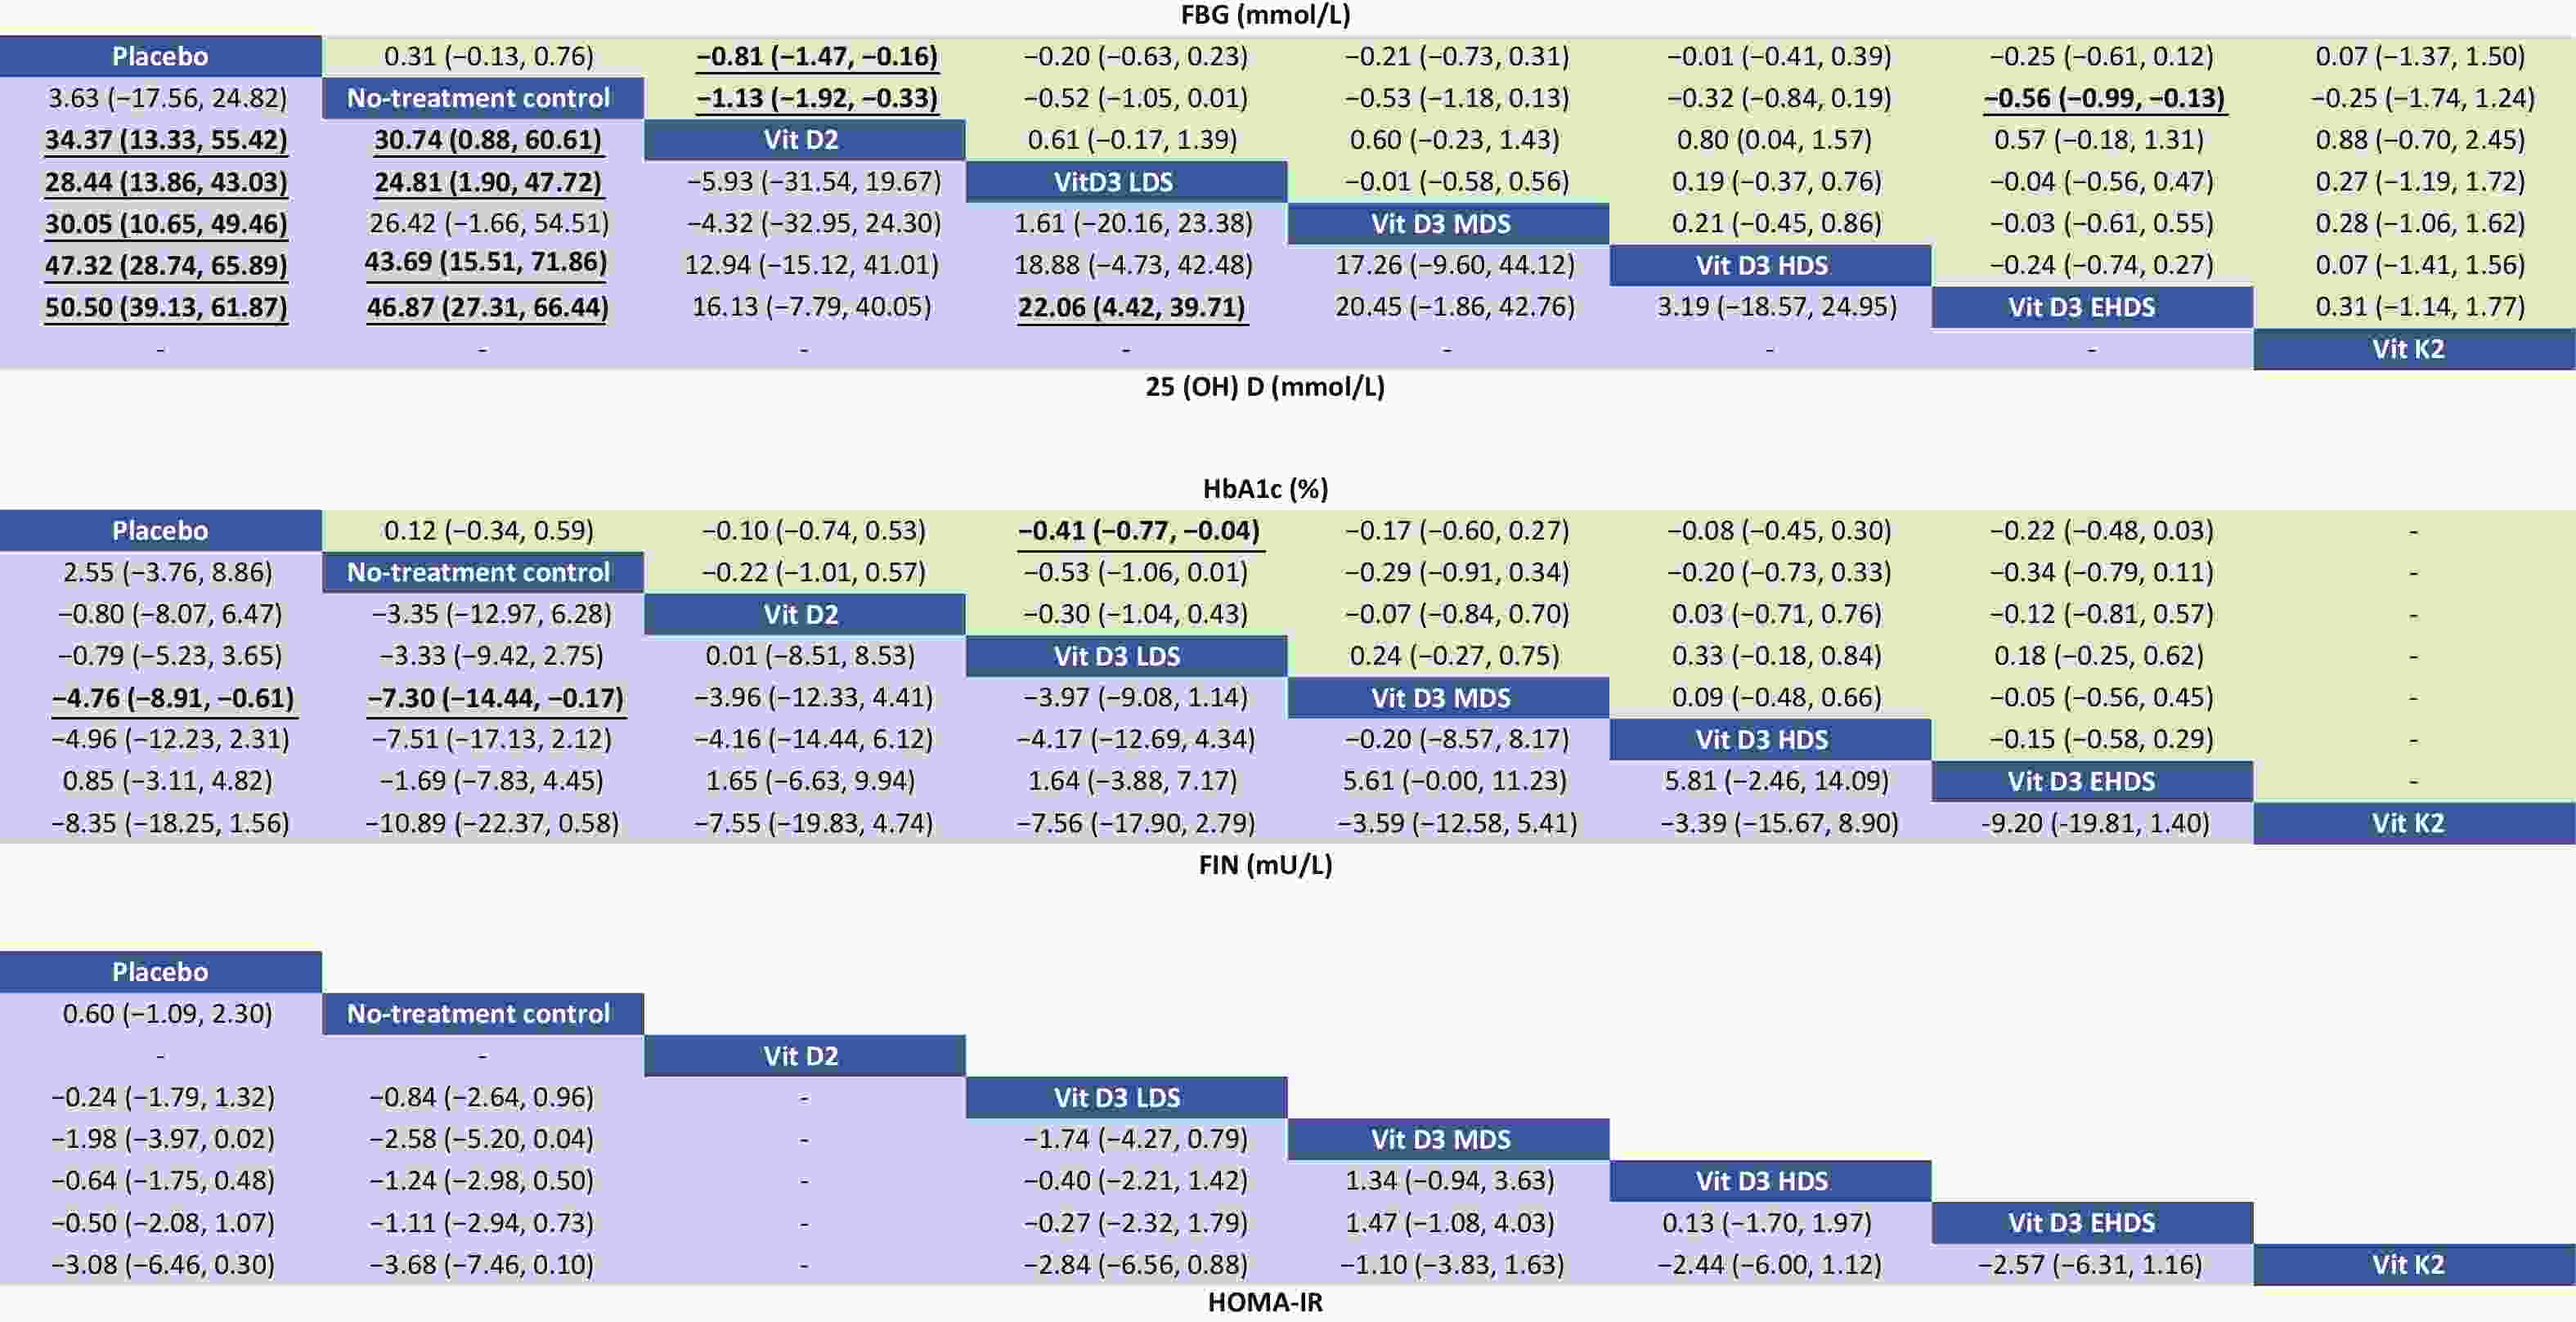
Figure 3. Relative effects of different dosage strategies on FBG, 25-(OH)-D, HbA1c, FIN, and HOMA-IR. LDS, low dose strategy; MDS, medium dose strategy; HDS, high dose strategy; EHDS, extremely high dose strategy; FBG, fasting blood glucose; 25-(OH)-D, 25-hydroxyvitamin D; HbA1c, hemoglobin A1c; FIN, fasting insulin; HOMA-IR, homeostasis model assessment-insulin.
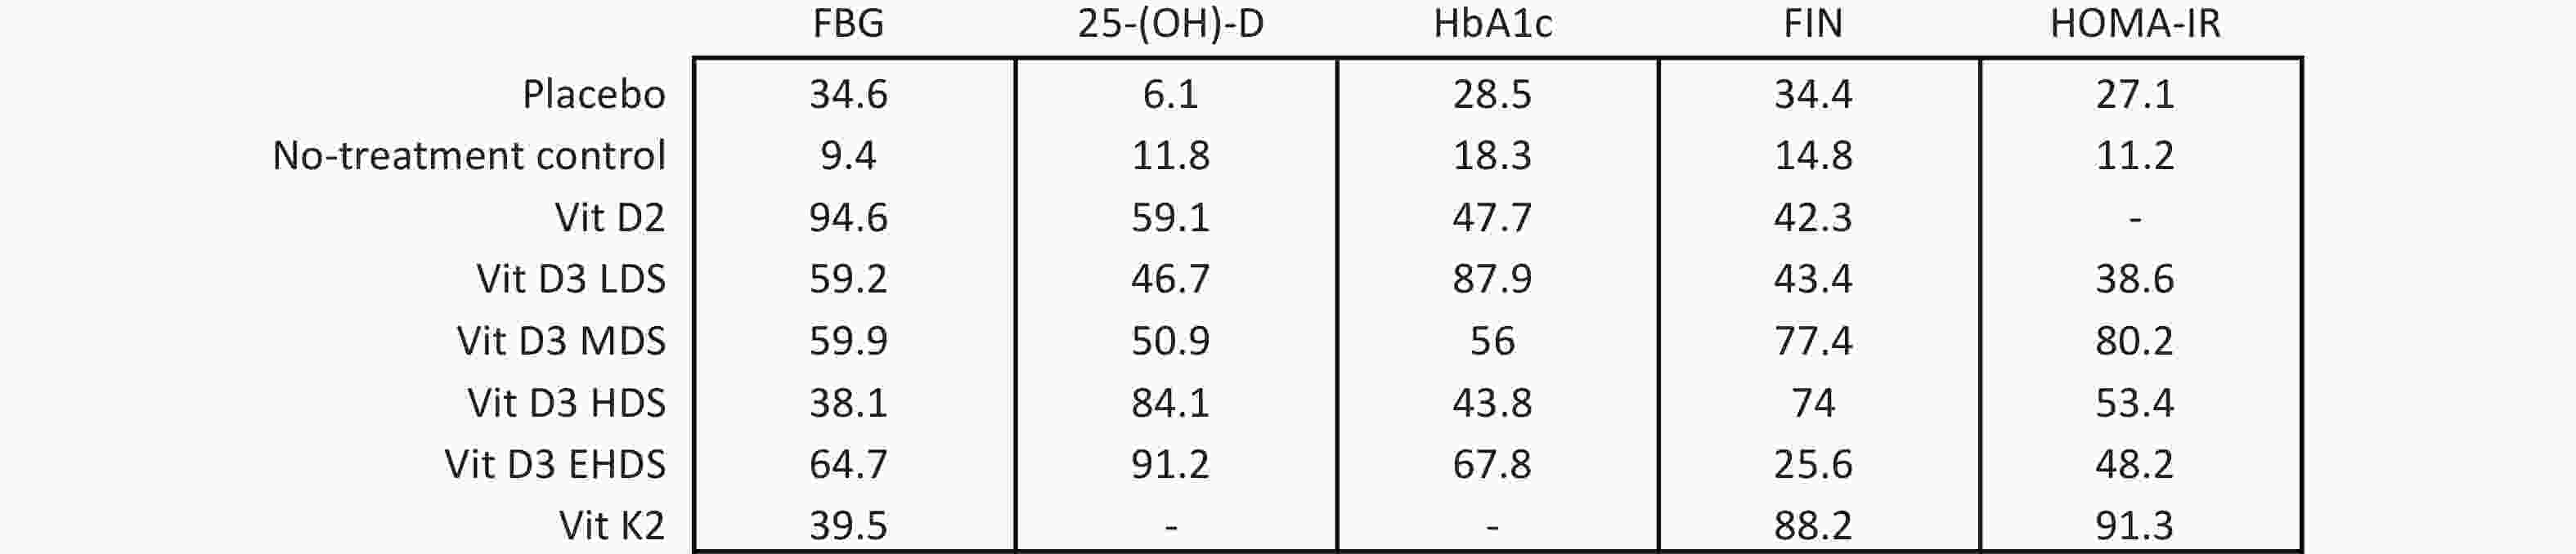
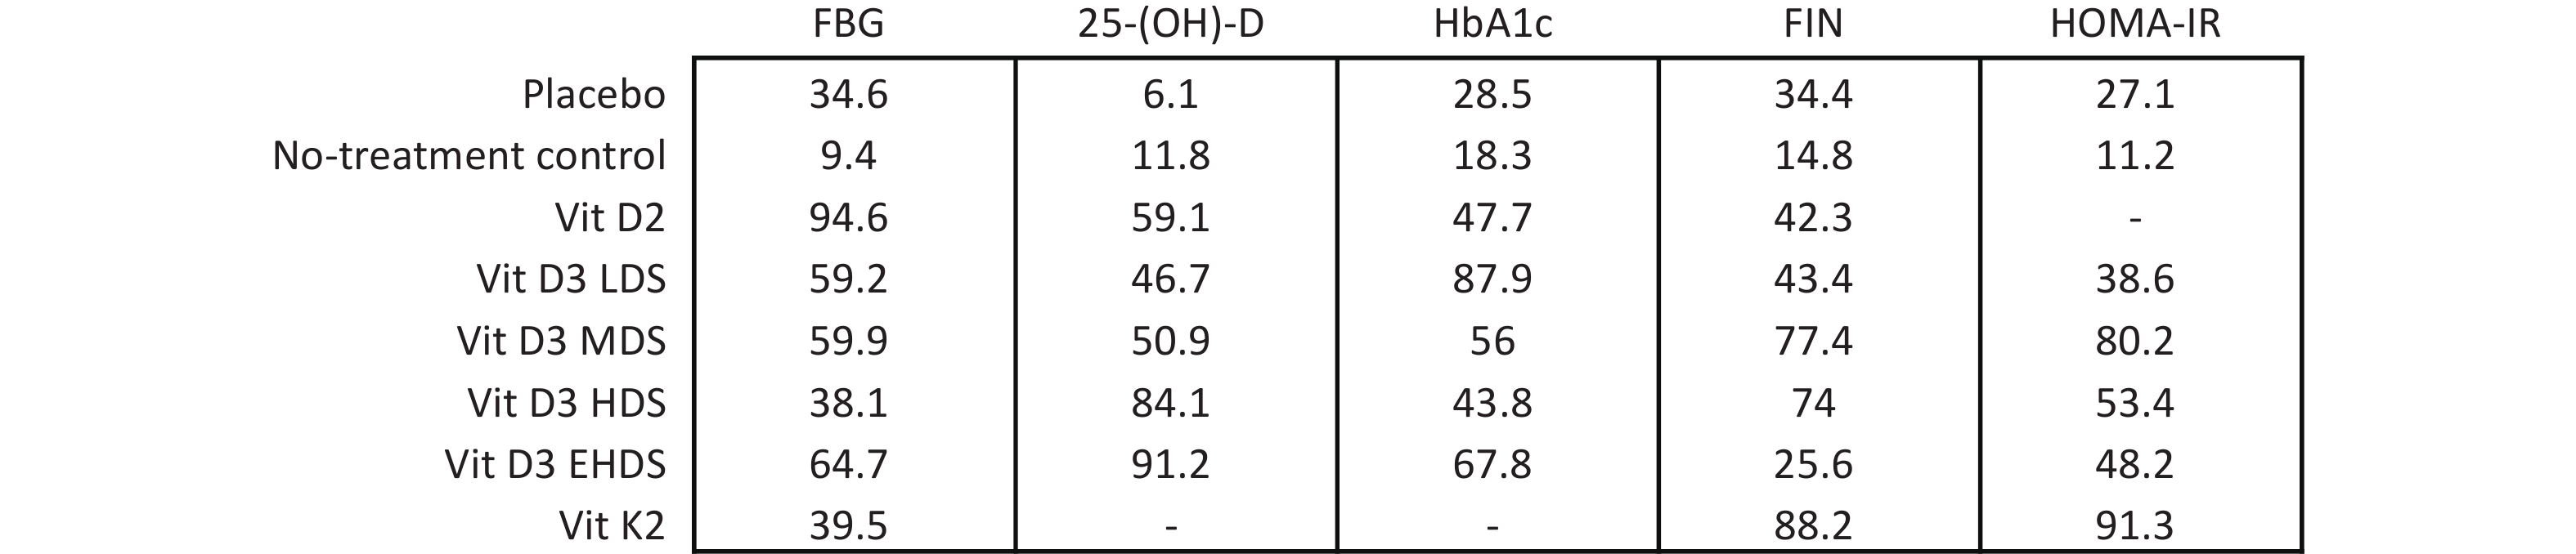
Figure 4. SUCRA results of different dosage strategies in terms of all outcomes. LDS, low dose strategy; MDS, medium dose strategy; HDS, high dose strategy; EHDS, extremely high dose strategy; FBG, fasting blood glucose; 25-(OH)-D, 25-hydroxyvitamin D; HbA1c, hemoglobin A1c; FIN, fasting insulin; HOMA-IR, homeostasis model assessment-insulin resistance; SUCRA, surface under the cumulative ranking curve.
-
A consistency model was used for the network meta-analysis of 25-(OH)-D, as global (Supplementary Figure S3) and local consistencies (Supplementary Table S2) were not established. As shown in Figure 3, the pooled results indicated that vitamin D2 significantly increased 25-(OH)-D levels compared to placebo (MD: 34.37; 95% CI: 13.33–55.42), with improvements observed across dose categories: from LDS (MD: 28.44; 95% CI: 13.86–43.03) to EHDS (MD: 50.50; 95% CI: 39.13–61.87). No treatment compared to placebo did not reach statistical significance. However, LDS, HDS, and EHDS each significantly increased 25-(OH)-D levels compared to no treatment.
-
The network meta-analysis of HbA1c was conducted using a consistency model, as global and local consistencies were not supported (Supplementary Figure S3, Table S2). As illustrated in Figure 3, LDS significantly reduced HbA1c levels compared to placebo (MD: −0.41%; 95% CI: −0.77% to −0.04%). No significant differences were observed between other dosing strategies.
-
A consistency model was used for the network meta-analysis of FIN, as global and local consistencies were not confirmed (Supplementary Figure S3, Table S2). As shown in Figure 3, MDS significantly reduced FIN levels compared to placebo (MD: −4.76; 95% CI: −8.91 to −0.61) and no treatment (MD: −7.30; 95% CI: −14.44 to −0.17). No other dosage strategies showed statistically significant differences.
-
The network meta-analysis of HOMA-IR was also conducted using a consistency model, as global and local consistencies were not identified (Supplementary Figure S3, Table S2). As shown in Figure 3, no comparisons yielded statistically significant differences.
-
Funnel plots for FBG, 25-(OH)-D, HbA1c, FIN, and HOMA-IR are presented in Supplementary Figure S6. Egger’s test was conducted to assess publication bias (Supplementary Figure S7). The funnel plot for 25-(OH)-D appeared slightly asymmetric, with several studies falling outside the funnel boundaries, consistent with the high heterogeneity observed among studies reporting 25-(OH)-D outcomes. To ensure the comprehensiveness of the literature search, the search strategy was reviewed by evidence-based medicine experts. Thus, the pooled results were unlikely to be substantially affected by publication bias. Sensitivity analyses showed that the exclusion of studies with higher risk of bias did not significantly alter the pooled estimates for FBG, 25-(OH)-D, HbA1c, FIN, or HOMA-IR, supporting the robustness of the findings (Supplementary Figure S8). The results of inter-study heterogeneity were presented in Supplementary Figures S9 and S10.
-
As shown in Supplementary Figure S11, inconsistency was detected in the loop involving placebo, no treatment, LDS, and HDS in the network meta-analysis of FBG. This suggests that results for these comparisons should be interpreted with greater caution. No inconsistencies were identified in other closed loops, indicating greater reliability of the corresponding pooled estimates.
-
We included 40 eligible RCTs involving 4,181 adults with T2DM in this network meta-analysis. The main findings were that EHDS (> 4,000 IU/day) significantly increased serum 25-(OH)-D concentrations compared with placebo and LDS (< 1,000 IU/day), and that EHDS decreased FBG levels compared with no treatment. Furthermore, according to SUCRA rankings, EHDS appears to be the optimal vitamin D supplementation strategy for concurrently decreasing FBG and increasing serum 25-(OH)-D levels. Compared with placebo, LDS significantly decreased HbA1c and vitamin D2 and significantly altered FBG levels. MDS, compared with placebo and no treatment, significantly altered FIN levels. These findings suggest that high doses of vitamin D may be more effective in the short term, whereas lower doses may represent an appropriate long-term strategy for improving glucose metabolism.
Serum 25-(OH)-D is a sensitive biomarker of vitamin D status and is the primary circulating form, reflecting vitamin D derived from diet and dermal synthesis[73-75]. In this network meta-analysis, we simultaneously compared multiple dosage strategies by integrating direct and indirect evidence. EHDS had the highest probability of being the most effective strategy for increasing serum 25-(OH)-D concentrations. Previous studies have shown that inadequate vitamin D supplementation may impair glucose-stimulated insulin secretion and increase peripheral insulin resistance[76,77]. Vitamin D may reduce inflammation, activate transcription of insulin receptor and related genes, and enhance insulin-mediated glucose transport, thereby reducing Insulin resistance[78,79]. Our analysis also showed that EHDS (> 4,000 IU/day) significantly decreased FBG levels. Notably, vitamin D2 also significantly reduced FBG levels in adults with T2DM and ranked more favorably than EHDS. This may be attributed to the higher doses of vitamin D2 used in the included studies: 4,000 IU/day in two trials and 50,000 IU/week (7,143 IU/day) in one trial[40,54,55]. With respect to improvement in vitamin D status, vitamin D2 was more effective than LDS (< 1,000 IU/day) or MDS (1,000–2,000 IU/day). Thus, dosage may be an important determinant of FBG improvement. However, it has been reported that plasma 25-(OH)-D2 levels are similar in individuals with and without T2DM[80]. Larger and more rigorously designed trials are needed, not only to monitor serum 25-(OH)-D and FPG levels, but also to elucidate the underlying mechanisms driving the apparent differences in efficacy between vitamin D2 and D3. These differences may be related to genetic polymorphisms affecting vitamin D metabolism or to critical enzymes involved in the hydroxylation process.
We found that LDS significantly reduced HbA1c levels in adults with T2DM, whereas other dose groups did not show statistically significant reductions. Similarly, findings from a recently published the Role of Vitamin D in Controlling and Reducing DM Risks (D4D) study using a small supplement dose demonstrated that vitamin D supplementation may reduce HbA1c levels[81]. HbA1c is generated through the continuous, non-enzymatic glycosylation of hemoglobin under hyperglycemic conditions. A prospective study identified HbA1c as the gold standard for assessing glycemic control in individuals with T2DM[82]. Previous meta-analyses have also indicated that vitamin D supplementation prevents increases in plasma HbA1c, suggesting that vitamin D may mitigate or delay the onset and progression of diabetic complications[14,83,84]. Furthermore, a subgroup analysis in the meta-analyses by Lee et al. reported more favorable effects on HbA1c with lower vitamin D doses[83]. This association between low-dose vitamin D treatment and improved HbA1c may reflect a non-linear relationship between vitamin D status and glucose metabolism. Evidence suggests that serum 25-(OH)-D concentrations are non-linearly related to HbA1c levels[81,85], implying that higher vitamin D levels may not confer additional metabolic benefit beyond a certain threshold. A recent umbrella meta-analysis on the effects of vitamin D supplementation on T2DM biomarkers also found a significant reduction in HbA1c[86]. However, that analysis included participants with conditions other than T2DM (e.g., gestational diabetes mellitus, prediabetes mellitus, polycystic ovary syndrome, and nonalcoholic fatty liver disease), which were not considered in the present study.
Most previous meta-analyses have not reported FIN levels, and one study showed that long-term vitamin D interventions led to greater improvements in FIN, suggesting that improvements in β-cell function may require longer periods to become evident[87]. This finding aligns with a recent meta-analysis evaluating the effectiveness of multiple nutritional supplements on glycemic control, which demonstrated that vitamin D improved glycemic parameters when administered for more than 12 weeks[88]. The present study also showed that MDS (1,000–2,000 IU/day) significantly reduced FIN levels in individuals with T2DM. Furthermore, in all studies of MDS, participants were supplemented daily with vitamin D. Therefore, we hypothesize that improvement in FIN levels may be related to supplementation frequency.
Large RCTs reported to date have included individuals with high baseline 25-(OH)-D levels. To enhance trial validity, researchers often selected higher supplementation doses (3,000 IU/day to 60,000 IU/week) using quarterly, monthly, or weekly intermittent oral or injectable regimens[89,90]. However, some studies failed to demonstrate significant improvements in glucose metabolism[91] and indicated potential health risks such as hypercalcemia and increased risk of fractures and falls in the study population[92]. Continuous daily supplementation with low-to-moderate doses of 25-(OH)-D has been suggested to be superior to intermittent high-dose supplementation, as it better maintains stable blood levels of 25-(OH)-D and maximizes associated health benefits[93]. In addition to dose and administration schedule, treatment duration is an important determinant of intervention effectiveness. One meta-analysis found no benefit of short-term vitamin D supplementation in individuals with T2DM[16]. This meta-analysis included clinical trials with relatively short follow-up periods, often less than 3 months. This limitation is particularly relevant because HbA1c reflects glycemic control over approximately 100 days, meaning induced changes require longer to be detectable[94]. Accordingly, studies with intervention durations shorter than 3 months were excluded. Overall, there remains no consensus regarding the optimal vitamin D supplementation regimen, including dose, administration schedule, and treatment duration[95]. From a physiological standpoint, daily vitamin D administration appears most natural. Indeed, daily supplementation seems to result in higher efficacy regarding 25-(OH)-D exposure and extra-skeletal benefits[95]. Currently, there is no evidence that intermittent high-dose administration at longer intervals effectively reduces diabetes risk. Alongside our findings, this suggests that high-dose vitamin D supplementation may not be necessary and that lower daily doses may suffice to improve glycemic parameters in individuals with T2DM. Further studies or more detailed analyses of existing data are needed to confirm these observations.
Studies have shown that vitamin K exerts beneficial effects not only on blood coagulation, osteoporosis, and vascular calcification but also on insulin sensitivity and glucose metabolism, reducing the risk of T2DM[96,97]. During our analysis, some studies used vitamin K2 as a control group[39]. Although this network meta-analysis focused on vitamin D intervention, we preliminarily analyzed vitamin K2 as a node to explore its potential influence on our findings. The results indicated that vitamin K2 had no effect on vitamin D improvement or glycemic control in T2DM individuals, which may relate to the limited number of included studies. Further meta-analyses or RCTs are needed to compare the effects of vitamin D, vitamin K, and other nutrients (e.g., selenium) on glycemic control[98,99].
The strengths of this network meta-analysis include the exclusive inclusion of RCTs, enhancing evidence quality; integration of direct and indirect evidence, increasing statistical power to estimate relative efficacy; use of indirect comparisons to assess comparative efficacy of two dosage strategies never directly compared; and application of SUCRA to rank probabilities of vitamin D supplementation dosages, aiding identification of optimal dosing strategies. Prediction intervals were also used to characterize effect size variability. Certain limitations apply. Although only investigational trials were included, higher-quality studies are warranted. Despite inclusion of 40 investigational clinical trials, most had small sample sizes, which likely affected the reliability of pooled results. The search encompassed four recommended databases, but only English-language studies were included, so publication bias cannot be excluded. Heterogeneity arose from differences in ethnicity, age, and sex among individuals, and most studies did not assess dietary vitamin D intake, sun exposure, physical activity, or seasonal variation. Dosage and frequency of vitamin D administration varied considerably. Although intermittent doses were pooled by calculating average daily dose, this may have introduced bias given differing dosing regimens can result in variable vitamin D status. Vitamin D use was divided into dose groups based on previous studies and meta-analyses, which may introduce grouping bias. Therefore, further studies are needed to evaluate how these factors impact efficacy of different dosing strategies in T2DM.
-
To our knowledge, this is the first systematic review and network meta-analysis comparing the efficacy of different vitamin D dosages for the treatment of T2DM. The findings indicate that vitamin D supplementation significantly affects biomarkers associated with T2DM. Daily supplementation with lower doses may be sufficient to improve glycemic markers in individuals with T2DM. Moreover, the effect on 25-(OH)-D levels appears to be dose-dependent. However, large-scale randomized controlled trials are needed to confirm these findings.
Effects of Oral Vitamin D Supplementation on Vitamin D Levels and Glycemic Parameters in Patients with Type 2 Diabetes Mellitus: A Systematic Review and Network Meta-analysis
doi: 10.3967/bes2025.066
- Received Date: 2025-02-11
- Accepted Date: 2025-05-13
-
Key words:
- Network meta-analysis /
- Vitamin D supplementation /
- Type 2 diabetes mellitus /
- Glycemic biomarkers
Abstract:
The authors report no conflicts of interest.
| Citation: | Xiujuan Zhang, Hongfei Wang, Xia Gao, Yang Zhao. Effects of Oral Vitamin D Supplementation on Vitamin D Levels and Glycemic Parameters in Patients with Type 2 Diabetes Mellitus: A Systematic Review and Network Meta-analysis[J]. Biomedical and Environmental Sciences. doi: 10.3967/bes2025.066

|

 Quick Links
 DownLoad: