
-
The prevalence of obesity has greatly increased in China[1-3], with approximately 46% of adults and 15% of children being obese or overweight, representing a severe public health challenge. Diabetes is one of the most common metabolic diseases worldwide, with an estimated prevalence of 12.4% in China in 2018 data[4]. The relationship between obesity and metabolic diseases has been well-established in observational studies[5-7]. However, the prevalence of metabolic diseases varies widely among the obese population[8]. Metabolically healthy obesity (MHO) populations are less likely to develop metabolic diseases than metabolically unhealthy obesity populations[9,10]. Preserved insulin sensitivity (IS) may modify the obesity-disease association[10-16]. Nevertheless, a few studies reported that insulin resistance (IR) mediates the relationship between obesity and diseases[17,18], leaving the interplay controversial, especially concerning diabetes.
Generally, this interplay includes interaction and mediation effects[10-16]. The interaction effect suggests that IS may reduce the impact of obesity on diabetes, which is explained as metabolically healthy obesity[10-13]. The mediation effect supports the idea that obesity leads to IR and further causes diabetes, leaving metabolically healthy obesity a paradox[17,18]. Researchers evaluated the relationship between obesity and IR on incident diabetes[13-18]. However, these studies focused only on the interaction or mediation separately, ignoring the complex relationship between obesity and IR. Moreover, these studies were based on one or a limited number of measurements, ignoring the dynamic trends in body weight and metabolic status. Longitudinal studies that synthetically consider the interplay between obesity and IR on diabetes are largely limited, leaving the relationship uncertain[19-21].
Using data from the China Health and Nutrition Survey (CHNS), this study aims to identify body mass index (BMI) trajectories during early to midlife adulthood (20–50 years) and illustrate the interplay between BMI trajectories and IR on incident diabetes.
-
The CHNS is an ongoing longitudinal cohort study conducted by the national and local governments[22]. This study aimed to understand how the social and economic transformation of Chinese society affects the health and nutritional status of the Chinese population. A multi-stage random clustering process was used to collect data from Beijing, Chongqing, Guangxi, Guizhou, Heilongjiang, Henan, Hubei, Hunan, Jiangsu, Liaoning, Shaanxi, Shandong, Shanghai, Yunnan, and Zhejiang. Ten cross-sectional surveys have been completed between 1989 and 2015, covering 41,462 individuals.
In this study, individuals with a history of diabetes mellitus before 2009, BMI < 15 kg/m2 or BMI > 40 kg/m2, age > 50 or age < 20 until 2009, missing data in glucose or insulin in 2009, and with less than three follow-up visits until 2009 were excluded. Finally, 2,336 subjects (1,080 males, aged 20.0–44.8 years at baseline), with 3–10 times follow-ups, were included in this study. The mean follow-up duration was 18.2 years (SD = 6.0 years). BMI and diabetes mellitus data were collected between 1989 and 2009 and 2009 and 2015, respectively. Supplementary Figure S1 shows the detailed flowchart of the study population inclusion and exclusion. The Institutional Review Committee of the University of North Carolina in Chapel Hill, NC, USA, and the China National Institute of Nutrition and Food Safety at the Chinese Center for Disease Control and Prevention in Beijing, China, approved the study protocols. All the study participants provided written informed consent.
-
At each follow-up, standing height without shoes was measured to the nearest 0.2 cm using a portable SECA stadiometer (SECA, Hamburg, Germany). Weight in light clothing without shoes was measured to the nearest 0.1 kg on a dedicated scale that was routinely calibrated. BMI was calculated as weight in kilograms divided by height in meters squared (kg/m²). Smoking was defined as ever having smoked cigarettes (including former and current smokers). Alcohol drinking was defined as alcohol consumption (including beer, liquor, or wine) ≥ 25 g (for males) or ≥ 15 g (for females) per week. Waist circumference (WC) was measured midway between the lowest rib margin and the top of the iliac crest using a SECA tape measure from 1993 to 2015. Blood pressure was measured at least three times between 1991 and 2015 using a standard mercury sphygmomanometer after the participants rested for at least 5 minutes in a seated position. Systolic blood pressure (SBP) was measured at the first appearance of a pulse sound (Korotkoff phase 1), whereas diastolic blood pressure (DBP) was measured at the disappearance of the pulse sound (Korotkoff phase 5). The mean of the last two measurements was calculated for further analysis.
The dietary assessment was based on a combination of detailed food consumption information for three consecutive days. Food consumption information was transformed into food groups based on the nutrient profiles designed for the 2002 China National Nutrition Survey[23].
Biomarker data were collected from the 2009 CHNS survey. All adult participants were required to collect 12 mL of blood (in three 4 mL tubes) after overnight fasting. Serum glucose (using the glucose oxidase method) and whole glycated hemoglobin levels were measured using an automatic clinical chemistry analyzer (model HLC-723G7; Tosoh, Tokyo, Japan). Fasting serum insulin concentration was evaluated using a commercial radioimmunoassay kit (Beijing North Institute of Biological Technology, Beijing, China). IR status was assessed using the homeostasis model assessment of insulin resistance (HOMA-IR) according to the formula described previously: HOMA-IR = insulin (μU/mL) × glucose (mmol/L)/22.5[24].
-
Diabetes mellitus was defined as self-reporting diabetes and/or fasting plasma glucose (FPG) ≥ 7.0 mmol/L and/or glycated hemoglobin ≥ 6.5% (48 mmol/L) and/or taking glucose-lowering medication. Data on the incidence of self-reported diabetes and glucose-lowering medications were first collected in 1997 and subsequently in 2000, 2004, 2006, 2009, 2011, and 2015. Serum glucose and total glycated hemoglobin levels were measured only in the 2009 survey.
-
The latent class growth mixture model (LCGMM) was used to identify different trajectory patterns of BMI[25]. The latent class trajectory of BMI was specified as a function of age (centered to 35 years, the mean age of the cohort). Multiple LCGMMs with different trajectory shapes, including linear and nonlinear parameters, were tested[26,27]. Repeated trajectory analyses were performed to identify the latent classes by changing the number of groups from two to four with the same starting values calculated from the 1-group model. The class memberships of subjects were determined by a latent discrete random variable, and its probability was described using a multinomial logistic model according to the covariates. We chose the best-fitting model for the BMI trajectories according to the BIC criterion while ensuring that each group had an acceptable proportion of the population and posterior probability. Considering the changing patterns of BMI, subjects were divided into obese and normal-weight groups. The relationship between BMI trajectories and the level of HOMA-IR on incident diabetes was explored using a four-way effect decomposition model adjusted for baseline age, sex, smoking and alcohol consumption, and follow-up years[28]. Based on these results, we further estimated the detailed effects of BMI trajectories and HOMA-IR on incident diabetes.
We defined IR as a HOMA-IR value above the 50th percentile. Combined with the BMI trajectories, the cohort was divided into four subgroups: normal, IR, IS-obesity, and IR-obesity. Logistic regression models were used to explore the associations between the joint group membership and incident diabetes mellitus adjusted for the same covariates. Moreover, the interaction effect between BMI trajectories and HOMA-IR was estimated by adding an interaction term in the logistic regression model. Mediation analysis models were constructed to examine whether the association between BMI trajectories and risk of diabetes was mediated by HOMA-IR, adjusted for the above covariates.
Variables were described as mean (standard deviation), median (interquartile range), and n (%), as appropriate. All analyses were performed using R 4.0.4 and SAS 9.4. Statistical tests were two-sided, and P < 0.05 was considered statistically significant.
-
Table 1 presents the baseline characteristics of the study variables by the incident diabetes group during follow-up. Subjects with incident diabetes mellitus (n = 193) were more likely to be male and have higher BMI, FPG, insulin, and HOMA-IR values than non-diabetic subjects. Supplementary Table S1 shows that the excluded respondents (n = 39,126) were generally older subjects with lower baseline BMI, lower proportion of smokers, and higher FPG than those included.
Variables Non-diabetics (n = 2,142) Diabetes (n = 194) P Value Baseline Age, ys 28.0 (5.3) 28.4 (5.0) 0.344 Males, n (%) 965 (45.1) 115 (59.3) < 0.001 BMI, kg/m2 21.7 (2.7) 23.2 (3.4) < 0.001 Smoker, n (%) 455 (21.2) 49 (25.3) 0.226 Drinker, n (%) 473 (22.1) 50 (25.8) 0.275 Follow-up FPG, mmol/L 5.0 (0.59) 7.2 (2.66) < 0.001 Insulin, μIU/mL 10.2 [7.3, 14.5] 14.6 [9.2, 22.7] < 0.001 HOMA 2.22 [1.54, 3.26] 4.47 [2.54, 8.39] < 0.001 Follow-up duration, ys 18.0 (5.9) 20.6 (5.5) < 0.001 Note. Study variables are presented as mean (SD), median [interquartile range] or n (%), appropriately. BMI, body mass index; FPG, fasting plasma glucose; HOMA, homeostasis model assessment of insulin resistance. Table 1. Characteristics by incident diabetes mellitus at baseline and follow-up
-
Supplementary Table S2 summarizes the LCGMM model-fitting process for BMI trajectories. We fit the models from one to four classes of linear, quadratic, and cubic curves. According to the statistical criteria above, a model of quadratic parameters with three classes was chosen as the best-fit model. Supplementary Table S3 presents the parameter estimates for the best-fitting 3-class quadratic latent class growth mixed model. All parameters were statistically significant (P < 0.05).
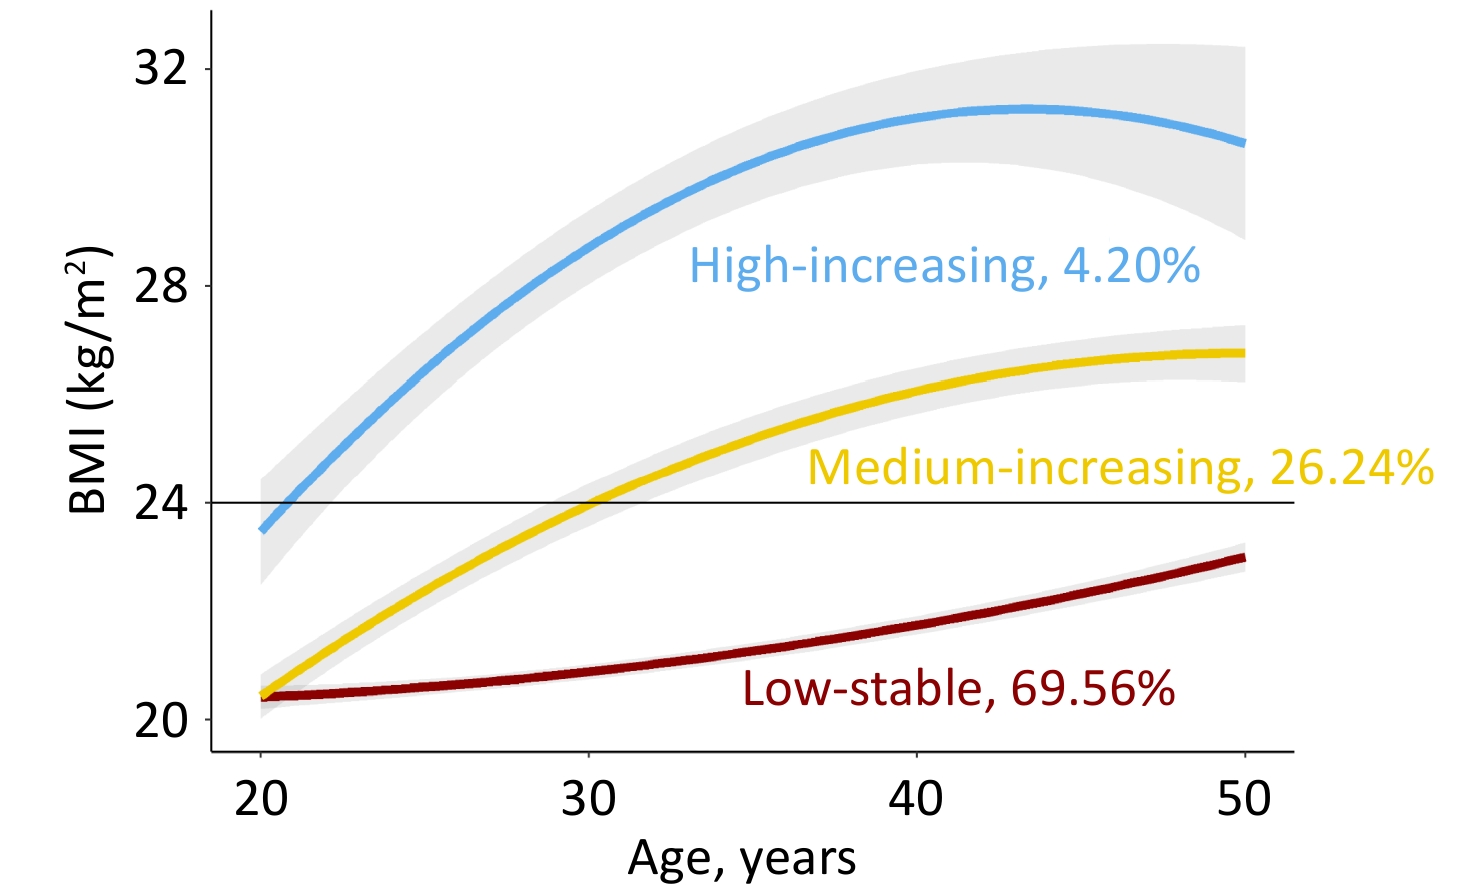
Figure 1 shows the longitudinal trajectories of the BMI of 2,336 participants 20–50 years old. Three distinct trajectories were established: low-stable (n = 1,625, 69.56%), medium-increasing (n = 613, 26.24%), and high-increasing (n = 98, 4.20%). In the low-stable group, BMI persisted at a low level of 21–23 kg/m2, which was defined as normal weight. In the medium-increasing group, the BMI increased gradually from 21 kg/m2 to 26 kg/m2. In the high-increasing group, BMI increased gradually from 23 kg/m2 to 30 kg/m2. Individuals in the medium-increasing and high-increasing groups were defined as obese. Supplementary Table S4 presents the characteristics of the study variables by weight status. Compared to the normal-weight group, the obese group was more likely to be male, with higher baseline BMI, FPG, insulin, HOMA-IR, and a higher proportion of cigarette and alcohol consumption.
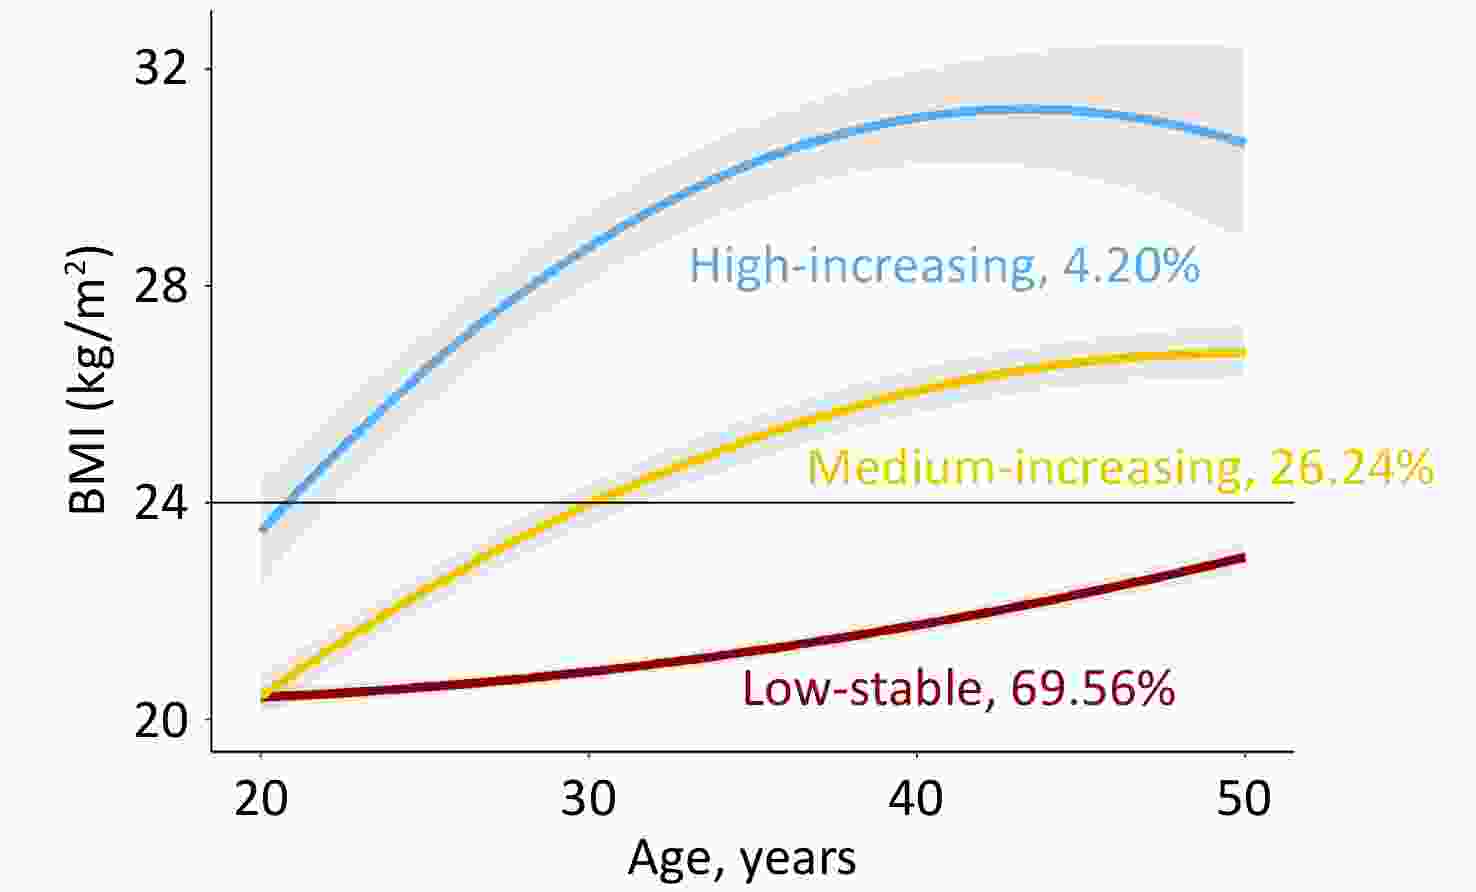
Figure 1. Predicted trajectories of BMI in participants 20–50 years old.
-
The relationship between BMI trajectories and HOMA-IR was explored using a four-way effect decomposition model. The reference interaction effect and pure indirect effect were 0.070 (P < 0.001) and 0.004 (P = 0.010), respectively. Both interaction and mediation effects between BMI trajectories and HOMA-IR were significant, and the interaction effect was primary.
Subjects were divided into four subgroups based on the BMI trajectories and IR status: normal (low-stable BMI and IS, n = 948), IR (low-stable BMI and IR, n = 677), IS-obesity (medium- or high-increasing BMI and IS, n = 224), and IR-obesity (medium or high increasing BMI and IR, n = 487). Table 2 summarizes the baseline and follow-up characteristics of the study variables by the joint classes. Compared to the normal group, the IR-obesity group was more likely to be male, with a higher BMI, FPG, insulin, and HOMA-IR, and a higher proportion of smokers and alcohol drinkers at baseline and follow-up. Notably, compared to IS-obesity, subjects with IR obesity were more likely to be male, with the same BMI, SBP, DBP, WC, and smoking and alcohol drinking status at baseline, but significantly higher incremental WC, DBP, and proportion of cigarette consumption during follow-up. Furthermore, subjects in the IR-obesity group had more energy, fat, and protein intake but less carbohydrate intake during follow-up than those in the IS-obesity group.
Variables Normal IR IS-obesity IR-obesity P Value N 948 677 224 487 Baseline Age, ys 28.3 (5.2) 27.8 (5.2) 28.0 (5.5) 27.9 (5.3) 0.255 Males, n (%) 409 (43.1) 290 (42.8) 104 (46.4) 277 (56.9) * † < 0.001 BMI, kg/m2 20.8 (1.9) 21.0 (2.0) 24.0 (2.9) * 24.1 (3.1) * < 0.001 SBP, mmHg 111.5 (11.6) 111.5 (11.6) 114.2 (11.2) * 115.8 (11.9) * < 0.001 DBP, mmHg 73.4 (8.9) 73.0 (9.1) 75.8 (8.4) * 76.1 (9.3) * < 0.001 WC, cm 72.9 (6.9) 73.9 (7.9) 82.3 (9.2) * 83.2 (9.7) * < 0.001 Smoker, n (%) 199 (21.0) 113 (16.7) 53 (23.7) 139 (28.5) * < 0.001 Drinker, n (%) 200 (21.1) 114 (16.8) 64 (28.6) * 145 (29.8) * < 0.001 Follow-up (WAVE = 2009) Age, ys 41.9 (5.4) 41.5 (5.6) 40.9 (5.6) * 41.3 (5.6) * 0.031 BMI, kg/m2 21.7 (2.2) 22.3 (2.2) 26.5 (2.3) * 27.5 (2.7) * † < 0.001 SBP, mmHg 115.6 (13.7) 117.5 (14.4) 122.2 (16.4) * 124.3 (16.1) * < 0.001 DBP, mmHg 76.8 (9.9) 77.8 (10.2) 81.4 (10.3) * 84.3 (11.5) * † < 0.001 WC, cm 76.9 (8.0) 78.9 (7.8) 89.1 (7.8) * 91.1 (8.2) * † < 0.001 Smoker, n (%) 293 (30.9) 182 (26.9) 66 (29.5) 182 (37.4) * † 0.002 Drinker, n (%) 332 (35.1) 224 (33.1) 93 (41.5) 214 (43.9) * < 0.001 Energy, kcal/day 2,242 (649) 2,133 (629) 2,252 (614) 2,293 (765) < 0.001 Carbohydrate, g/day 313.1 (103.1) 295.4 (102.1) 317.8 (98.0) 308.9 (107.0) 0.003 Protein, g/day 68.2 (22.8) 66.7 (22.2) 69.3 (23.6) 71.4 (24.0) 0.007 Fat intake, g/day 76.2 (33.6) 72.6 (32.5) 76.2 (30.9) 79.1 (34.9) 0.011 FPG, mmol/L 4.8 (0.54) 5.4 (1.09) 4.9 (0.70) 5.8 (1.73) * † < 0.001 Insulin, μIU/mL 7.3 [5.5, 8.7] 14.4 [11.9, 20.3] 7.9 [5.8, 9.0] * 16.1 [12.8, 22.8] * † < 0.001 HOMA 1.55 [1.15, 1.92] 3.26 [2.71, 4.74] 1.71 [1.23, 1.96] * 3.83 [2.95, 5.85] * † < 0.001 Incident Diabetes Mellitus, n (%) 29 (3.1) 60 (8.9) 13 (5.8) 92 (18.9) * † < 0.001 Note. Study variables are presented as mean (SD), median [interquartile range] or n (%), appropriately. IR, insulin resistance; IS, insulin sensitivity; BMI, body mass index; DBP, diastolic blood pressure; SBP, systolic blood pressure; WC, waist circumference; FPG, fasting plasma glucose; HOMA, homeostasis model assessment of insulin resistance. * Indicated P < 0.05 adjusted for Bonferroni, compared with normal group. † Indicated P < 0.05 adjusted for Bonferroni, compared with IS-obesity group. Table 2. Characteristics at baseline and follow-up by joint groups of obesity and insulin sensitivity
-
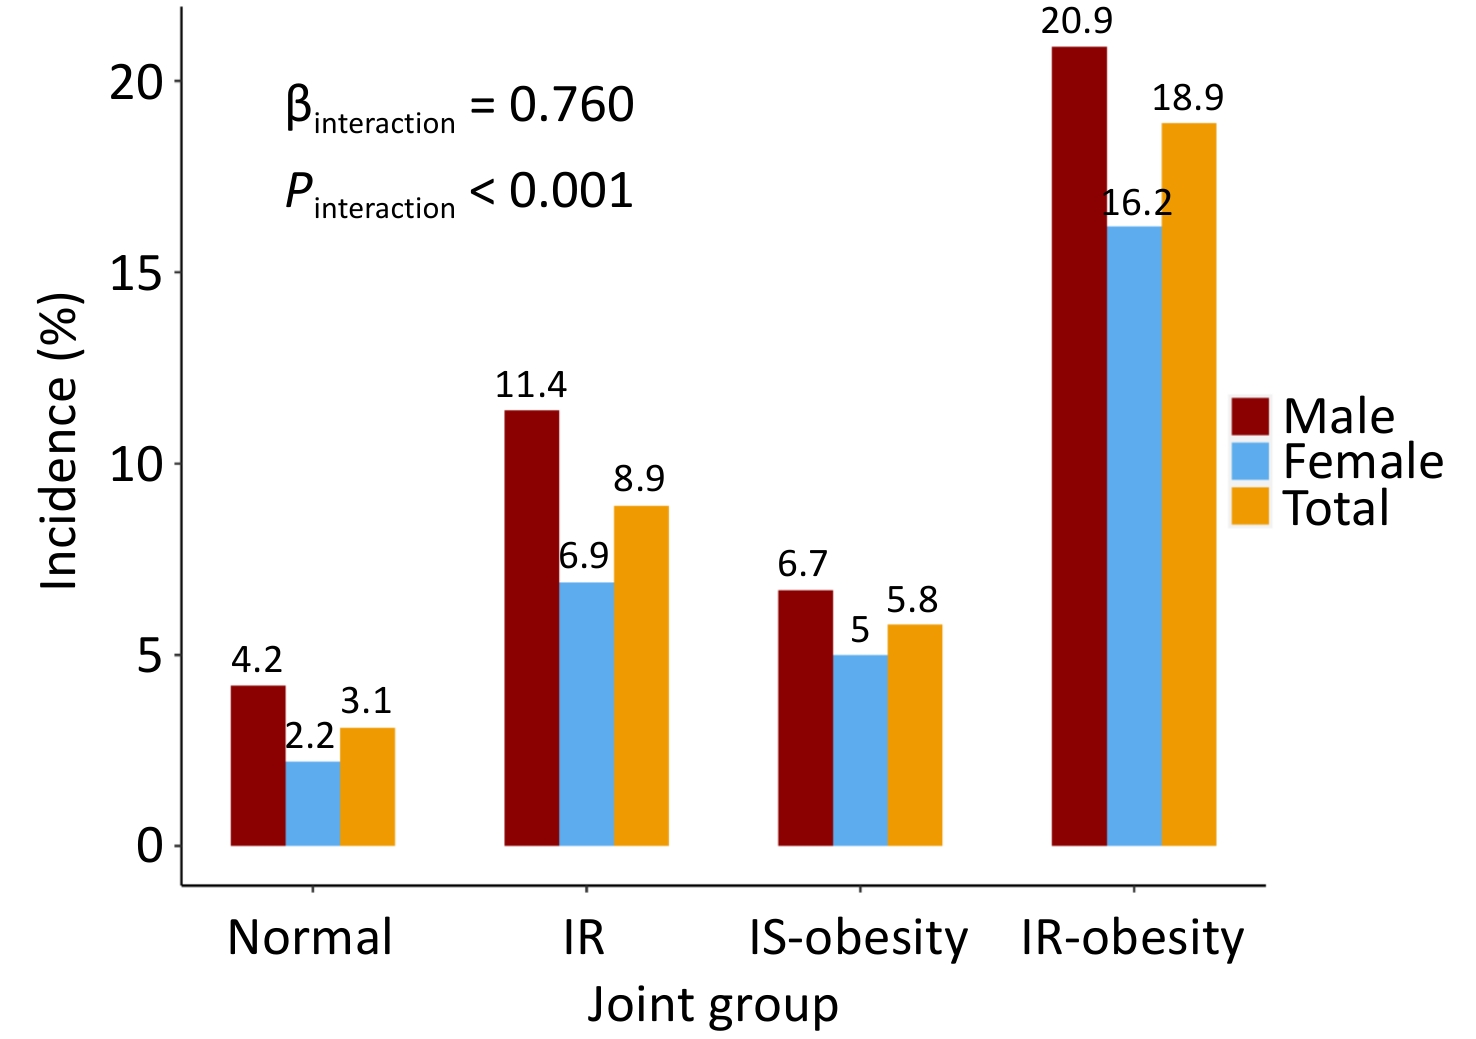
The incidence estimates of diabetes across different combined categories of BMI trajectories and insulin resistance status are presented in Figure 2. The proportion of incident diabetes was higher in the IR-obesity than in the IS-obesity group (18.9% vs. 5.8%, P < 0.001), and an interaction effect on incident diabetes was found between BMI trajectories and HOMA-IR (β = 0.76, P < 0.001). These results were consistent in males and females.
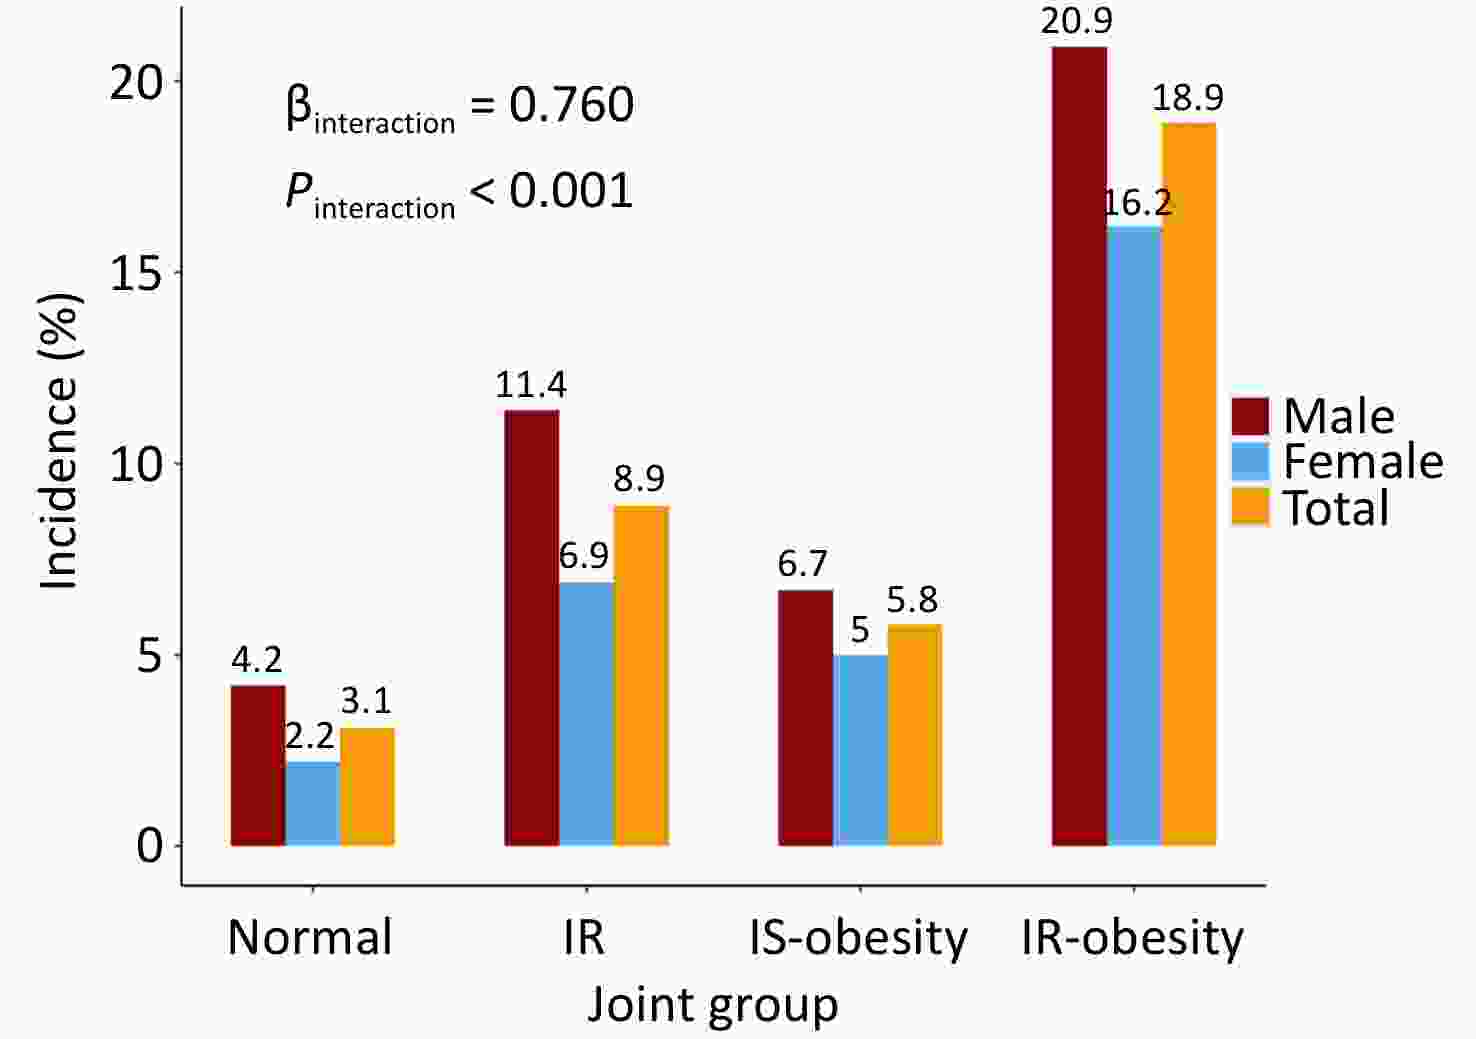
Figure 2. Incidence of diabetes in participants 20–50 years old across different combined categories of BMI and HOMA-IR.
Table 3 presents the odds ratios (ORs) and 95% confidence intervals (CIs) for the association between joint group membership and incident diabetes mellitus. Compared with the normal group, the ORs (95% CIs) of IR, IS-obesity, and IR-obesity groups were 3.08 (1.97, 4.92), 1.95 (0.97, 3.74), and 7.38 (4.84, 11.57) in the unadjusted model, respectively. After adjusting for baseline age, sex, smoking, alcohol consumption status, and follow-up years, the ORs (95% CIs) were 3.22 (2.05, 5.16), 2.05 (1.00, 3.97), and 7.98 (5.19, 12.62), respectively. People in the IR-obesity group had a four-fold higher risk of developing incident diabetes mellitus than those in the IS-obesity group (P < 0.001). These results were consistent in males and females.
Model 1* Model 2** Model 3*** Total Normal Reference Reference Reference IR 3.08 (1.97, 4.92) † 3.13 (2.00, 5.00) † 3.22 (2.05, 5.16) † IS-obesity 1.95 (0.97, 3.74) 1.94 (0.96, 3.72) 2.05 (1.00, 3.97) † IR-obesity 7.38 (4.84, 11.57) † 7.05 (4.62, 11.07) † 7.98 (5.19, 12.62) † Males Normal Reference Reference Reference IR 2.96 (1.64, 5.54) † 3.01 (1.66, 5.64) † 3.05 (1.67, 5.74) † IS-obesity 1.66 (0.63, 3.97) 1.68 (0.64, 4.03) 1.86 (0.69, 4.53) IR-obesity 6.11 (3.54, 11.05) † 6.17 (3.58, 11.17) † 7.32 (4.20, 13.41) † Females Normal Reference Reference Reference IR 3.29 (1.68, 6.83) † 3.30 (1.69, 6.84) † 3.40 (1.73, 7.09) † IS-obesity 2.31 (0.79, 6.08) 2.31 (0.79, 6.09) 2.25 (0.76, 6.02) IR-obesity 8.48 (4.42, 17.41) † 8.50 (4.42, 17.44) † 8.65 (4.45, 17.93) † Note. IR, insulin resistance; IS, insulin sensitivity. * Unadjusted for any covariates. ** Adjusted for baseline age and sex (only for total). *** Adjusted for baseline age, sex (only for total), smoking, alcohol drinking, and follow-up years. † Indicated P value < 0.05. Table 3. Odds ratios (95% CI) of joint groups of obesity and insulin sensitivity for incident diabetes
-
Figure 3 shows the mediation effect of HOMA-IR on the association between BMI trajectories and diabetes in midlife. After adjusting for sex, baseline age, smoking, alcohol consumption, and follow-up years, the total effect of the obesity group on diabetes mellitus (measured as standardized regression coefficients) was 0.093 (P < 0.001). The indirect effect of obesity on HOMA-IR (β1) and HOMA-IR on diabetes (β2) was 0.238 (P < 0.001) and 0.042 (P < 0.001), respectively. The overall indirect effect (β1 × β2) was 0.010 (P < 0.001). The percentage of the total effect mediated by the HOMA-IR was 10.7% (P < 0.001).
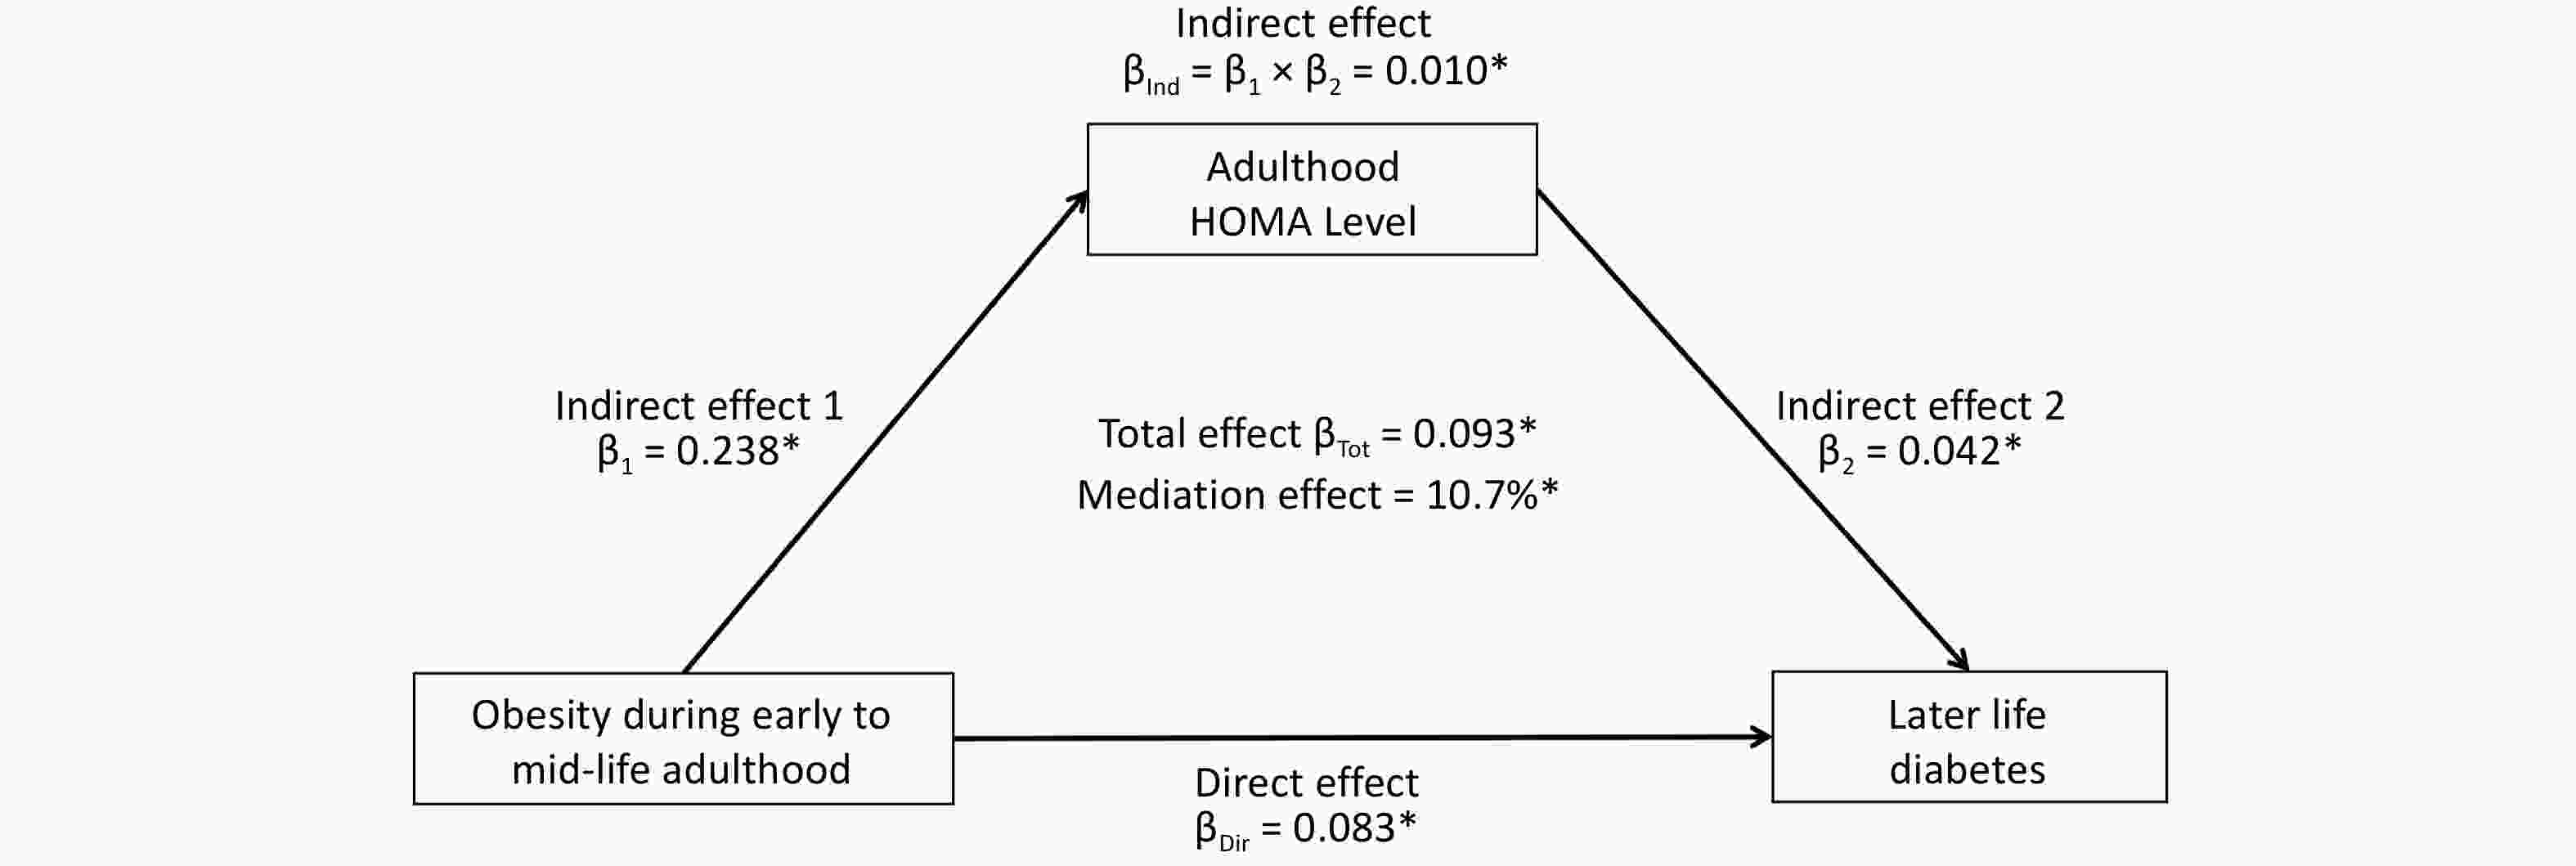
Figure 3. Mediation effect of HOMA-IR on the BMI trajectories to later life diabetes mellitus association.
-
In this longitudinal study of the Chinese population, we identified three distinct BMI trajectories from ages 20 to 50 and found both interaction and mediation effects between BMI trajectories and HOMA-IR on incident diabetes. Accumulated obesity in early to midlife is associated with incident diabetes, with modification and mediation effects of IR. Notably, obese individuals with IS aged 20–50 years presented a four-fold lower risk of diabetes than those with IR, indicating that IS obesity may be a distinct metabolically healthy subgroup. A larger number of normal-weight subjects with IR presented a higher risk of incident diabetes than the normal-weight group. Therefore, more attention should be paid to metabolic disorders in the obese population to prevent diabetes mellitus.
In the current study, we identified three distinct BMI trajectories in participants between 20 and 50 years of age. In the low-stable group, the BMI persisted at a low level of 21–23 kg/m2. In the medium-increasing group, BMI increased to 24 kg/m2 at approximately 30 years of age. In the high-increasing group, BMI increased from 24 kg/m2 to 30 kg/m2. Wei et al. defined obesity as a BMI > 24 kg/m2 at baseline in China[14]. In our study, participants in both the medium-increasing and high-increasing groups had a BMI > 24 kg/m2 in early adulthood, which is defined as obesity from a life-course perspective. Previous studies using data from China, Britain, and Finland identified 2–6 distinct BMI trajectories in adulthood[26,27,29-33]. Although the number of trajectories differed among these studies, they all discovered a low-stable group and a high-increasing group[26,27,29-33].
The role of IR in the BMI-diabetes association is unclear. In this longitudinal study, using four-way effect decomposition, we found that both interaction and mediation effects were significant and that the interaction effect was primary. The relationship between BMI and insulin levels in chronic diseases remains controversial. Zhang et al.[34] reported that the BMI-hypertension association is mediated by insulin (proportion of mediation effect = 21.1%) Wang et al.[35] presented an interaction effect between obesity and IR in diabetes research (HR = 2.02, P = 0.009). However, previous studies mainly focused on the mediation or interaction effect separately[10,17,18,34,35]. To the best of our knowledge, studies using a four-way decomposition to explore the interplay between BMI and IR on diabetes are still largely limited. Our results suggested that the interplay between BMI trajectories and HOMA-IR on incident diabetes is complicated and underscored that both BMI and IR should be controlled in early adulthood to prevent diabetes.
Notably, the interaction between obesity and IR is usually explained by MHO[13,16]. Some studies demonstrated that preserved IS is common in metabolically healthy obese individuals[10-12]. Previous studies[13-16] used baseline data to define MHO, ignoring the dynamic trends[10,13-16]. Obese individuals with a transition from metabolic health to metabolic disorders may be ignored. In the current study, we defined obesity using the BMI trajectories from 20 to 50 years, and metabolic health as IS (HOMA-IR value above the 50th percentile), which was similar to the findings of Zhang et al.[10]. Using longitudinal BMI profiles, subjects who transitioned from normal weight to obese (medium-increasing group) were correctly identified. Furthermore, the transition of metabolic status could be addressed using the final HOMA-IR data in the cohort to define IS. Only individuals with obesity for at least 5 years (from the 2004 to 2009 survey) and metabolic health were defined as MHO.
Moreover, it remains controversial whether MHO individuals are a really healthy subgroup[13-15]. Our results showed that the IR-obesity group had a higher risk of incident diabetes mellitus (OR = 7.98, 95% CI = 5.19–12.62) than the normal group, while the IS-obesity group did not seem to have a higher risk (OR = 2.05, 95% CI = 1.00–3.97). A four-fold higher risk was found in the IR-obesity group than in the IS-obesity group. This is in line with previous studies[10,13,16] indicating that obese and metabolically healthy populations should receive more attention in terms of diabetes[10]. Wei et al.[14]reported that metabolically healthy obesity increases the incidence of diabetes in the middle-aged and elderly Chinese population. However, the study may overestimate the risk of diabetes in MHO subjects because they defined the metabolically healthy obesity group using only baseline data, ignoring the changing patterns[14]. Furthermore, the IR group had a higher risk of diabetes, indicating that more attention should be paid to metabolic health in the obese population to prevent diabetes.
According to the life-course epidemiology theory, exposure at a specific period and its cumulative effect during the lifespan can greatly affect the development of diseases in later life.36-38 Our results showed that MHO individuals had a lower risk of developing diabetes. This may be caused by changes during early adulthood, such as bromodomain-containing protein 2 (brd2) gene disruption, diet, and inflammation[39-42]. Brd2 is associated with the transcriptional regulatORs of obesity and diabetes[39]. Obesity and IR are both influenced by lifestyle and diet[40]. High dietary fat intake may cause IR and result in a higher incidence of diabetes[41], while protein intake may reduce insulin resistance[41]. Compared to obese individuals with IS, those with IR might have additional predisposing fact ORs, such as higher lipid deposition in the intramyocellular and visceral compartments and lower adiponectin levels[42]. Moreover, in this longitudinal study, IR-obesity subjects were more likely to be smokers, with higher incremental WC and DBP than IS-obese subjects during follow-up. Previous studies demonstrated that smoking, incremental WC, and blood pressure are associated with IR[43-45]. Under these conditions, adjusting dietary patterns, controlling WC and blood pressure, and cessation of smoking may reduce the risk of IR and diabetes mellitus.
This study had several strengths. First, this was a community-based longitudinal study with a large sample size and repeated measurements. This allowed us to explore the BMI trajectories. Second, we defined metabolically healthy obesity using BMI trajectories and final IS status in this cohort, considering the transformation of body weight and metabolic status. Furthermore, we tested the associations between the joint groups and later diabetes, proving that obese subjects with metabolic health do not seem to have a higher risk of incident diabetes mellitus, which is more convincing than the findings of previous studies. Moreover, using the four-way effect decomposition method, we found that both interaction and mediation effects exist between BMI trajectories and HOMA-IR in diabetes research. However, this study has some limitations. First, the outcome assessments relied on self-reported data with only one biomarker collected in 2009, leading to a higher incidence of diabetes in the 2009 survey than in the other surveys. The incidence of diabetes was underestimated in the CHNS, which may have biased the logistic model results. Second, although we adjusted for covariates in our models, unobserved confounders, such as genetic background, family history, comorbidities, socioeconomic status, and additional metabolic conditions, might still influence the results. Third, the HOMA-IR was collected only in 2009 in the CHNS, leaving its dynamic changing patterns unclear. Further studies should identify the trajectory of HOMA-IR to illustrate the metabolically healthy obesity theory more strongly. Finally, the CHNS is concentrated in the Chinese population. Therefore, our results may not be generalizable to other ethnic populations.
-
In conclusion, the interplay between BMI trajectories and IR on incident diabetes mellitus was mainly an interaction effect, and the insulin-sensitive obesity group was relatively healthy compared to the insulin-resistant obesity group regarding incident diabetes. Our findings provide evidence that a metabolically healthy obesity phenotype protects against the risk of diabetes. Targeted strategies for diabetes prevention should be emphasized in normal, insulin-resistant, insulin-sensitive, and insulin-resistant obese individuals. Public health interventions to control both BMI and IR in young adults are important for preventing diabetes mellitus.
Life-Course Trajectories of Body Mass Index, Insulin Resistance, and Incident Diabetes in Chinese Adults
doi: 10.3967/bes2025.072
- Received Date: 2024-08-21
- Accepted Date: 2025-03-05
-
Key words:
- Body mass index /
- Diabetes Mellitus /
- Homeostasis model assessment of insulin resistance /
- Longitudinal studies
Abstract:
The authORs declare that they have no conflict of interest.
The study protocol was approved by the ethics committee of the National Institute for Nutrition and Health, China (CDC No. 201524). Informed consent was obtained from all participants before the investigation.
&These authors contributed equally to this work.
| Citation: | Zhiyuan Ning, Jinglan Zhang, Bingbing Fan, Yanlin Qu, Chang Su, Tao Zhang. Life-Course Trajectories of Body Mass Index, Insulin Resistance, and Incident Diabetes in Chinese Adults[J]. Biomedical and Environmental Sciences. doi: 10.3967/bes2025.072

|

 Quick Links
 DownLoad: