


-
Obesity, a chronic, complex disease characterized by excess fat deposits, has become a major public health issue worldwide. Epidemiological studies have demonstrated that obesity can result in a greater risk of several harmful outcomes, such as diabetes mellitus and cardiovascular diseases[1]. Growing evidence suggests that environmental factors, particularly exposure to endocrine-disrupting chemicals, may contribute to this epidemic[2,3]. Certain plastic-derived compounds, such as phthalates and bisphenols, exhibit obesogenic effects, potentially disrupting metabolic processes and promoting weight gain[4,5]. Notably, many studies have ignored the fact that humans are concurrently exposed to multiple plastic-derived chemicals. The effects of phthalate and bisphenol mixtures may differ from those of individual chemical contaminants, as multiple chemicals can have additive, synergistic, or antagonistic effects on human health. However, the intricate relation between these chemical combinations and obesity has not received sufficient attention in epidemiological studies. These studies relied solely on body mass index (BMI) or waist circumference to characterize obesity and to investigate the relation between chemical mixtures and obesity, which, according to the latest opinion of The Lancet Diabetes & Endocrinology Commission[6]. It may lead to either underestimation or overestimation of the true effect of chemical mixtures. Therefore, it is worth investigating the complex effects of phthalates and bisphenols on obesity, considering both BMI and waist circumference.
Using data from the 2013–2016 National Health and Nutrition Examination Survey (NHANES), a comprehensive, population-based study conducted by the Centers for Disease Control and Prevention, we examined the association between obesity and urinary concentrations of phthalate and bisphenol mixtures using multiple logistic regression for individual chemical effects and Bayesian kernel machine regression (BKMR) for overall effects. All participants signed an informed consent form, and the study protocol was approved by the institutional review board following a thorough review.
Our study used NHANES data for participants recruited between 2013 and 2016. The total number of participants was 20,146. Participants aged <20 years; those with incomplete phthalate and bisphenol concentration data; those with incomplete BMI and waist circumference data; women who were pregnant at the time of the survey; and participants diagnosed with cancer or malignancy were excluded. Finally, 2,392 participants were included in the analysis (Supplementary Figure S1).
Participants in the Mobile Examination Centers were asked to provide urine samples. After collection, the biological samples were labeled, processed, and stored at −20 °C until rigorous analysis. Detailed laboratory testing procedures, chemical measurement methods, and quality control protocols are outlined in the NHANES Laboratory Procedures and Laboratory Methods Manuals. In this study, we identified four phthalate metabolites—mono-n-butyl phthalate (MBP), mono-ethyl phthalate (MEP), mono(carboxyoctyl) phthalate (MCOP), and mono(2-ethyl-5-carboxypentyl) phthalate (MECPP)—as well as three bisphenols: bisphenol A (BPA), bisphenol F, and bisphenol S (BPS). Values below the lower limit of detection were substituted with limit of detection/√2, in accordance with NHANES standard procedures. Urinary concentrations were corrected using urinary creatinine to minimize the effect of dilution.
A BMI of 30 kg/m² or higher and waist circumference of ≥80 cm for women and ≥94 cm for men were considered indicative of obesity. We also used conventional classification methods to define general obesity (BMI >30 kg/m²) and central obesity (waist circumference >80 cm in women and >94 cm in men) to compare results based on the new definition. Several covariates were incorporated in the analysis, including age, sex, race, education level, family income-to-poverty ratio, smoking status, alcohol use, physical activity, and total energy intake. The following race categories were used in the questionnaire: Mexican American, non-Hispanic White, non-Hispanic Black, other Hispanic, and other races. Educational level was classified as college or higher, high school or equivalent, or lower than high school. Smoking status was divided into three categories: current smoker, former smoker, and never smoker. The family income-to-poverty ratio was divided into two groups: <2 and ≥2. Alcohol use was categorized as "never" or "former," based on whether the individual had consumed at least 12 alcoholic drinks in any given year. Physical activity was categorized into three groups: < 600, 600–4,000, and ≥ 4,000 metabolic equivalent min/week. Metabolic equivalent min/week were calculated using the Global Physical Activity Questionnaire. Total energy intake was categorized into three levels: low (men < 2,000 kcal/d, women < 1,600 kcal/d), adequate (men 2,000–3,000 kcal/d, women 1,600–2,400 kcal/d), and high (men > 3,000 kcal/d, women >2,400 kcal/d).
We used t-tests and χ² tests to compare continuous and categorical variables, respectively. Prior to the analysis, the creatinine-corrected concentrations of the seven chemicals were natural log-transformed to make them consistent with a normal distribution and to minimize the influence of extreme values. Pearson’s correlation analysis was conducted to evaluate the correlation between the log-transformed concentrations of the chemicals.
Weighted multivariate logistic regression modelling was used to investigate the relation between individual chemicals and obesity. Each of the seven exposure concentrations was categorized into four quartiles, with the first quartile used as a reference. The Jonckheere–Terpstra trend test was used to calculate p-values for the trends. We then performed BKMR statistical modeling to explore the overall effect of the chemical mixture on obesity and to evaluate the potential interactions among these chemicals. The Markov Chain Monte Carlo approach was implemented to create the BKMR models with 10,000 iterations, after adjusting for all covariates. The posterior means, which can be used to determine the most significant chemicals in the exposures, were derived via component-wise variable selection. All analyses were adjusted for these covariates. Statistical analyses and plotting were conducted using SAS 9.4 and R 4.4.0. All tests were two-tailed, with a significance level set at α = 0.05.
The participants’ characteristics are listed in Table 1. The analysis included 2,392 participants in total, with an obesity prevalence of 39.80%. Age, sex, race, education level, and alcohol use were significantly different between the participants with and without obesity. Supplementary Table S1 shows the characteristics of the central and general obesity groups. Correlation analysis revealed no strong correlation between the urinary phthalate and bisphenol concentrations (Supplementary Figure S2).
Characteristics Total (n = 2,392) Obesity p No (n = 1,440) Yes (n = 952) Age, year, Mean ± SD 47.30 ± 16.72 46.58 ± 17.23 48.40 ± 15.85 < 0.01 Sex, n (%) < 0.01 Men 1,155 (48.29) 744 (51.67) 411 (43.17) Women 1,237 (51.71) 696 (48.33) 541 (56.83) Race, n (%) < 0.01 Mexican American 375 (15.68) 199 (13.82) 176 (18.49) Other Hispanic 271 (11.33) 160 (11.11) 111 (11.66) Non-Hispanic White 872 (36.45) 535 (37.15) 337 (35.40) Non-Hispanic Black 548 (22.91) 285 (19.79) 263 (27.63) Other Race 326 (13.63) 261 (18.12) 65 (6.83) Education level, n (%) 0.04 Less than high school 504 (21.07) 290 (20.14) 214 (22.48) High school or equivalent 547 (22.87) 313 (21.74) 234 (24.58) College or higher 1,341 (56.06) 837 (58.12) 504 (52.94) Smoking status, n (%) 0.96 Never 1,400 (58.53) 846 (58.75) 554 (58.19) Former 494 (20.65) 295 (20.49) 199 (20.90) Current 498 (20.82) 299 (20.76) 199 (20.90) Alcohol use, n (%) < 0.01 Never 666 (27.84) 365 (25.35) 301 (31.62) Former 1,726 (72.16) 1075 (74.65) 651 (68.38) Family income-poverty ratio, n (%) 0.05 < 2 1,153 (48.20) 671 (46.60) 482 (50.63) ≥ 2 1,239 (51.80) 769 (53.40) 470 (49.37) MET min/week, n (%) 0.09 < 600 893 (37.33) 513 (35.62) 380 (39.92) 600- 853 (35.66) 533 (37.01) 320 (33.61) ≥ 4,000 646 (27.01) 394 (27.36) 252 (26.47) Total energy intake, n (%) 0.80 Low 952 (39.80) 580 (40.28) 372 (39.08) Adequate 1015 (42.43) 609 (42.29) 406 (42.65) High 425 (17.77) 251 (17.43) 174 (18.28) Note. SD, standard deviation; MET, metabolic equivalent. Table 1. Characteristics of the study participants from National Health and Nutrition Examination Survey 2013–2016
Among all chemicals, MEP had the highest level, with a median of 188.3 ng/mL. Most chemicals had a detection frequency > 90%. Bisphenol F was detected in only 56.0% of the samples and was therefore excluded from further analysis (Supplementary Table S2). A significant positive association was observed between obesity and all individual chemicals (p < 0.05) after adjusting for all covariates in the multivariate single-chemical logistic regression analysis (Supplementary Table S3). Similarly, general and central obesity were significantly and positively correlated with MCOP, MECPP, MEP, MBP, and BPA levels (Supplementary Table S4). Trend tests showed positive trends with increasing concentrations of all individual chemicals, indicating an increased risk of obesity in all three groups (P < 0.05).
In the multi-chemical logistic regression model (Table 2), MECPP, MBP, and BPA were significantly associated with obesity after adjusting for all covariates. Specifically, the second, third, and fourth quartiles of MECPP concentration, second quartile of MBP concentration, and fourth quartile of BPA concentration were significantly associated with an increased risk of obesity compared to their first quartiles. This result was consistent with that of the general obesity group. Only MEP and BPA levels were significantly associated with central obesity in the fourth quartile (Supplementary Table S5).
Chemicals Quartile OR (95% CI) P MCOP Ref. 2 1.033 (0.714, 1.495) 0.8613 3 1.119 (0.725, 1.728) 0.6121 4 1.18 (0.854, 1.632) 0.3161 MECPP Ref. 2 1.703 (1.137, 2.551) 0.0098 3 1.554 (1.021, 2.365) 0.0396 4 1.634 (1.065, 2.509) 0.0246 MEP Ref. 2 0.892 (0.641, 1.242) 0.4989 3 1.106 (0.829, 1.475) 0.4944 4 1.319 (0.843, 2.062) 0.225 MBP Ref. 2 1.508 (1.077, 2.112) 0.0167 3 1.21 (0.852, 1.718) 0.2858 4 1.325 (0.864, 2.033) 0.1974 BPA Ref. 2 0.932 (0.74, 1.174) 0.5501 3 1.073 (0.784, 1.468) 0.6614 4 1.373 (1.013, 1.859) 0.0409 BPS Ref. 2 0.95 (0.686, 1.316) 0.7593 3 1.171 (0.867, 1.579) 0.303 4 1.05 (0.729, 1.513) 0.7914 Note. Models were adjusted for age, sex, race, education, family income-to-poverty ratio, smoking status, alcohol use, physical activity, total energy intake, and other metabolite concentrations. MBP, mono-n-butyl phthalate; MEP, mono-ethyl phthalate; MCOP, mono(carboxyoctyl) phthalate; MECPP, mono(2-ethyl-5-carboxypentyl) phthalate; BPA, bisphenol A; BPS, bisphenol S; OR, odds ratio; CI, confidence interval. Table 2. Association between log-transformed concentration of multichemical urinary metabolites and obesity
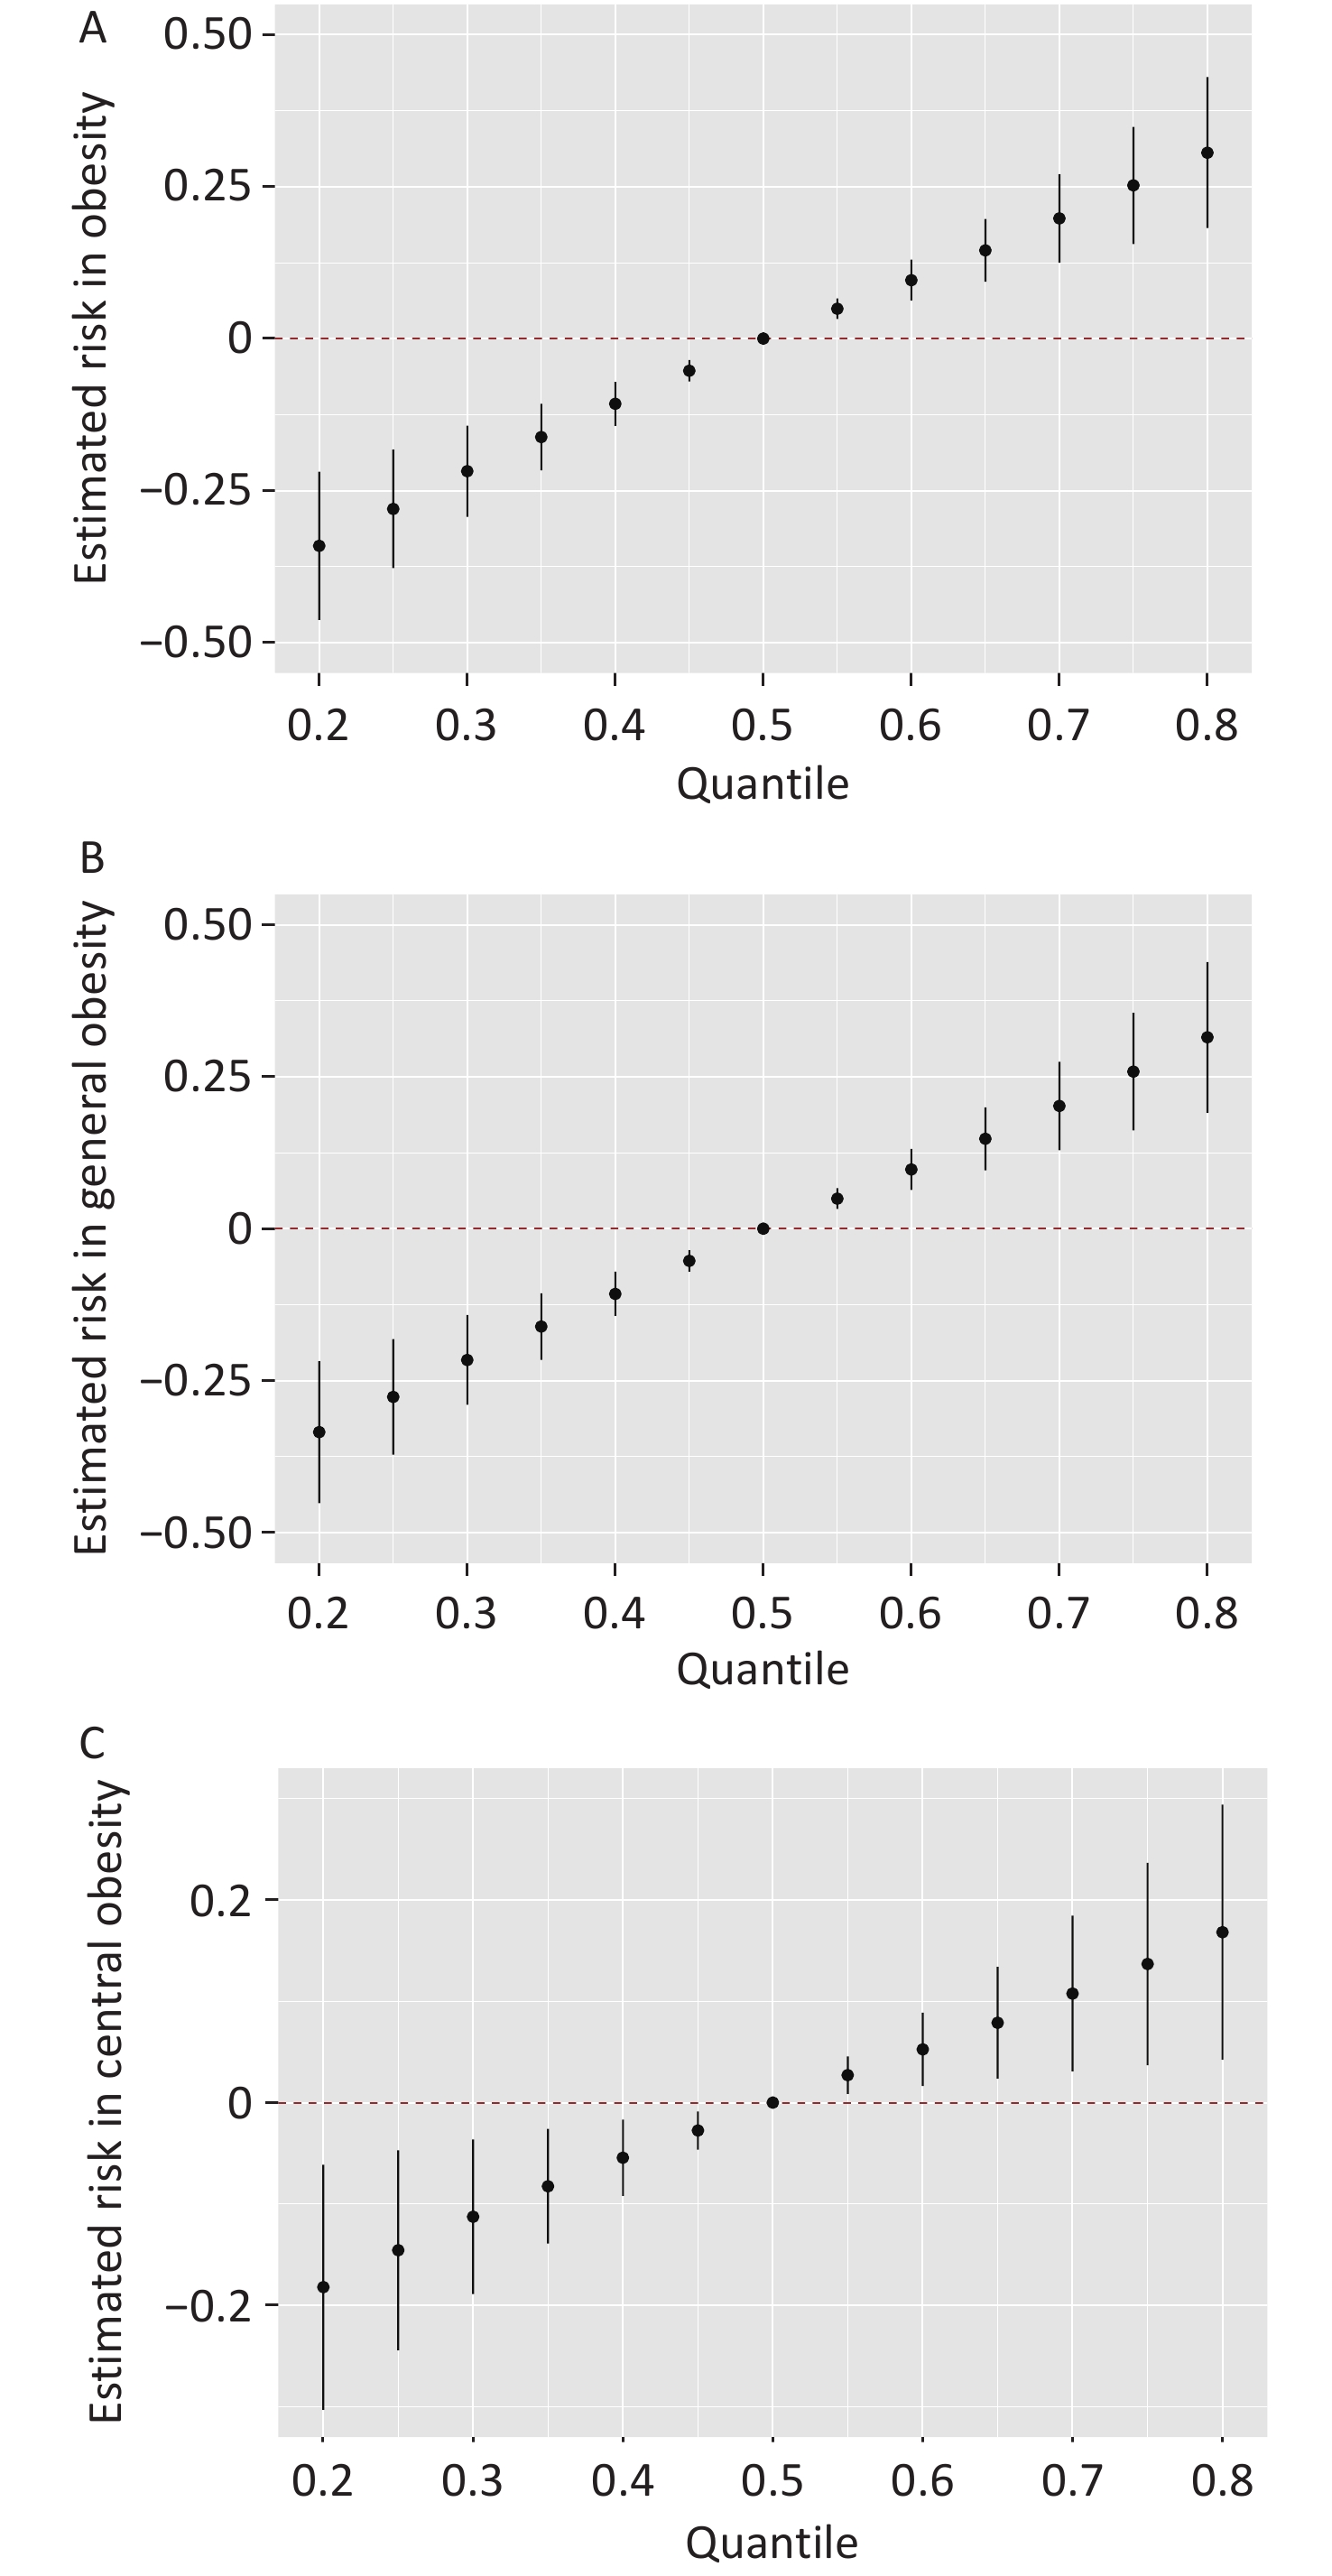
Figure 1 compared various chemical concentration levels to their 50th percentiles, illustrating the overall associations between chemical combinations and three outcomes using the BKMR model. There was a significant increase in all three obesity groups, indicating a significant positive association between chemical combinations and obesity. MEP revealed positive associations with both obesity and general obesity when the concentrations of other chemical metabolites were set to their 50th percentile. MBP, MCOP, MECPP, BPA, and BPS showed inverted U-shaped exposure–response functions with obesity and general obesity (Supplementary Figure S3). BPS and MCOP had the highest posterior inclusion probabilities in the obesity and general obesity groups, indicating that BPS and MCOP were the primary contributors to the risk of obesity, whereas MEP and MECPP played key roles in central obesity (Supplementary Table S6).
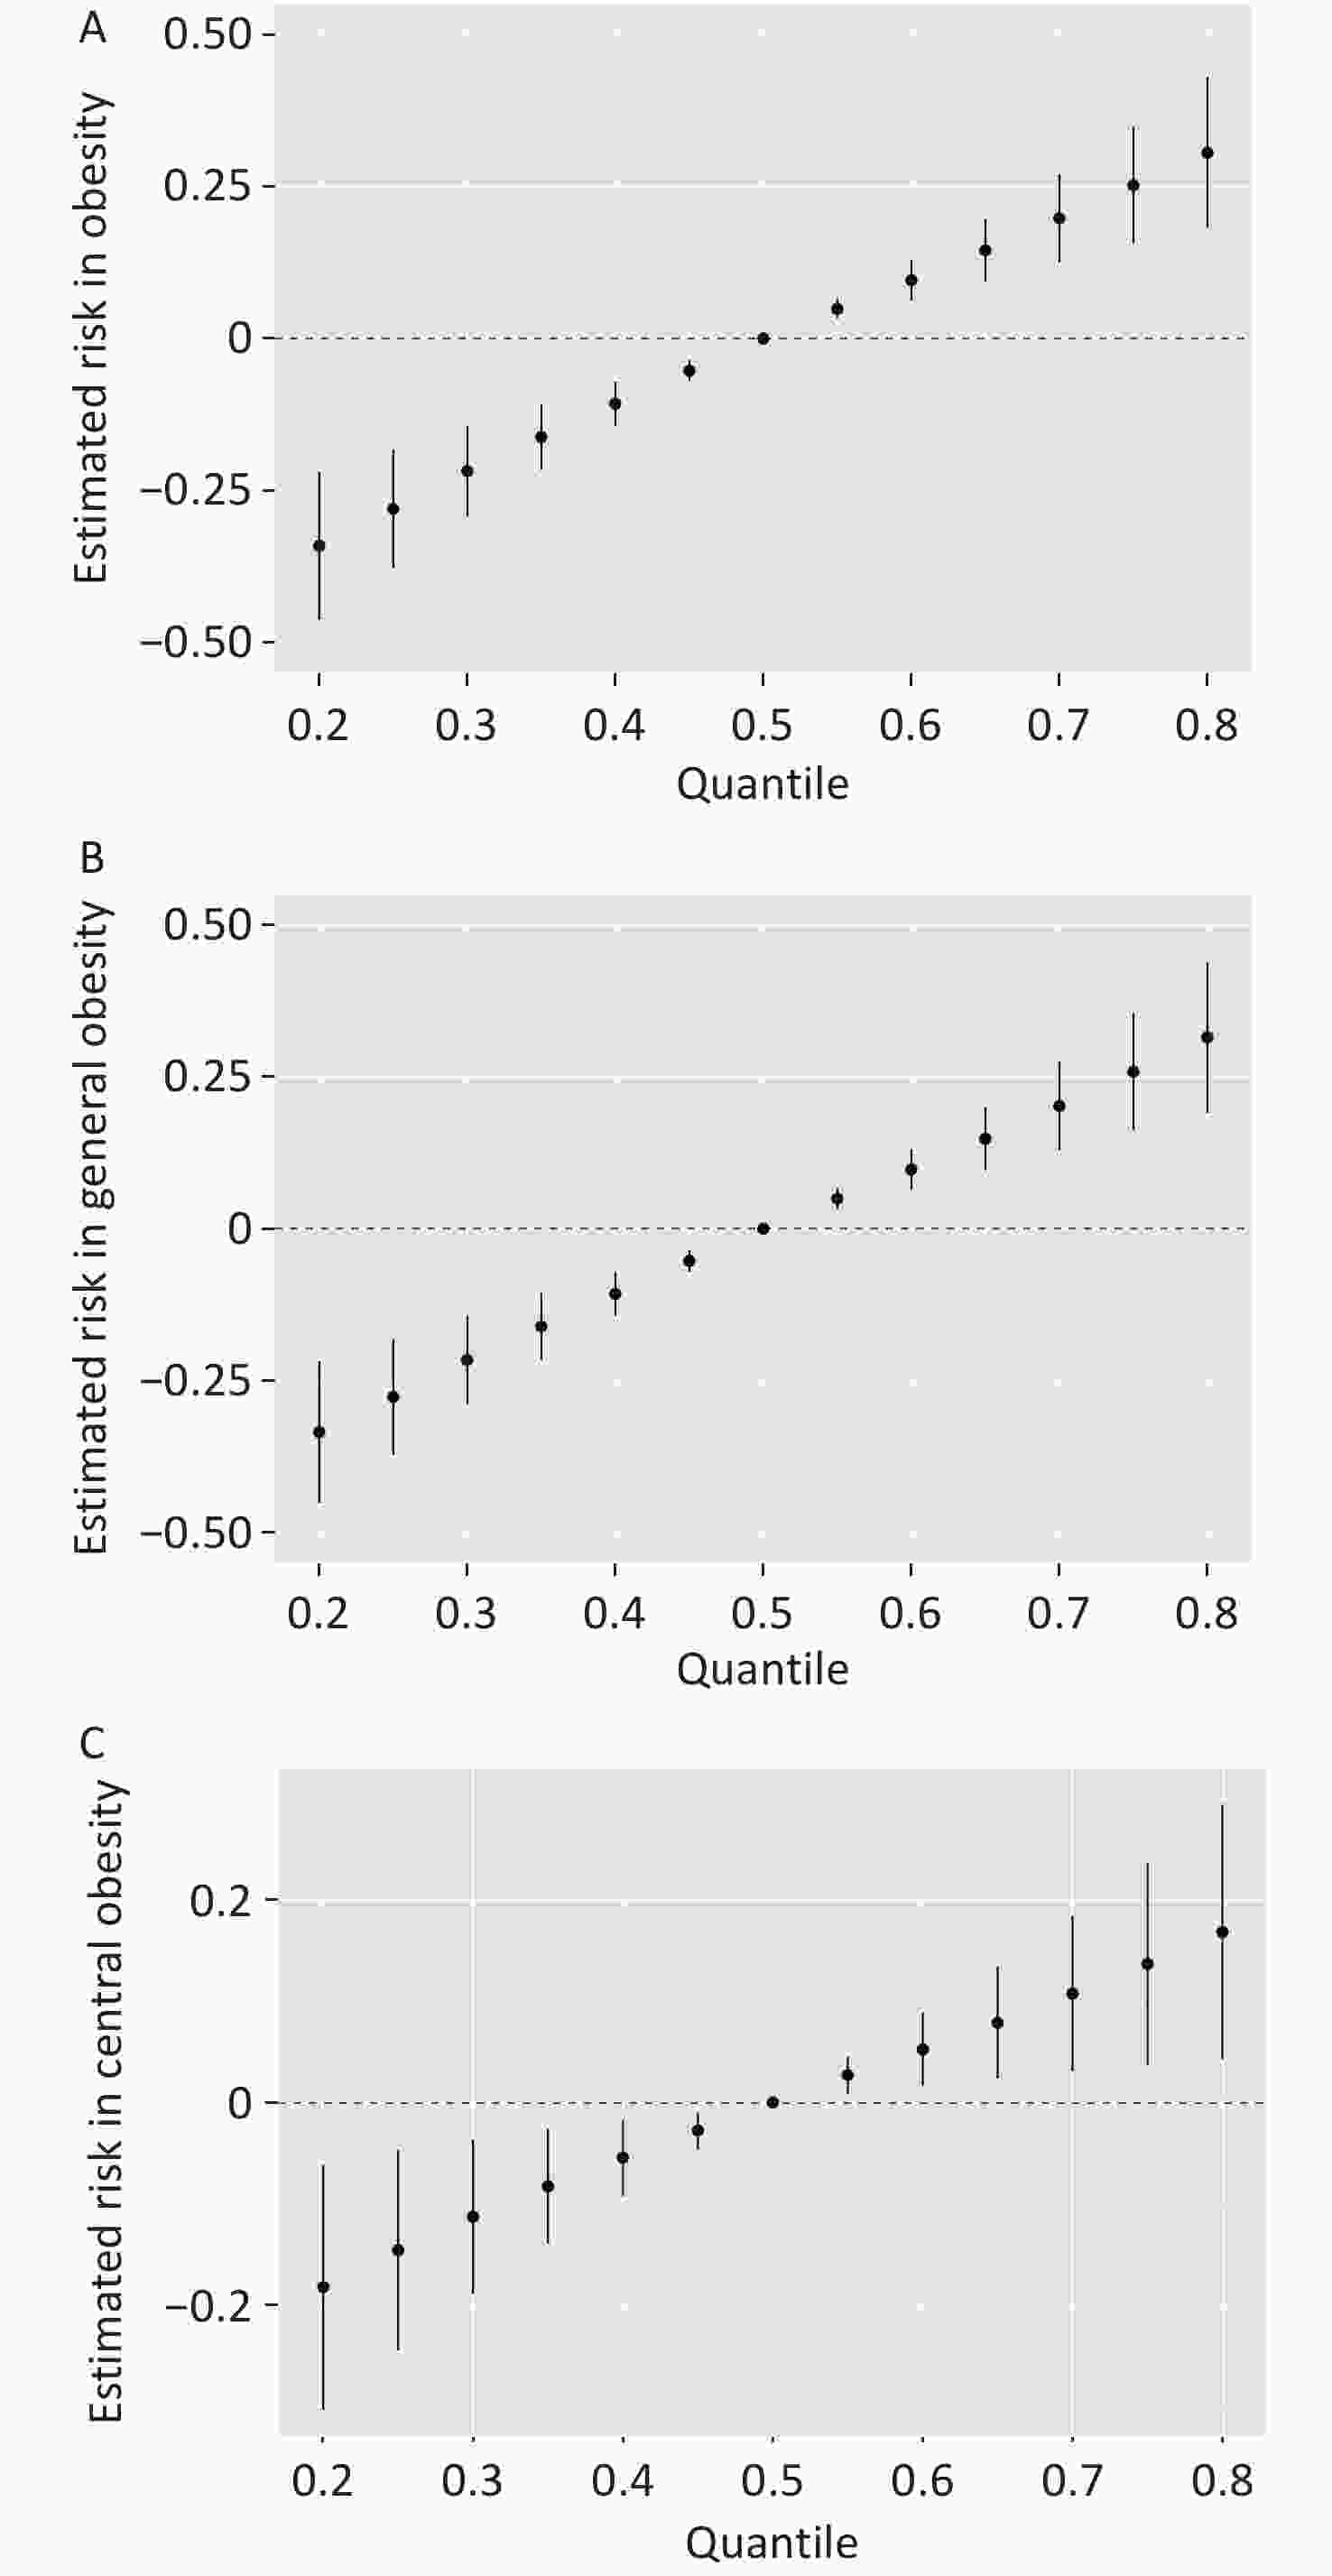
Figure 1. Joint effect (95% CI) of phthalate and bisphenol mixtures on the risk of obesity (A), general obesity (B), and central obesity (C), when comparing all chemicals at different percentiles to their 50th percentile. Models were adjusted for age, sex, race, education, family income-to-poverty ratio, smoking status, alcohol use, physical activity, and total energy intake.
Furthermore, bivariate exposure–response functions for one chemical were constructed to examine the interactions between chemical metabolites (Supplementary Figure S4). Potential interactions were observed between some chemicals across all three groups. For example, MECPP and BPS displayed steeper exposure–response curves when the concentrations of all other chemicals increased from the 10th to 90th percentile, suggesting interaction. By contrast, parallel exposure–response curves indicated no evidence of interaction between certain other chemicals.
Our results revealed that overall mixed exposure to phthalates and bisphenols was significantly associated with an increased risk of obesity, especially when the combined phthalate and bisphenol metabolite concentrations were high. We found that BPS and MCOP were the primary contributors to this joint effect. In addition, when the concentrations of all other chemicals were set at a specific exposure percentile, individual exposures to BPA and MCOP were positively associated with obesity, although no significant association was observed between exposure to either BPA or MCOP and central obesity. Moreover, in single-chemical logistic regression models, MCOP, MECPP, MEP, and MBP were positively associated with both general and central obesity, which is consistent with findings from previous studies[7]. However, this pattern was not observed in the mixed-exposure logistic regression model. This contradictory finding may be attributed to the potential interactive effects of other chemicals. In the BKMR models, we found that some phthalate and bisphenol metabolites exhibited inverted U-shaped functions in the univariate exposure–response plots, reflecting the hormetic effects of these endocrine disruptors in humans. Other metabolites exhibited nearly flat trends. These results reflect the diversity and complexity of mixed-exposure patterns. Although holding the concentrations of other chemicals at fixed quartiles facilitates inference regarding the exposure–response relation for a specific chemical, this approach overlooks the influence of variations in other chemical exposures, which better represent real-world exposure scenarios characterized by fluctuating and inconsistent levels.
Several epidemiological studies have reported conflicting findings regarding the relations among phthalates, bisphenols, and obesity. Specifically, a population-based study conducted in China revealed that exposure to phthalate metabolites was associated with a higher risk of obesity among older adults, with notable differences between men and women[8]. A study conducted in Korean children demonstrated that high MECPP concentrations were positively correlated with obesity, whereas no such association was observed with other phthalates or BPA.[9] By contrast, another study found that urinary phthalate metabolites were not significantly associated with obesity in either men or women, whereas high BPA levels were associated with an increased risk of abdominal obesity in women, particularly in postmenopausal women[10].
Our findings provide strong evidence that exposure to phthalates and bisphenols is associated with obesity, thereby shedding new light on the health risks posed by plastic pollution. One limitation of this study is that causality between chemical exposure and obesity cannot be established because of its cross-sectional design. Further mechanistic research is necessary to elucidate how exposure to these chemicals collectively contributes to the development of obesity.
Association Between Urinary Phthalate and Bisphenol Exposures and Obesity Based on Body Mass Index and Waist Circumference
doi: 10.3967/bes2025.088
- Received Date: 2025-02-22
- Accepted Date: 2025-06-03
The authors declare that they have no competing financial interests or personal relationships that could have influenced the work reported in this study.
&These authors contributed equally to this work.
| Citation: | Xin Peng, Bingsong Zhang, Zixuan Chen, Hongyuan Qi, Ying Zhu, Guoxiao Liang, Zhigang Huang. Association Between Urinary Phthalate and Bisphenol Exposures and Obesity Based on Body Mass Index and Waist Circumference[J]. Biomedical and Environmental Sciences. doi: 10.3967/bes2025.088

|

 Quick Links
 DownLoad: