


-
Diabetes mellitus, which is associated with pathophysiological changes in several tissues and organs[1,2], represents a significant global public health challenge, with a particularly high prevalence among the older adult population. Recent epidemiological studies have reported a global diabetes prevalence of 23.7% among adults aged 70 years and older[3], and in China, the prevalence exceeds 23.9% in this age group[4]. Prediabetes, defined as an intermediate metabolic state between normal glucose tolerance and type 2 diabetes mellitus (T2DM), can be diagnosed by two major clinical criteria established by the American Diabetes Association (ADA) and the World Health Organization (WHO). These criteria differ primarily in their threshold values for fasting glucose concentrations, two-hour plasma glucose levels during an oral glucose tolerance test (OGTT), and glycated hemoglobin (HbA1c) levels. Specifically, the ADA guidelines define impaired fasting glucose at a threshold of 5.6 mmol/L, whereas the WHO criterion is set at 6.1 mmol/L[5,6]. This discrepancy in diagnostic thresholds has led to considerable variation in reported prediabetes prevalence across studies. Compared with the WHO guidelines, the lower cut-off under the ADA guidelines leads to a much higher prevalence of prediabetes[7,8].
Prediabetes represents a critical risk state for diabetes development, making the transition from prediabetes to diabetes a crucial area of concern. However, the progression of hyperglycemia in older adults remains insufficiently studied[9].This metabolic progression is influenced by multiple factors, including obesity, lifestyle and some gene polymorphisms[10], among which obesity plays a particularly significant role.
Body mass index (BMI) and waist circumference (WC) serve as fundamental anthropometric measures for assessing general and central obesity, respectively. Existing evidence demonstrates significant associations between obesity and diabetes progression from prediabetes[11], Notably, anti-obesity pharmacological interventions have shown promise in reducing the risk of progression to type 2 diabetes[12]. However, inconsistencies persist regarding the specific roles of different obesity measures. While some studies indicate that general obesity, rather than abdominal obesity, significantly predicts diabetes risk in adults aged ≥40 years[13], recent studies have shown that WC may be a better predictor of T2DM development than BMI[14].
Second, the relationship between these anthropometric measures and diabetes progression may be influenced by the diagnostic criteria used for prediabetes. Preliminary evidence suggests that the progression risk is lower in adults aged ≥ 45 years with ADA-defined prediabetes compared to WHO-defined prediabetes[15]. However, a comprehensive comparative analysis of ADA and WHO criteria in relation to BMI and WC remains unexplored.
Third, most studies focus on general populations, often neglecting the unique metabolic characteristics and health challenges of older adults. Longitudinal studies indicate that diabetes progression is relatively uncommon in older adults, with fewer than 12% progressing from prediabetes to diabetes over 6.5 years, regardless of diagnostic criteria[6,16].These findings suggest distinct risk factors for progression in older adults compared to younger populations.
To address these knowledge gaps, this community-based cohort study aimed to: (1) assess the associations of obesity-related indices with diabetes progression risk in older adults, and (2) evaluate how ADA and WHO diagnostic criteria influence these associations.
-
The study utilized data from the Healthy Aging Evaluation Longitudinal Study in China (HAELS), a community-based cohort study initiated in 2019 with follow-up in 2022[17]. The study employed a multistage stratified probability-proportional-to-size (PPS) sampling and randomly sampling method to recruit 4,690 older adults aged 65 years and older from six provinces (Beijing, Shandong, Jilin, Jiangxi, Ningxia, and Guangxi), with 3999 participants completing the 3-year follow-up. Field questionnaire survey and health examination were conducted in the six provinces, and blood biomarker level was obtained from the health records of the “Basic public health service project”[18]. The HAELS study was approved by the Ethics Committee of the Chinese Center for Disease Control and Prevention (Reference number: 201936). Written informed consent was obtained from all participants (or their proxies).
-
Baseline diabetes was defined as FPG ≥ 7.0 mmol/L and/or self-reported diagnosis in hospital[15]. Among non-diabetic participants, prediabetes was classified according to ADA criteria (FPG 5.6-7.0 mmol/l). Within the ADA-defined prediabetes group, a subset meeting WHO criteria (FPG 6.1–7.0 mmol/L) was further identified for comparative analysis.
-
Weight, height, and WC were measured twice using standardized protocols, and body mass index (BMI) was calculated as weight in kilograms divided by height in meters squared (kg/m²). General obesity was defined as BMI ≥ 28.0 kg/m², overweight as 24.0 ≤ BMI < 28.0 kg/m², and normal/underweight as BMI < 24.0 kg/m². Abdominal obesity was defined using WC cut-off values of ≥ 90 cm for males and ≥ 85 cm for females[19].
For analytical purposes, BMI and WC were further stratified into quartiles based on their distribution among individuals with ADA-defined prediabetes. The quartile categories were as follows: for WC, < 80 cm (lower), ≥ 80 and < 86.25 cm (low), ≥ 86.25 and < 93 cm (high), and ≥ 93 cm (higher); for BMI, < 22 kg/m² (lower), ≥ 22 and < 24.49 kg/m² (low), ≥ 24.49 and < 26.72 kg/m² (high), and ≥ 26.72 kg/m² (higher).
Considering the relatively limited sample size in the WHO-defined prediabetes group, BMI and WC were categorized into tertiles: for WC, < 81.5 cm (low), ≥ 81.5 and < 90 cm (middle), and ≥ 90 cm (high); for BMI, < 22.67 kg/m² (low), ≥ 22.67 and < 25.75 kg/m² (middle), and > 25.75 kg/m² (high).
-
Type 2 diabetes mellitus was diagnosed based on fasting plasma glucose (FPG) levels ≥7.0 mmol/L. The date of a diabetes diagnosis was recorded as the event date. Participants who did not meet the diagnostic criteria for diabetes were censored at the date of their last FPG measurement, loss to follow-up, or death, whichever occurred first.
-
Physical exercise was categorized as ‘yes’ if a participant practiced exercise that increase the heart rate and respiratory rate, for example, running, swimming, bicycle, and square dancing, at least 30 minutes per day, three days or more per week. Dietary intake was assessed using a validated food frequency questionnaire (FFQ) that evaluated the consumption patterns of 43 distinct food categories, including desserts and fried foods (for example, fried dough sticks, chips), over the preceding 12-month period. For each food item or food group, participants were first asked to report their consumption frequency, followed by a quantitative assessment of portion size. Total dietary intake for each food item was subsequently calculated by multiplying the reported frequency of consumption by the average portion size[20]. Dessert consumption was classified as 'low intake' if weekly consumption was less than 100 grams, in accordance with established dietary guidelines. Current smoking was defined as “yes” if the participant smokes “everyday” or “non-daily”, and “No” if the participant is lifelong Non-smoker or ex-smoker. Alcohol consumption was defined as “yes” if the participant had ever drunk in the last 12 months. Hypertension status was defined by blood pressure level exceeded 140/90 mmHg or by a self-reported diagnosis in hospital[19]. Blood biochemical indicators, including FPG, triglycerides (TG) and high density lipoprotein cholesterol (HDL-C), were collected from the health records of the “Basic public health service”.
-
Baseline characteristics were compared between ADA-defined prediabetes and WHO-defined prediabetes, classified according to FPG levels. We conducted T-tests for continuous variables and chi-square tests for categorized variables; for consumption frequency of fried foods, with a skewed distribution, we calculated median values (M) and interquartile ranges (IQR) and compared them using Wilcoxon rank-sum nonparametric tests.
For the 3.6-year follow-up period, we evaluated the cumulative incidence and incidence rates (per 1000 person-years) of diabetes by ADA and WHO criteria, respectively.
Cox proportional hazards regression models were employed to estimate hazard ratios (HRs) with 95% confidence intervals (CIs) for assessing the associations of obesity-related indices with diabetes progression from prediabetes. Three models were adjusted: MODEL1 was adjusted for age, sex, education level; Model 2 was further adjusted for smoke, drink, exercise, intake of dessert, and consumption frequency of fried foods; and Model 3 was further adjusted for hypertension, baseline glucose, triglycerides (TG) and high-density lipoprotein cholesterol (HDL-C).
All analyses were conducted using SAS, version 9.4 (SAS Institute Inc., Cary, NC, USA). P < 0.05 was considered statistically significant.
-
The baseline characteristics of participants are presented in Table1. Among the 4690 participants at baseline, 1264 were defined as prediabetes according to the ADA FPG criteria, we excluded some cases with missing key variables, such as waist and body weight, finally 1127 prediabetic individuals were included in this study. Within this group, 474 participants simultaneously met the WHO FPG criteria for prediabetes, while the remaining 653 subjects, classified as the Non-WHO group, exhibited FPG levels ranging from 5.6 to 6.1. As shown in Table 1, the mean age of participants was 72 years old, female 55%, with similar baseline characteristics of prediabetic groups defined by ADA and WHO (P > 0.05), with the exception of baseline FPG level. Among the 1127 participants at baseline, 896 completed the follow-up survey.
Characteristics ADA (FPG:5.6-7.0 mmol/l) Non-WHO (FPG:5.6-6.1 mmol/l) WHO (FPG:6.1-7.0 mmol/l) P* Number of participants 1127 653 474 Age (years), mean (SD) 72.22(5.87) 72.02 (5.70) 72.49 (6.10) 0.18 Female 616 (54.66) 366 (56.05) 250 (52.74) 0.27 Education (years) 0 286 (25.38) 168 (25.73) 118 (24.89) 0.89 1-6 488 (43.30) 279 (42.73) 209 (44.09) >6 353 (31.32) 206 (31.55) 147 (31.01) Smoking 248 (22.01) 139 (21.29) 109 (23.00) 0.49 Drinking 275 (24.40) 147 (22.51) 128 (27.00) 0.08 Exercising 669 (59.36) 379 (58.04) 290 (61.18) 0.29 Low Dessert intake 951 (84.38) 559 (85.60) 392 (82.70) 0.18 Consumption Frequency of fried foods 0 (0, 0.23) 0 (0, 0.23) 0 (0, 0.47) 0.49 Hypertension 659 (58.47) 375 (57.43) 284 (59.92) 0.40 Waist circumference (cm) 86.55 (9.91) 86.88 (9.54) 86.09 (10.38) 0.19 BMI (Kg/m2) 24.52 (3.61) 24.61 (3.67) 24.40 (3.53) 0.34 FPG (mmol/l) 6.07 (0.36) 5.81 (0.14) 6.43 (0.26) <0.01 TG (mmol/l) 1.62 (1.08) 1.59 (1.01) 1.66 (1.17) 0.32 HDL-C (mmol/l) 1.48 (0.65) 1.47 (0.59) 1.50 (0.72) 0.33 Note. Data are shown as n (%) for categorical variables, and x (s) for continuous variables. Consumption Frequency of fried foods are shown as M (IQR). P<0.05 *: Comparison of baseline characteristics was conducted between ADA criteria and WHO criteria groups. BMI, body mass index; FPG, fasting plasma glucose; TG, triglycerides; HDL-C, high density lipoprotein cholesterol Table 1. Baseline Characteristics of participants by FPG level
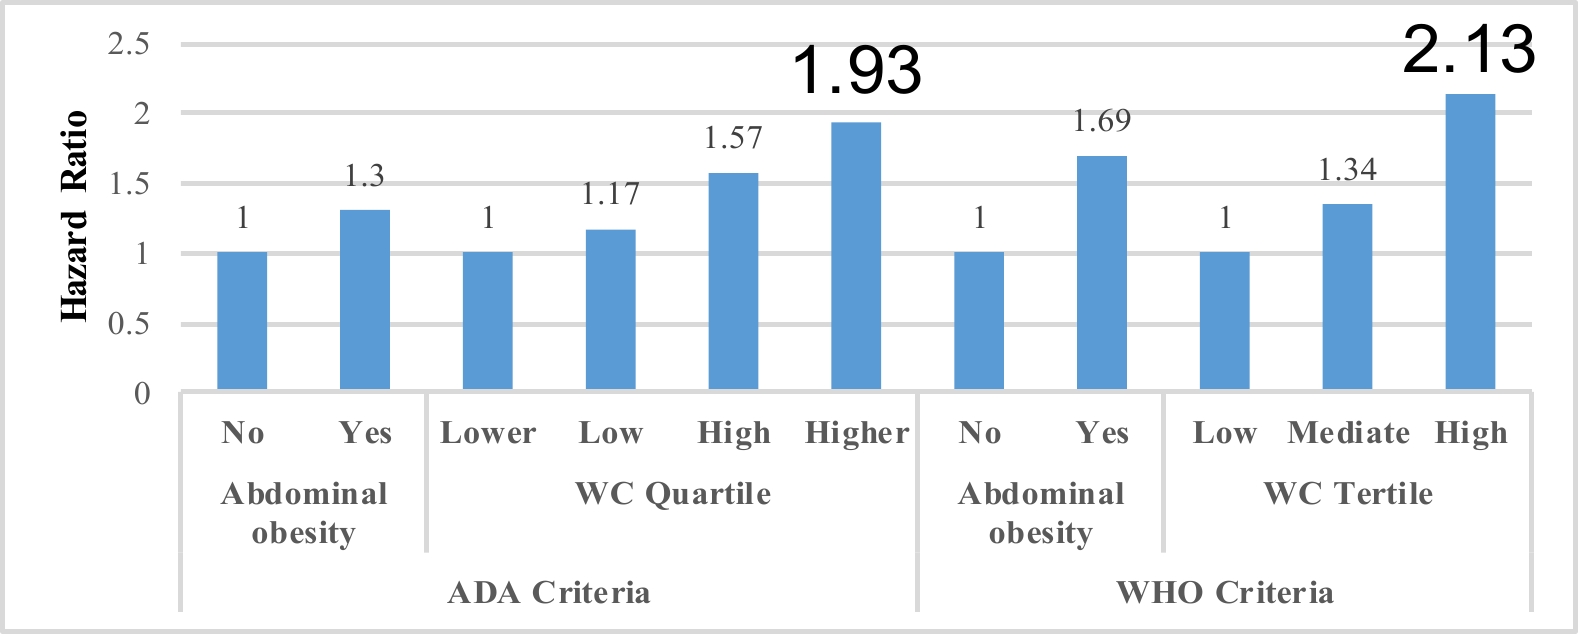
As shown in Table 2 and Figure1, among individuals with ADA-defined prediabetes, the overall diabetes incidence rate was 31.23 (95% CI, 30.01, 32.45) per 1000 person-years. WC was significantly associated with increased risk of diabetes progression (p<0.05), with an adjusted HR of 1.02 (1.003, 1.05), and further analysis showed that the association was more significant in the male, while not in the female, with the HR of 1.04 (1.01, 1.07) and 1.004 (0.97, 1.03), respectively. The highest WC quartile (≥ 93cm) demonstrated a significant association with increased diabetes progression risk (P < 0.05), with an adjusted HR of 1.93 (1.06, 3.53). However, when abdominal obesity was defined using WC cut-off values, no significant association with disease progression was observed. Similarly, neither the highest BMI quartile (≥ 26.72 kg/m²) nor general obesity (BMI ≥ 28.0 kg/m²) were significantly associated with diabetes progression risk (P > 0.05). Further analysis Gender
Variables Events/Participants Incident Density
(95% CI)HR (95% CI) Model 1 Model 2 Model 3 WC (centimeter) 1.02 (1.002, 1.04)* 1.03 (1.01, 1.05)** 1.02 (1.003, 1.05)* WC quartile Lower (<80 cm) 18/254 21.55 (20.78, 22.32) 1.00 (reference) 1.00 (reference) 1.00 (reference) Low (≥80 and <86.25 cm) 23/309 26.09 (24.10, 28.10) 1.11 (0.60, 2.07) 1.21 (0.65, 2.27) 1.17 (0.62, 2.22) High (≥86.25 and <93 cm) 30/273 32.17 (31.13, 33.21) 1.46 (0.81, 2.64) 1.76 (0.97, 3.20) 1.57 (0.85, 2.88) Higher (≥93 cm) 36/291 42.55 (39.04, 46.06) 1.79 (1.01, 3.17)* 2.18 (1.22, 3.89)** 1.93 (1.06, 3.53)* Abdominal obesity No 45/580 22.63 (22.27, 22.98) 1.00 (reference) 1.00 (reference) 1.00 (reference) Yes 62/547 32.44 (31.33, 33.55) 1.32 (0.89, 1.96) 1.57 (1.04, 2.35)* 1.30 (0.85, 2.00) BMI 1.06 (1.01, 1.12)* 1.06 (1.01, 1.11)* 1.04 (0.98, 1.10) BMI quartile Lower (<22) 18/282 20.43 (19.86, 21.00) 1.00 (reference) 1.00 (reference) 1.00 (reference) Low (≥22 and <24.49) 27/282 26.09 (25.38, 26.81) 1.35 (0.74, 2.46) 1.41 (0.77, 2.58) 1.25 (0.68, 2.29) High (≥24.49 and <26.72) 30/281 30.12 (29.06, 31.18) 1.55 (0.86, 2.81) 1.73 (0.95, 3.41) 1.41 (0.76, 2.64) Higher (≥26.72) 32/282 27.04 (25.83, 28.24) 1.71 (0.95, 3.07) 1.80 (0.99, 3.24) 1.47 (0.79, 2.71) General obesity Normal/underweight 41/514 21.97 (21.54, 22.39) 1.00 (reference) 1.00 (reference) 1.00 (reference) Overweight 40/426 26.57 (25.71, 27.43) 1.15 (0.74, 1.78) 1.22 (0.78, 1.90) 1.02 (0.64, 1.63) Obese 26/187 40.51 (38.92, 42.09) 1.83 (1.11, 3.00)* 1.82 (1.10, 3.00)* 1.52 (0.91, 2.54) Notes: WC: waist circumference, BMI: body mass index, CI: confidence interval. Model1 was adjusted for age, sex, education level; Model 2 was further adjusted for smoke, drink, exercise, intake of dessert, and consumption frequency of fried foods; and Model 3 was further adjusted for hypertension, baseline glucose, TG and HDL-C. *: p<0.05, **: p<0.01. Table 2. Association of obesity indices with progression of diabetes by ADA criteria (n=1127)
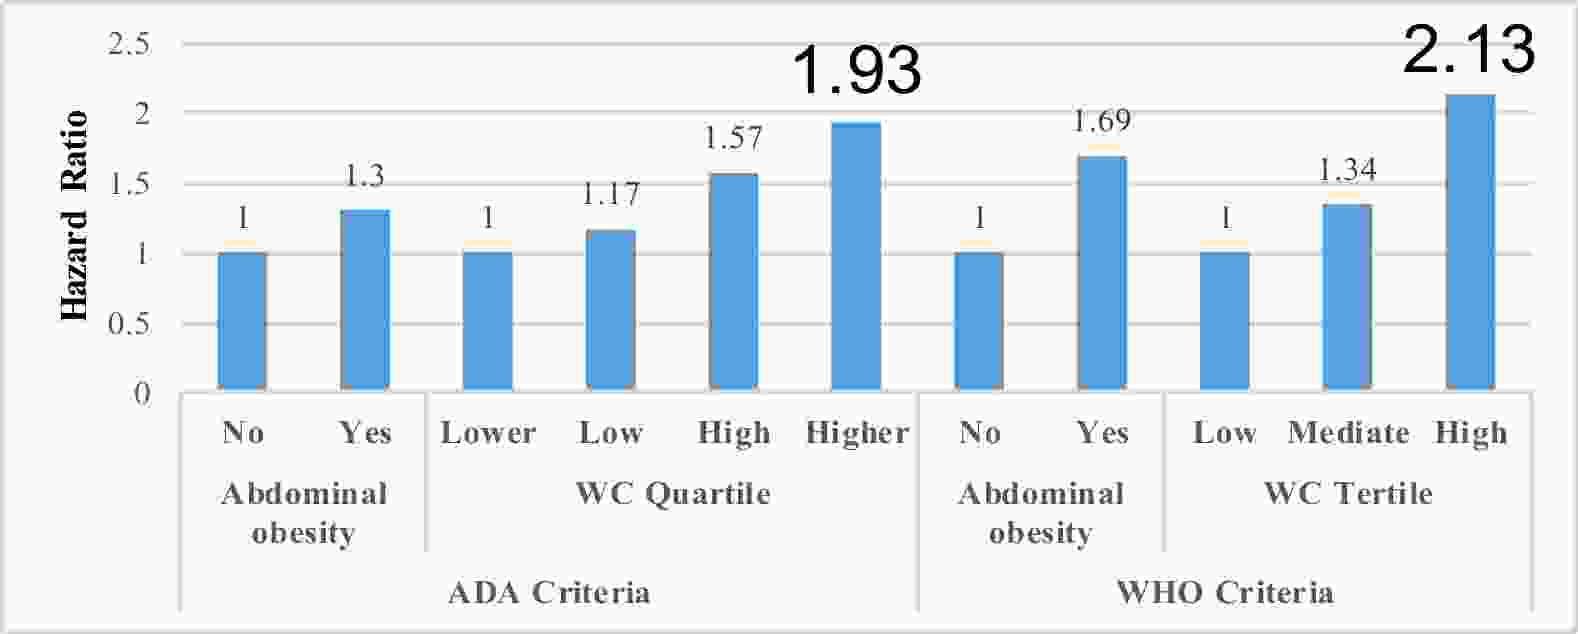
Figure 1. Hazard ratios of diabetes progression in prediabetic older adults by prediabetes criteria and WC categories. WC: waist circumference, ADA: American Diabetes Association, WHO: World Health Organization. *: p<0.05
As shown in Table 3 and Figure1, among individuals with WHO-defined prediabetes, the overall diabetes incidence rate was 43.96 per 1000 person-years (95% CI, 41.38, 46.54). The highest WC tertile (≥ 90cm) demonstrated a significantly association with diabetes progression from prediabetes (P<0.05), yielding an adjusted HR of 2.13 (1.06, 4.27). However, when abdominal obesity was defined using standard WC cut-off values, no significant association with disease progression was observed (P>0.05).
Variables Events/Participants Incident Density
(95% CI)HR (95% CI) Model 1 Model 2 Model 3 WC 1.03 (1.01, 1.06)* 1.04 (1.02, 1.07)** 1.04 (1.01, 1.07)** WC quartile Low (<81.5 cm) 15/158 31.21 (29.66, 32.75) 1.00 (reference) 1.00 (reference) 1.00 (reference) Mediate (≥81.5 and <90 cm) 19/152 36.80 (35.12, 38.47) 1.20 (0.60, 2.39) 1.41 (0.71, 2.83) 1.34 (0.65, 2.75) High (≥90 cm) 28/164 41.38 (39.58, 43.18) 1.70 (0.89, 3.26) 2.36 (1.21, 4.61)* 2.13 (1.06, 4.27)* Abdominal obesity No 25/253 31.93 (30.97, 32.90) 1.00 (reference) 1.00 (reference) 1.00 (reference) Yes 37/221 38.72 (37.21, 40.22) 1.46 (0.86, 2.49) 1.88 (1.09, 3.24)* 1.69 (0.95, 3.01) BMI 1.08 (1.01, 1.16)* 1.08 (1.01, 1.16)* 1.08 (1.00, 1.16)* BMI tertile Low (<22.67) 16/159 31.61 (30.09, 33.13) 1.00 (reference) 1.00 (reference) 1.00 (reference) Mediate (≥22.67 and <25.75) 18/156 37.98 (36.27, 39.69) 1.09 (0.55, 2.16) 1.18 (0.59, 2.36) 1.06 (0.51, 2.21) High (≥25.75) 28/159 37.19 (34.40, 39.98) 1.75 (0.93, 3.31) 2.05 (1.07, 3.94)* 1.88 (0.92, 3.81) General obesity Normal or underweight 22/224 31.69 (30.62, 32.77) 1.00 (reference) 1.00 (reference) 1.00 (reference) Overweight 25/178 43.02 (40.78, 45.25) 1.34 (0.75, 2.38) 1.46 (0.81, 2.64) 1.36 (0.73, 2.55) Obese 15/72 53.05 (48.42, 57.69) 2.52 (1.27, 5.02)** 2.56 (1.28, 5.11)** 2.44 (1.19, 5.01)* Note. WC: waist circumference, BMI: body mass index, CI: confidence interval. Model1 was adjusted for age, sex, education level; Model 2 was further adjusted for smoking, drinking, exercising, intake of dessert, and consumption frequency of fried foods; and Model 3 was further adjusted for hypertension, baseline glucose, TG and HDL-C. *: p<0.05, **: p<0.01. Table 3. Association of obesity indices with progression of diabetes by WHO criterion (n=474)
Notably, neither general obesity (BMI ≥ 28.0 kg/m²), nor the high BMI tertile (≥ 25.75 kg/m²), were significantly associated with diabetes progression, with adjusted HRs of 2.44 (1.19, 5.01) and 1.88 (0.92, 3.81), respectively.
-
To the best of our knowledge, this represents the first comprehensive investigation of the role of obesity measures in diabetes progression among older adults with prediabetes. Overall, in this longitudinal community-based cohort study, we found significant associations of obesity indices with diabetes progression risk in older adults with prediabetes, which was consistent with previous studies [21,22], and these associations may vary on the prediabetes criteria used, notably, the initial FPG level at baseline. One study conducted in the US population also showed initial serum glucose was an important predictor for diabetes progression from prediabetes[22,23].
Specifically, we identified distinct patterns of association depending on the diagnostic criteria employed. Utilizing ADA criteria for prediabetes, elevated waist circumference (WC ≥ 93 cm) demonstrated a positive association with diabetes progression, whereas neither cut-off-based abdominal obesity nor BMI-related indices showed significant associations. Utilizing WHO criteria, both elevated WC (≥ 90 cm) and general obesity (BMI ≥ 28.0 kg/m²) were significantly associated with diabetes progression, whereas cut-off-based abdominal obesity and the high BMI tertile (≥ 25.75 kg/m²) failed to demonstrate significant associations. These differential association patterns suggested that the predictive value of anthropometric indices may be influenced by both the specific measure employed and the diagnostic thresholds applied for defining prediabetes.
Our findings based on ADA criteria are consistent with previous studies demonstrating that WC is a stronger predictor of diabetes risk than BMI[24,25], and OR of progression to diabetes from prediabetes is also higher than BMI (2.5 vs 1.98) in one Africa study[26] . This can be understood through the role of insulin resistance, a key driver of type 2 diabetes. Insulin resistance is characterized by diminished insulin-stimulated glucose transport and metabolism in peripheral tissues, coupled with impaired suppression of hepatic glucose production[27]. Although greater adiposity generally correlates with insulin resistance, fat distribution is a critical factor. Intra-abdominal fat is more strongly linked to insulin resistance and type 2 diabetes than peripheral fat depots[28]. In the context of ADA-defined prediabetes, where baseline FPG and insulin resistance are relatively moderate, WC may be a more sensitive predicator of diabetes risk than BMI.
Applying the WHO criteria, which define prediabetes at higher baseline fasting plasma glucose (FPG) levels, both higher waist circumference (WC > 90 cm) and general obesity (BMI ≥ 28.0 kg/m²) were significantly associated with diabetes progression. These findings are consistent with previous studies applying WHO diagnostic criteria[29] . Furthermore, the interaction between elevated baseline FPG levels and BMI in diabetes development[30] may explain why BMI emerged as a significant predictor in this context.
Interestingly, analyzing data using ADA criteria, cut-off-based diagnosed abdominal obesity failed to show significant association with progression risk. This discrepancy may be attributed to the relatively conservative WC thresholds used in cut-off-based diagnostic criteria compared to our study's higher WC cutoff (≥93 cm). Similarly, under WHO criteria, neither cut-off-based diagnosed abdominal obesity nor the high BMI tertile (≥25.75 kg/m²) showed significant associations. We hypothesize that this observation may be explained by two factors: first, the mean WC in the guidelines-based diagnosed group was substantially lower than our high WC group (≥90 cm); second, the BMI threshold for the high tertile (≥25.75 kg/m²) was considerably lower than the cutoff for general obesity (≥28.0 kg/m²). The findings of this study suggest that the cut-off-based obesity criteria in the current guidelines may not be optimal for assessing diabetes progression risk in prediabetic populations.
The study has several notable strengths. First, as a community-based 3.6-year prospective cohort study, it provides robust longitudinal data to elucidate the role of obesity-related indices in diabetes progression from pre-diabetes. Second, our analytical approach incorporated both data-driven categorization (quartiles/tertiles) of BMI and WC as well as standard guidelines-based diagnostic criteria, allowing for a comprehensive evaluation of their association with progression risk. Third, the simultaneous application of both ADA and WHO diagnostic criteria for prediabetes offers valuable insights into potential sources of variability across studies, thereby enhancing the generalizability and comparability of our findings.
However, this study has several limitations. First, prediabetes was defined solely by FPG level, which may limit the generalizability of our findings to other prediabetes definitions or diagnostic criteria. Second, this study relied solely on fasting blood glucose values for diabetes diagnosis during follow-up, which may underestimate its incidence and possibly affecting the study results. Third, as the study focused on older adults in China, further research is needed to determine the applicability of these results to other demographic groups and populations.
In conclusion, our findings demonstrate that elevated waist circumference, rather than BMI-related indices, is positively associated with progression to diabetes from prediabetes defined by the ADA criteria. However, both measures show significant associations with diabetes progression applying the WHO criterion of prediabetes. These results showed that WC is an earlier predictor of diabetes progression than BMI, and WC monitoring should be emphasized to assess the risk of diabetes progression the older prediabetic individuals in the community, especially when the FPG level does not meet WHO criteria of prediabetes.
Anthropometric Obesity Measures and Diabetes Progression from Prediabetes in Older Adults: A Comparison of American Diabetes Association and World Health Organization Criteria
doi: 10.3967/bes2025.090
- Received Date: 2025-07-17
- Accepted Date: 2025-04-14
-
Key words:
- Obesity /
- Diabetes progression /
- Prediabetes /
- ADA criteria /
- WHO criteria
Abstract:
The authors declare no conflict of interest.
| Citation: | Xiujuan Zhang, Huijie An, Virginia Byers Kraus, Xin Gao, Yunfan Li, Bowen Wang, Zhaoxue Yin. Anthropometric Obesity Measures and Diabetes Progression from Prediabetes in Older Adults: A Comparison of American Diabetes Association and World Health Organization Criteria[J]. Biomedical and Environmental Sciences. doi: 10.3967/bes2025.090

|

 Quick Links
 DownLoad: