-
Hypertension (HTN) is a chronic disorder characterized by elevated blood pressure, which significantly raises the risk of cardiovascular disease (CVD), stroke, diabetes, and kidney failure[1,2]. HTN is responsible for over 10 million deaths annually[1-3]. Its global prevalence more than doubled between 1975 and 2015, affecting 1.13 billion adults, with low and middle-income countries (LMICs) disproportionately impacted[4]. Despite improvements in some high-income countries, HTN remains a significant public health challenge, particularly in regions such as South Asia, sub-Saharan Africa, and Eastern Europe[4-7].
In China, the prevalence of HTN has increased significantly over the past two decades. A recent national surveillance study (2021–2023) reported that HTN was responsible for nearly two-thirds (64.3%) of heart attack cases, emphasizing its critical role as a preventable cardiovascular risk factor[8]. The China Chronic Disease and Risk Factors Surveillance documented a rise in HTN prevalence from 20.8 in 2004 to 29.6 in 2010, followed by a slight decline to 24.7% in 2018[9]. However, effective detection and control strategies remain insufficient, especially in rural areas, where underdiagnosis remains a serious concern. A study by Zhang et al. found that 32.02% of HTN cases in rural China were undiagnosed[10]. Limited access to primary healthcare services in these settings further exacerbates management challenges.
Various international guidelines, including those from the American College of Cardiology and the American Heart Association, recommend a target blood pressure of 130/80 mmHg for individuals at high risk of CVD[11,12]. However, differences across global recommendations and a lack of region-specific tools highlight the need for more tailored approaches, especially for Asian and rural populations (Refer to Supplementary Material for additional background).
This study addresses a critical gap in HTN classification and monitoring in rural China by introducing an innovative seven-category blood pressure classification system, providing a more refined and context-specific approach to diagnosis. By assessing HTN prevalence, awareness, treatment, and control, we aim to better understand how demographic and behavioral factors influence HTN outcomes. To explore these relationships, we employ a generalized linear mixed-effects model (GLMM). By comparing two survey waves (2015–2017 and 2018–2022), this study also provides insights into the evolving trends of HTN over time. Ultimately, our findings aim to inform targeted and effective strategies for improving HTN care and prevention in rural Chinese populations.
-
The Henan Rural Cohort Study is a prospective, population-based investigation aimed at assessing the prevalence and determinants of chronic non-communicable diseases (NCDs) in rural China (registration number: ChiCTR-OOC-15006699)[13]. Detailed protocols for study design and participant recruitment have been published previously[13,14].
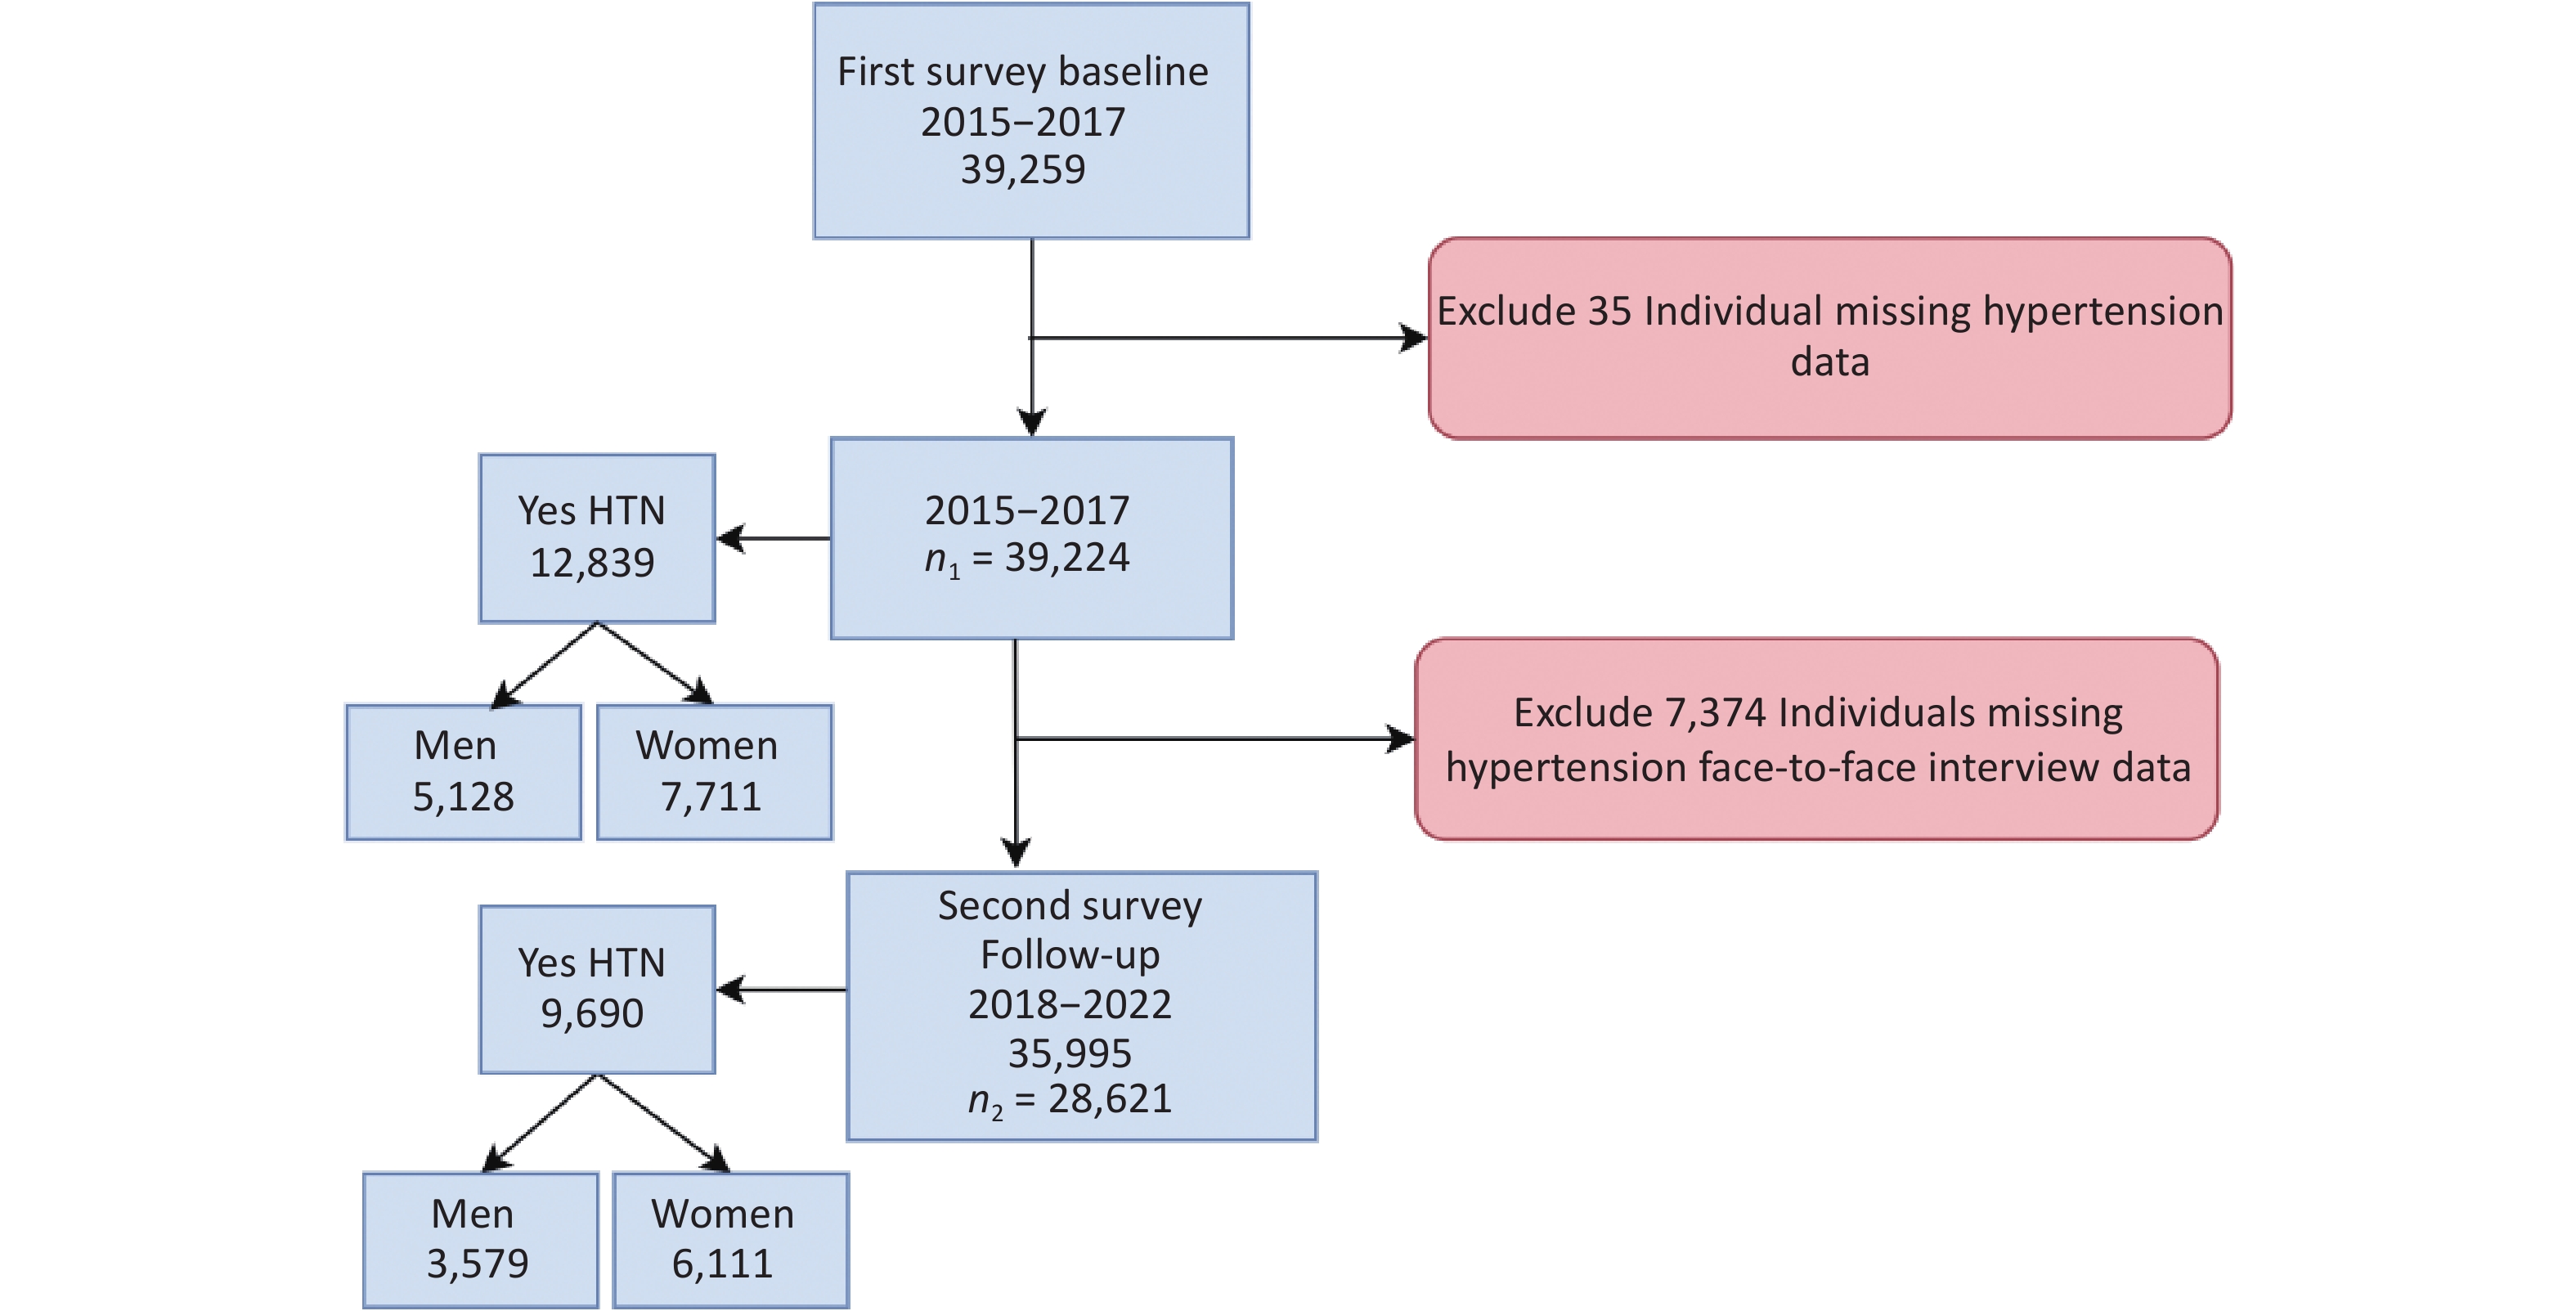
The baseline survey (2015–2017) enrolled 39,259 participants aged 18–79 years from five rural regions of Henan Province using a multistage cluster-sampling technique, achieving a 93.7% response rate. A follow-up survey was conducted from 2018 to 2022, successfully reaching 35,995 of the original participants (a 91.7% follow-up rate) via face-to-face interviews and telephone calls.
During the follow-up period, the COVID-19 pandemic necessitated the suspension of in-person visits in 2020, leading to gaps in blood pressure (BP) data. To maintain methodological consistency with baseline measurements, this analysis exclusively includes 28,621 participants with a physical BP measurement obtained during follow-up. Individuals for whom only telephone-based health status was collected were therefore excluded. The detailed flow chart of participant inclusion and exclusion is presented in Figure 1, which illustrates the study design and follow-up process.
-
Demographic, lifestyle, and environmental data, including alcohol consumption, smoking status, dietary habits, salt intake, fruit and vegetable consumption, physical activity, and access to healthcare, were collected through face-to-face interviews using validated questionnaires[15-17].
To ensure data reliability, a small-sample pilot validation study was conducted before the main survey. A group of 76 participants completed the questionnaire twice, one week apart, achieving a 100% response rate. The internal consistency of the questionnaire was confirmed by a Cronbach’s alpha coefficient of 0.729, and test-retest reliability was high, with an intraclass correlation coefficient (ICC) of 0.841, indicating good reliability.
Blood pressure (BP) was measured three times at 30-second intervals using a calibrated electronic sphygmomanometer (Omron HEM-7071) after participants had been seated at rest for at least 5 minutes, in accordance with World Health Organization (WHO) and Chinese national protocols[18,19]. To minimize activity-related bias, the average of the last three readings was used as the final systolic and diastolic BP values. If systolic and diastolic values fell into different categories, the higher category was used for classification.
Hypertension (HTN) was defined as systolic blood pressure (SBP) ≥ 140 mmHg and/or diastolic BP ≥ 90 mmHg, or having a self-report of physician-diagnosed hypertension and anti-hypertension treatment in the last 2 weeks, based on the 2018 Chinese Guidelines for the Prevention and Treatment of HTN[20]. BP was further categorized into seven clinical stages, ranging from optimal to very severe HTN, to enable early detection and intervention (Figure 2, Supplementary Table S7).

Figure 2. Classification of Blood Pressure and Hypertension Based on Systolic and Diastolic Values. This figure outlines the categories used to classify blood pressure, ranging from “Optimal” to “Stage 4 Hypertension”, based on specific thresholds for Systolic (SBP) and Diastolic (DBP) Blood Pressure. Classification of blood pressure and hypertension into seven categories is based on systolic blood pressure (SBP) and diastolic blood pressure (DBP) levels. The classification model integrates standards from multiple international hypertension guidelines (including ACC/AHA, ESC/ESH, and the Korean Society of Hypertension), and is applied here in the context of the Chinese population using the thresholds defined in the Chinese Guidelines for the Prevention and Treatment of Hypertension. The seven categories include optimal, normal, high normal, and four stages of hypertension (mild to very severe), defined by progressively increasing SBP and DBP values.
-
The statistical analyses were performed by using IBM SPSS version 27.0 and the R Studio lme4 package. HTN prevalence was examined across age groups within the cohort, and national census data from 2010 and 2020[21,22], were referenced to contextualize age-related demographic trends in rural China. For continuous variables, data are presented as means ± SD, whereas for categorical variables, percentages are used. Group differences were assessed via student t-tests (continuous) or chi-square tests (categorical). Normality was assessed using the Shapiro–Wilk test, and multicollinearity was evaluated using the Variance Inflation Factor (VIF). All covariates were retained if the VIF was below 5. BP was measured three times and averaged for HTN classification (binary: yes/no) and SBP and DBP values. Averages were used to categorize HTN into seven stages: Optimal, Normal, High Normal, and Stages 1–4. HTN prevalence (baseline: 2015–2017; follow-up: 2018–2022) was calculated as the number of HTN cases divided by the total population, expressed as a percentage (100 × [number of HTN cases/total population]). Category-specific prevalence was also determined. Trends were visualized graphically, comparing baseline and follow-up data by gender.
-
Individuals were stratified into age groups (18–39, 40–59, and 60+ years) according to Centers for Disease Control and Prevention (CDC) criteria[23]. HTN prevalence across these groups was visualized graphically, showing distribution by SBP and DBP categories. Binary response data hypertension (HTN yes/no) were used to calculate age-specific prevalence rates.
-
This study employs a generalized linear mixed-effects model (GLMM) with logistic regression to predict HTN risk in rural adults (2015–2022), combining data from two surveys.
The model can be expressed as:
$$ HTNi\sim Binomial(1,pi) $$ logit(pi)=β0+β1×Regioni+β2×Genderi+β3×Agei+…+βk×Time Pointi+bIDi
Where:
• The dependent variable is the binary HTN status (HTN = yes/no).
• The independent variables include demographic and environmental factors, such as age, gender,
region, and time point, along with other identified risk factors.
• A random intercept term (bIDi) is included to account for individual-level variability over time.
-
We calculated 95% confidence intervals for trends in HTN prevalence using binary response data on awareness, treatment, and control, comparing crude and standardized rates between baseline and follow-up surveys. Awareness refers to the proportion of individuals diagnosed with HTN who were aware of their condition. Treatment indicates the proportion of those aware who reported using antihypertensive medication. HTN control was defined as SBP < 140 mmHg and DBP < 90 mmHg, achieved through lifestyle changes or medication, and the control rate was the percentage of treated individuals who met these thresholds.
-
Hypertension (HTN) prevalence was closely associated with sociodemographic and lifestyle characteristics across both survey waves. Among hypertensive individuals, 33.8% had a monthly income below 500 RMB during the baseline survey (2015–2017) and 29.6% during the follow-up (2018–2022), highlighting persistent economic vulnerability. Similarly, 15.3% of hypertensive participants in the follow-up survey were illiterate, suggesting a potential link between limited education and elevated HTN risk. Lifestyle patterns also played a notable role, with 20.7 and 21.5% of hypertensive participants reporting a high-fat diet (HFD) in the baseline and follow-up periods, respectively. Additionally, current alcohol consumption was observed in 18.1 and 15.5% of participants in the baseline and follow-up periods, respectively. In terms of physical activity, 29.8% of individuals with hypertension reported low activity during the baseline period. Furthermore, 37.0% were widowed during follow-up, subgroups potentially facing psychosocial stress and reduced healthcare access. Notably, the proportion of women among hypertensive individuals increased from 60.8 to 62.3%, while the proportion of men decreased from 39.2 to 37.7%, further emphasizing gender differences in the HTN burden (Table 1).
Variables Baseline Survey (2015-2017) Follow-up Survey (2018-2022) P-value HTN no-HTN HTN no-HTN Age (years) 53.3 ± 12.4 60.4 ± 10.1 57.6 ± 12.1 64.0 ± 9.9 < 0.001 Gender, n (%) 10349 (39.2) 5128 (39.9) 7140 (37.7) 3579(36.9) 0.345 Men 10349 (39.2) 5128 (39.9) 7140 (37.7) 3579(36.9) 0.345 Women 16036 (60.8) 7711 (60.1) 11791 (62.3) 6111 (63.1) 0.345 Education Level, n (%) Illiterate 3747 (14.2) 2783 (21.7) 2886 (15.3) 2200 (22.7) < 0.001 Primary School 18186 (68.9) 8471 (66.0) 12779 (67.7) 6225 (64.3) 0.025 Middle School or above 4452 (16.9) 1585 (12.3) 3219 (17.0) 1250 (12.9) 0.010 Marital Status, n (%) Married/cohabiting 24023 (91.0) 11187(87.1) 16785 (88.9) 8169 (84.5) 0.001 Widowed/Single 2362 (9.0) 1652 (12.9) 2095 (11.1) 1502 (15.5) 0.001 Per Capita Monthly Income < 500 RMB 8925 (33.8) 5080 (39.6) 5587 (29.6) 3382 (35.1) 0.008 500-999 RMB 15284 (57.9) 7017 (54.7) 10839 (57.5) 5279 (54.8) 0.215 1000-2999 RMB 2176 (8.2) 742 (5.8) 2433 (12.9) 968 (10.1) 0.004 Smoking Status, n (%) Never 19145 (72.6) 9409 (73.3) 14213 (75.1) 7441 (76.8) 0.155 Ever 1844 (7.0) 1346 (10.5) 1388 (7.3) 905 (9.3) 0.056 Current 5396 (20.5) 2084 (16.2) 3329 (17.6) 1341 (13.8) < 0.001 Drinking Status, n (%) Never 20496 (77.7) 9825 (76.5) 15128 (79.9) 7756 (80.1) 0.640 Ever 1114 (4.2) 717 (5.6) 868 (4.6) 589 (6.1) 0.237 Current 4775 (18.1) 2297 (17.9) 2932 (15.5) 1342 (13.9) 0.005 High Fat Diet, n (%) No 20924 (79.3) 10827(84.3) 14823 (78.5) 8040 (83.3) 0.002 Yes 5461 (20.7) 2012 (15.7) 4057 (21.5) 1613 (16.7) 0.002 More Vegetable and Fruit Intake No 14635 (55.5) 8212 (64.0) 9788 (51.9) 5631 (58.4) 0.035 Yes 11749 (44.5) 4626 (36.0) 9070 (48.1) 4007 (41.6) 0.035 High Salt Diet (Mean ± SD) 2.0 ± 0.8 1.9 ± 0.8 1.9 ± 0.8 1.8 ± 0.8 0.105 Physical Activity, n (%) Low 7857 (29.8) 4844 (37.7) 7001 (37.0) 4156 (42.9) < 0.001 Moderate 10409 (39.5) 4386 (34.2) 6907 (36.5) 3629 (37.5) < 0.001 High 8119 (30.8) 3609 (28.1) 5013 (26.5) 1898 (19.6) < 0.001 BMI (Mean ± SD) 24.2 ± 3.4 26.0 ± 3.7 24.3 ± 3.4 25.9 ± 3.6 < 0.001 BMI Category, n (%) Underweight 810 (3.1) 142 (1.1) 652 (3.5) 137 (1.4) 0.001 Normal Weight 12083 (45.9) 3657 (28.6) 8491 (45.0) 2840 (29.6) 0.321 Overweight 9988 (37.9) 5484 (42.9) 7230 (38.3) 4174 (43.5) 0.006 Obesity 3451 (13.1) 3491 (27.3) 2488 (13.2) 2447 (25.5) < 0.001 Heart Rate (Mean ± SD) 75.7 ± 10.8 75.8 ± 11.9 75.6 ± 10.8 75.8 ± 12.0 0.000 Systolic BP (Mean ± SD) 115.8 ± 11.9 146.8 ± 16.9 115.1 ± 12.2 141.0 ± 17.4 0.000 Diastolic BP (Mean ± SD) 72.6 ± 8.1 88.2 ± 10.7 71.4 ± 8.2 83.4 ± 10.9 < 0.001 Note. Data show for baseline (2015-2017) and follow-up (2018-2022) survey waves. n (%), number (percentage), for categorical variable. (Mean ± SD), Mean ± Standard deviation for continue variable. Table 1. Characteristics of participants according to hypertension status in rural Henan, China (2015-2022)
-
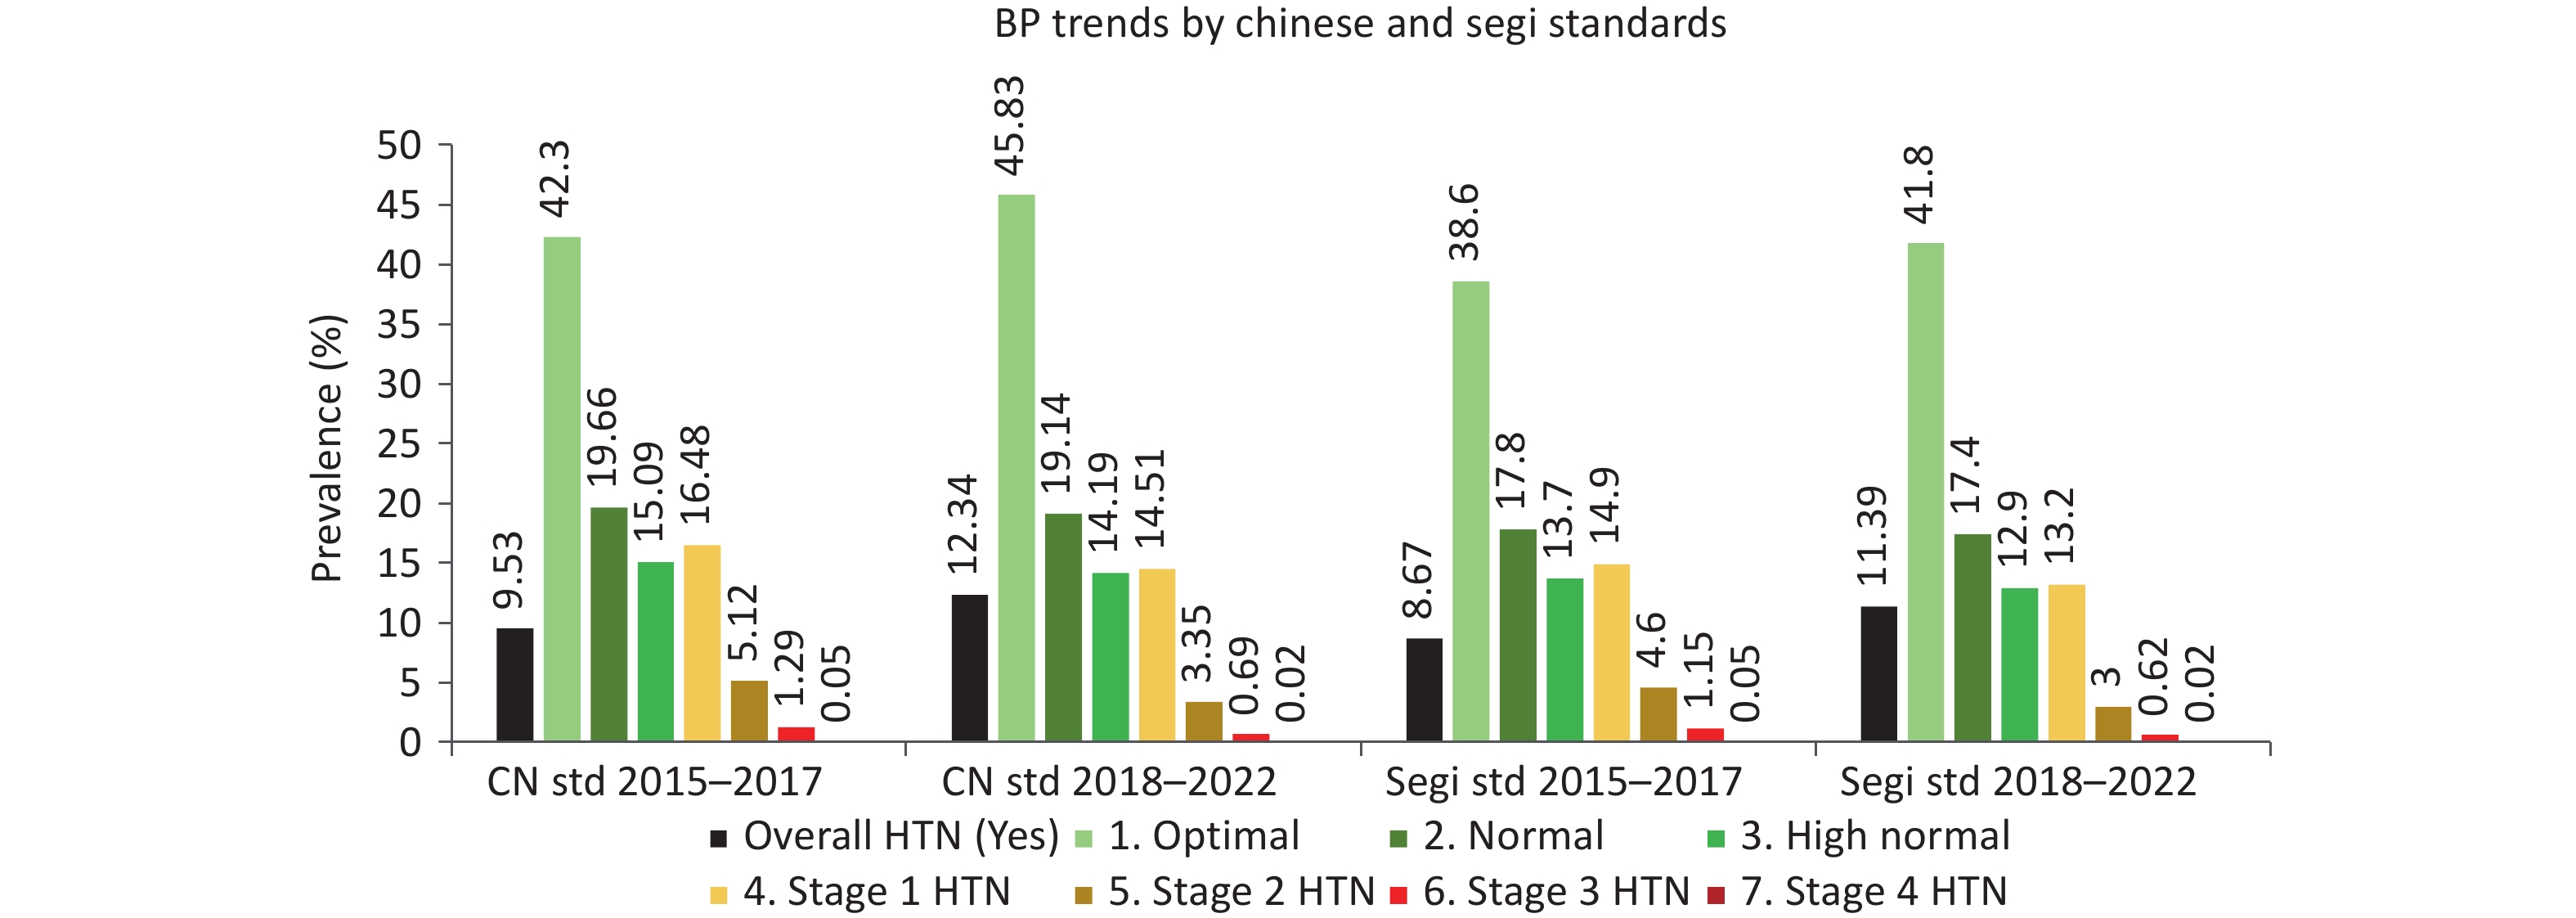
An inclined trend was observed in the prevalence of HTN from 32.7 to 33.9%, with women disproportionately affected (34.1 vs. 33.1% in men). The novel 7-tier blood pressure classification revealed a decline in Stage 1 HTN prevalence from 16.5 (2015–2017) to 14.5% (2018–2022), as well as a reduction in Stage 2 cases (5.1 to 3.4%), potentially reflecting modest improvements in early detection or lifestyle awareness. Figure 3 shows the age-standardized distribution of blood pressure categories over time, using both the Chinese 2020 and Segi world standard populations, highlighting consistent downward trends in more severe hypertension stages and a growing proportion of individuals in the optimal blood pressure range (Table 2, Figure 2, Supplementary Table S2).
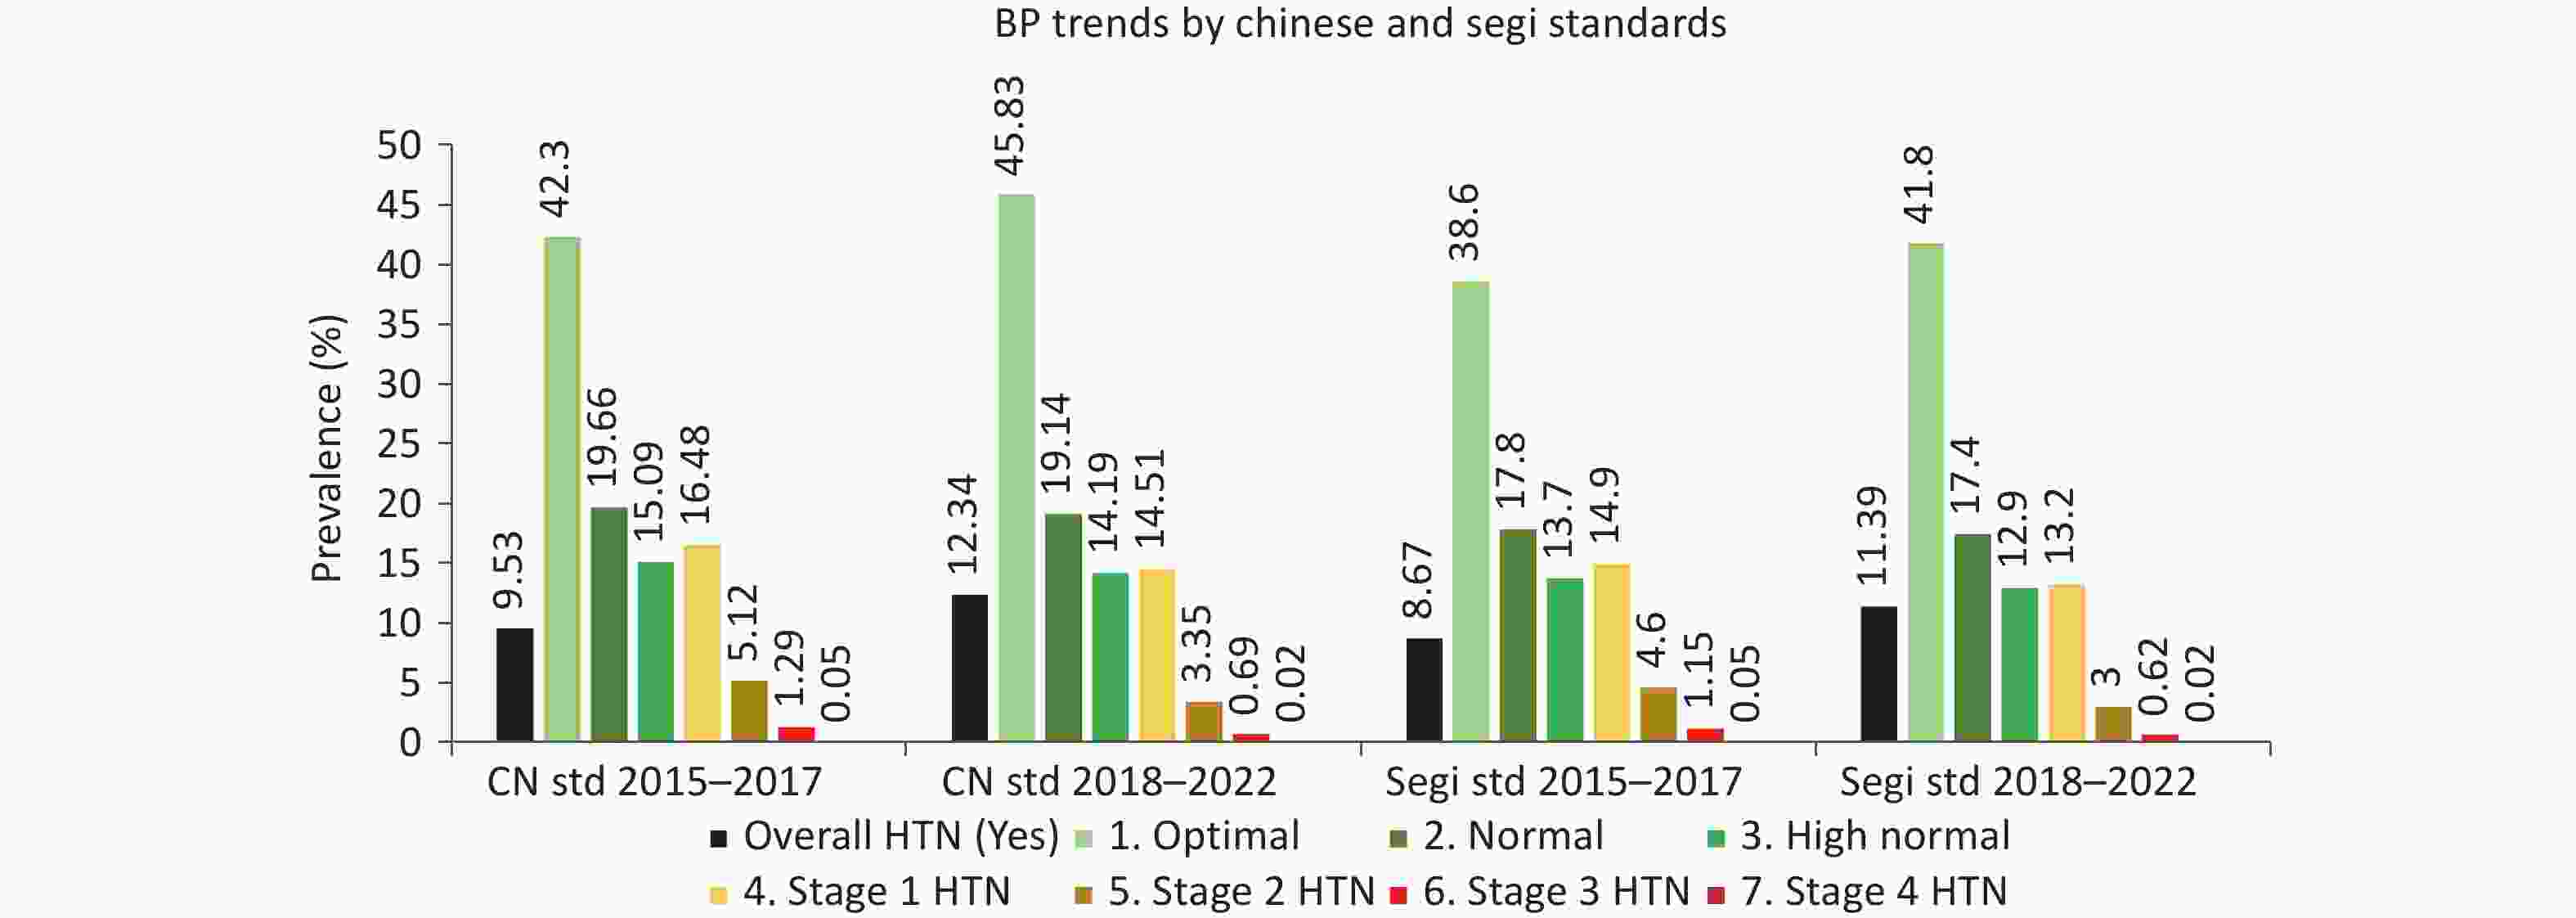
Figure 3. Age-standardized distribution of blood pressure categories in rural China, 2015–2022, based on Chinese and Segi standard populations. The figure compares prevalence rates across two survey periods (2015–2017 and 2018–2022) using both Chinese (2020) and Segi standardizations.
BP/HTN Group Baseline Survey (2015–2017) Follow-up Survey (2018–2022) Men n (%) Women n (%) Total n (%) Men n (%) Women n (%) Total n (%) Overall HTN (Yes)# 5128 (33.13) 7711 (32.44) 12839 (32.73) 3579 (33.38) 6111 (34.13) 9690 (33.85) 1. Optimal 600 (38.77) 10584 (44.53) 16589 (42.30) 4992 (46.42) 8088 (45.47) 13080 (45.83) 2. Normal 3466 (22.38) 4245 (17.86) 7711 (19.66) 2028 (18.86) 3435 (19.31) 5463 (19.14) 3. High Normal 2544 (16.42) 3373 (14.19) 5917 (15.09) 1519 (14.13) 2531 (14.23) 4050 (14.19) 4. Stage 1 HTN (Mild) 2578 (16.64) 3885 (16.34) 6463 (16.48) 1558 (14.49) 2584 (14.53) 4142 (14.51) 5. Stage 2 HTN (Moderate) 718 (4.64) 1288 (5.42) 2006 (5.12) 367 (3.41) 589 (3.31) 956 (3.35) 6. Stage 3 HTN (Severe) 156 (1.01) 348 (1.46) 504 (1.29) 58 (0.54) 138 (0.78) 196 (0.69) 7. Stage 4 HTN (Very Severe) 5 (0.03) 16 (0.07) 21 (0.05) 2 (0.02) 5 (0.03) 7 (0.02) Note. HTN, hypertension; SBP, systolic blood pressure; DBP, diastolic blood pressure. n (%) refers to the number of individuals and the percentage within each group. 2015–2017 and 2018–2022 refer to baseline and follow-up survey periods, respectively. # 'Overall HTN (Yes)' is based on binary classification: SBP ≥ 140 mmHg, DBP ≥ 90 mmHg, or current use of antihypertensive medication. Blood pressure categories are defined as follows:• Optimal: SBP < 120 mmHg and/or DBP < 80 mmHg • Normal: SBP 120–129 mmHg and/or DBP 80–84 mmHg • High Normal: SBP 130–139 mmHg and/or DBP 85–89 mmHg • Stage 1 HTN (Mild): SBP 140–159 mmHg and/or DBP 90–99 mmHg • Stage 2 HTN (Moderate): SBP 160–179 mmHg and/or DBP 100–109 mmHg • Stage 3 HTN (Severe): SBP 180–209 mmHg and/or DBP 110–119 mmHg • Stage 4 HTN (Very Severe): SBP ≥ 210 mmHg and/or DBP ≥ 120 mmHg. Table 2. Gender-Specific Prevalence of Hypertension by Blood Pressure Classification in Rural Henan, China (2015-2022)
-
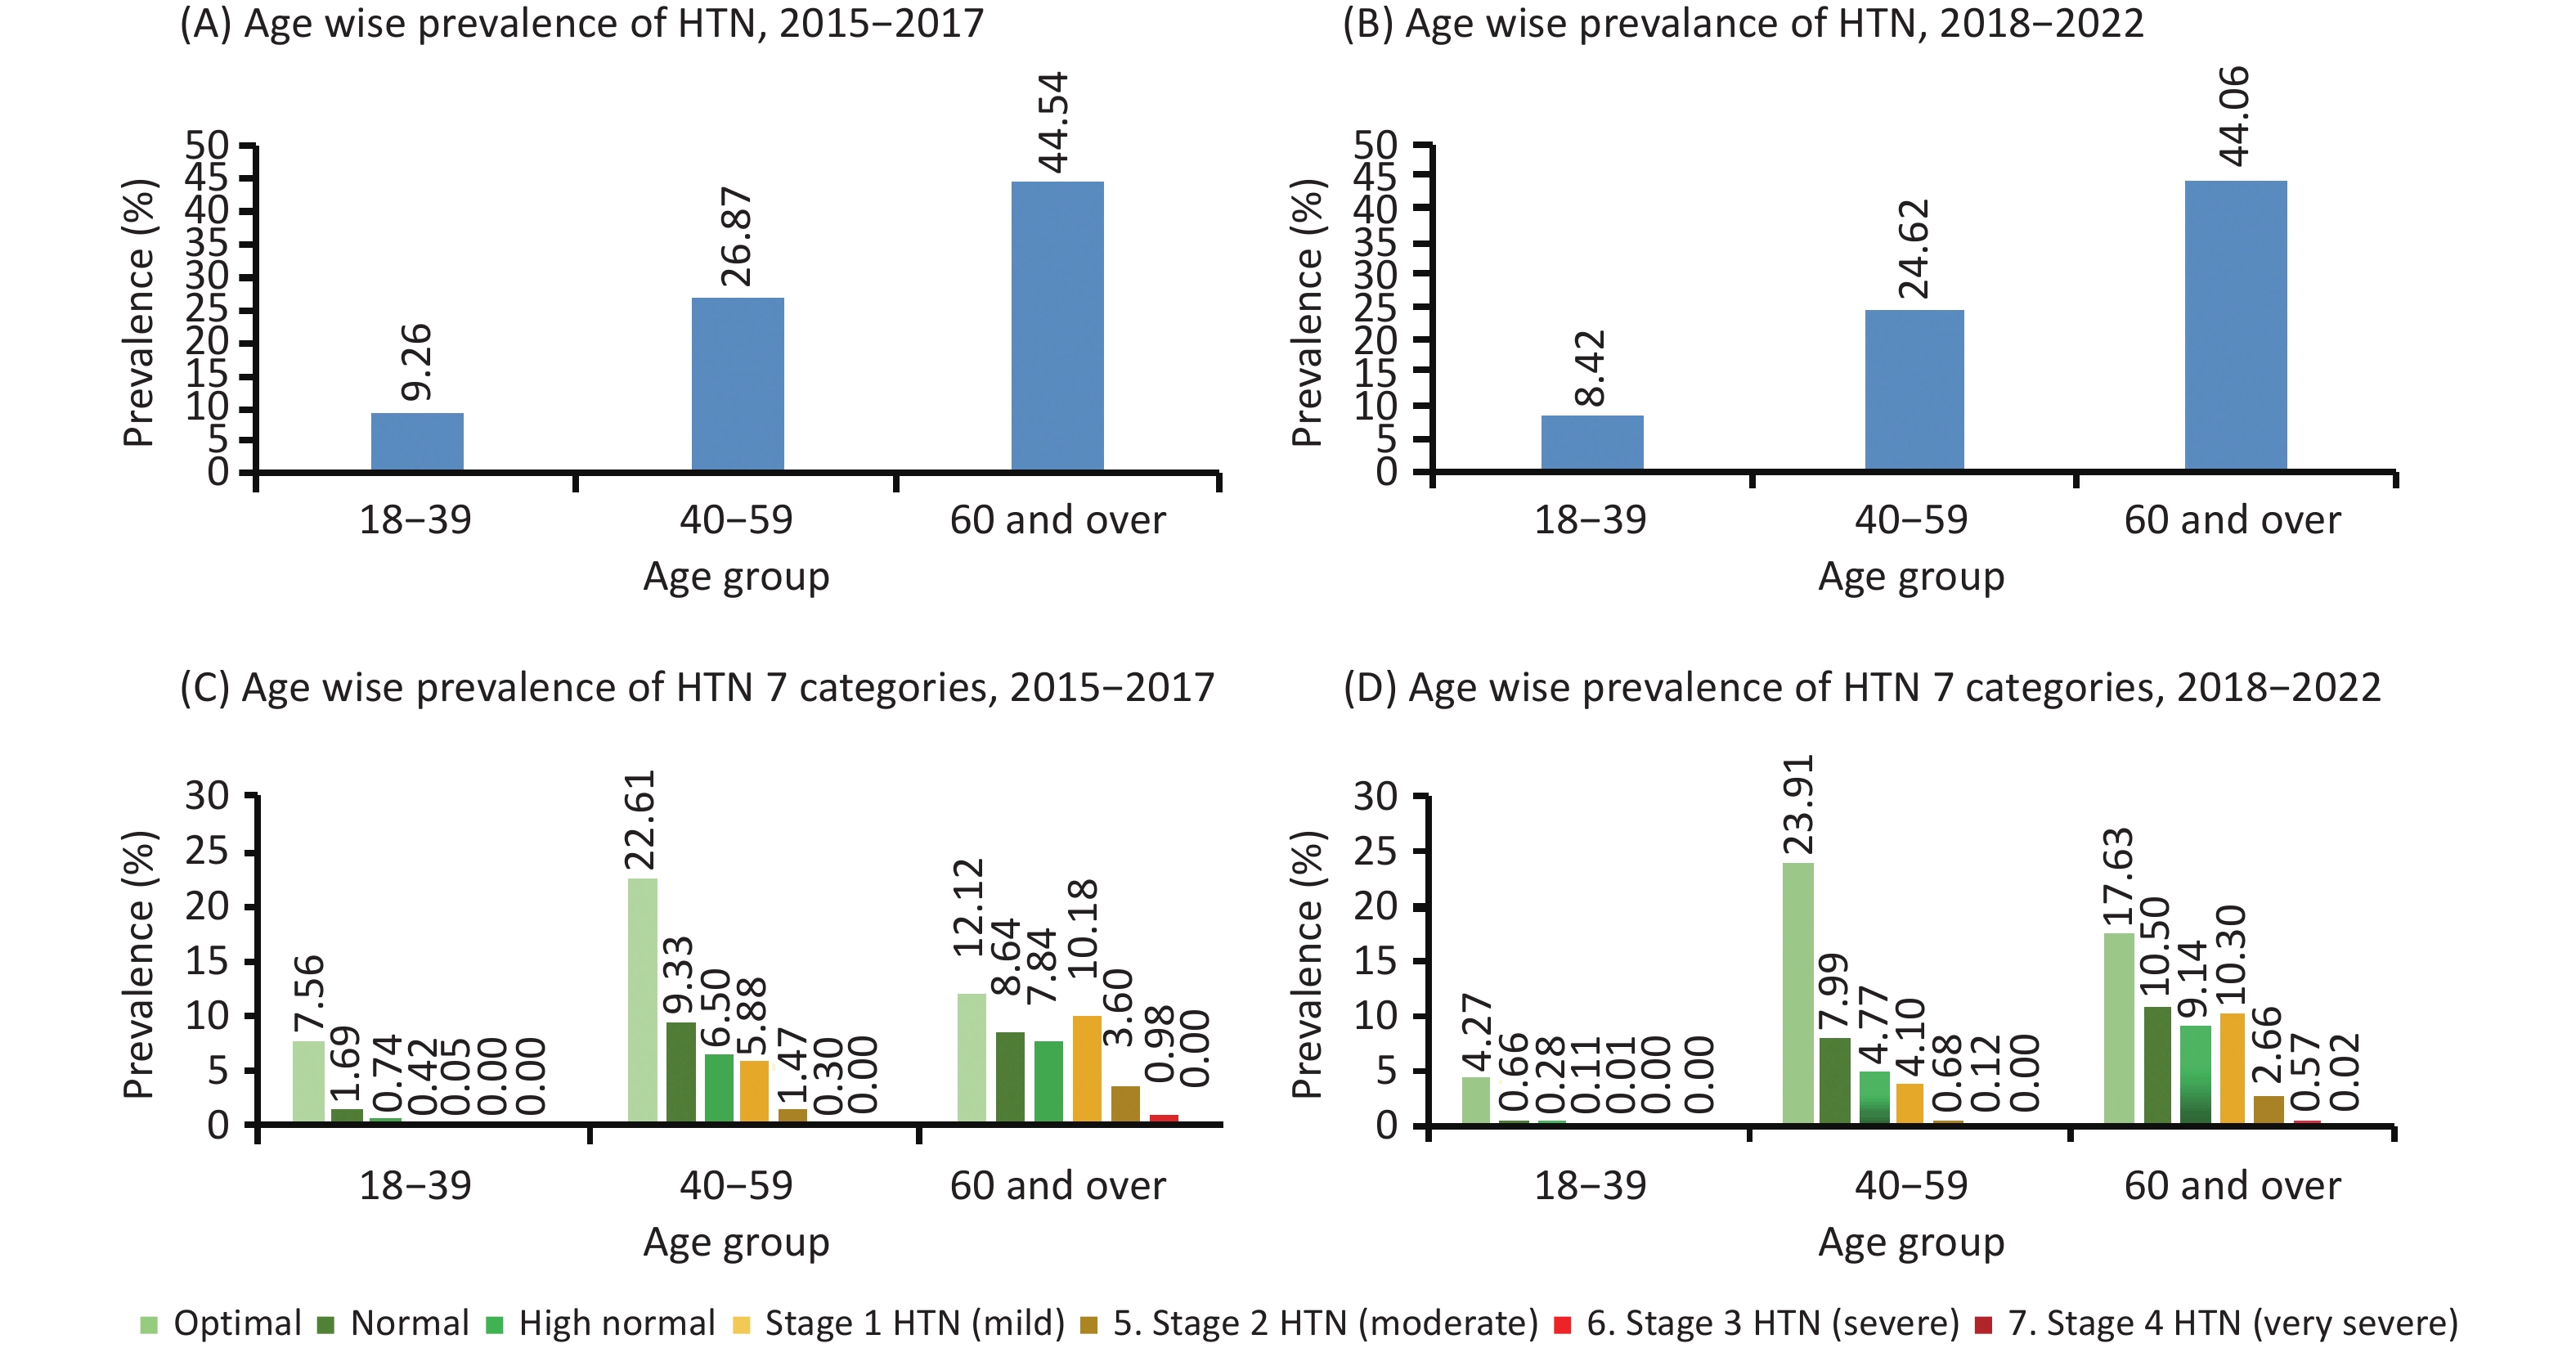
HTN prevalence surged with age, peaking in adults ≥ 60 years (~44%), a group exposed to lifelong environmental risks, for example, traditional high-salt (sodium) diets and occupational and physical strain. The 40–59 age group saw from 26 to 24%, reflecting the early impacts of rural lifestyle transitions (Figure 4). For crude and age-standardized hypertension prevalence by age group, using the 2020 Chinese Census population data, refer to Supplementary Table S1, Table S2, and S3 for details.
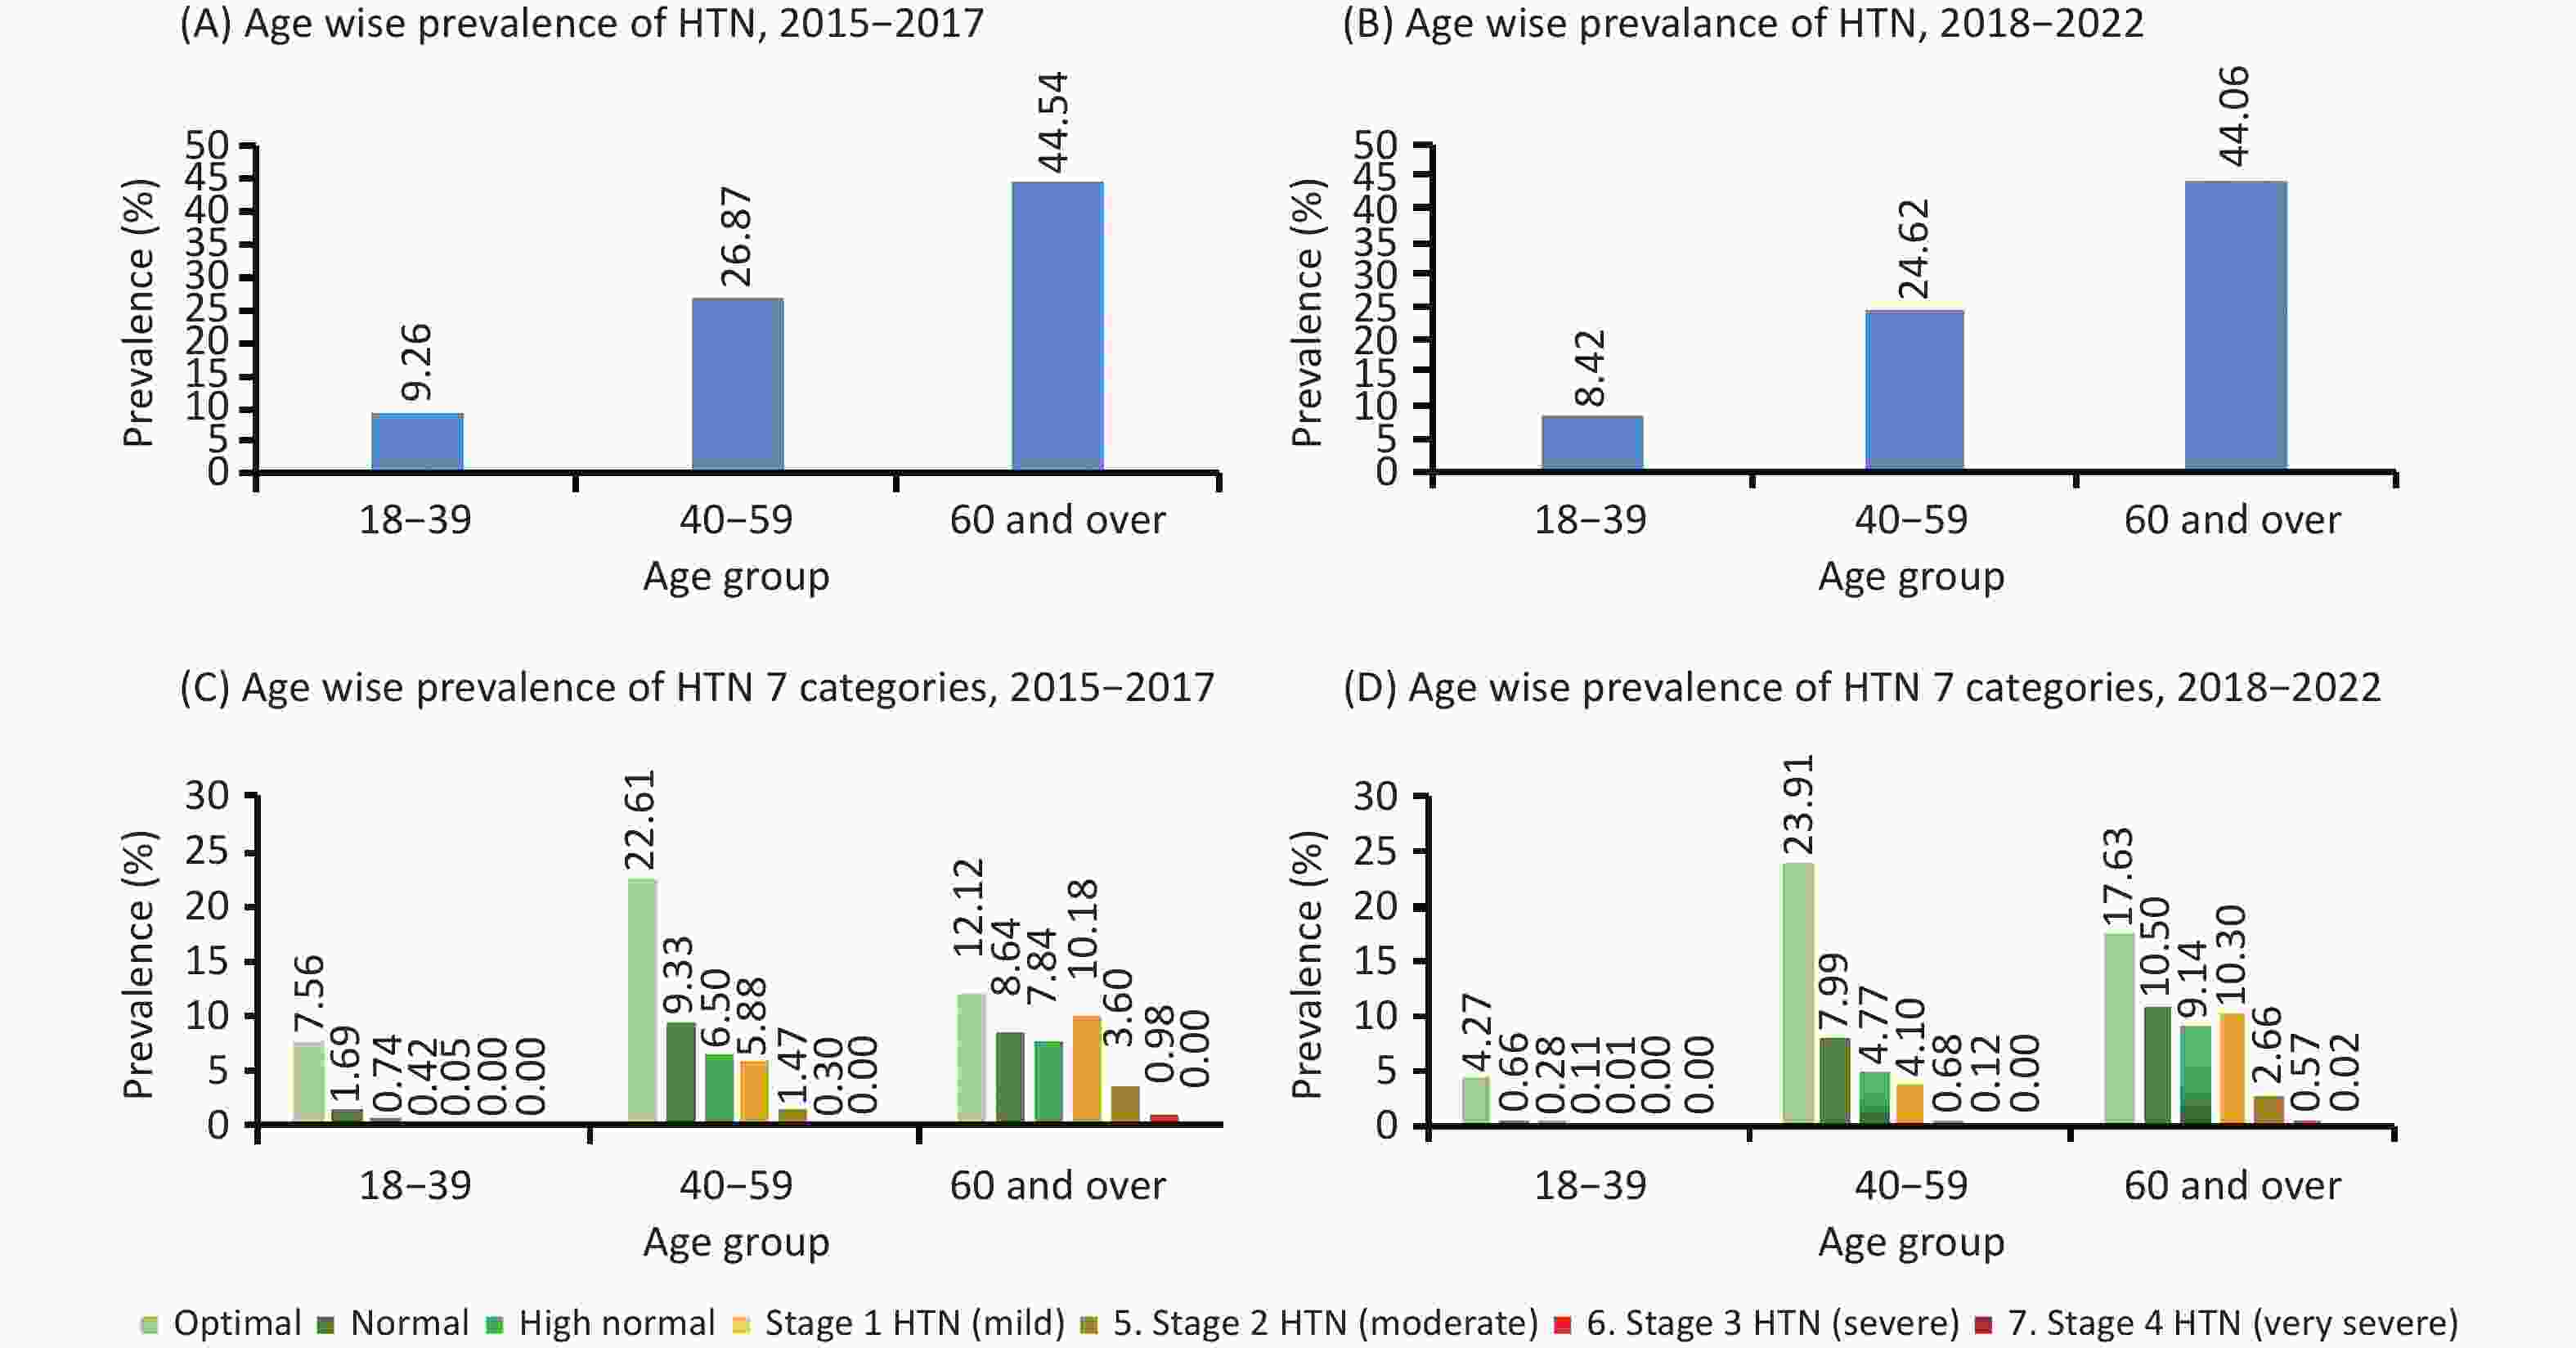
Figure 4. Age-Specific Prevalence of Hypertension in Rural Henan, China (2015-2022). The figure shows the age-specific prevalence of hypertension (HTN) during two periods. Panels (A) and (B) display the overall prevalence of HTN (as a binary condition) for 2015-2017 and 2018-2022, respectively. Panels (C) and (D) provide a detailed breakdown, showing the prevalence across seven categories defined by Systolic (SBP) and Diastolic (DBP) Blood Pressure levels for the same two periods.
-
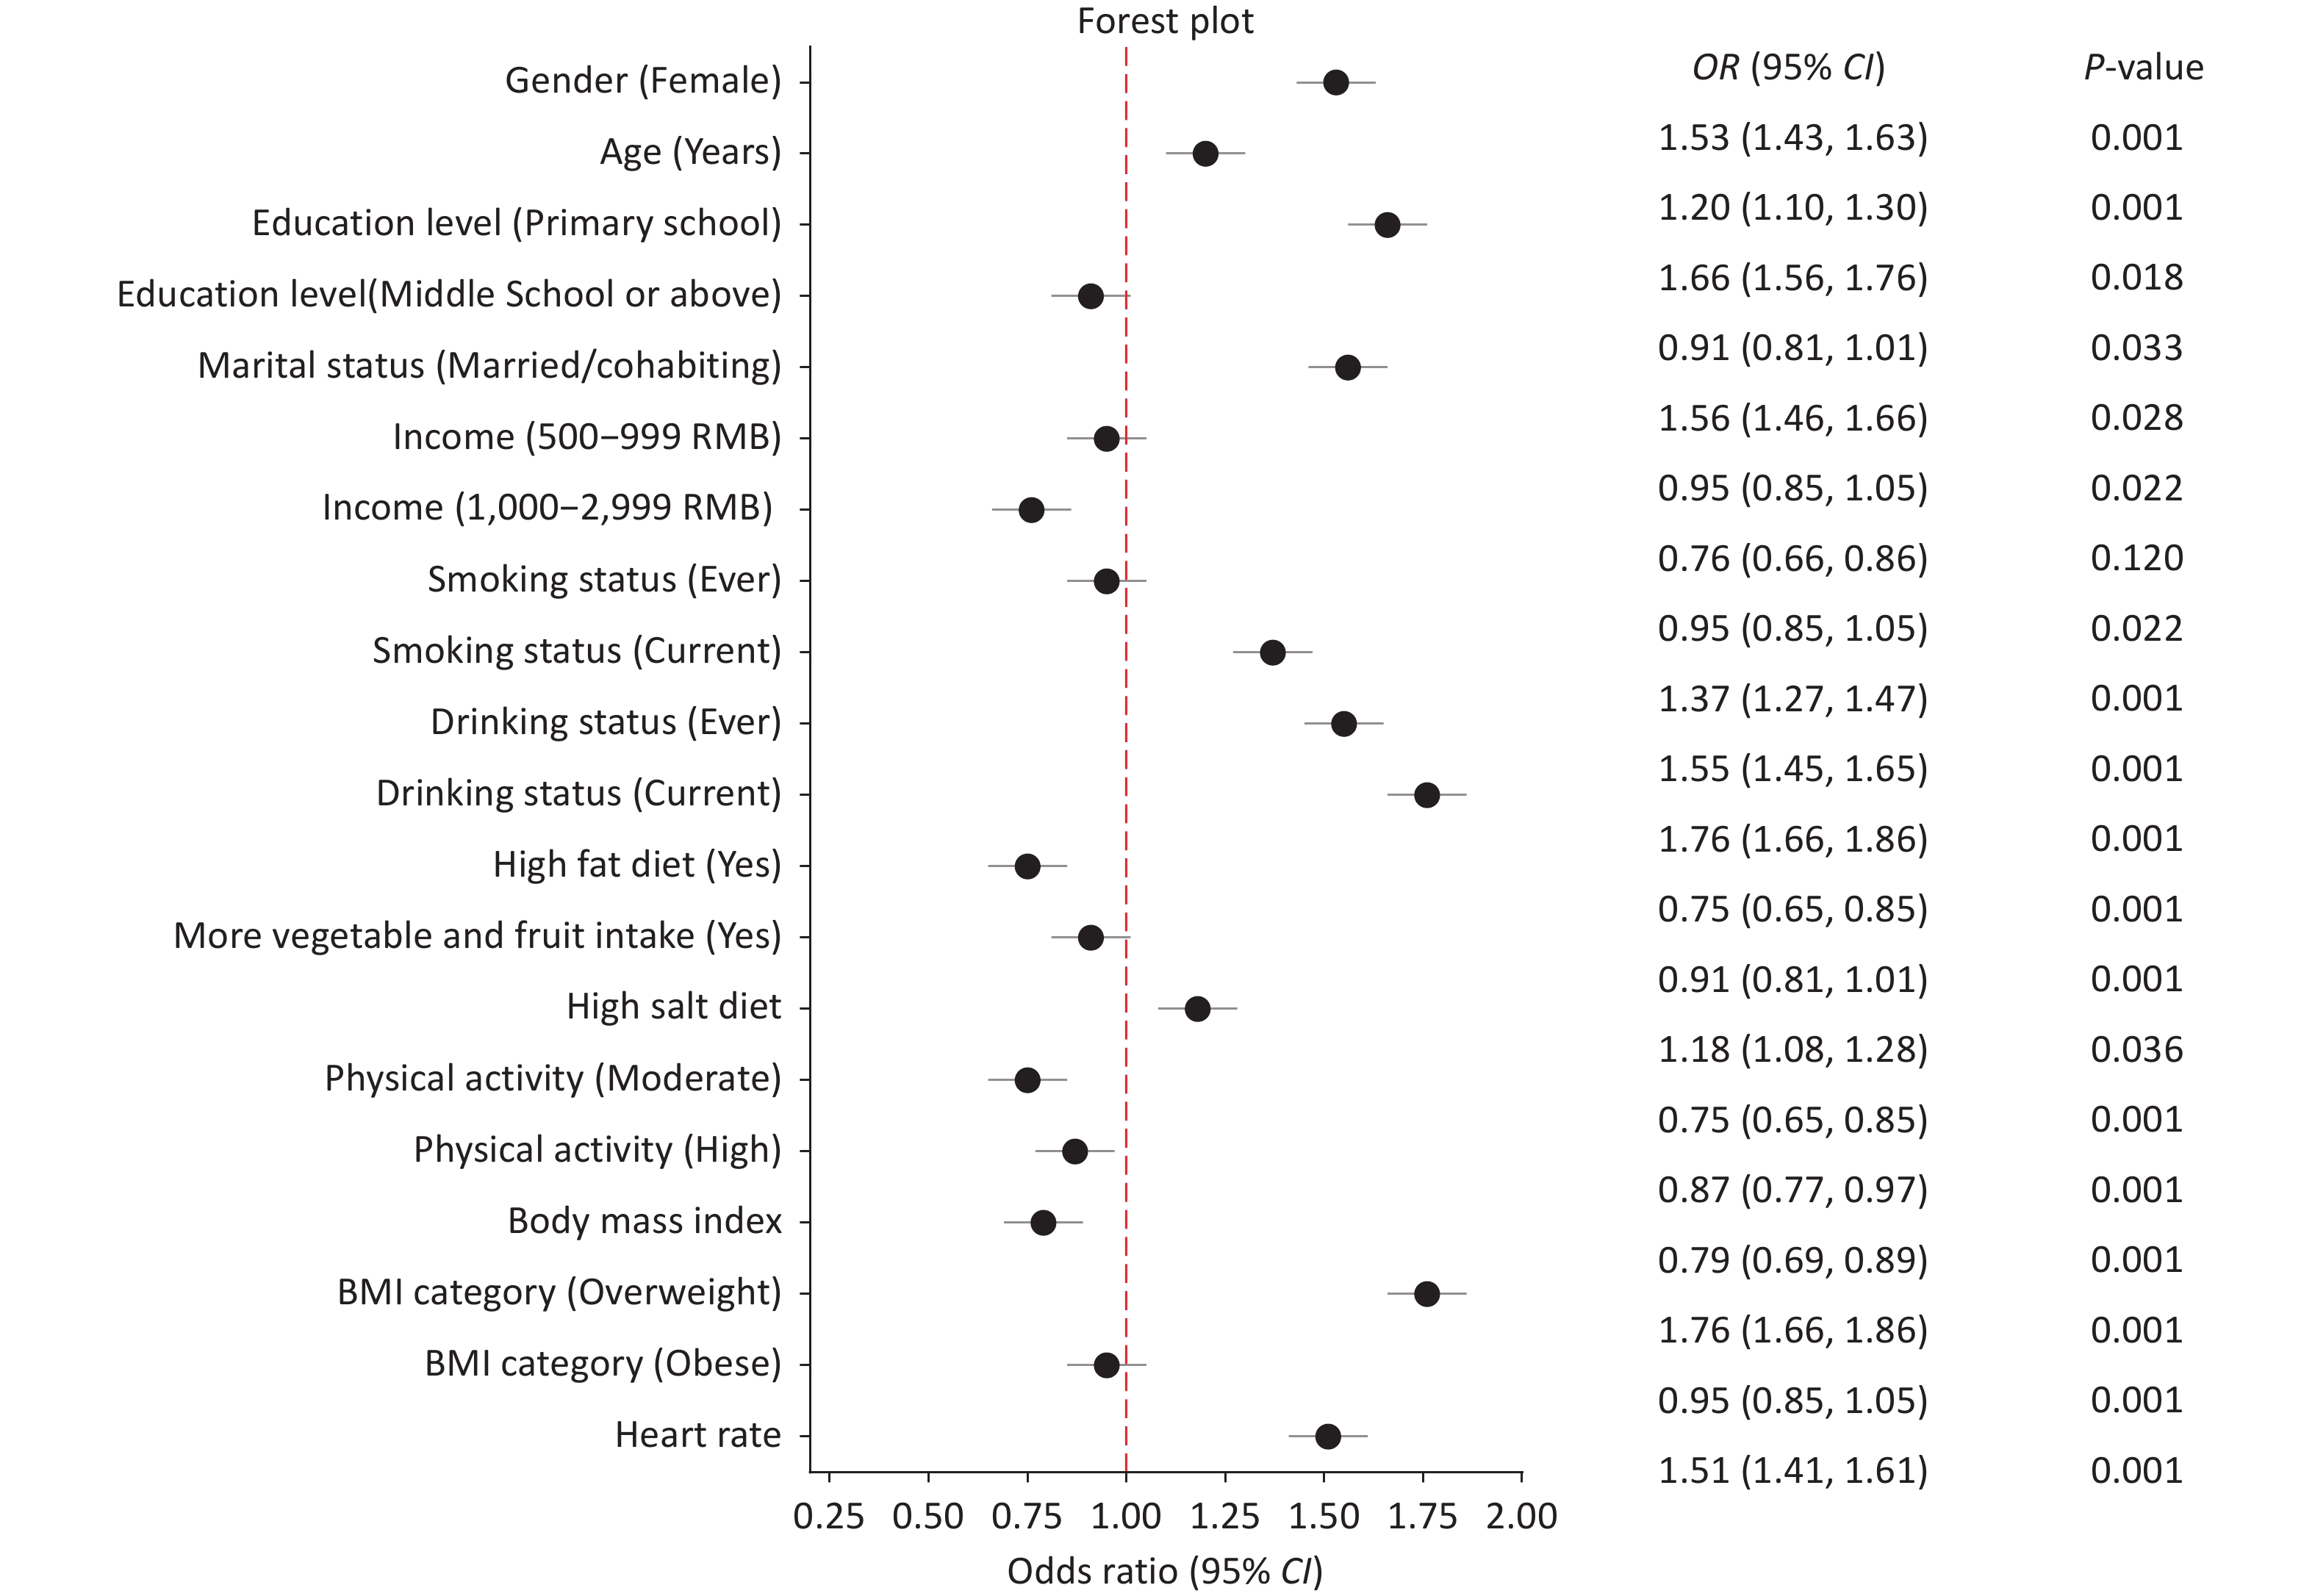
Body mass index (BMI) (overweight) and sedentary lifestyles (low physical activity: 37.7% with HTN emerged as critical risks, reflecting calorie-dense diets and mechanized farming that reduce labor demands. Women faced 1.53-fold higher adjusted risk (OR = 1.53) than men, potentially due to gendered roles (e.g., household stress limited healthcare autonomy) (Figure 5). Supplementary Tables S6, Figure S2, and Figure S3 for detailed estimates and gender differences and temporal trends analysis.
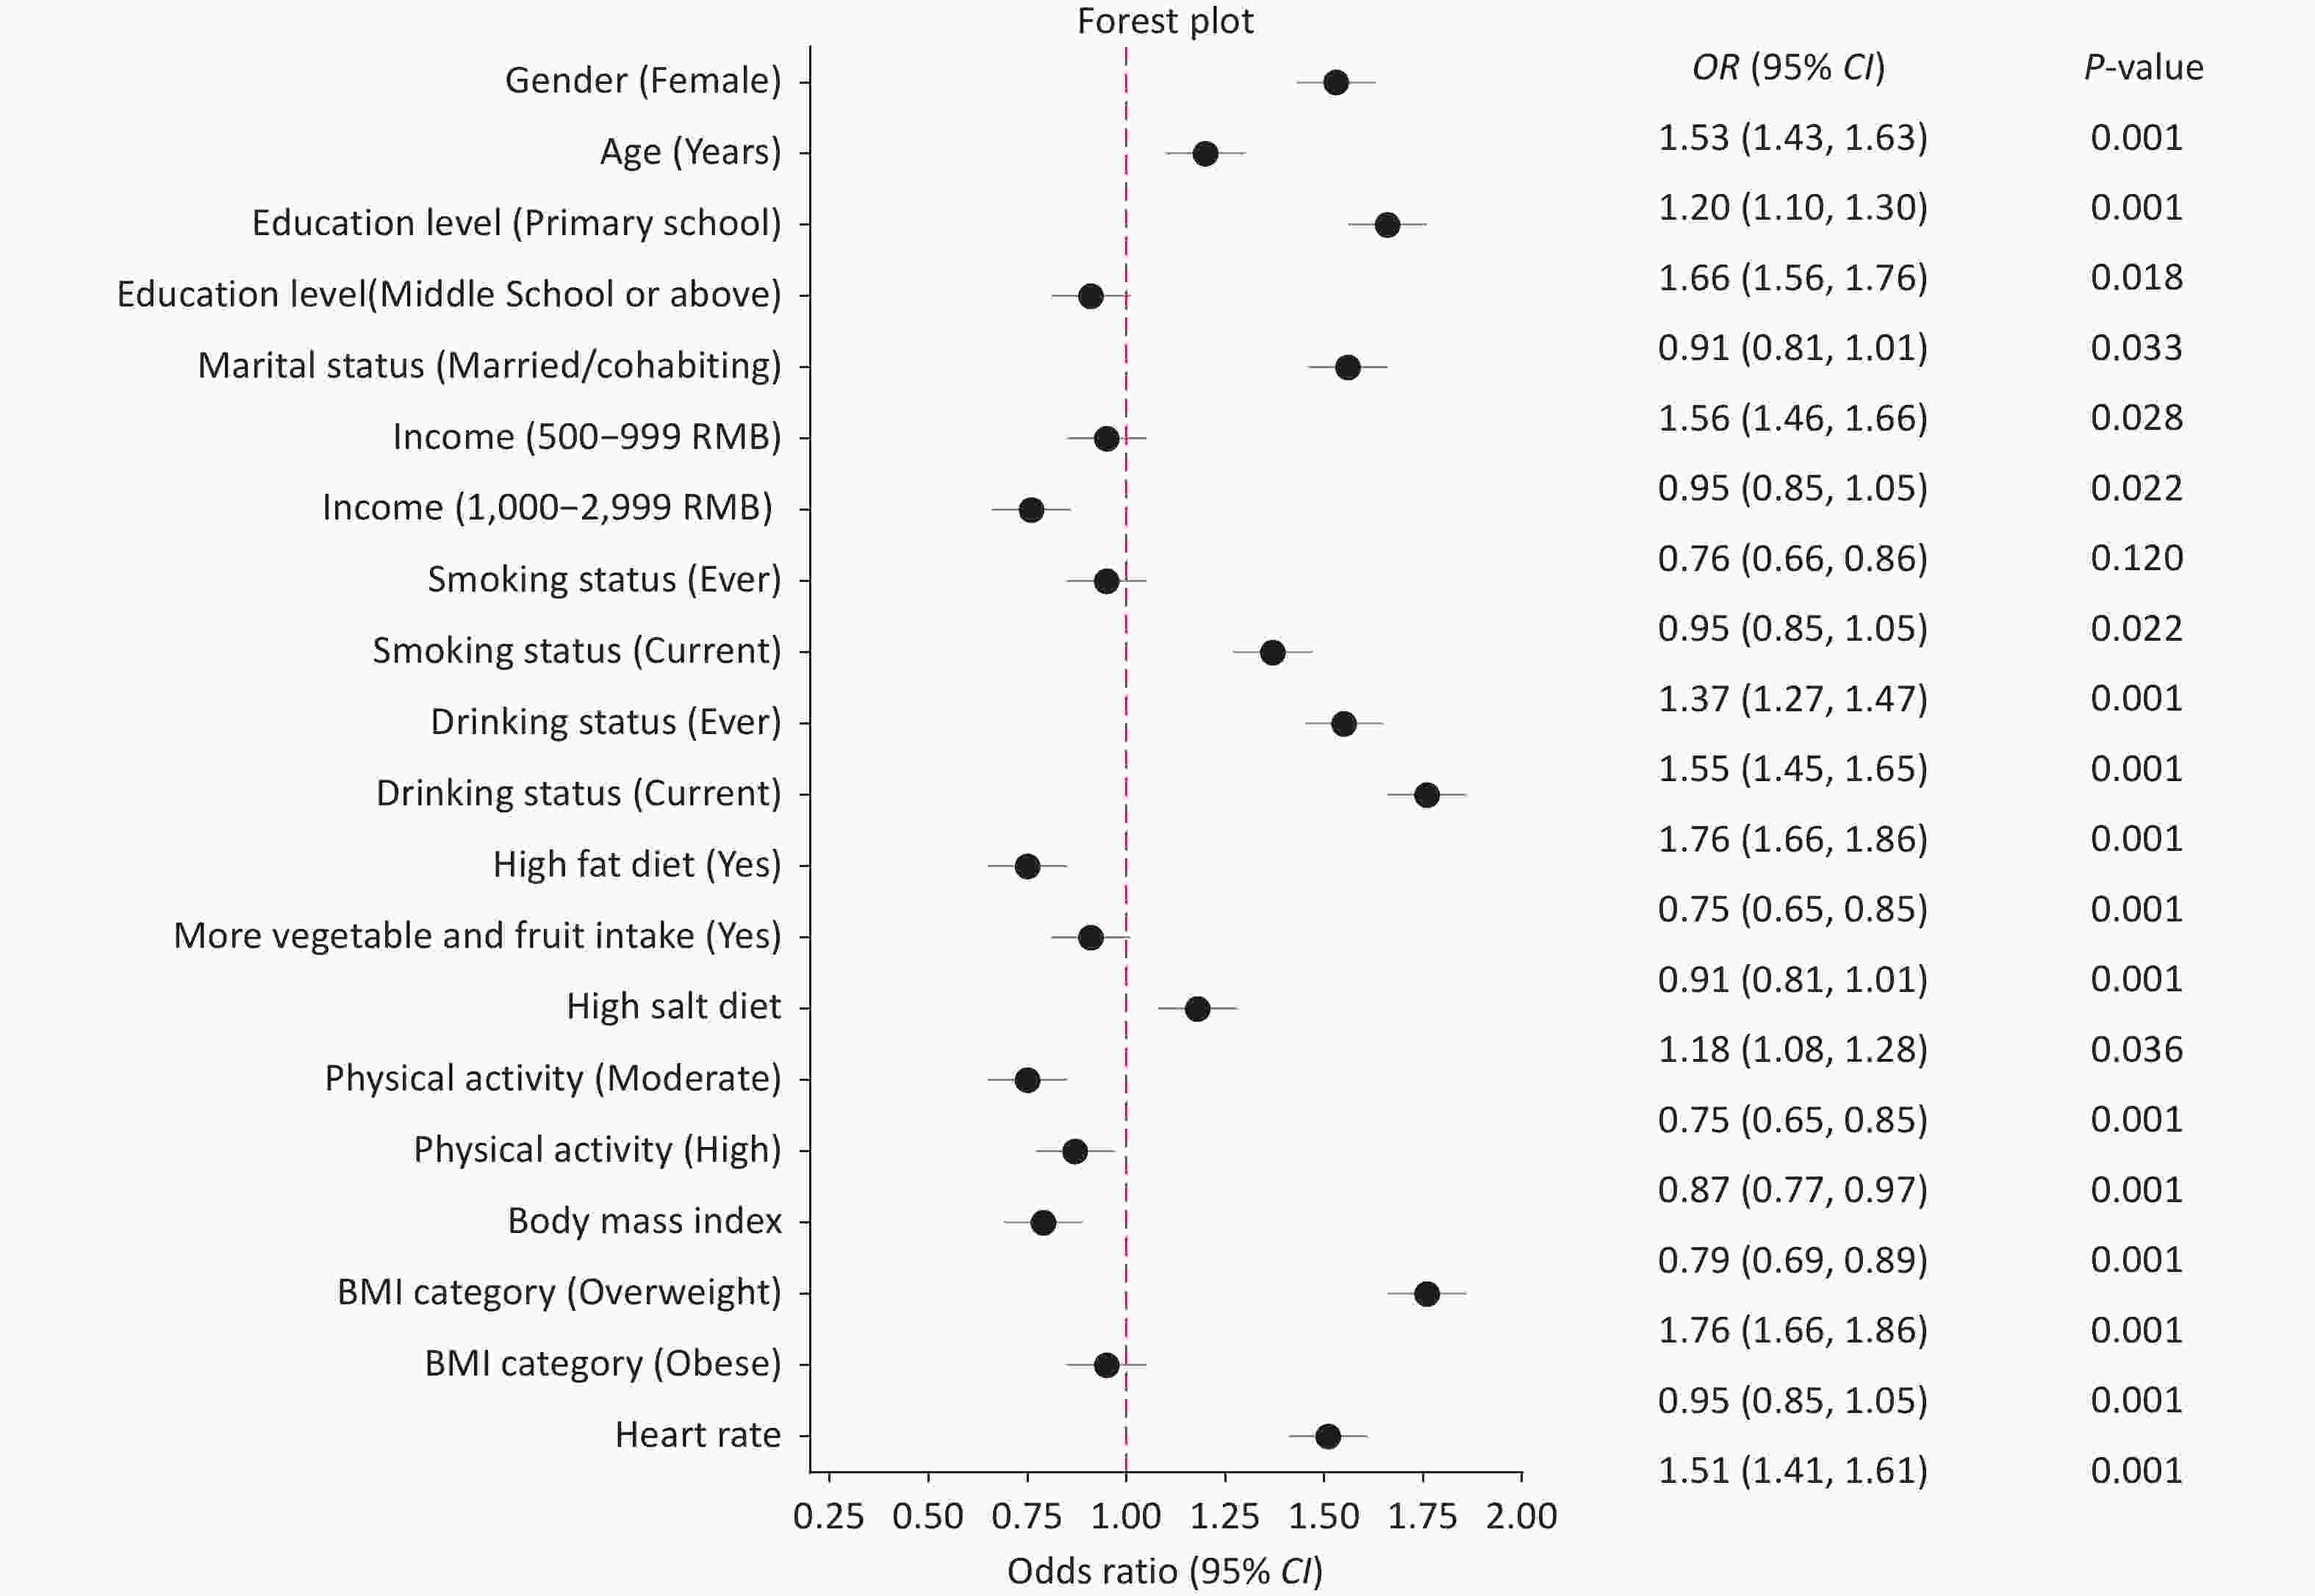
Figure 5. Adjusted odds ratios (ORs) for risk factors associated with hypertension prevalence in rural Henan, China (2015–2022). OR, odds ratio; CI, confidence interval; BMI, body mass index; SBP, systolic blood pressure; DBP, diastolic blood pressure. The figure shows adjusted ORs (95% CI) from generalized linear mixed-effects model (GLMM) using multivariable logistic regression models for hypertension prevalence, stratified by key demographic, behavioral, and biological factors. Variables with P < 0.05 are considered statistically significant. Bold red values indicate statistical significance.
-
Despite improved awareness (from 20.1 to 25.3%) and treatment (from 18.8 to 24.4%), control rates remained critically low (ranging from 6.2 to 12.3%) after age standardization (≥ 40 years), underscoring systemic barriers in rural healthcare, such as medication shortages and distrust in primary care. Women’s control rates lagged behind men’s (12.2 vs. 12.5%), likely due to gendered caregiving roles limiting clinic access. Age-standardized rates were calculated from the same cohort for individuals aged 40 years and older. Age-standardized trends revealed persistent disparities. HTN prevalence: 35.5 (2015–2017) vs. 35.4% (2018–2022). Control rates: 6.8 to 12.9% (standardized), indicating minimal progress despite increased access to treatment (Table 3). Notably, adults aged 40 years and above are a group disproportionately exposed to the highest unmet need for HTN control, with only 12.9% achieving BP targets in 2018–2022 (Supplementary Figure S1, Table S5).
Cohort years Crude rate (95% CI) Standardized rate (95% CI) * 2015–2017 2018–2022 2015–2017 2018–2022 Overall n = 39224 n = 28621 n = 35120 n = 27081 Hypertension 32.73 (32.2 to 33.1) 33.85 (33.3 to 34.4) 35.47 (34.9 to 35.9) 35.35 (34.7 to 35.9) Awareness 20.09 (19.7 to 20.5) 25.31 (24.8 to 25.8) 22.13 (21.7 to 22.6) 26.58 (26.0 to 27.1) Treatment 18.77 (18.4 to 19.2) 24.42 (23.9 to 24.9) 20.72 (20.3 to 21.2) 25.67 (25.1 to 26.1) Control 6.15 (5.9 to 6.4) 12.30 (11.9 to 12.7) 6.80 (6.6 to 7.1) 12.93 (12.5 to 13.3) Men n = 15477 n = 10719 n = 13990 n = 10160 Hypertension 33.13 (32.4 to 33.9) 34.42 (32.5 to 34.3) 34.86 (34.1 to 35.7) 34.34 (33.4 to 35.2) Awareness 19.26 (18.6 to 19.9) 24.53 (23.7 to 25.3) 20.79 (20.1 to 21.5) 25.74 (24.8 to 26.6) Treatment 17.58 (17.0 to 18.2) 23.52 (22.7 to 24.3) 19.1 (18.4 to 19.7) 24.55 (23.7 to 25.4) Control 5.89 (5.5 to 6.3) 12.51 (11.8 to 13.1) 6.43 (6.0 to 6.8) 13.06 (12.4 to13.7) Women n = 23747 n = 17902 n = 21157 n = 16921 Hypertension 32.47 (31.9 to 33.1) 34.12 (33.4 to 34.8) 35.83 (35.2 to 36.5) 35.95 (35.2 to 36.6) Awareness 20.63 (20.1 to 21.2) 24.64 (25.0 to 26.3) 22.9 (22.4 to 23.6) 27.08 (26.4 to 27.7) Treatment 19.54 (19.0 to 20.1) 24.92 (24.3 to 25.6) 21.8 (21.2 to 22.4) 26.34 (25.6 to 27.0) Control 6.32 (6.0 to 6.6) 12.21 (11.7 to 12.7) 7.06 (6.7 to 7.4) 12.85 (12.3 to 13.3) Note. *Standardized by age ≥ 40 years. Table 3. Trends in Hypertension Prevalence, Awareness, Treatment, and Control in Rural Henan, China (2015–2022)
-
The prevalence of hypertension (HTN) exceeded 30% in rural China during both the 2015–2017 and 2018–2022 surveys. It was associated with established risk factors such as older age, being a woman, lower education, physical inactivity, and environmental-lifestyle factors, including high-fat diets (HFD) and prior alcohol or tobacco use. These findings are consistent with China’s nationally high HTN burden[10,24]. While there were improvements in awareness and treatment between the two survey periods, effective blood pressure (BP) control remained limited, underscoring the need for stronger public health strategies and interventions.
The current analysis revealed that the crude prevalence of HTN rose modestly from 32.73 to 33.85%, but the age-standardized prevalence among adults aged 40 years and older remained persistently high, ranging from 35.47 to 35.35%. This finding highlights the influence of demographic aging in sustaining elevated HTN rates in rural China. Despite improvements in awareness and treatment, control remains inadequate. Only 24% of hypertensive individuals aged 40 years or older achieved target blood pressure levels by 2018–2022. These data suggest that aging populations face persistent unmet needs in HTN management, and interventions must prioritize elderly rural residents who are at elevated cardiovascular risk. The age-standardized analysis revealed a notable decline in the prevalence of moderate to severe HTN between 2015–2017 and 2018–2022, alongside an increase in optimal BP levels. These shifts suggest modest but meaningful improvements in HTN awareness, early detection, or lifestyle changes in rural populations. The consistency of trends across both Chinese and Segi standard populations reinforces the robustness of these findings. In particular, the HTN prevalence in rural Henan (33.5 was notably higher than in urban areas (26.9%)[25], reflecting environmental disparities such as limited access to fresh produce, reliance on high-sodium preserved foods, and fragmented primary care services. Although men showed a more pronounced decline in HTN prevalence over time, the adjusted odds of HTN remained significantly higher among women.
Our analysis revealed that, despite overall improvements, women consistently had a higher adjusted risk of HTN, even after adjusting for age, education, income, diet, and physical activity. This disparity may reflect gendered differences in lifestyle, occupational and social roles, or other unmeasured exposures that disproportionately affect women in rural contexts. For instance, rural women often assume caregiving responsibilities and household duties that increase psychosocial stress and limit their time and ability to access medical services. Cultural norms may also lead women to prioritize their family's health over their own. Biologically, postmenopausal hormonal changes and increased vascular stiffness may elevate HTN risk. These findings highlight the importance of applying gender-stratified analysis and tailored intervention strategies that address both medical and sociocultural determinants of HTN in low-resource settings. Additionally, our study observed that the decline in HTN prevalence among men was more than twice that observed among women. Supporting this, findings from the Rural Diabetes, Obesity, and Lifestyle (RuralDiab) Henan study reported an overall HTN prevalence of 32.02 with sex-specific rates of 32.87 in men and 30.58% in women[26]. Taken together, these results underscore the need for targeted interventions and ongoing surveillance to mitigate the burden of hypertension in rural Henan Province.
The latest analyses of rural populations in China highlight persistent challenges in HTN diagnosis and management, including high rates of undiagnosed, untreated, and poorly controlled cases[10]. Rural areas require a greater focus on primary care infrastructure to enhance HTN identification and treatment rates. A 2018 study reported that 32.02% of HTN cases in rural areas were undiagnosed, and the age-standardized prevalence of high blood pressure (HBP) was 19.5%, with slightly higher rates observed in men compared to women[26]. According to the RuralDiab study in Henan Province, the age-standardized HTN prevalence among rural adults aged 18–74 was 19.5% during 2015–2016. To identify early-stage risk and support better intervention, our study adopted a seven-category HTN classification system. This system was developed using the 2017 American College of Cardiology/American Heart Association (ACC/AHA) guidelines[27] and provides a greater ability to identify individuals at high cardiovascular risk than previous methods[28]. The system’s blood pressure goals (130/80 mmHg for high-risk cases; 140/90 mmHg for others) correspond with recommendations from the European Society of Cardiology (ESC)/European Society of Hypertension (ESH[9], Canadian[10], Latin American, and American Diabetes Association (ADA)[11], guidelines. Our proposed seven-category BP classification system, developed prior to the release of the 2024 Chinese HTN Guidelines, aligns conceptually with the new framework but includes Stage 4 HTN and more detailed stages to facilitate early intervention, particularly in rural areas. Unlike the 2024 guidelines, which no longer classify isolated systolic or diastolic hypertension (ISH/IDH) as distinct categories, our system retains nuanced classifications such as High Normal BP. This allows for the earlier identification of pre-hypertensive states, where lifestyle interventions (e.g., salt reduction and dietary changes) may help to prevent the progression of HTN. Future research could refine risk stratification by incorporating these conditions into the classification system[29].
Our study is among the first to implement this stratified classification system in a rural Chinese population. We observed an increase in HTN prevalence across stages between the baseline and follow-up surveys. Despite these advancements in classification, national data from the 2018 Chinese Guidelines[19]. Confirm that HTN prevalence continues to rise. Rates also vary geographically and by ethnicity, with the north, including Henan Province, showing a higher burden than the south. In our cohort, HTN prevalence among adults aged ≥ 60 years increased from 19.37 in 2015–2017 to 28.80% in 2018–2022, though still lower than national figures for older adults. Previous national studies recorded an HTN prevalence of 40.4% in 1991 among those aged 60 years or older, increasing to 49.1 in 2002 and 53.2% between 2012 and 2015. Notably, HTN awareness, treatment, and control rates have historically been higher in southern compared to northern China[30-32]. Using Generalized Linear Mixed Models (GLMM), we identified significant associations between HTN and modifiable environmental factors, including alcohol use (OR = 1.76), overweight status (OR = 1.76), and high salt intake (OR = 1.18). Being a woman was also independently associated with elevated HTN risk (OR = 1.53). These associations likely reflect complex interactions between gender and rural environmental exposures, such as caregiving stress or labor-intensive roles. The inclusion of random effects enabled us to capture community-level heterogeneity, such as local variations in healthcare access or alcohol marketing density, providing insight for geographically tailored interventions. For example, villages with higher alcohol availability may benefit from stricter regulation of rural alcohol markets[33].
The GLMM framework effectively addresses the binary nature of HTN status while accounting for repeated measurements from the same individuals over time[34,35]. To ensure a robust and interpretable model, its fit was evaluated using multiple criteria, including the Akaike Information Criterion (AIC), Bayesian Information Criterion (BIC), and variable Significance tests. This approach supports individualized HTN risk prediction, enabling more precise public health interventions and efficient resource allocation. Predicted individual hypertension risks derived from the final GLMM were calculated and are presented in Supplementary Figure 2 and Figure 3. These estimates support personalized risk stratification and illustrate how risk patterns evolved between baseline and follow-up surveys. In addition to environmental risk factors, our GLMM analysis confirmed that HTN was significantly associated with older age, being a woman, alcohol consumption, and higher BMI. Other modifiable factors such as education, marital status, diet, and physical activity also had measurable effects on HTN risk. These findings suggest significant opportunities for lifestyle-based prevention and intervention strategies in rural China[32,36]. Our hierarchical analysis confirms that women consistently had higher adjusted odds of HTN despite overall improvements in prevalence. This gender disparity likely stems from differences in unmeasured exposures or social determinants of health not fully captured in the model. Given these insights, it is crucial to incorporate gender-sensitive strategies into future HTN prevention programs.
Finally, the factors contributing to HTN in rural Henan are intricate and multifaceted, encompassing genetic, environmental, behavioral, and physiological influences. Recent studies in Chinese populations have further emphasized this biological complexity, including associations with vitamin D receptor polymorphisms and mitochondrial DNA methylation, suggesting potential genetic and epigenetic pathways that may influence HTN risk[37,38]. Supporting this, our previous work in the same population demonstrated that long-term exposure to PM2.5 and its chemical constituents is associated with elevated blood pressure[39], underscoring the importance of addressing environmental determinants in the prevention of chronic diseases.
-
To address low control rates (12.3%), intersectoral strategies are essential. Environmental strategies include subsidizing fresh food markets to reduce reliance on preserved, high-sodium foods. Healthcare: Task-shift HTN screening to village health workers using the 7-category system. Gender-Specific: Mobile clinics to overcome women’s mobility barriers due to caregiving roles. Additionally, improving treatment adherence strategies is crucial to achieve better blood pressure control.
-
While this study offers valuable insights into the determinants of hypertension (HTN) in rural China, several limitations should be acknowledged. First, the study was conducted exclusively in Henan Province, which, despite its large and demographically diverse rural population, may not fully represent the economic, environmental, and healthcare diversity found across other rural regions of China. Second, our analyses focused on the main effects of individual risk factors without testing interaction effects (e.g., gender × alcohol, age × physical activity), which may mask compounded or synergistic influences. Third, although key environmental and sociocultural exposures were included (e.g., alcohol accessibility, dietary habits), we lacked granular data on household air pollution and direct measures of sodium intake, which are relevant to HTN in rural settings. Fourth, approximately 27% of baseline participants were lost to follow-up, mainly due to labor migration, aging, death, or the suspension of face-to-face blood pressure assessments during the COVID-19 pandemic. While telephone follow-ups were conducted, these cases were excluded from BP-related analyses because the study protocol required in-person measurements. Seasonal blood pressure fluctuations may have introduced minor variability in our estimates of HTN prevalence, awareness, treatment, and control. Future studies with more granular, time-stamped data could explore seasonal trends more explicitly.
Despite these limitations, our study offers several contributions. The implementation of a 7-category blood pressure classification system supports earlier detection of hypertension stages in resource-limited settings, particularly among high-risk individuals. Furthermore, we employed a GLMM to reliably identify modifiable risk factors, including BMI, alcohol consumption, and physical inactivity. A key strength of this framework is its ability to account for variations over time at both the individual and regional levels.
-
Hypertension (HTN) in rural Henan Province, China, continues to escalate, driven by environmental and lifestyle factors such as alcohol accessibility, high-sodium diets, and inadequate healthcare infrastructure. Despite improvements in awareness and treatment, blood pressure control remains suboptimal, particularly among women, who face higher adjusted risk despite greater awareness. This highlights the urgent need for gender-sensitive, community-based interventions that address both medical and sociocultural determinants. Our introduction of a 7-category blood pressure classification system, tailored for low-resource settings, and the use of a Generalized Linear Mixed-Effects Model (GLMM) framework enable more nuanced risk stratification and early detection of HTN. These tools offer practical guidance for designing targeted interventions in similar rural populations. However, given the regional focus of this study, findings may not be generalizable to all rural or national settings in China. Future research should explore broader, nationally representative cohorts to validate and extend these insights.
Gender-specific Prevalence and Risk Factors of Hypertension in a Chinese Rural Population: The Henan Rural Cohort Study
doi: 10.3967/bes2025.102
- Received Date: 2025-03-24
- Accepted Date: 2025-08-01
-
Key words:
- Hypertension /
- Gender Disparities /
- Rural China /
- Risk Factors /
- Cohort Study
Abstract:
The authors disclose that they have no competing financial or non-financial interests that could have impacted the outcomes reported in this study. Transparency is a priority in presenting their research findings.
The entire study adhered to stringent ethical standards, receiving comprehensive approval from the Zhengzhou University Life Science Ethics Committee and ensuring informed consent from all participants. This commitment to ethical principles enhances the credibility and significance of the Henan Rural Cohort Study. The ethics approval code for this study is [2015] MEC (S128).
| Citation: | Fayaz Ahmad, Tahir Mehmood, Xiaotian Liu, Xianghao Yuchi, Ning Kang, Wei Liao, Ruiyu Wu, Bota Baheti, Xiaokang Dong, Jian Hou, Sohail Akhtar, Chongjian Wang. Gender-specific Prevalence and Risk Factors of Hypertension in a Chinese Rural Population: The Henan Rural Cohort Study[J]. Biomedical and Environmental Sciences. doi: 10.3967/bes2025.102 |







 Quick Links
 DownLoad:

