


-
In recent years, the high mortality associated with chronic diseases has emerged as a major global health challenge, with cancer and cardiovascular disease (CVD) being the leading causes of death[1]. Since 2010, cancer and CVD have consistently ranked among the top causes of mortality[2,3]. The aging population and prevalence of non-communicable diseases (NCDs) continue to rise, and the pressure of chronic diseases on public health continues to increase[4].
Diet plays a crucial role in determining mortality risk, with unhealthy eating habits being a major contributor to premature death[5]. Many epidemiological studies have explored the effect of specific foods or nutrients on mortality, particularly in chronic conditions such as CVD, diabetes, and cancer[5,6]. Previous studies have shown that a balanced diet can reduce the risk of mortality. This includes having more fruits, vegetables, and whole grains while consuming less processed meats and saturated fats[7,8]. Over the past few years, the impact of dietary patterns on health has gradually attracted attention, particularly in studies on CVD and mortality risk[9]. Using measures of food quality, such as the Mediterranean Diet Score and Healthy Eating Index, numerous studies have examined the relationship between diet and mortality risk[10]. However, many of these studies have primarily examined the impact of individual dietary components, overlooking the complexity of overall dietary patterns and the potential synergistic effects of food combinations[11]. Dietary preferences are not only related to individual nutritional needs but are also affected by multiple factors, such as social and cultural background, living habits, and psychological emotions. This is a complex physiological and social process[12]. Studies[13,14] have suggested that dietary preferences are associated with chronic diseases such as hypertension, obesity and diabetes, which are also important drivers of mortality risk.
To address the gap in the research on dietary preferences and mortality risk, this study focused on middle-aged and older population. This study investigated the influence of dietary preferences on mortality risk and examined the potential effects of individual dietary changes. The aim was to enhance the current body of research and provide evidence to support the development of public health policies and dietary recommendations.
-
The data used in this study were obtained from the Shenzhen Health Big Data Cohort (SHBDC). Since its launch in 2009, the cohort has continuously recruited permanent residents from all ten districts of Shenzhen through systematic community health screening. The participants underwent regular health checkups every year from the date of enrollment. Baseline data for this study were collected when the participants were first enrolled, and follow-up continued until November 7, 2022. At baseline, the researchers collected demographic characteristics, medical histories, dietary preferences, and lifestyle information from the participants using a structured questionnaire, with dietary data collected at enrollment. The questionnaire items were based on simplified tools developed for local populations; although these tools have not been formally validated in the published literature, they have been widely used in local epidemiological surveys. As part of the national basic public health service program, clinical indicators including body mass index (BMI), blood pressure, and blood sugar levels were measured by trained health professionals during the baseline community health check-up. All data were strictly de-identified ( personal identifying information such as name and ID number was removed) and linked to the national death registration system. The system provides detailed information on the date and cause of death, coded using the International Classification of Diseases (ICD). Participants with missing follow-up data or unknown death status were excluded from the analysis. This study adhered to the ethical principles of the Declaration of Helsinki and was approved by the Biomedical Ethics Committee of the Southern Medical University (approval number: 202378). The design of the SHBDC is described in detail in the relevant literature[15].
As shown in Figure 1, participants with duplicate files, lost to follow-up, or missing dietary information were excluded (n = 772,397). Subsequently, individuals aged ≤ 45 years or > 100 years, with a BMI < 10 or > 60, time logic errors, or missing sex information were excluded (n = 374,556). Finally, 1,160,312 participants were included in all-cause mortality analyses. Furthermore, 3,068 individuals with cancer at baseline were excluded, and 1,157,244 participants were included in the cancer-related death analysis. In addition, 78,700 participants with cardiovascular and cerebrovascular diseases at baseline were excluded, and 1,081,612 participants were included in the cardiovascular and cerebrovascular death analyses (Figure 1).
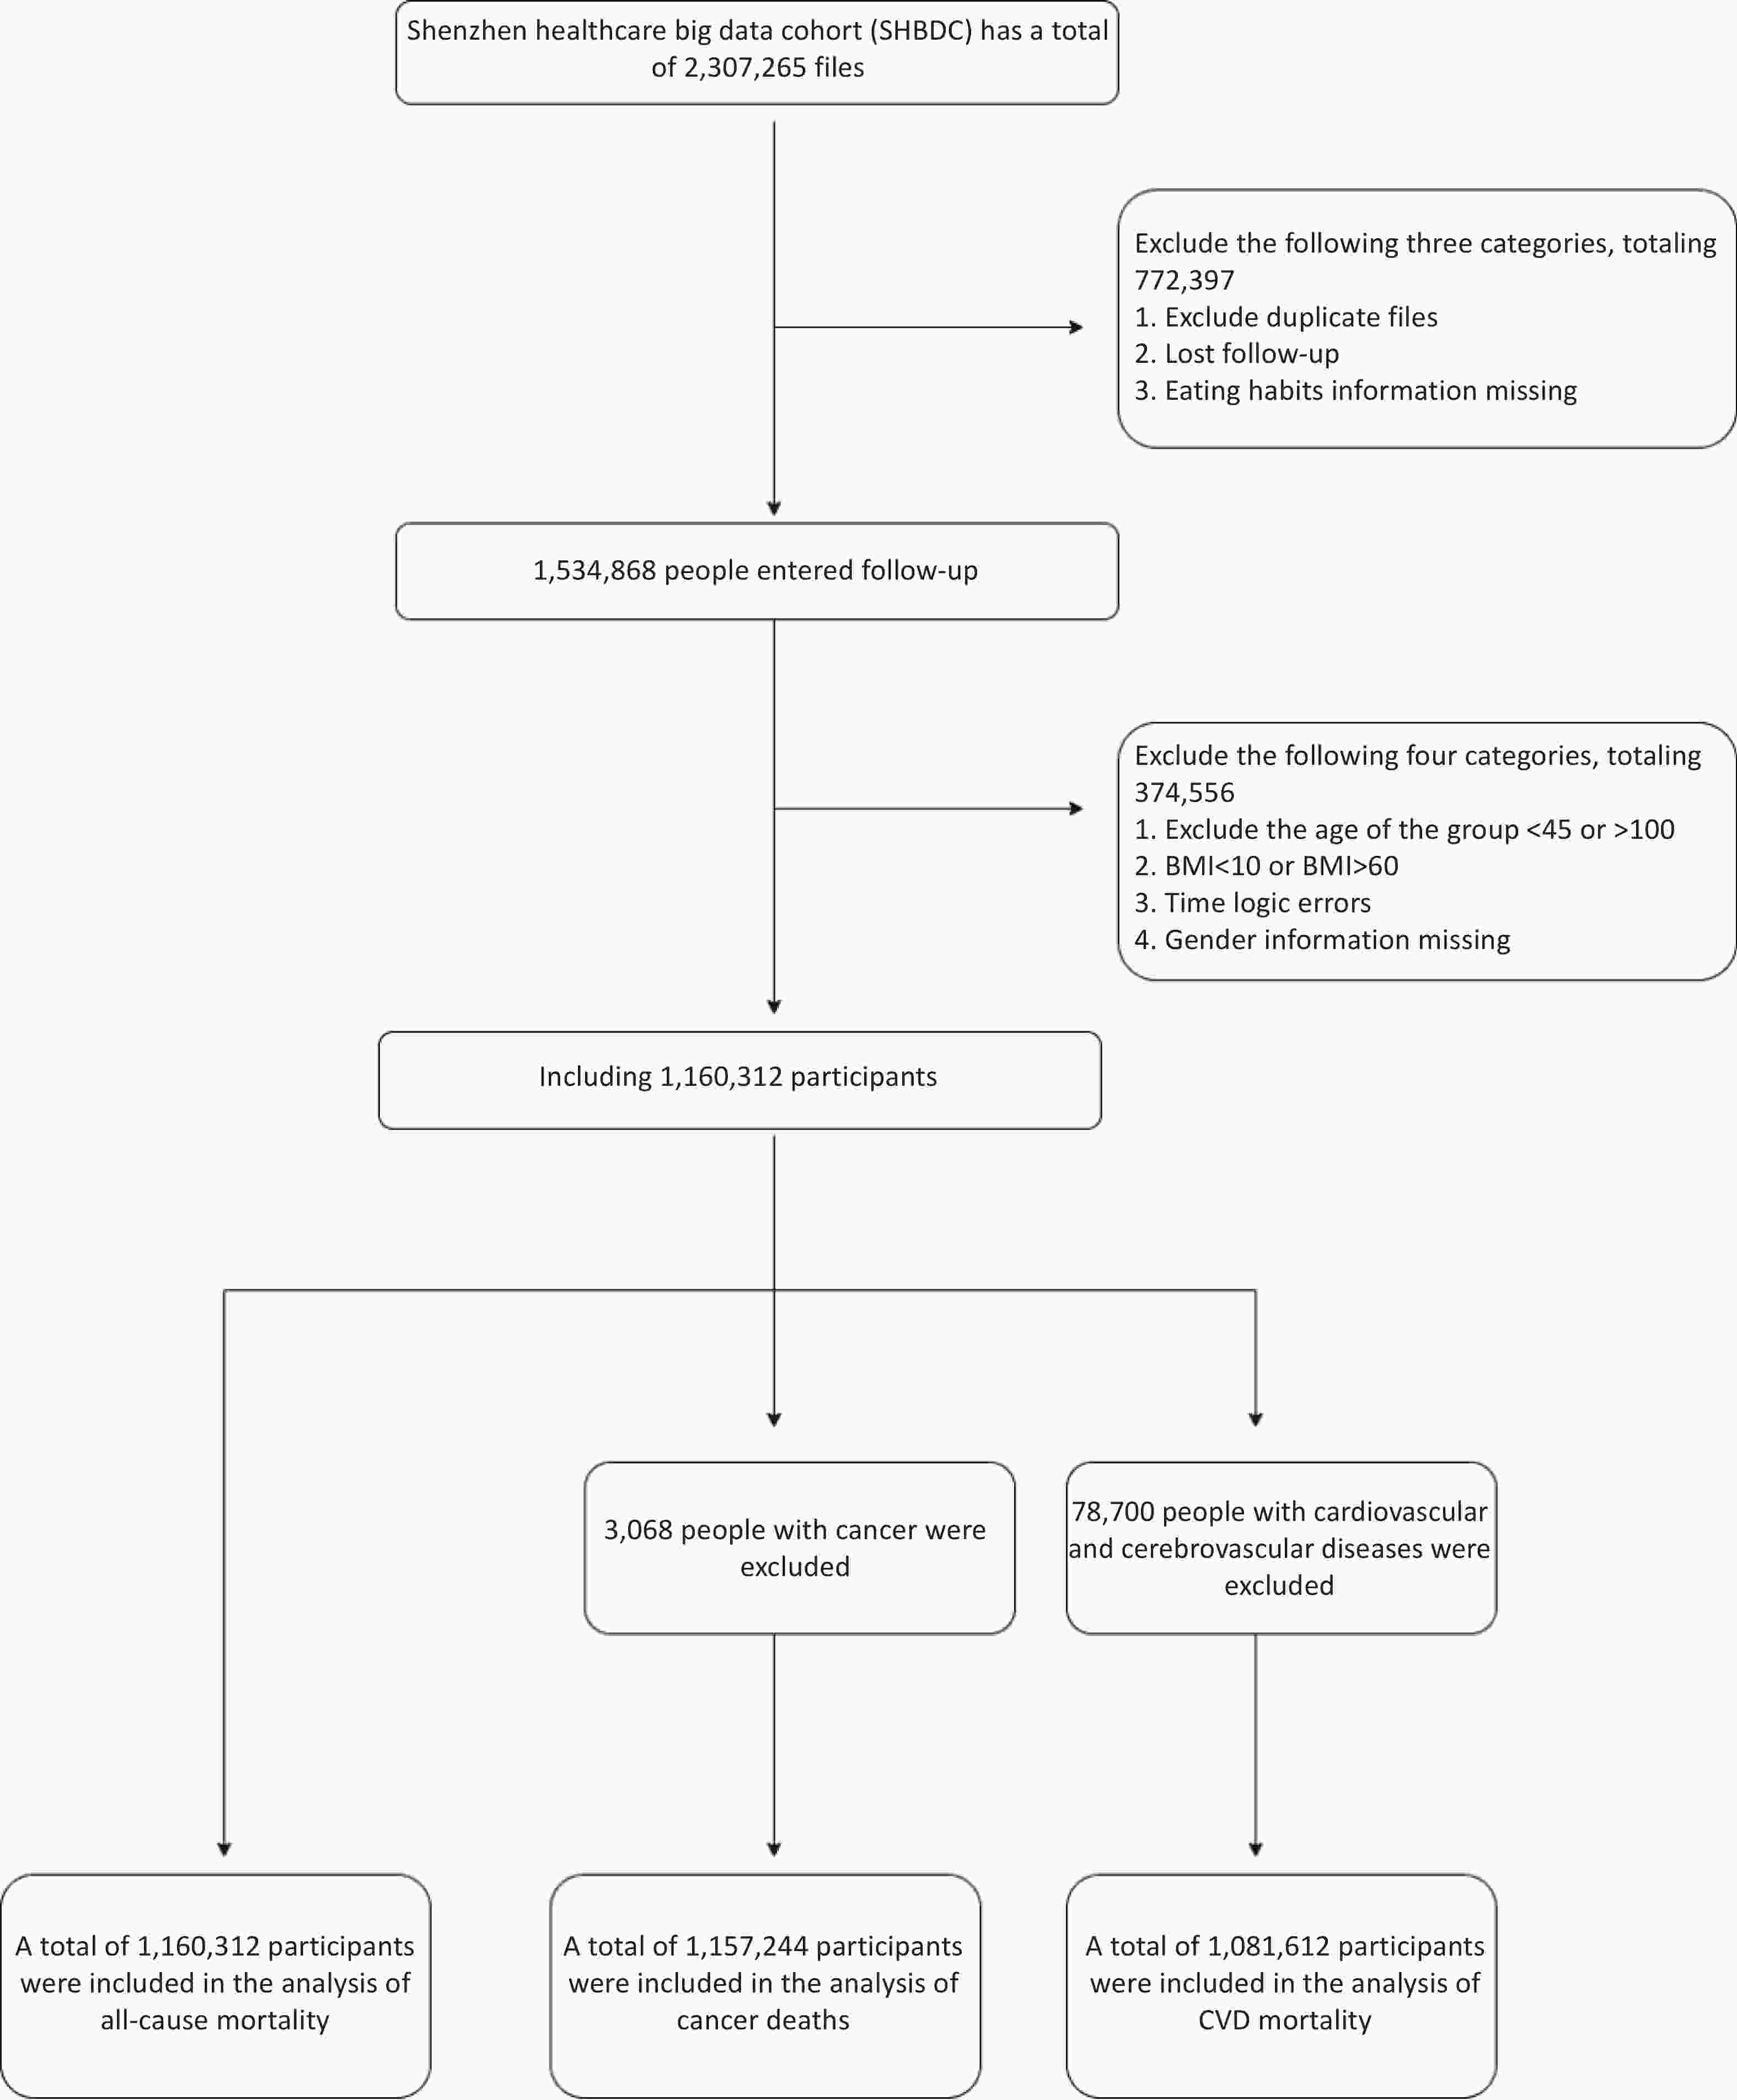
Figure 1. Flowchart of participant selection.
-
During the initial data collection period, information on dietary preferences was obtained using a self-administered baseline questionnaire. Dietary preferences refer to an individual's habitual choices regarding their diet, including the choice of ingredients, cooking methods, flavors, and the use of condiments. Dietary preferences were assessed using a structured questionnaire that included the following question: “Which of the following dietary preferences do you have?” Response options covered dietary structure, such as “mixed diet (balanced meat and vegetables),” “mainly meat-based” (defined as eating mainly animal foods with relatively low intake of plant foods), and “mainly vegetarian” (defined as eating mainly plant foods with relatively low intake of meat), as well as taste preferences, including preferences for salt, oil, or sugar.
-
Data on the date and cause of death of participants were sourced from the National Death Registry Information System. The results examined in this study encompassed the overall mortality and mortality from specific causes categorized based on the International Classification of Diseases, 10th Revision (ICD-10) codes, with the recorded primary cause of death. Specifically, we evaluated cancer (codes C00-C97), cardiovascular disease (codes I00-I99), and all-cause mortality. For the analysis, the survival time was calculated from the baseline to the date of death or December 31, 2022, whichever occurred first.
-
Factors related to exposure and outcomes included demographics, lifestyle, and clinical traits. Age, sex (female or male), educational level (high school or higher, junior high school, elementary school, illiterate, or unknown), and BMI were the demographic characteristics at baseline. The following lifestyle characteristics were considered: smoking status (never smoked, former smoker, or current smoker), frequency of alcohol consumption (never, occasionally, regularly, or daily), and exercise habits (no exercise, previous exercise, or never exercised). The clinical characteristics included personal medical history (hypertension, diabetes, cancer, kidney disease, cardiovascular disease, and cerebrovascular disease) and family history (hypertension, diabetes, and cancer). Personal medical history was evaluated using the following question: "Have you been diagnosed with the following diseases by a doctor?" Diabetes, cancer, high blood pressure, kidney disease, and cardiovascular and cerebrovascular diseases are defined as cardiovascular and cerebrovascular diseases, including heart diseases (heart attack, coronary heart disease, angina, and congestive heart failure), stroke, ischemic stroke, subarachnoid hemorrhage, and cerebral hemorrhage.
-
Normal distribution continuous variables were represented as mean ± standard deviation, while categorical variables were provided as frequencies. The t-test for continuous variables and the chi-square test for categorical variables were used to evaluate sex differences. To reduce the risk of inferential bias and address the potential loss of statistical power due to missing covariate data, we applied predicted mean matching over several imputations to estimate the missing variables for covariates[16]. The numbers and proportions of missing variables are listed in Supplementary Table S1. Hazard ratios (HRs) and 95% confidence intervals (CIs) were calculated using Cox regression models to evaluate the relationship between food choice and death from all causes, CVD, and cancer. In Model 1, adjustments were made for age and sex, while Model 2 included further adjustments for potential confounders such as marital status, education, occupation, BMI, smoking, alcohol intake, exercise activity, medical history (such as high blood pressure, diabetes, cancer, kidney disease, cardiovascular, and cerebrovascular diseases), and family history (such as hypertension, diabetes, and cancer). To assess the relationship between dietary preferences and the above-mentioned mortality outcomes and their robustness, we conducted further analyses by age stratification (45–65 years and 65–100 years) and sex stratification. Sensitivity analyses were performed to assess the robustness of the findings. First, participants who experienced outcome events within the first 12 months of follow-up were excluded, and Cox regression analyses were repeated. Second, participants with a history of kidney disease, cancer, or cardiovascular or cerebrovascular diseases at baseline were excluded from the evaluation of reliability of the results. Additionally, we excluded participants with a baseline diagnosis of diabetes or hypertension to ensure consistency in the associations.
R software was used for statistical analysis. (version 4.4.1; R Project for Statistical Computing). P values were calculated as two-tailed, with statistical significance defined as values < 0.05.
-
The follow-up time was (25.16 ± 27.66) months (25.16 ± 27.68) months for the cancer death analysis group and (25.16 ± 28.06) months for the CVD death analysis group. During this period, 3,865 cancer-related deaths, 3,576 CVD-related deaths, and a total of 12,308 all-cause deaths were reported. The participants were 62.48 years on average. There were significant sex differences in lifestyle factors, such as dietary preferences, education level, marital and occupational status, BMI (24.40 for men and 24.00 for women), exercise frequency, smoking, drinking habits, medical history, and family history (P < 0.001), which highlights the important role of sex in health characteristics (Table 1 and Supplementary Tables S2–3).
Study variables Total Male, n (%) Female, n (%) P value All-cause deaths 12,308 7,189 (58.38) 5,119 (41.61) < 0.001 Age, y, mean ± SD 62.48 ± 9.55 61.30 ± 9.78 63.70 ± 9.16 < 0.001 Eating patterns Mixed meat and vegetables 1,073,557 546,587 (50.91) 526,970 (49.09) < 0.001 Mainly meat-based 23,805 15,250 (64.06) 8,555 (35.94) < 0.001 Mainly vegetarian 53,499 19,340(36.15) 34,159(63.85) < 0.001 Taste Preferences Salt preference 34,948 18,250 (52.22) 16,698(47.78) < 0.001 Oil preference 8791 5,104 (64.06) 3,687 (41.93) < 0.001 Sugar preference 6125 3,101 (50.63) 3,024 (49.37) 0.837 Education level < 0.001 High school and above (including technicians) 423,670 266,582 (62.91) 157,088(37.09) Junior high school 355,666 192,871 (54.23) 162,795 (45.77) Primary school 315,064 108,988 (34.59) 206,076 (65.41) Illiterate and unknown 65,912 17,400 (26.39) 48,512 (73.61) Marital status < 0.001 Single/divorced/widowed/other 32,963 9,422 (28.58) 23,541 (71.42) Married 1,127,349 576,419 (51.14) 550,930 (48.86) Occupational status < 0.001 Employed 659,312 392,989 (59.60) 266,323 (40.40) Unemployed 501,000 192,852 (38.49) 308,148 (61.51) BMI (kg/m2), mean ± SD 24.20 ± 3.16 24.40 ± 3.07 24.00 ± 3.25 < 0.001 Exercise frequency < 0.001 Daily 586,288 287,231 (48.99) 299,057 (51.01) More than once a week 199,736 109,065 (54.61) 90,671 (45.39) Occasionally 98,892 51,212 (51.80) 47,680 (48.20) No exercise 275,396 138,333 (50.22) 137,063 (49.78) Smoking status < 0.001 Smoking 142,824 139,266 (97.51) 3,558 (2.49) Quit smoking 76,273 74,901 (98.21) 1,372 (1.80) Never smoked 941,215 371,674 (39.47) 569,541 (60.53) Drinking frequency < 0.001 Never 966,177 415,773 (43.03) 550,404 (56.97) Occasionally 116,743 98,881 (84.70) 17,862 (15.30) Often 30,624 28,394 (92.74) 2,230 (7.28) Daily 46,768 42,793 (91.50) 3,975 (8.50) Medical history Hypertension 289,199 150,637 (52.10) 138,562 (47.90) < 0.001 Diabetes 116,777 61,501 (52.67) 55,276 (47.33) < 0.001 Cancer 3068 1,297 (42.27) 1,771 (57.73) < 0.001 Cardiovascular and cerebrovascular diseases 78,700 43,360 (55.09) 35,340 (44.91) < 0.001 Kidney disease 21,236 12,097 (56.95) 9,139 (43.05) < 0.001 Family history Hypertension 165,597 83,970 (50.69) 82,027 (49.31) < 0.001 Diabetes 33,443 16,883 (50.49) 16,560 (49.51) 0.002 Cancer 2294 1,075 (46.86) 1,219 (53.14) 0.677 Table 1. Basic characteristics of the study population for all-cause mortality by sex
-
In the overall analysis, after adjusting for covariates, compared with mixed meat and vegetables dietary pattern, mainly meat-based (HR = 1.13; 95% CI: 1.02, 1.27, P = 0.025) was associated with a higher risk of all-cause mortality, while mainly vegetarian (HR = 0.87; 95% CI: 0.78, 0.97, P = 0.010) was linked to a reduced risk. Regarding taste preferences, oil preference (HR = 0.57; 95% CI: 0.40, 0.83, P = 0.003) and sugar preference (HR = 0.58; 95% CI: 0.41, 0.83, P = 0.003) were both associated with lower risk of all-cause death, whereas salt preference showed no significant association (P > 0.05). For cause-specific mortality, mainly meat-based tended to increase the risk of cancer death, though not statistically significant (P = 0.056), while mainly vegetarian was significantly associated with reduced CVD mortality (HR = 0.77; 95% CI: 0.62, 0.97, P = 0.024) (Table 2).
Dietary preferences All-cause mortality Cancer mortality CVD mortality Model 1 Model 2 Model 1 Model 2 Model 1 Model 2 HR (95% CI) P value HR (95% CI) P value HR (95% CI) P value HR (95% CI) P value HR (95% CI) P value HR (95% CI) P value Eating patterns Mainly meat-based 1.20 (1.08, 1.34) 0.001 1.13 (1.02, 1.27) 0.025 1.21 (1.00, 1.48) 0.050 1.21 (0.99, 1.47) 0.056 1.24 (1.01, 1.52) 0.039 1.12 (0.91, 1.37) 0.272 Mainly vegetarian 0.85 (0.77, 0.95) 0.003 0.87 (0.78, 0.97) 0.010 0.91 (0.76, 1.10) 0.349 0.93 (0.77, 1.12) 0.436 0.74 (0.59, 0.92) 0.007 0.77 (0.62, 0.97) 0.024 Taste Preference Salt preference 0.97 (0.88, 1.08) 0.606 0.92 (0.83, 1.02) 0.098 0.94 (0.78, 1.13) 0.492 0.94 (0.78, 1.13) 0.506 1.04 (0.87, 1.24) 0.682 0.95 (0.80, 1.14) 0.601 Oil preference 0.58 (0.40, 0.84) 0.004 0.57 (0.40, 0.83) 0.003 0.67 (0.37, 1.21) 0.185 0.69 (0.38, 1.25) 0.223 0.59 (0.28, 1.24) 0.167 0.57 (0.27, 1.19) 0.132 Sugar preference 0.58 (0.41, 0.83) 0.003 0.58 (0.41, 0.83) 0.003 0.51 (0.25, 1.01) 0.055 0.51 (0.25, 1.02) 0.055 0.81 (0.45, 1.46) 0.485 0.83 (0.46, 1.50) 0.526 Note. 1. Model 1 was adjusted for age and sex, and Model 2 was further adjusted for the following variables according to different types of mortality risk: age, sex, education level, marital status, occupation type, BMI, exercise frequency, smoking status, drinking frequency, medical history, and family history (including hypertension, diabetes, and cancer). The adjustments for medical history were as follows: (1) all-cause mortality risk: hypertension, diabetes, cancer, kidney disease, and cardiovascular and cerebrovascular diseases; (2) cancer mortality risk: hypertension, diabetes, kidney disease, and cardiovascular and cerebrovascular diseases; and (3) cardiovascular disease mortality risk: hypertension, diabetes, cancer, and kidney disease. 2. The combination of meat and vegetables was used as a control to study the effects of different dietary patterns on the risk of all-cause, cancer, and CVD deaths. In terms of taste preference, the effect of different taste preferences on the risk of all-cause mortality, cancer mortality, and CVD mortality was studied with people without taste preference as controls. Table 2. Association of dietary preferences with all-cause mortality, cancer mortality, and cardiovascular disease mortality
-
In sex-stratified analysis, dietary preferences exhibited sex-specific associations. Among men, salt preference (HR = 0.85; 95% CI: 0.73, 0.98, P = 0.024), oil preference (HR = 0.58; 95% CI: 0.37, 0.92, P = 0.019), and sugar preference (HR = 0.58; 95% CI: 0.37, 0.91, P = 0.017) were all significantly associated with lower all-cause mortality, and sugar preference was also protective for cancer mortality (HR = 0.37; 95% CI: 0.14, 0.99, P = 0.047). In contrast, among women, only mainly vegetarian showed a significant protective effect on all-cause mortality (HR = 0.83; 95% CI: 0.71, 0.97, P = 0.017). Notably, significant interactions were observed between sex and both the mainly vegetarian (P for interaction = 0.032) and salt preference (P = 0.017), indicating differential effects by sex (Supplementary Tables S4—S6).
In the age-stratified analysis, the association between dietary patterns and mortality outcomes was more prominent in the older age group (≥ 65 years). Mainly meat-based was significantly associated with higher risks of all-cause (HR = 1.28; 95% CI: 1.14, 1.45, P < 0.001), cancer (HR = 1.38; 95% CI: 1.12, 1.72, P = 0.003), and CVD mortality (HR =1.27; 95% CI: 1.02, 1.58, P = 0.035). Conversely, mainly vegetarian was linked to lower risks of all-cause (HR = 0.84; 95% CI: 0.75, 0.94, P = 0.002) and CVD mortality (HR = 0.73; 95% CI: 0.58, 0.93, P = 0.010). In addition, oil preference showed a strong protective association with all-cause mortality in this age group (HR = 0.51; 95% CI: 0.34, 0.76, P = 0.001) (Supplementary Tables S7–S9).
-
First, after excluding participants who experienced study outcome events within 12 months, Cox regression analysis was performed again before follow-up. The results for dietary preference and mortality risk are detailed in Supplementary Tables S10–12. Second, after excluding participants with cancer, kidney disease, or cardiovascular or cerebrovascular diseases at baseline, the analysis was repeated. The relevant results are presented in Supplementary Tables S13–15. Additionally, to ensure consistency in the associations, participants with baseline diagnoses of diabetes and hypertension were excluded, and the results are provided in Supplementary Table S16.
-
We examined the association between dietary preferences and mortality. After adjusting for covariates, the results indicated that mainly meat-based diet was linked to an increased chance of death from all causes, while mainly vegetarian was linked with a lower risk of death from all causes. And CVD mortality compared to mixed meat and vegetables. No significant relationship was found between salt preference and mortality risk, whereas both oil and sugar preferences were associated with a decreased risk of death from all causes. Further sex-stratified analysis showed that the results differed between sexes, and the association was more significant in people aged ≥ 65 years.
Our results are in line with those of previous studies that reported an increased risk of type 2 diabetes[17], CVD[18], certain types of cancer (including colorectal cancer)[19], and mortality[20] were linked to an increased intake of red meat, particularly processed red meat. Furthermore, cooked red meat contains substances that are believed to increase the risk of cancer, including polycyclic aromatic hydrocarbons, heterocyclic amines[21], as well as heme iron-induced oxidative stress mechanisms, which together form a biochemical basis for the pathogenicity of red meat. In addition, a study of adults in Spain showed that the pro-vegetarian food model of plant-derived food was related to a reduction in death risk[22]. A plant-based diet can enhance cardiometabolic health; support anti-inflammatory and antioxidant activities; and improve the metabolic control of dietary fiber, antioxidants, unsaturated fats, and high-quality protein. Reducing the risk of chronic illnesses such as diabetes, cardiovascular disease, metabolic syndrome, and cancer could ultimately help avoid premature death[23-25]. Stratified analysis showed that the effect of dietary patterns on mortality risk was heterogeneous among different sexes and age groups. Among women, only a diet mainly consisting of vegetarian foods was significantly associated with a reduced risk of all-cause mortality, and there was a significant interaction with sex, suggesting that women may benefit more from plant-based diet[26]. This difference may be related to sex differences in nutritional requirements, metabolic responses, and health behaviors[27]. In the age-stratified analysis, the association between diet and mortality was more significant in the elderly (≥ 65 years). This association was not observed because of the relatively lower baseline risk of disease in middle-aged adults (< 65 years), which may have masked the potential protective effects of a vegetarian diet. A diet dominated by meat significantly increases the risk of death from all causes, cancer, and cardiovascular disease, whereas a diet dominated by vegetarians has a protective effect, especially in reducing all-cause and cardiovascular deaths[28-29]. This is consistent with previous studies, and possible mechanisms include inflammatory responses, oxidative stress, and increased saturated fat intake caused by red and processed meats[30]. Due to a decline in physiological functions, the elderly may be more sensitive to adverse dietary factors[31].
There was no obvious association between salt preference and mortality risk. Some studies have found a U-shaped relationship between sodium intake and the risk of death. Too low an intake may also increase the risk, which may offset the risk of high intake, resulting in no overall significant association[32]. Notably, in the analysis of taste preferences, both oil and sugar preferences were less likely to cause death for any reason, a finding that contrasts with previous understanding. To explore the possible reasons for this, we analyzed the data according to sex and age. Gender analysis revealed that, in men, preferences for salt, oil, and sugar were associated with a decreased chance of dying from all causes. Men may engage in more exercise labor, and increased exercise activity may increase their dietary demand for salt, oil, sugar, etc[33]. Women who follow a vegetarian diet have a significantly decreased risk of mortality from all causes. This may be linked to women's dietary habits, greater health awareness, and increased consumption of foods derived from plants[34]. Age stratification was performed using 65 years as the boundary. From the age-stratified data, regardless of the risk of death, the impact of taste preference on people in different age groups differed. There may be significant differences in the demand for and response to fat and sugar metabolism between different individuals, and even between different age groups in the same population. These differences are closely related to changes in physiological factors such as human metabolic capacity, enzyme activity, hormone levels, and insulin sensitivity[35,36]. According to this study, eating a lot of olive oil was associated with a decreased risk of death; in contrast, eating butter and margarine was associated with a higher death rate. Specifically, substituting corn oil, rapeseed oil, or olive oil for butter or margarine can lower mortality from every source, in addition to mortality from CVD, diabetes, cancer, respiratory conditions, and Alzheimer's disease[37]. Although people are aware of their taste preferences, they are increasingly choosing healthier food options. However, in the elderly population (≥ 65 years), oil preference showed a protective effect on the chance of dying from all causes. This phenomenon has potential similarities with the "obesity paradox.” Although the traditional view is that a high-fat diet may increase metabolic burden, a moderate increase in fat intake (accounting for 20%–25% of total energy) in the elderly may play a protective role by maintaining energy reserves[38]. This may be due to the increased energy needs of the elderly, and moderate fat intake helps maintain basal metabolism and exercise strength, thereby reducing the risk of malnutrition or frailty[39]. When young, excessive sugar intake may increase health risks, whereas in old age, moderate sugar intake may help maintain exercise strength and reduce the risk of death. A study of people aged > 65 years in Hong Kong showed that consuming sugar in their diet was linked to decreased cardiovascular mortality[40]. Therefore, age is an important regulator of the health effects of a sugar diet and provides a basis for formulating personalized dietary recommendations.
This study has several significant advantages. This was a large-scale study with a total of 1,160,312 participants. The sample was highly representative and better reflected the health status and dietary habits of the different populations. The results have high external validity and provide solid evidence for public health policies. In addition, this study is the first to focus on the link between dietary preferences and mortality risk, enriching the research in this field. However, this study also has some limitations. Although relevant confounders were adjusted as much as possible and controlled using multivariate regression models, some confounders may not have been fully identified or measured, and their potential effects have not been eliminated. In addition, the follow-up period was short. Although the effects of exposure on health can be preliminarily assessed, long-term follow-up can reveal the persistence of exposure and its cumulative effects more comprehensively. Future studies should extend the follow-up period. Finally, the dietary data used in this study were derived from self-reports using simplified questionnaires, which may have been subject to recall bias and inaccurate classification. This simplified assessment method may not fully reflect the actual dietary intake of individuals, thereby affecting the precise classification of dietary preferences, which in turn has a certain impact on the research results. Therefore, caution should be exercised when interpreting the association between dietary patterns and mortality risk. To improve the reliability of this study, more objective and accurate exposure assessment methods, such as biological samples or self-reporting tools, should be used in the future.
-
In summary, this study found that the dietary preferences of middle-aged and older adults in Shenzhen were associated with mortality risk. Meat-based diet is mainly linked to an increased risk of mortality from all causes, while vegetarians are mainly linked to a lower risk of mortality from CVD and all causes, particularly among older adults. Oil and sugar preferences have a protective effect in some cases; however, the effects vary among different age groups, suggesting that healthy dietary recommendations should be personalized.
Association of Dietary Preferences with All-Cause and Cause-Specific Mortality: Prospective Cohort Study of 1,160,312 Adults in China
doi: 10.3967/bes2025.108
- Received Date: 2025-01-17
- Accepted Date: 2025-05-20
-
Key words:
- Dietary preference /
- Cancer mortality /
- Cohort study /
- All-cause mortality /
- CVD mortality
Abstract:
The authors declare no competing interests.
The study protocol was approved by the Biomedical Ethics Committee of Southern Medical University (202378).
| Citation: | Wenru Shi, Sitong Wei, Qingmei Huang, Huan Chen, Dong Shen, Bofeng Zhu, Chen Mao. Association of Dietary Preferences with All-Cause and Cause-Specific Mortality: Prospective Cohort Study of 1,160,312 Adults in China[J]. Biomedical and Environmental Sciences. doi: 10.3967/bes2025.108

|

 Quick Links
 DownLoad: