-
Cardiovascular disease (CVD) remains the most common cause of death and disability-adjusted life years in humans[1]. The total number of global CVD-related deaths increased from approximately 12.4 million in 1990 to 19.8 million in 2022[2]. With the prevalence of CVD continues to increase[4], the number of prevalent cases of total CVD nearly doubled from 271 million (95% UI: 257 to 285 million) in 1990 to 523 million (95% UI: 497 to 550 million) in 2019[3], which poses a significant threat to human health. Therefore, identifying and accurately assessing the risk factors for CVD is crucial for early prevention and control.
In addition to the traditional risk factors for CVD, such as lack of physical activity, family history, alcohol consumption, and smoking[5], many environmental pollutants have been shown to increase the cause of high incidence of CVD[6-9]. Polycyclic aromatic hydrocarbons (PAHs) are a group of common environmental pollutants[10-12], widely distributed in soil[13], water[14], air[15], and food[16], and enter the human body through inhalation, ingestion, drinking, or skin[17]. After entering the body, PAHs first bind to aryl hydrocarbon receptors (AhRs), which induce the expression of cytochrome P450 enzymes such as cytochrome P450 (CYP)1A1, CYP1A2, and CYP1B1[18]. These CYP enzymes catalyze the conversion of PAHs into epoxides, which are subsequently hydrolyzed by epoxide hydrolase (EH) to form diol-epoxides. Activated oxidative stress and inflammatory responses impair vascular endothelial function[19]. Previous studies have shown that PAHs exposure is associated with CVD risk increasing[20]; however, there are very few reports on specific types of CVD.
In recent decades, many CVD risk assessment models have been developed and updated, including the Pooled Cohort Equations(PCEs)[21], Framingham[22], Systematic Coronary Risk Evaluation (SCORE)[23], SCORE2[24], WHO CVD risk[25], QRISK3[26], and China-PAR[27]. These models predict CVD risk well but ignore the interrelationships among chronic kidney disease (CKD), metabolic syndrome (MetS) and CVD. It should be viewed as a whole cardiovascular-kidney-metabolic (CKM) syndrome and evaluated using uniform criteria. Therefore, the American Heart Association (AHA) updated its official CVD risk prediction tool from PCE to the new Predicting Risk of Cardiovascular Disease EVENTs (PREVENT) equations[28]. Compared to PCE, PREVENT emphasizes the multifactorial nature of CVD risk prediction, especially when considering the impact of CKD and metabolic diseases on CVD risk, which may be more representative of the current level of risk, and is therefore likely to present improved calibration[29]. More importantly, PREVENT predicts the total CVD risk as well as the risk of four CVD subtypes: atherosclerotic cardiovascular disease (ASCVD), heart failure (HF), coronary heart disease (CHD), and stroke.
We performed a cross-sectional analysis of 6,754 adult participants in the 2001–2016 National Health and Nutrition Examination Survey (NHANES), used the latest PREVENT equation to calculate the 10-year risk of total CVD and four CVD subtypes, and analyzed their relationship with urinary PAHs metabolites. Three different statistical models were used, including multivariate logistic regression, weighted quantile sum (WQS) model, and quantile g-computation (qgcomp) model, to comprehensively assess the relationship between urinary PAHs metabolites and the five types of CVD.
-
The data used in this study are publicly available in the NHANES database (https://wwwn.cdc.gov/nchs/nhanes/default). NHANES is an ongoing national cross-sectional survey that includes demographic, wide-ranging chemical exposure, and biochemical data of non-institutionalized individuals residing in the United States.
All surveys and informed consent for NHANES were approved by the Institutional Review Board of the Centers for Disease Control and Prevention (CDC). We extracted data from eight survey cycles spanning the years 2001–2016, and approximately 82,097 participants were enrolled. Then 48,731 participants were excluded because they were < 30 or > 80 years of age, 3826 participants were excluded because of a history of CVD, 20,664 participants were excluded because of incomplete urinary PAH data, and 2,122 participants were excluded because of missing parameter data, such as smoking, alcohol consumption, and exercise. Ultimately, this study consisted of 6,754 participants. A detailed flowchart is shown in Figure 1.
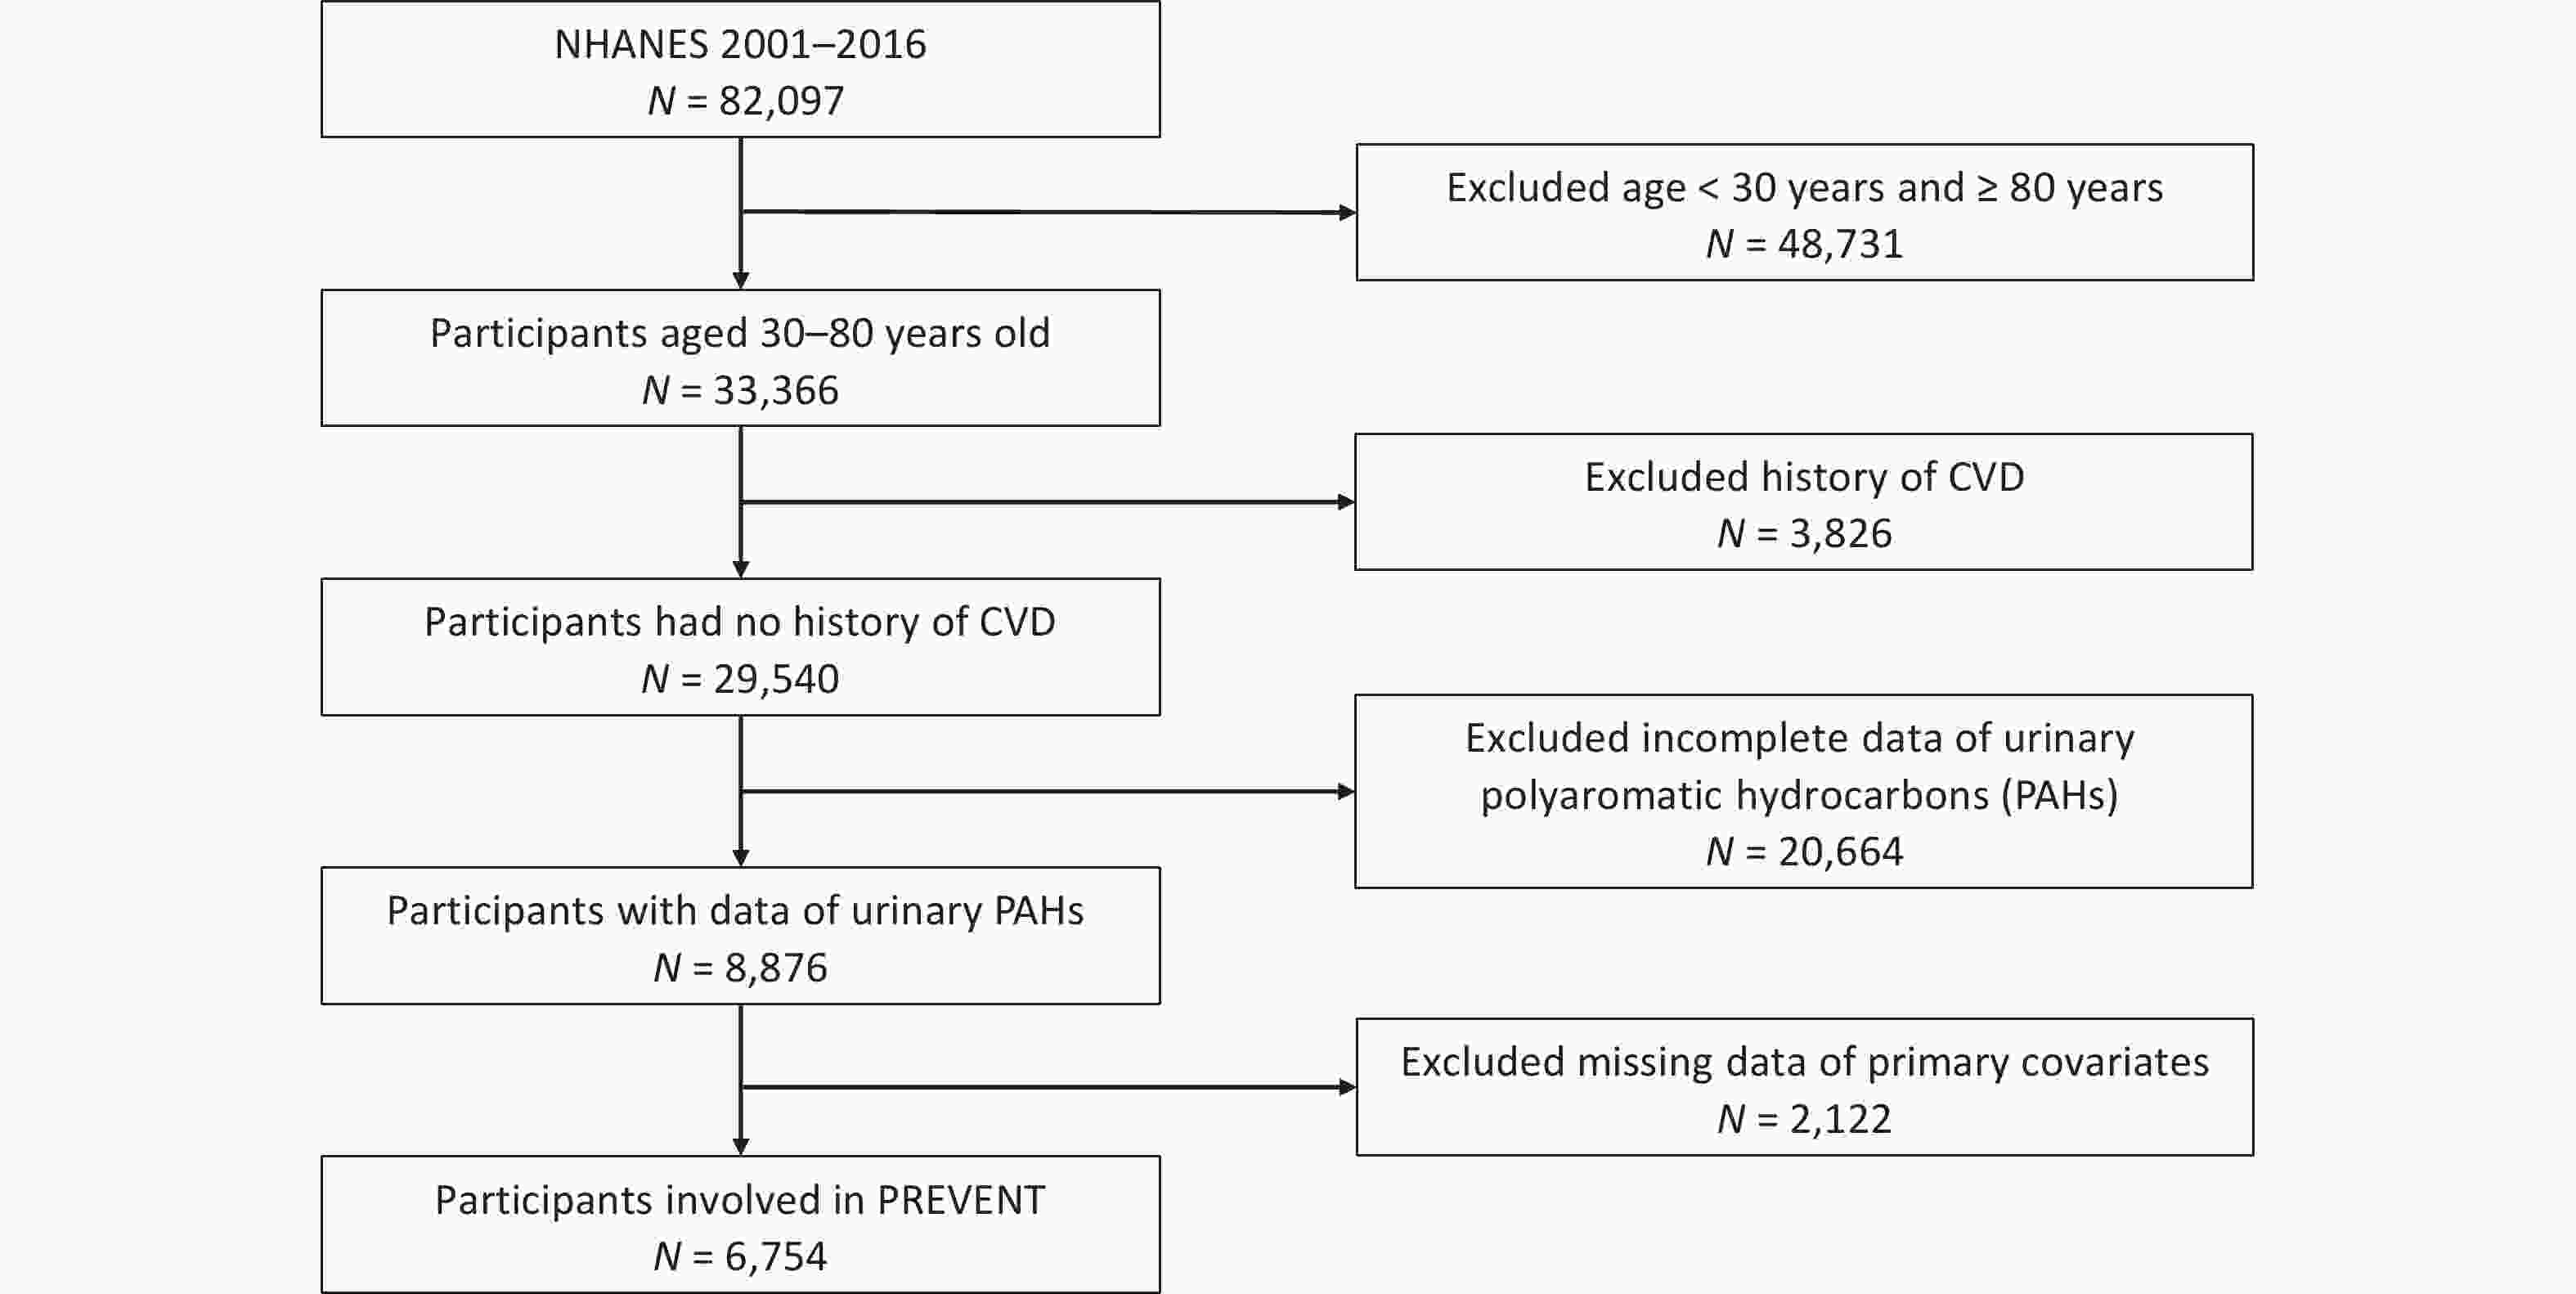
Figure 1. Flowchart of the population included in our final analysis (N = 6,754), NHANES, USA, 2001–2016.
-
The NHANES and Nutrition Examination Laboratory protocol webpage provides a comprehensive account of the laboratory methods and procedures used. In summary, spot urine samples were shipped to the Division of Laboratory Sciences, National Center for Environmental Health, CDC for processing and storage at temperatures of –20 or –30 °C until testing. Urinary OH-PAHs were measured using gas chromatography/tandem mass spectrometry (GC-MS/MS) during the 2001–2012 survey cycles, and online solid-phase extraction high-performance liquid chromatography/tandem mass spectrometry (online SPE-HPLC-MS/MS) was used in the 2013–2016 survey cycles. In addition, we quantified the urinary concentrations of six OH-PAHs: 1-napthalene (1-NAP), 2-napthalene (2-NAP), 2-fluorene (2-FLU), 3-fluorene (3-FLU), 1-phenanthrene (1-PHE), and 1-pyrene (1-PYR). When the concentrations of OH-PAHs were below the limit of detection (LOD), we used the equation of LOD divided by the square root of two to replace the original values[30]. The OH-PAHs concentration was adjusted for urinary creatinine and expressed as ng/g creatinine to account for these differences and the potential impact on urine dilution. Before analyzing, six OH-PAHs were classified into four groups according to their prototypes: ΣuNAP: urinary naphthalene (NAP) metabolites (1- and 2-NAP), ΣuFLU: urinary FLU metabolites (2- and 3-FLU), ΣuPHEN: urinary Phenanthrene metabolites (1-PHE), ΣuPYR: urinary Pyrene metabolites(1-PYR). In addition, the total sum of these six PAHs was calculated as ΣuPAHs, which is the sum of urinary PAHS metabolites (1- and 2-NAP, 2- and 3-FLU, 1-PHE, and 1-PYR).
-
The PREVENT equations removed race and included the additional covariates of estimated glomerular filtration rate (eGFR) and statin use. Serum creatinine was used to calculate the eGFR using the CKD Epidemiology Collaboration (CKD-EPI) 2021 creatinine equation[31]. We calculated the 10-year risk of total CVD and four CVD subtypes: ASCVD, HF, CHD and Stroke. The details of the calculation process can be found on the website[32]. Following the AHA-recommended interpretation of risk estimates, we categorized the risk estimates as low risk group (< 5%) and high risk group (≥ 5%)[33].
-
Considering the influence of confounding factors, we evaluated several appropriate covariates, including gender (male/female), age (≥ 30, 40–50, 50–60, and ≥ 60 years), race/ethnicity (Mexican American, other Hispanic, non-Hispanic White, non-Hispanic Black, and other race), education level (less than high school, high school or equivalent, some college or AA degree, college graduate or above), family income-poverty ratio (PIR) (< 1.3, 1.3–3.5, and ≥ 3.5), marital status (married, living with partner, living alone). Environmental tobacco smoke exposure was divided into low (≤ 0.015 ng/mL) and high (> 0.015 ng/mL)[34]. Participants were considered alcohol users if they consumed at least 12 alcoholic drinks in any year. BMI was dichotomized as under/normal weight (< 25 kg/m2), overweight (25–30 kg/m2), obese (≥ 30 kg/m2). Physical activity was classified into two categories (mild, moderate, or vigorous) according to self-reported activity intensity. Total energy intake was used in this study, and divided into low (males < 2,000 kcal/day, females < 1,600 kcal/day), adequate (males 2,000–3,000 kcal/day, females 1,600–2,400 kcal/day), high (males > 3,000 kcal/day, females > 2,400 kcal/day).
-
Continuous variables are presented as means and standard deviations (SD), whereas categorical variables are presented as frequencies and percentages. Before the analysis, urinary OH-PAHs were divided by urinary creatinine to account for urinary dilution. The corrected urinary OH-PAHs concentrations were ln-transformed because of their right-skewed distribution. Pearson’s correlation method was used to evaluate the paired-wise correlations of the chemicals. Chi-square tests were performed to compare the distributions of categorical variables. The urinary OH-PAHs were categorized into quartiles before performing multiple logistic analyses. Multiple logistic regression models were used to estimate the relationship between urinary OH-PAHs and risk with odds ratios (ORs) and corresponding 95% confidence intervals (CIs), respectively. Age, race, sex, BMI, marital status, education level, PIR, serum cotinine level, drinking status, total energy intake, and physical activity were included in the logistic regression model. Subgroup analysis was stratified by age in younger (30 ≤ Age < 50) and aging group (Age ≥ 50)).
The WQS regression model is commonly used in environmental epidemiology to evaluate the impact of combined exposures on specific outcomes[35]. The WQS index was formulated using the quartiles of mixtures containing urinary OH-PAHs. We randomly allocated 40% of the sample as the test dataset, and the remaining 60% served as the validation dataset using bootstrap resampling (n = 1,000). Notably, the WQS regression model imposes constraints on individual chemical effects, ensuring that they all exert an influence in the same direction. To avoid the reversal paradox, we primarily focused on the positive direction of the WQS regression. The following variables were also included and adjusted in the WQS models: age, race, sex, BMI, marital status, education level, PIR, serum cotinine level, drinking status, total energy intake, and physical activity. Chemicals with estimated weights greater than the average (0.25) were considered to have a significant impact on the WQS scores[36].
To address the limitations of the WQS regression model, the qgcomp model was applied, which does not assume direction homogeneity and allows the calculation of both positive and negative weights for each factor in the mixture[37]. The same covariates used in the WQS model were used to adjust for the qgcomp model.
The significance level was set at P < 0.05. All analyses were performed using IBM SPSS Statistics 25 and R software (version 4.3.2). Statistical significance was defined as a two-tailed P value < 0.05.
-
The participants’ characteristics are listed in Table 1. There of 6,754 participants with an average age of 50.83. Significant differences in age, sex, race, educational level, marital status, PIR, drinking status, BMI, total energy intake, and physical activity were noted between the low- and high-risk group for ASCVD, HF, stroke, CHD, and total CVD (Table 1 and Supplementary Table S1; P < 0.05). Therefore, they were considered covariates in the subsequent model analysis.
Characteristics Total
(n = 6,754)Total CVD P ASCVD P Low risk
(n = 3,857)High risk
(n = 2,897)Low risk
(n = 4,683)High risk
(n = 2,071)Age, n (%) < 0.001* < 0.001* ≥ 30 1,703 (25.21)
1,624)1,655 (42.91)
1,624)48 (1.66)
1,624)1,681 (35.90)
1,624)22 (1.06)
1,624)40–50 1,624 (24.05)
1,3801,412 (36.61)
1,380212 (7.32)
1,3801,528 (32.63)
1,38096 (4.64)
1,38050–60 1,380 (20.43) 689 (17.86) 691 (23.85) 1,044 (22.29) 336 (16.22) ≥ 60 2,047 (30.31) 101 (2.62) 1,946 (67.17) 430 (9.18) 1,617 (78.08) Gender, n (%) < 0.001* < 0.001* Male 3,393 (50.24) 1,753 (45.45) 1,640 (56.61) 2,180 (46.55) 1,213 (58.57) Female 3,361 (49.76) 2,104 (54.55) 1,257 (43.39) 2,503 (53.45) 858 (41.43) Race/ethnicity, n (%) < 0.001* < 0.001* Mexican American 1,149 (17.01) 697 (18.07) 452 (15.60) 817 (17.45) 332 (16.03) Other Hispanic 538 (7.97) 295 (7.65) 243 (8.39) 363 (7.75) 175 (8.45) Non-Hispanic white 3,207 (47.48) 1,819 (47.16) 1,388 (47.91) 2,227 (47.55) 980 (47.32) Non-Hispanic black 1,335 (19.77) 699 (18.12) 636 (21.95) 880 (18.79) 455 (21.97) Other race 525 (7.77) 347 (9.00) 178 (6.14) 396 (8.46) 129 (6.23) Education level, n (%) < 0.001* < 0.001* Less than high school 1,574 (23.30) 747 (19.37) 827 (28.55) 942 (20.12) 632 (30.52) High School or equivalent 1,569 (23.23) 865 (22.43) 704 (24.30) 1,048 (22.38) 521 (25.16) Some College or AA degree 1,853 (27.44) 1,098 (28.47) 755 (26.06) 1,330 (28.40) 523 (25.25) College Graduate or above 1,758 (26.03) 1,147 (29.74) 611 (21.09) 1,363 (29.11) 395 (19.07) Marital status, n (%) < 0.001* < 0.001* Married 4,117 (60.96) 2,379 (61.68) 1,738 (59.99) 2,886 (61.63) 1,231 (59.44) Living with partner 428 (6.34) 328 (8.50) 100 (3.45) 366 (7.82) 62 (2.99) Living alone 2,209 (32.71) 1,150 (29.82) 1,059 (36.56) 1,431 (30.56) 778 (37.57) PIR, (mean ± SD) 2.78 ± 1.65 2.86 ± 1.67 2.67 ± 1.62 < 0.001* 2.88 ± 1.68 2.55 ± 1.56 < 0.001* Serum cotinine a n (%) 0.513 0.179 Low 1,747 (25.87) 986 (25.56) 761 (26.27) 1,189 (25.39) 558 (26.94) High 5,007 (74.13) 2,871 (74.44) 2,136 (73.73) 3,494 (74.61) 1,513 (73.06) Drinking status, n (%) < 0.001* < 0.001* No 1,844 (27.30) 971 (25.18) 873 (30.13) 1,202 (25.67) 642 (31.00) Yes 4,910 (72.70) 2,886 (74.82) 2,024 (69.87) 3,481 (74.33) 1,429 (69.00) BMI, kg/m2, n (%) < 0.001* < 0.001* < 25 1,794 (26.56) 1,168 (30.28) 626 (21.61) 1,366 (29.17) 428 (20.67) 25–30 2,383 (35.28) 1,329 (34.46) 1,054 (36.38) 1,,614 (34.47) 769 (37.13) ≥ 30 2,577 (38.16) 1,360 (35.26) 1,217 (42.01) 1,703 (36.37) 874 (42.20) Total energy intake, n (%) < 0.001* < 0.001* Low 2,688 (39.80) 1,305 (33.83) 1,383 (47.74) 1,637 (34.96) 1,051 (50.75) Adequate 2,531 (37.47) 1,493 (38.71) 1,038 (35.83) 1,799 (38.42) 732 (35.35) High 1,535 (22.73) 1,059 (27.46) 476 (16.43) 1,247 (26.63) 288 (13.91) Physical Activity, n (%) < 0.001* < 0.001* Mild 2,548 (37.73) 1,287 (33.37) 1,261 (43.53) 1,612 (34.42) 936 (45.20) Moderate or vigorous 4,206 (62.27) 2,570 (66.63) 1,636 (56.47) 3,071 (65.58) 1,135 (54.80) Note. NHANES: National Health and Nutrition Examination Survey; PIR: poverty-to-income ratio; BMI: body mass index; SD: standard deviation; n: numbers of subjects; %: weighted percentage. aReflects smoking and exposure to secondhand smoke in study population. *P < 0.05. Table 1. Characteristics of participants based on total CVD and ASCVD risk in US adults, NHANES 2001–2016
-
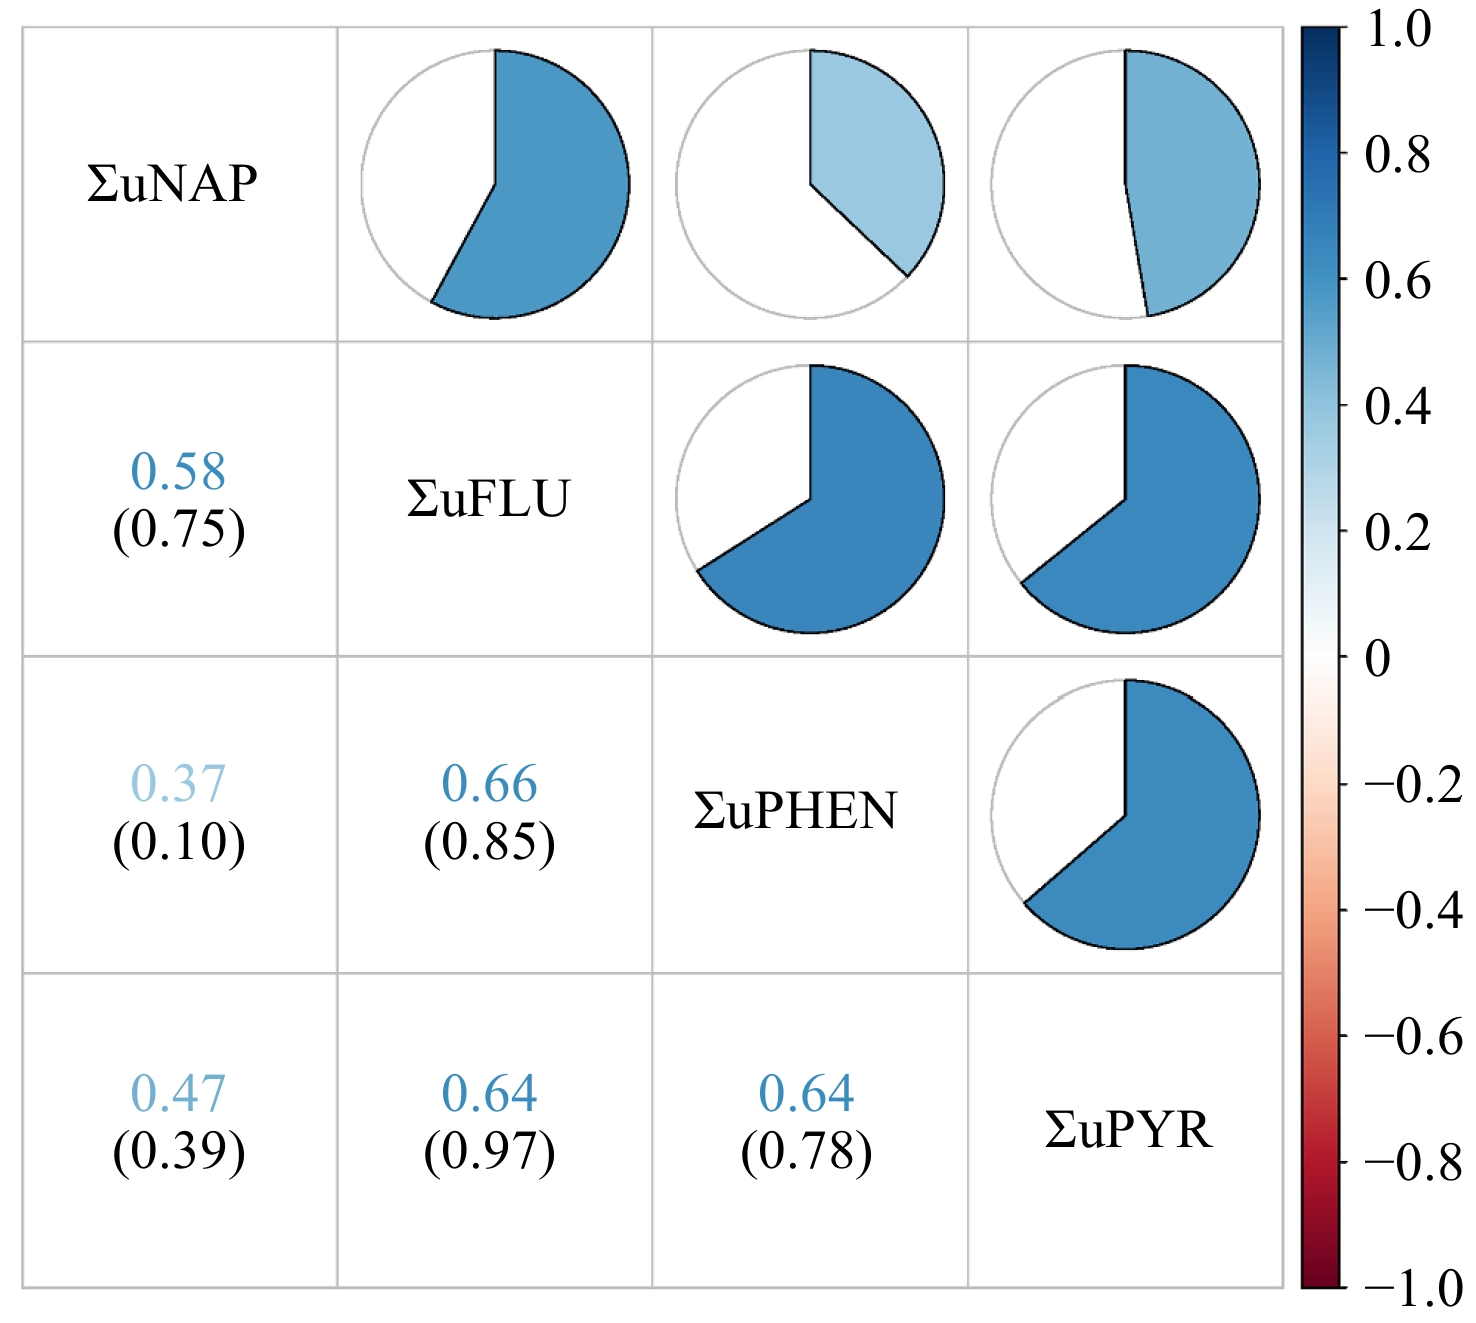
The distributions of urinary OH-PAH and its metabolites were in Supplementary Table 2, which showed that the ΣuNAP concentration was the highest among all PAH metabolites. The correlation plots for six individual urinary OH-PAHs and four groups of classified OH-PAHs metabolites are shown in Figure 2 and Supplementary Figure S1. A robust positive correlation was observed between urinary 2-FLU and 3-FLU levels (r = 0.94). We didn’t observe a statistically significant correlation among ΣuNAP, ΣuFLU, ΣuPHEN, and ΣuPYR.
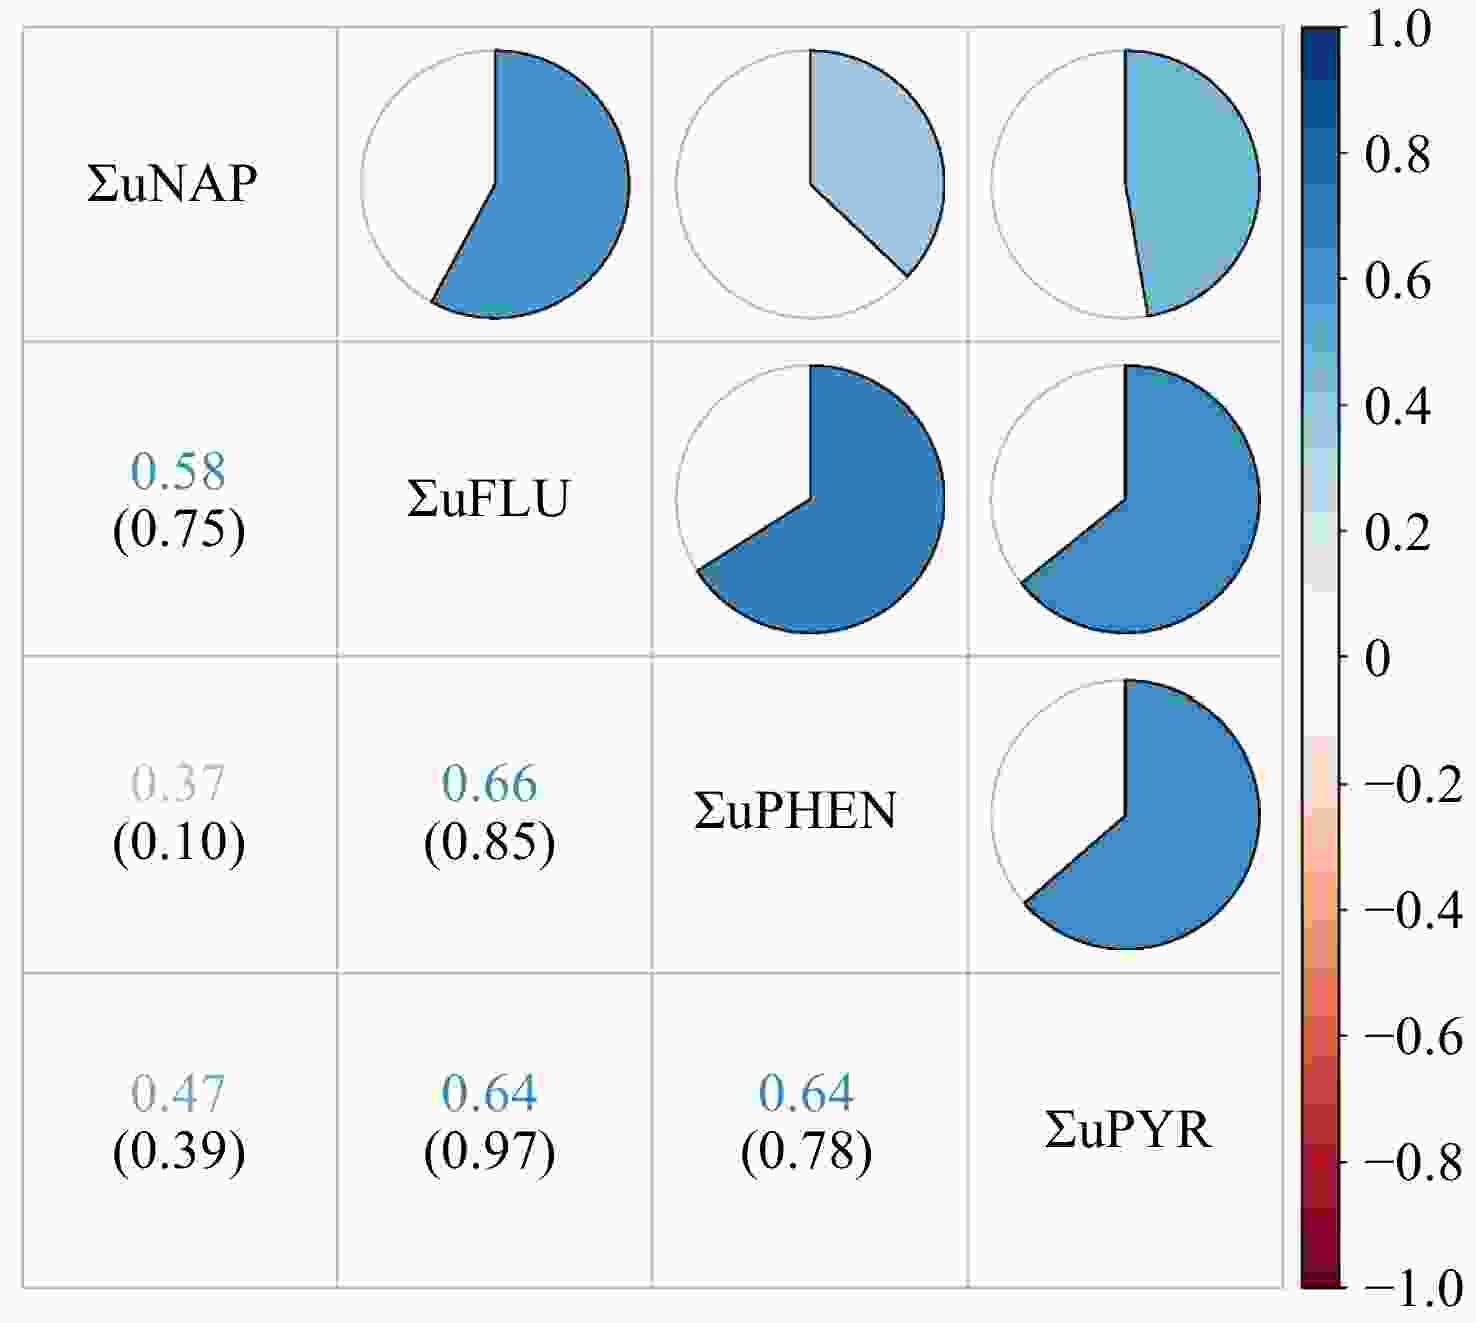
Figure 2. Pearson correlations between urinary OH-PAH levels (ng/g creatinine). Numbers in the figure represent correlation coefficients (upper row) and their corresponding P-values (lower row). The heat map of the correlation coefficients between urinary OH-PAHs concentrations is shown in the upper right part. White represents a null correlation, blue represents a positive correlation, and red represents a negative correlation. The darker the color, the greater the correlation coefficient. ΣuNAP: sum of urinary NAP metabolites (1- and 2-NAP), ΣuFLU: sum of urinary FLU metabolites (2- and 3-FLU), ΣuPHEN: urinary phenanthrene metabolites (1-PHE), ΣuPYR: urinary pyrene metabolites (1-PYR).
-
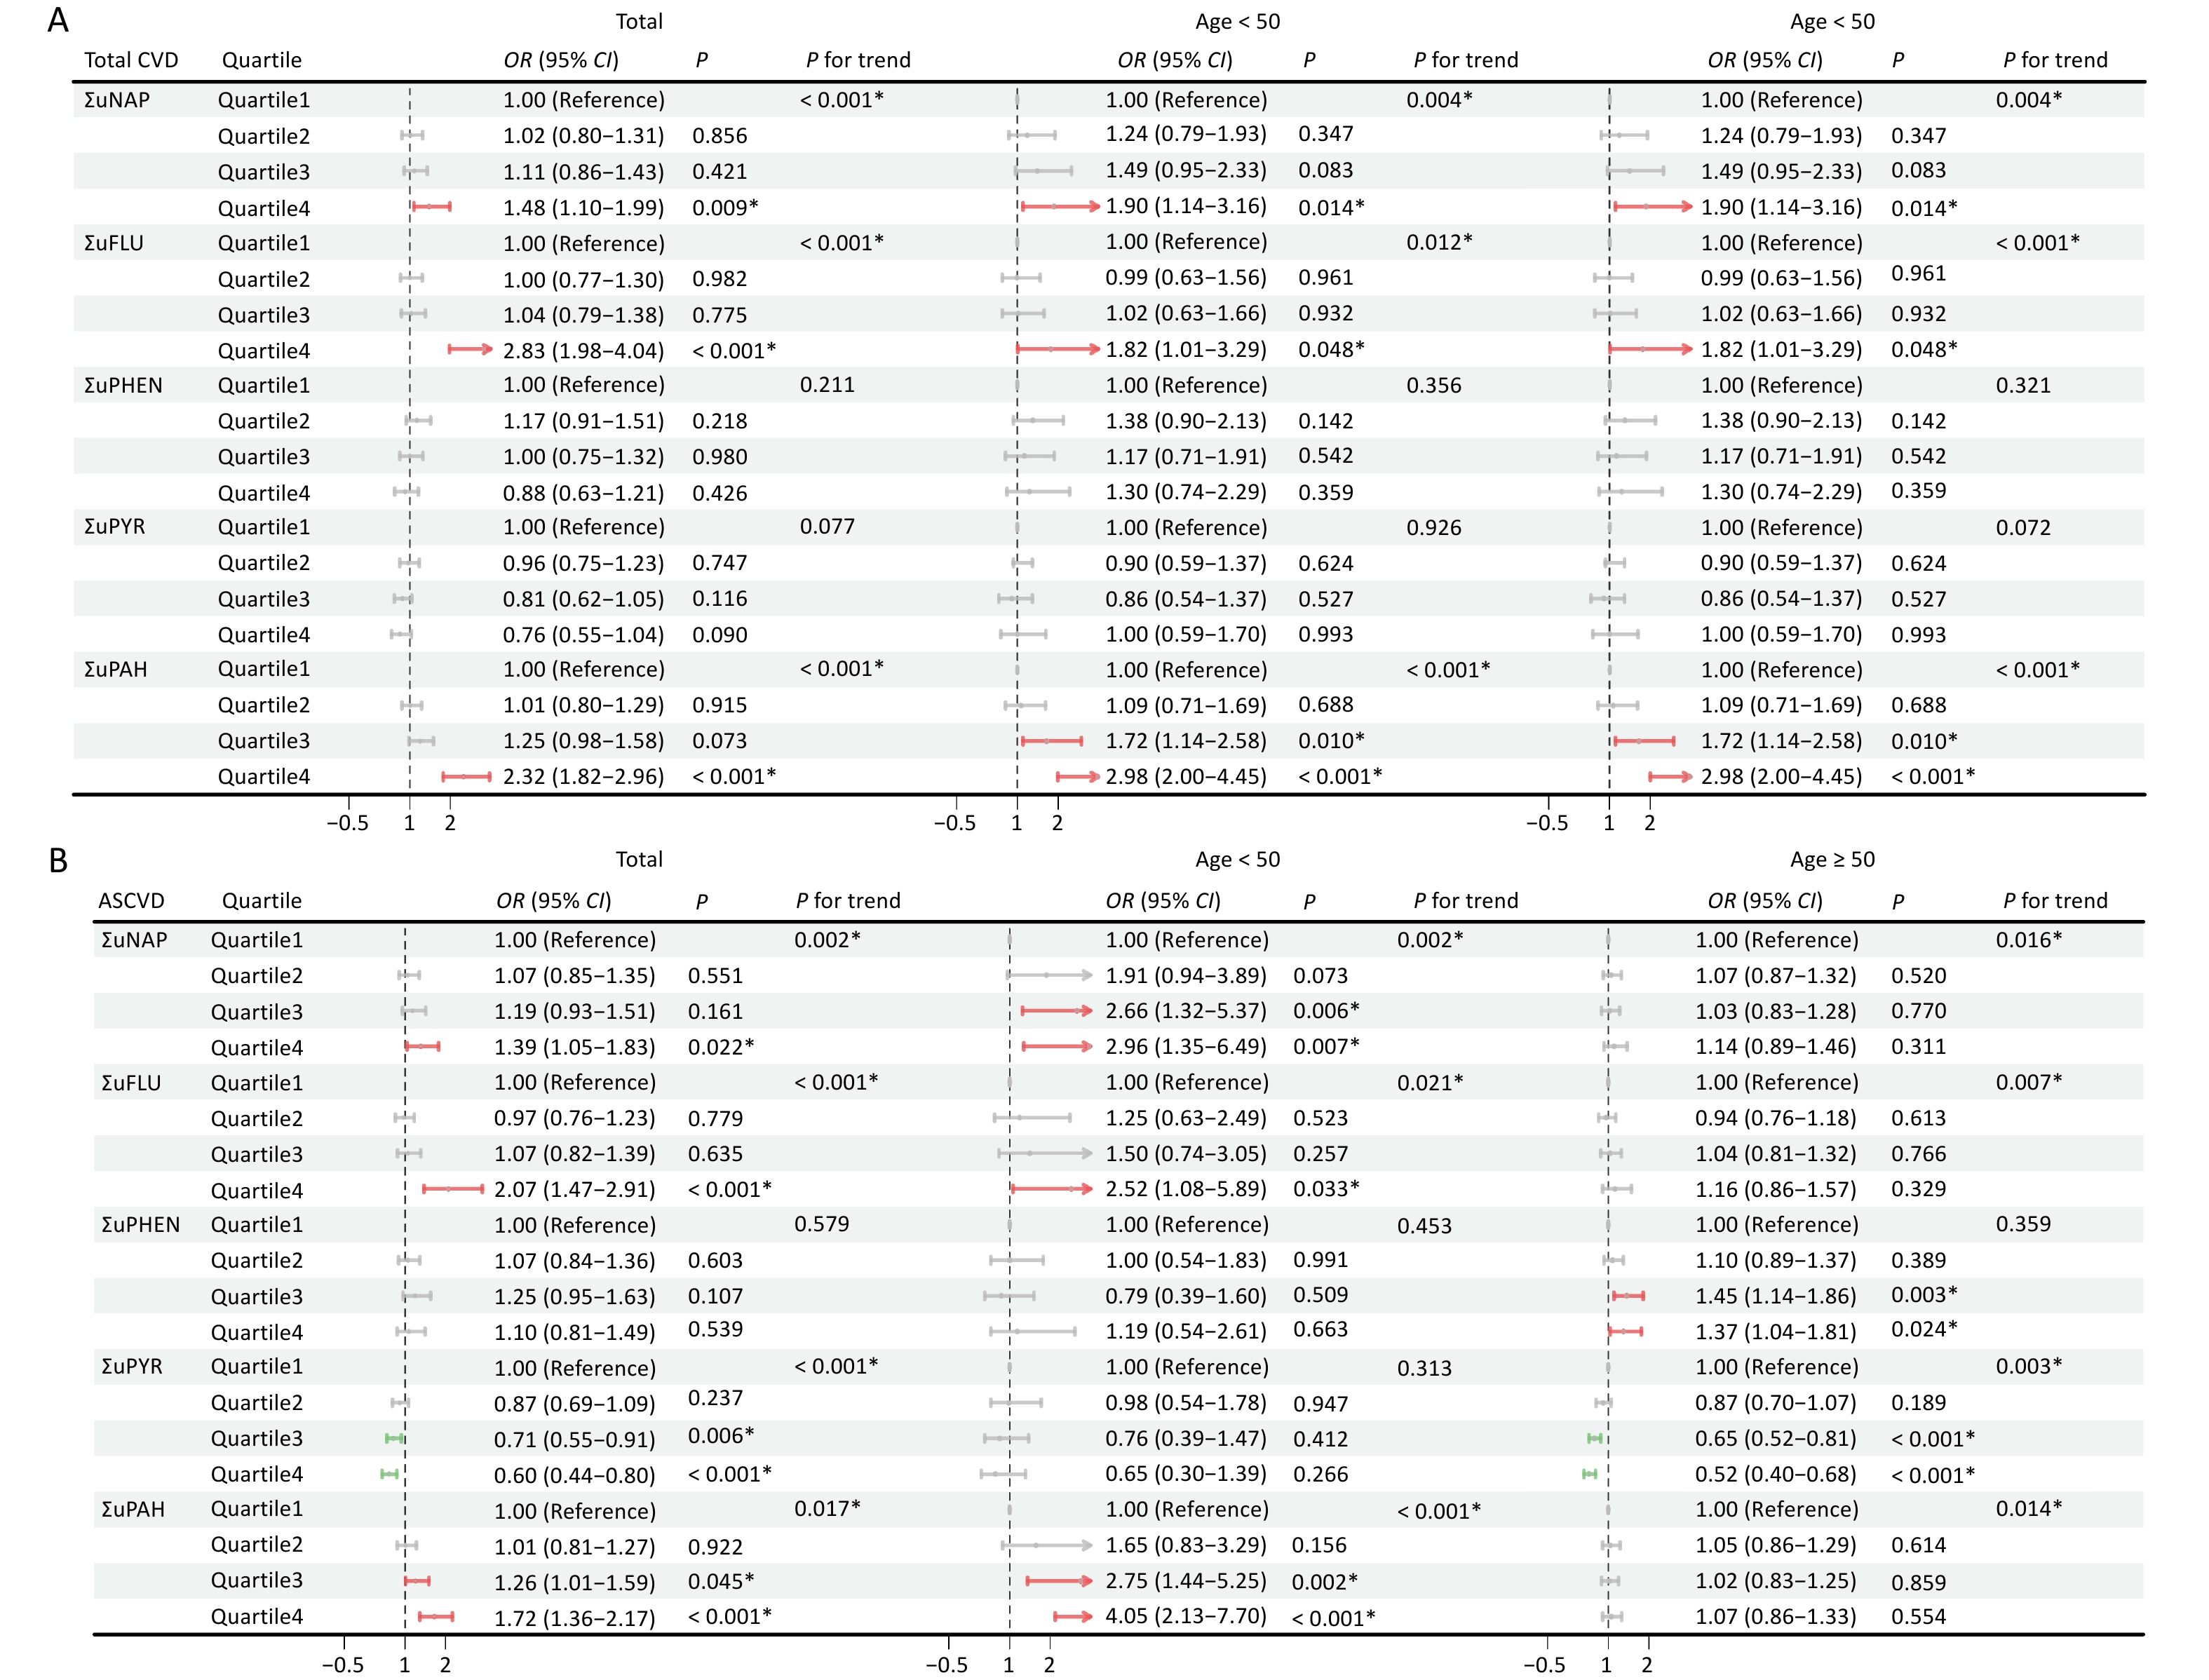
The results of the multivariate logistic regression analysis are summarized in Figure 3 and Supplementary Figure S2. Urinary OH-PAHS and their metabolites were divided into quartiles. Overall, the risk of total CVD, ASCVD and HF were positively correlated with PAHs exposure, among them ΣuNAP and ΣuFLU may be the major contributors, however, PAHs metabolites had different effects on different types of CVD. Compared to Quartile 1, Quartile 4 of ΣuPAHS showed 2.32-fold increased risk of total CVD, Quartile3 or 4 of ΣuPAHS showed 1.26- or 1.72-fold and 1.42- or 1.82-fold increased risk of ASCVD and HF, respectively. Significantly positive associations with total CVD and ASCVD were also observed in Quartile4 of ΣuNAP and ΣuFLU, HF in Quartile 3–4 of ΣuNAP, Quartile 4 of ΣuFLU and Quartile 3 of ΣuPHEN, and CHD in Quartile 4 of ΣuFLU. After adjusting for the covariates, the results remained statistically significant. The Total CVD risk showed an increasing trend with the progressive elevation of ΣuNAP, ΣuFLU and ΣuPAHs (P < 0.001).
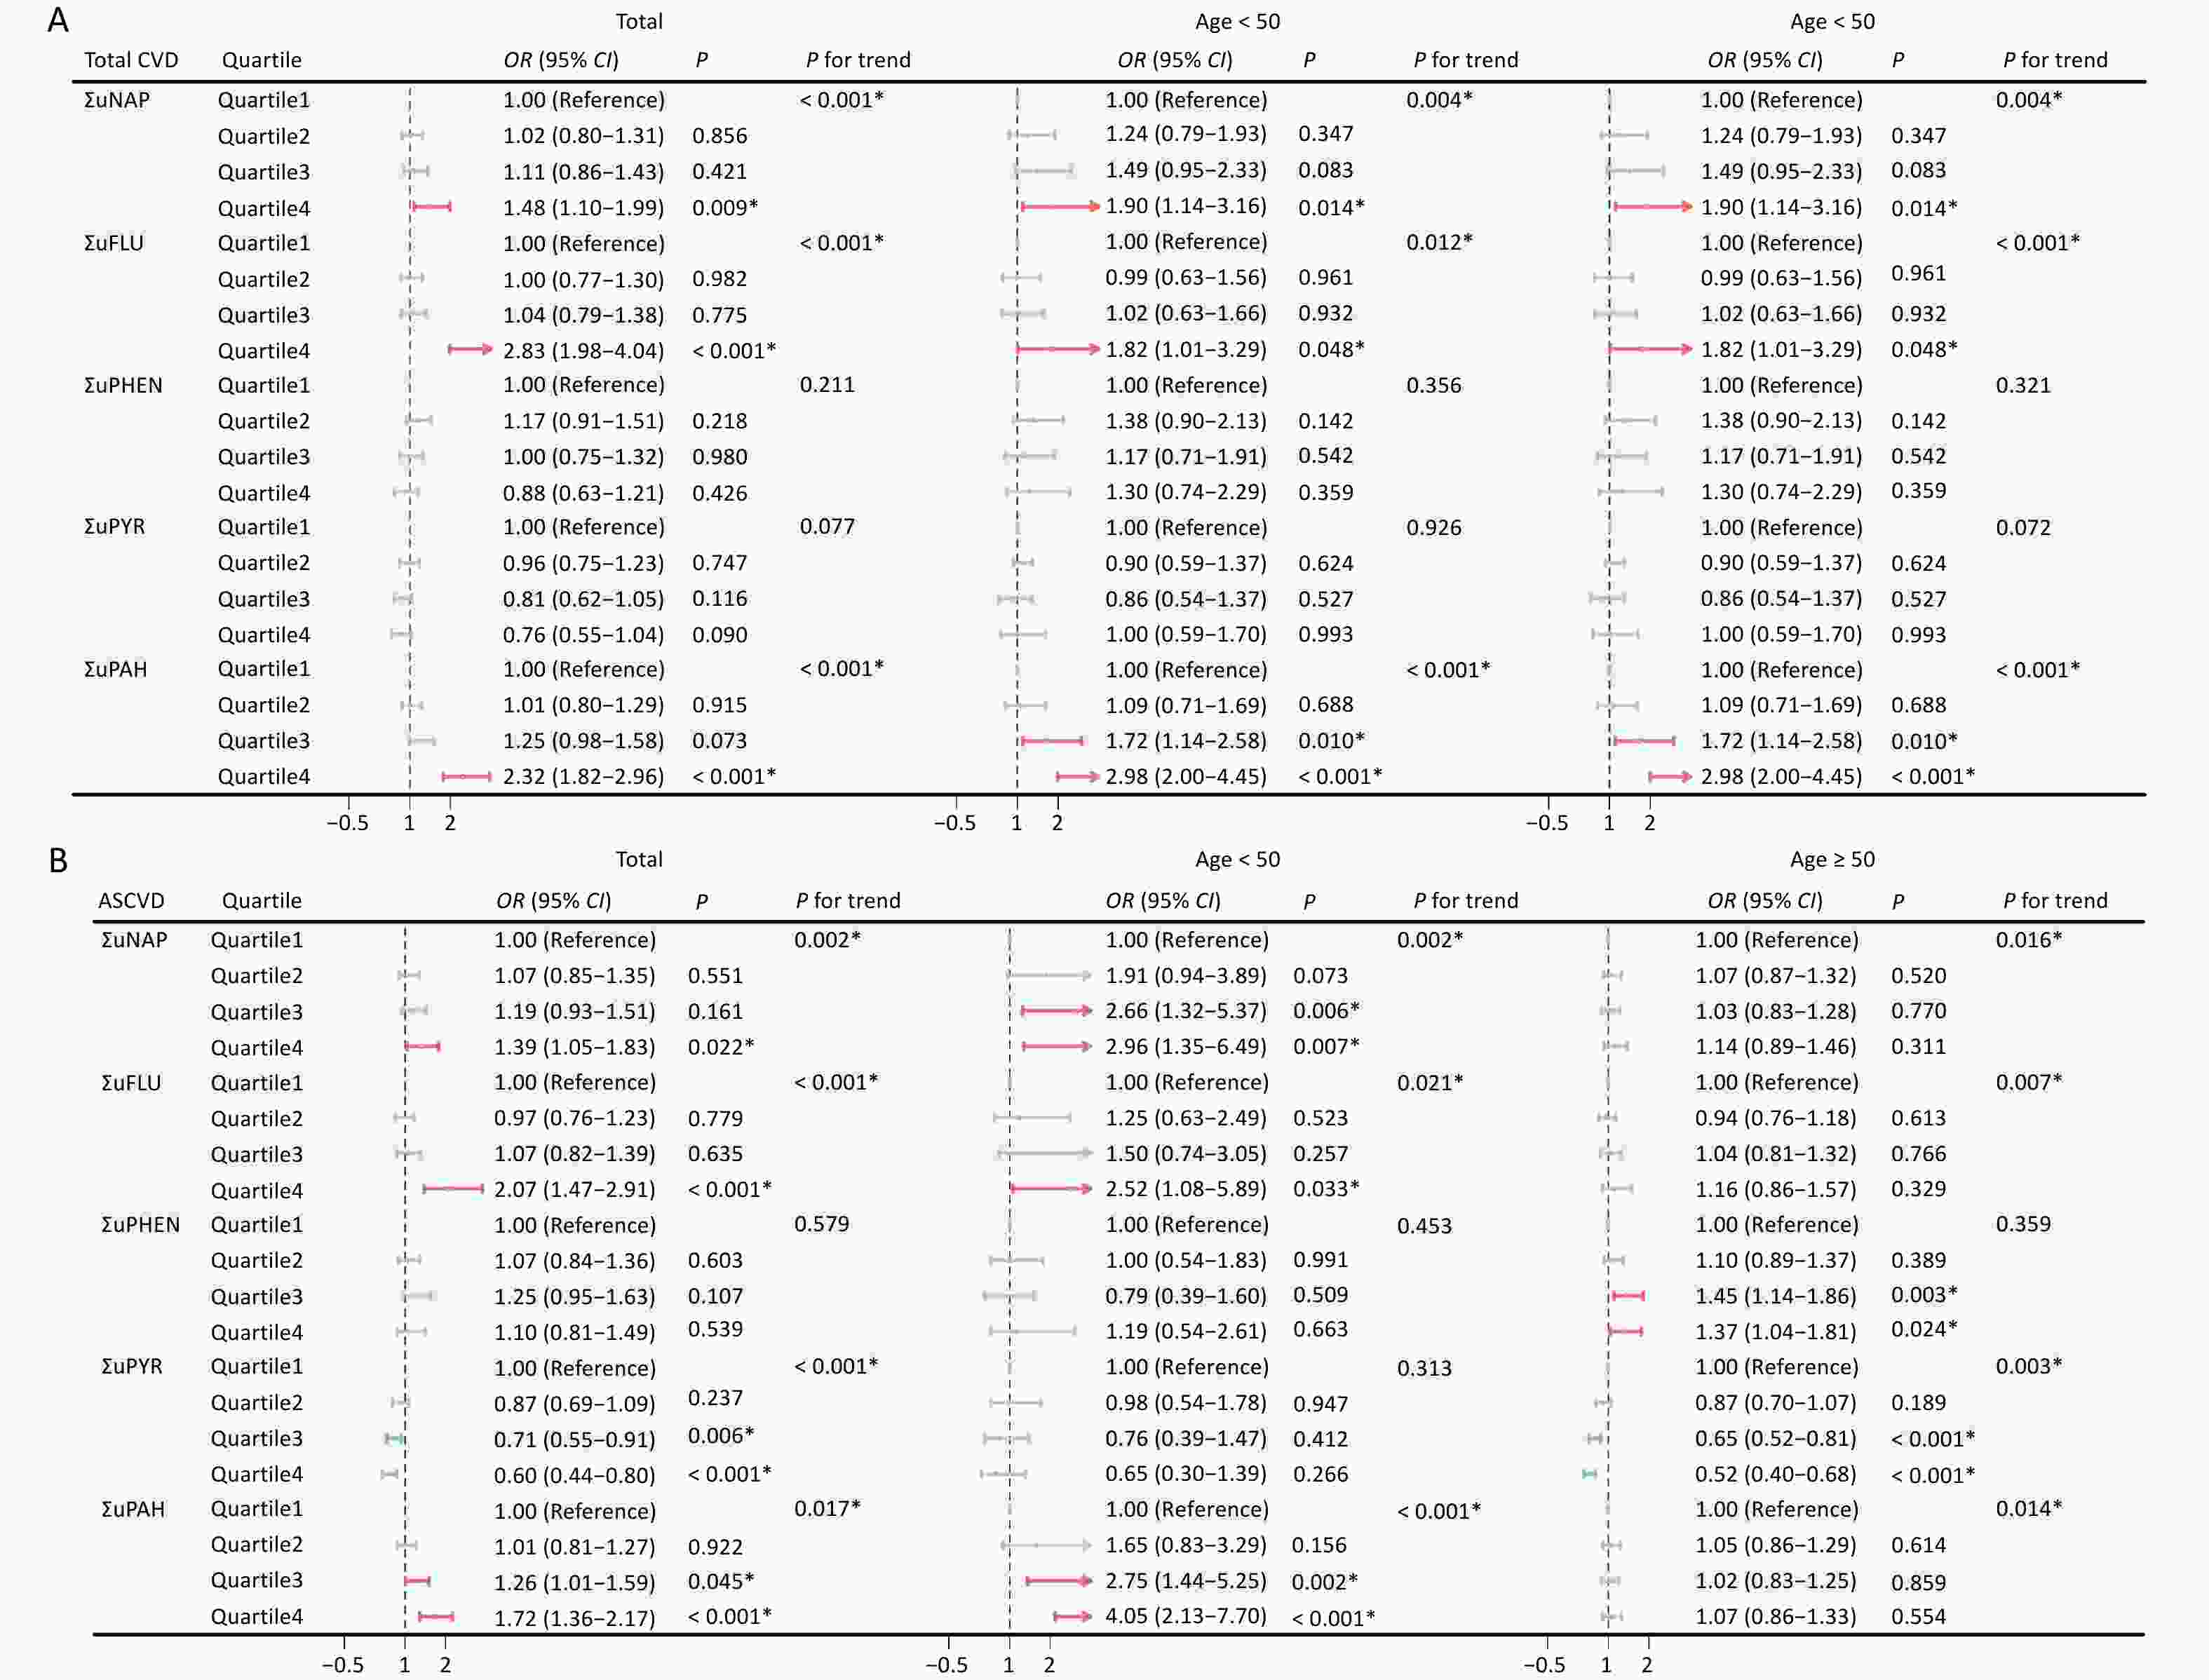
Figure 3. Association between urinary OH-PAHs and the risk of total CVD (A) and ASCVD (B) in total population and subgroups. Models were adjusted based on age, race, sex, BMI, marital status, education level, poverty income ratio, serum cotinine, drinking status, total energy intake, and physical activity. *P < 0.05. ΣuNAP: sum of urinary NAP metabolites (1- and 2-NAP), ΣuFLU: sum of urinary FLU metabolites (2- and 3-FLU), ΣuPHEN: urinary phenanthrene metabolites (1-PHE), ΣuPYR: urinary pyrene metabolites (1-PYR). ΣuPAHS: sum of urinary PAHS metabolites (1- and 2-NAP, 2- and 3-FLU, 1-PHE, and 1-PYR).
In younger participants (30 ≤ age < 50), the effects of ΣuNAP, ΣuFLU and ΣuPAHS on the total CVD, ASCVD and HF, ΣuFLU on stroke, and ΣuPAHS on CHD were noticeable, whereas the effects of ΣuPHEN on ASCVD, HF, CHD and stroke were dominant in aging participants (age ≥ 50). In addition, significant positive impact of ΣuFLU on total CVD were observed both in younger and aging participants.
Notably, Quartile 3–4 of ΣuPYR was noted to be negatively associated with the risk of total CVD, ASCVD, HF, CHD, and stroke. Similarly, the negative associations of ΣuPYR with four CVD subtypes were noticeable in aging participants (aged ≥ 50 years), and negative impact of ΣuFLU on HF was also noted in younger and aging participants.
-
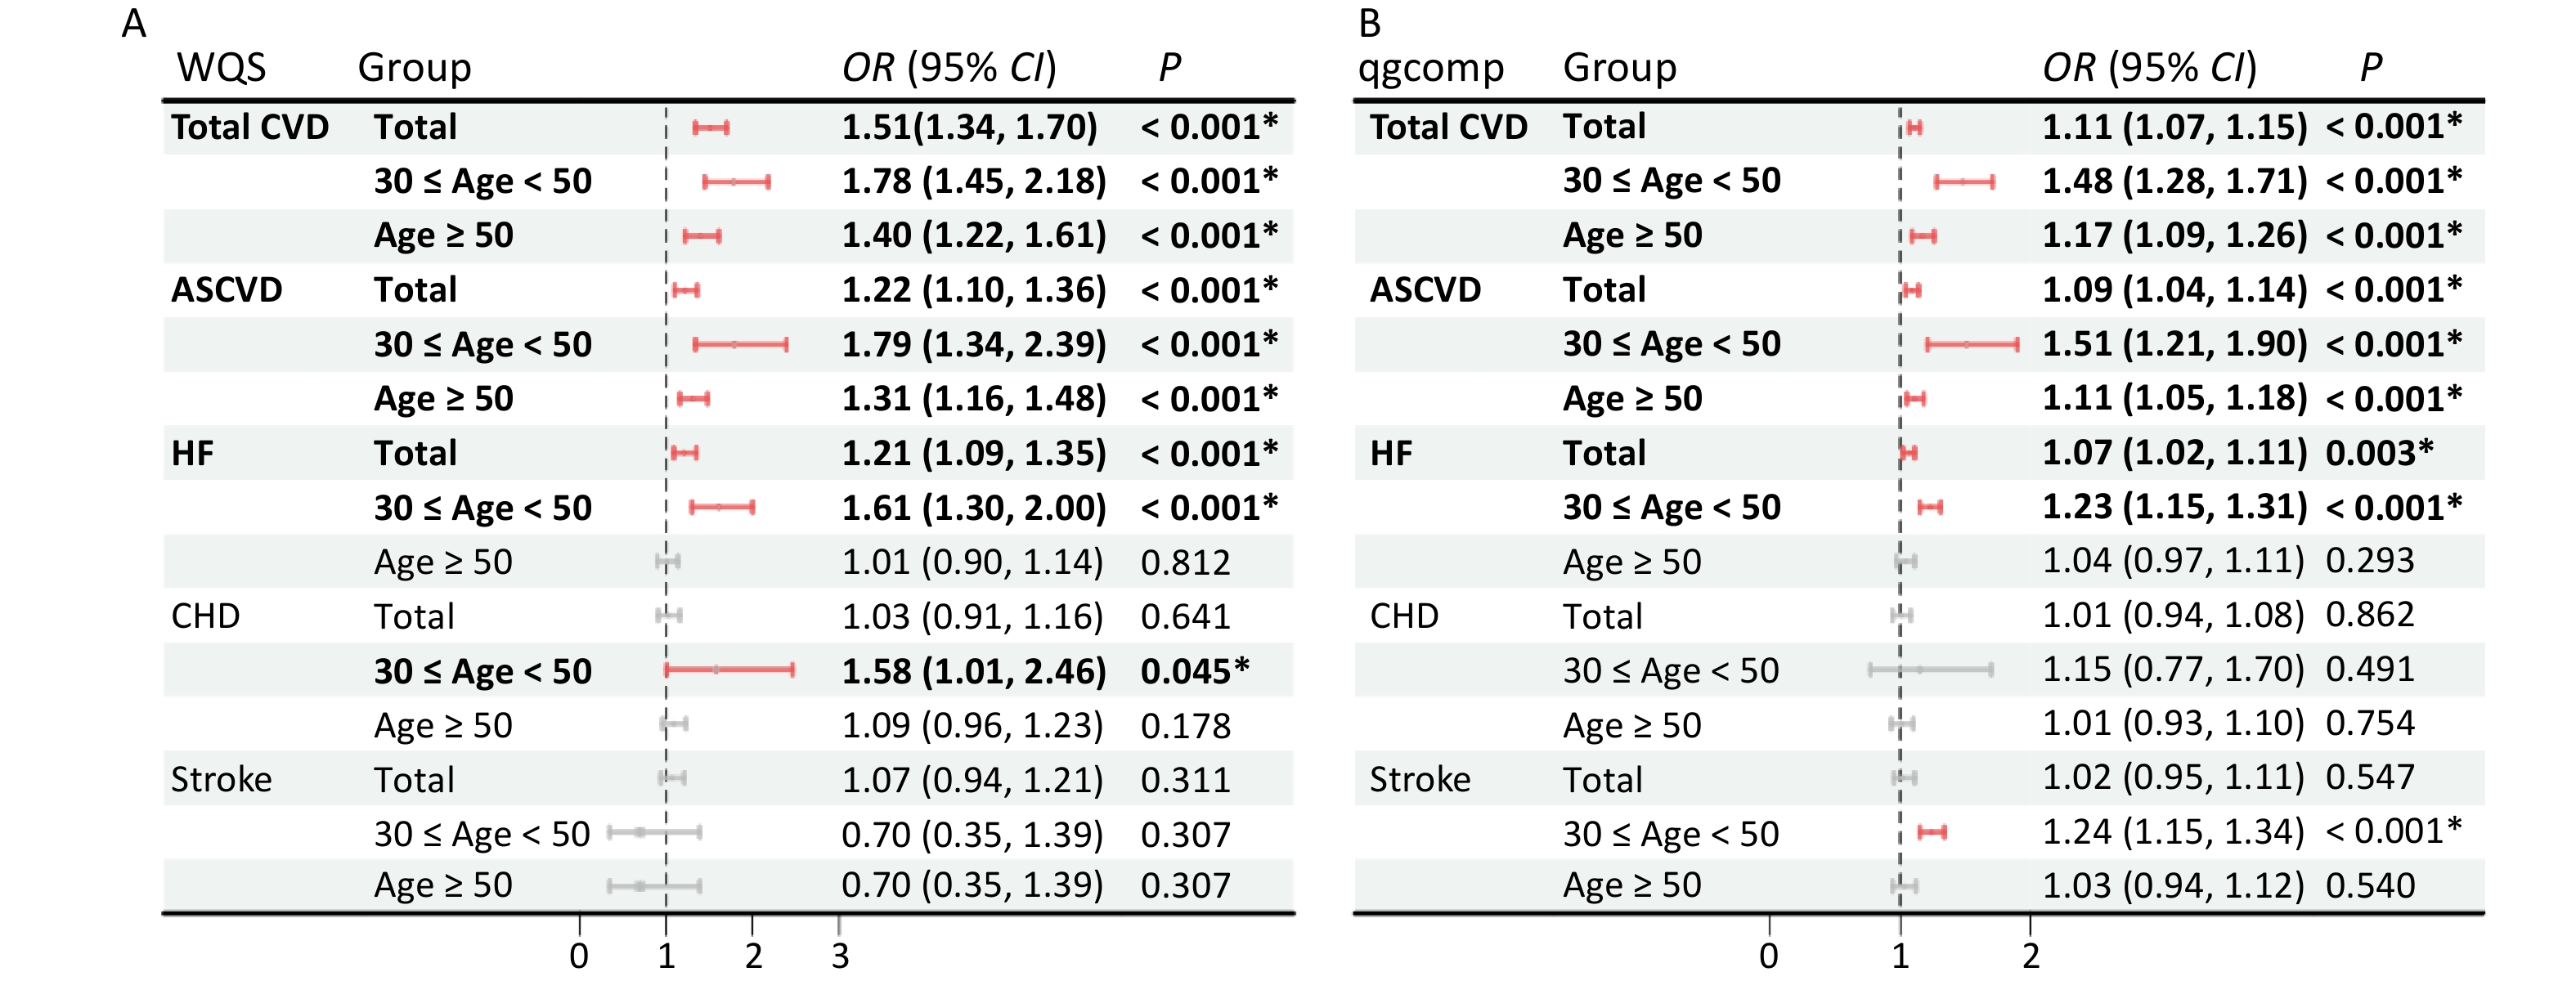
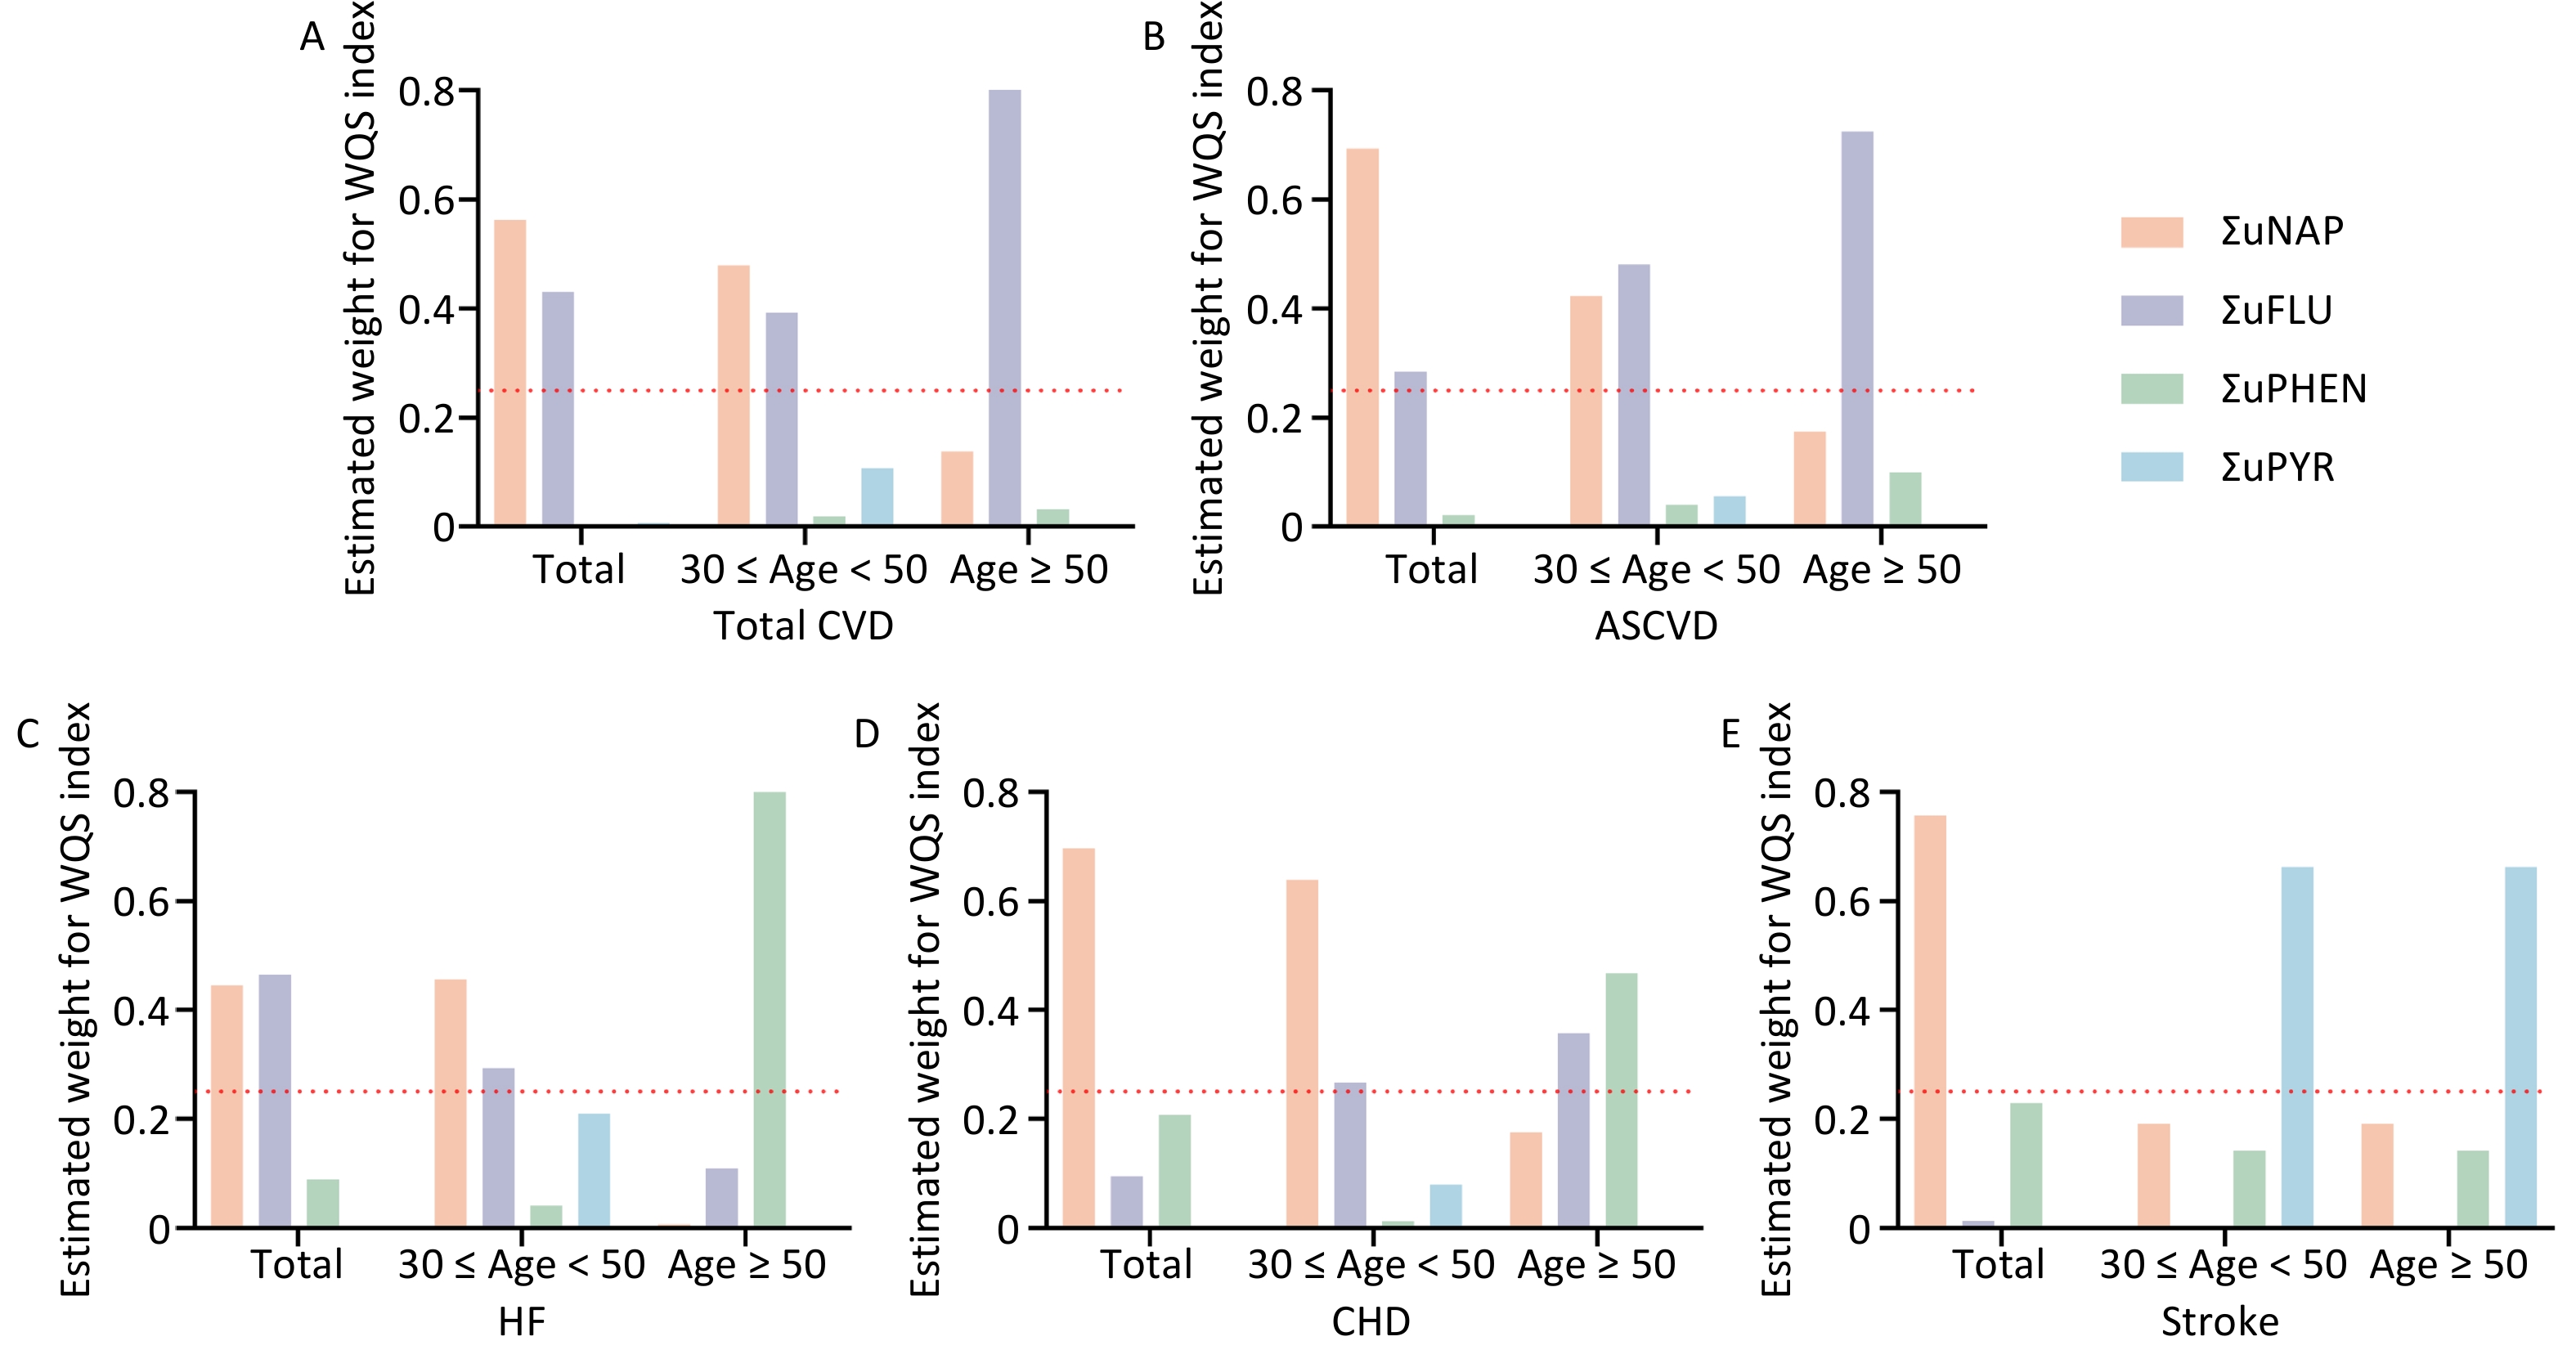
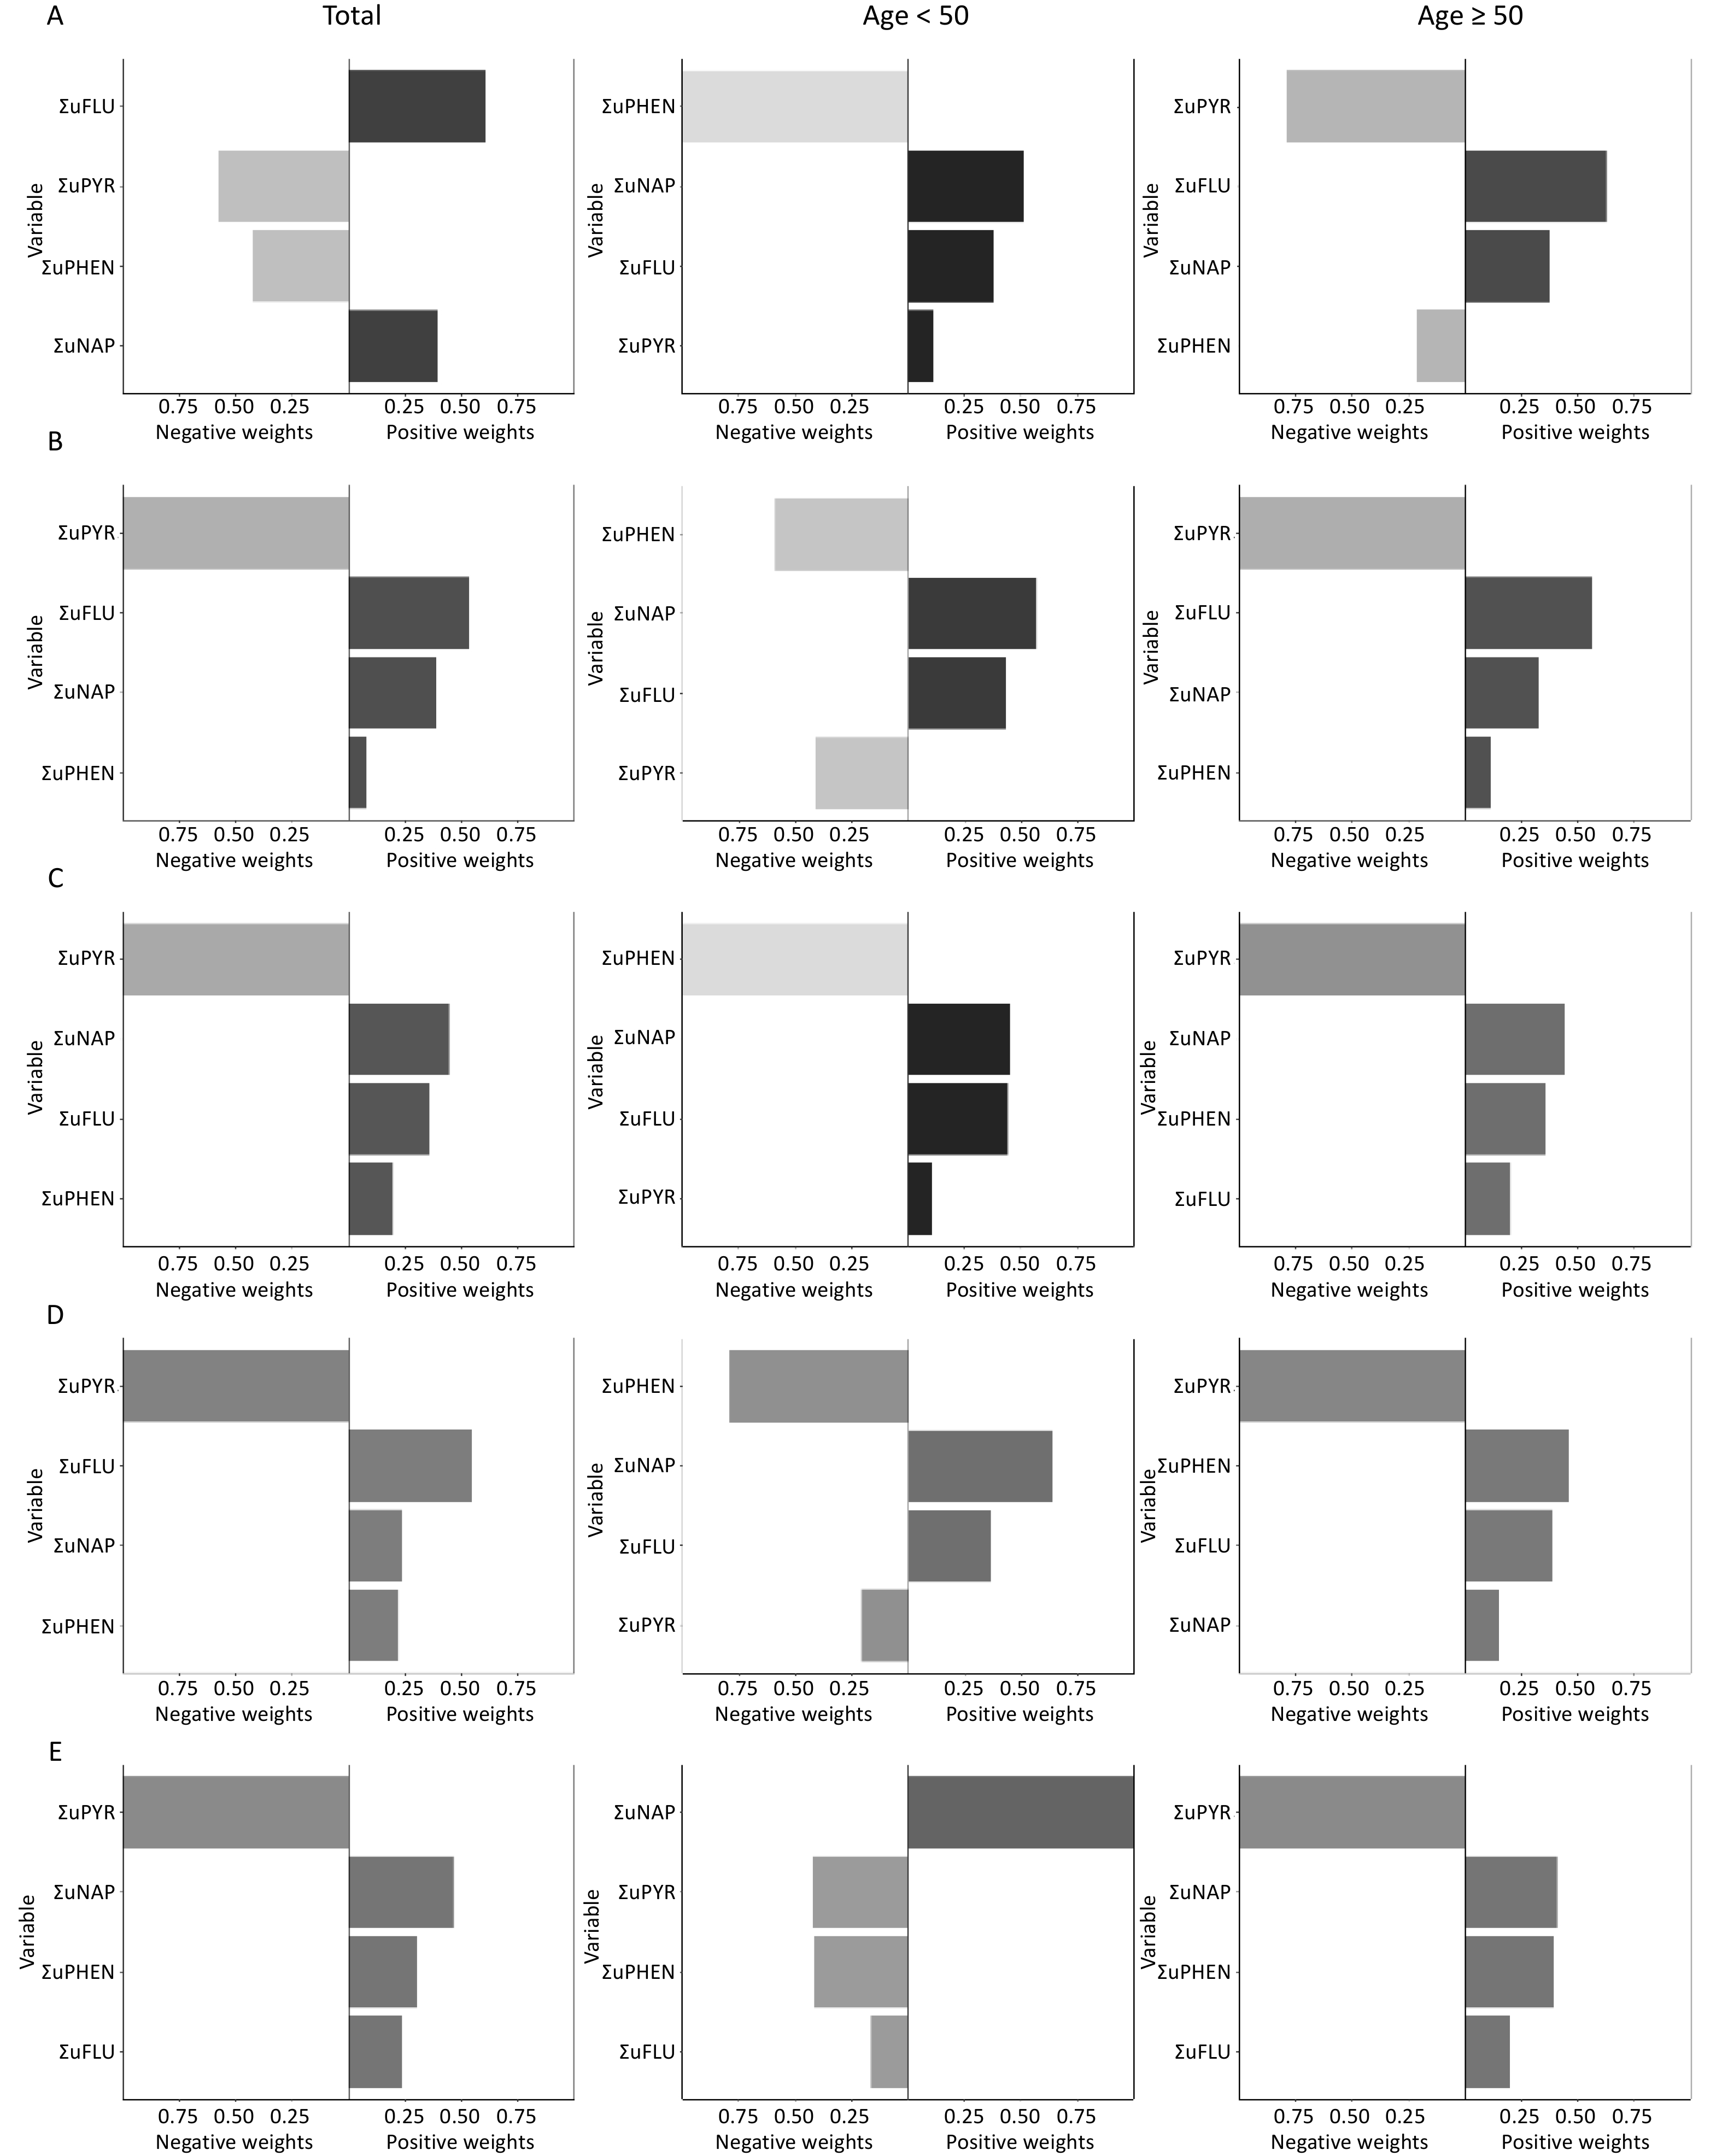
Multiple polycyclic aromatic hydrocarbons are multiple PAHs in the environment at the same time. The total effect of this combined exposure should be studied further; therefore, the WQS model was used to investigate the link between urinary OH-PAHs co-exposure and the risk of CVD (Figure 4). The coefficient for the mixture index in the WQS model was significantly positively associated with the risk of total CVD and ASCVD in total (1.51, 1.22), younger (1.78, 1.79), and aging participants (1.4, 1.31); similar associations of HF were noted in total (OR: 1.21, 95% CI: 1.09, 1.35) and younger participants (OR: 1.61, 95% CI: 1.30, 2.00), which indicated that the positive associations were more significant in younger participants (Figure 4A). As the overall mixture effect was statistically significant, individual PAHS weights could be interpreted as variable importance factors. Regarding the risk of total CVD, ASCVD and HF, the estimated weights of ΣuNAP (weight = 0.56, weight = 0.69, weight = 0.45) and ΣuFLU (weight = 0.43, weight = 0.29, weight = 0.46) were more than 0.25 (Figure 5), which indicated that NAP and FLU were the most significant contributors to the mixture effect, with their homologues explaining more than 90% of the total weights. In different age groups, ΣuFLU showed a higher weight in elderly groups in total CVD (weight = 0.83) and ASCVD (weight = 0.73).
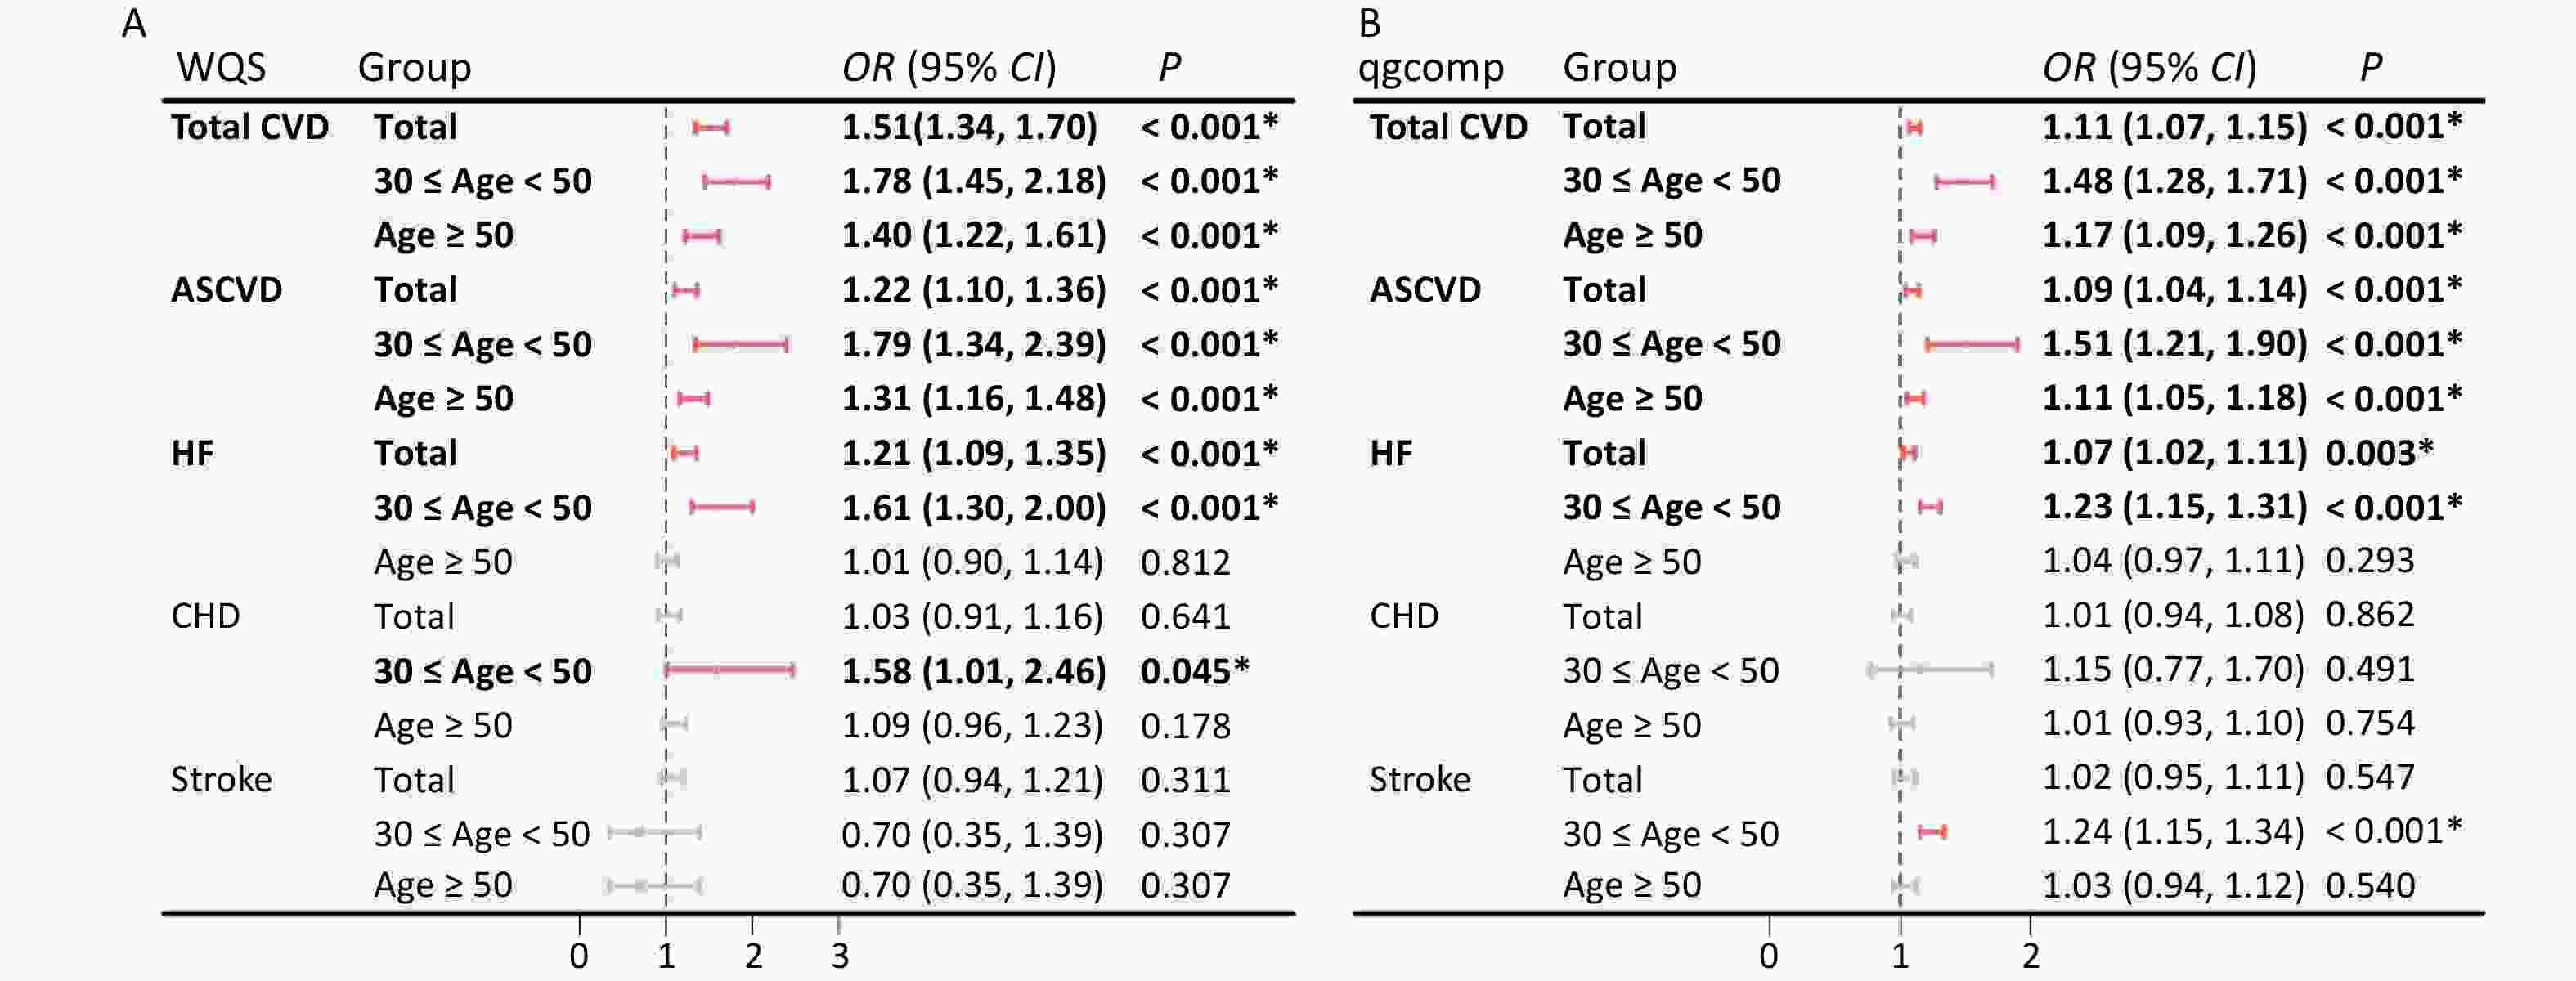
Figure 4. Odds ratios (95% CI) of CVD risk associated with urinary OH-PAH mixtures determined using WQS (A) and qgcomp (B) analyses. Models were adjusted for age, race, sex, BMI, marital status, education level, poverty income ratio, serum cotinine, drinking status, total energy intake, and physical activity.
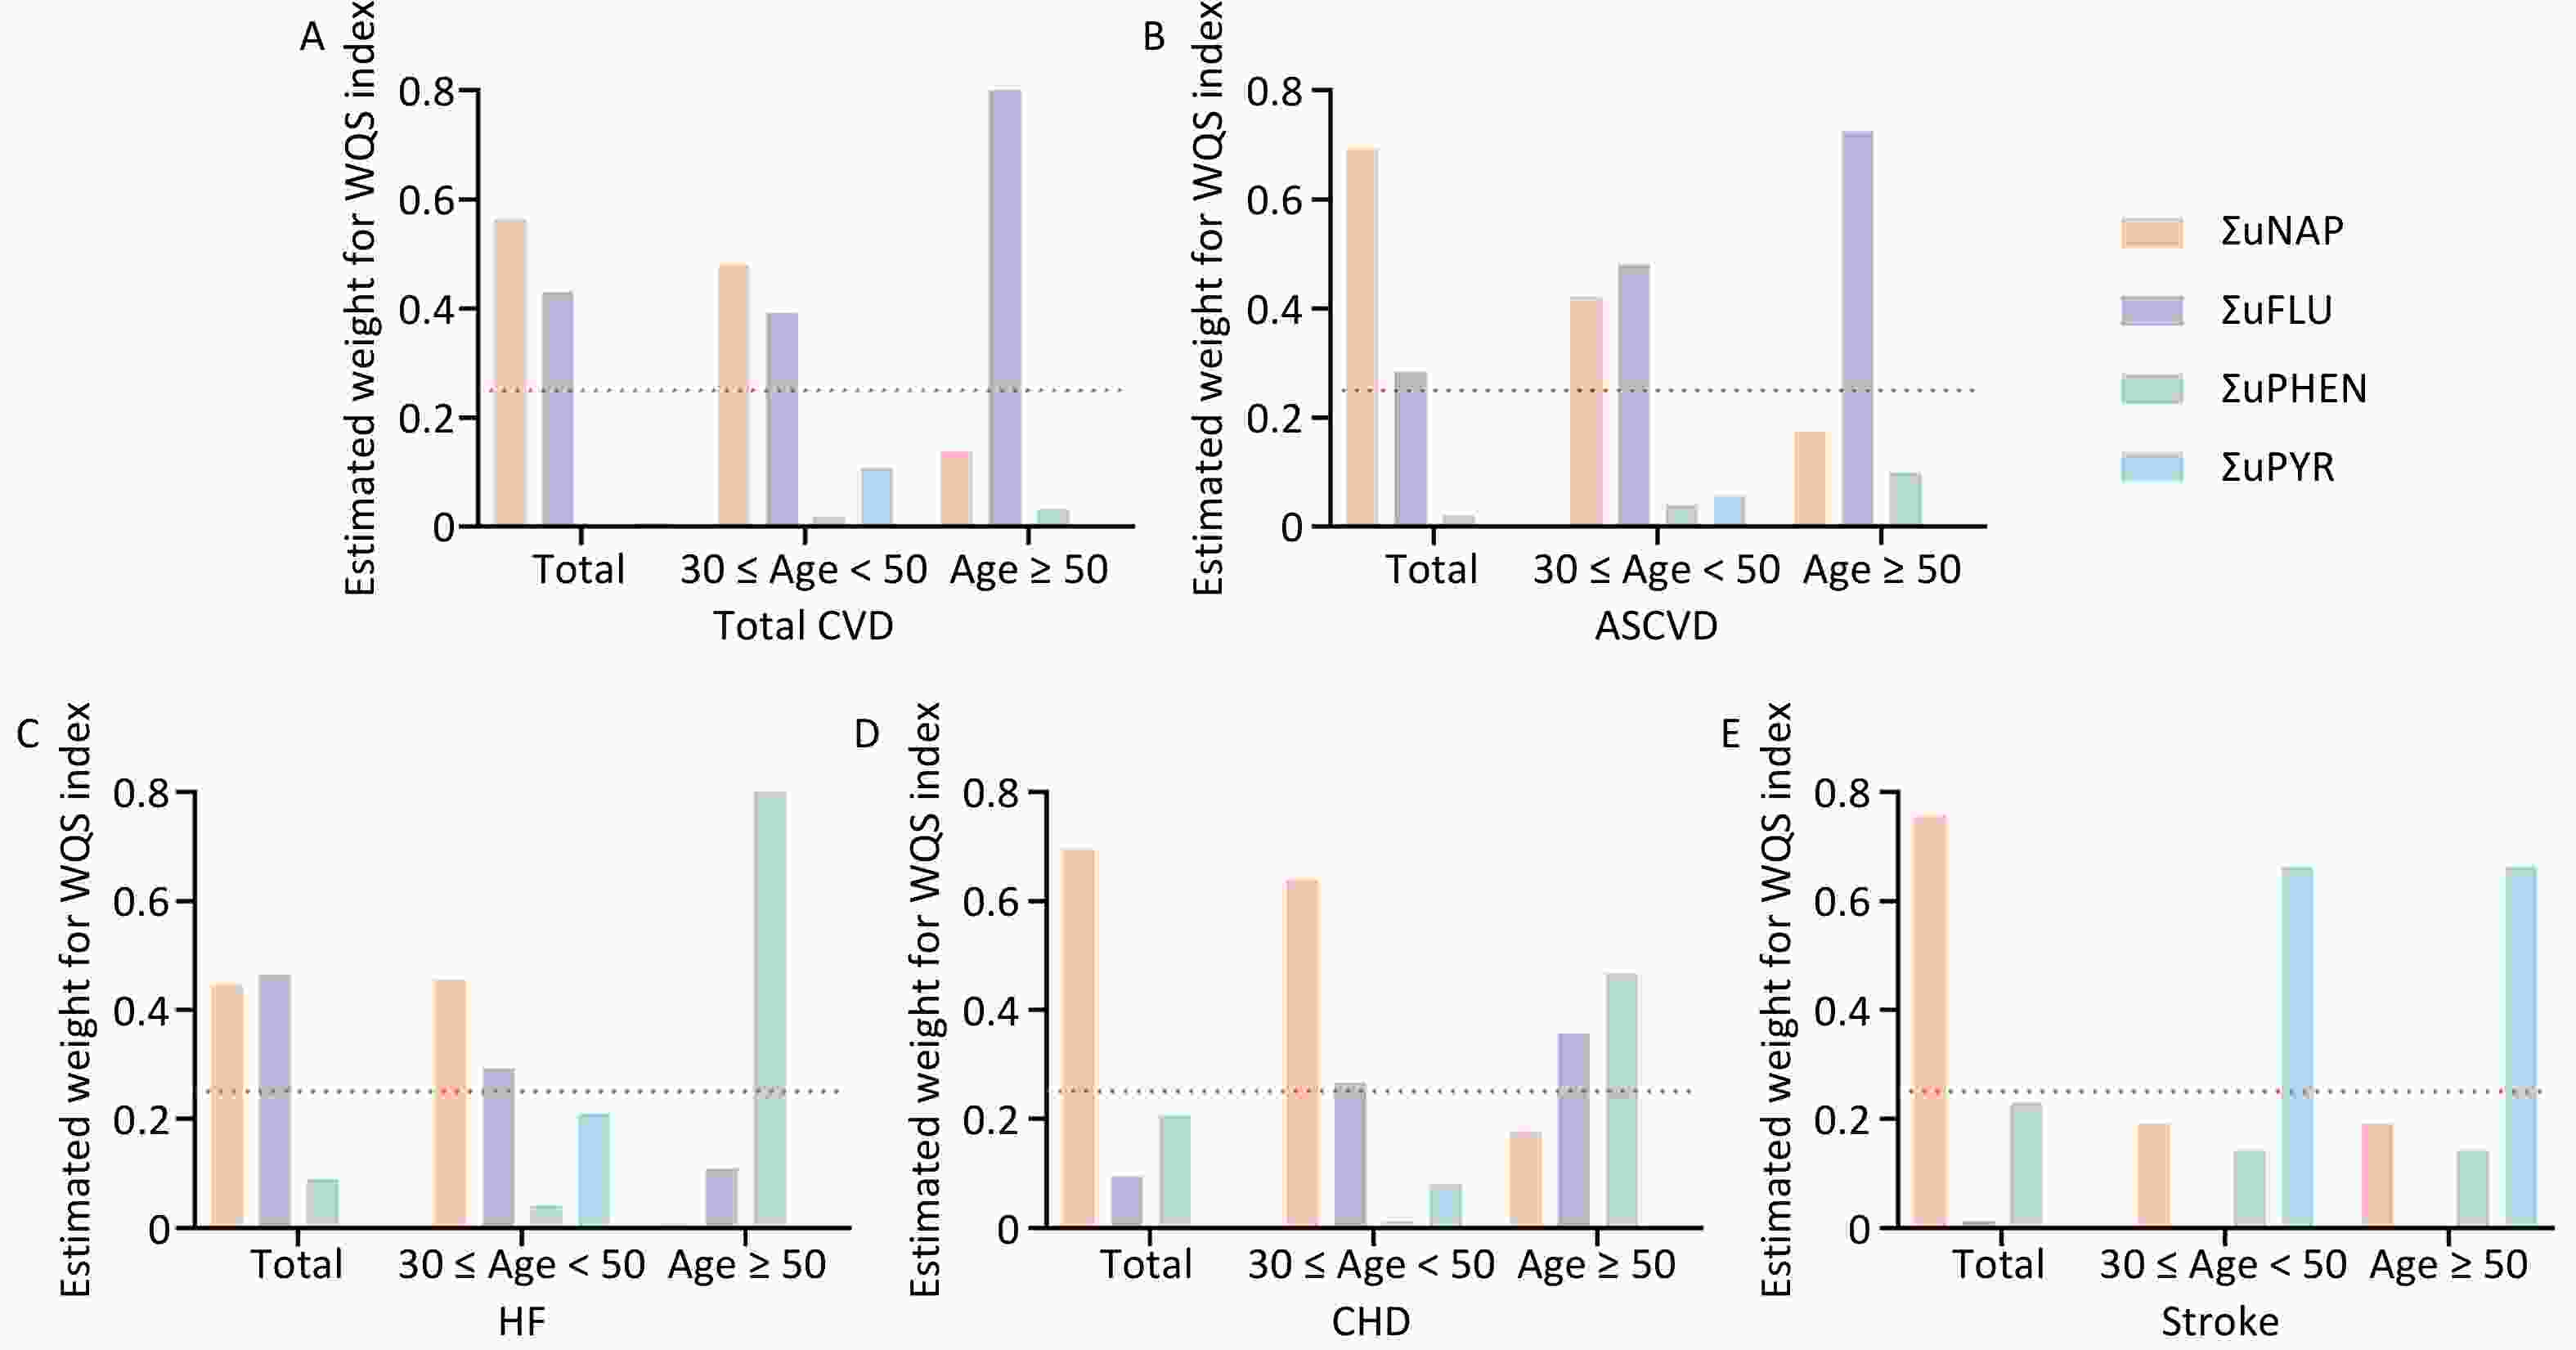
Figure 5. Weighted values of urinary OH-PAHs for CVD risk determine dusing WQS models in total population and subgroups. Urinary OH-PAHs mixture on Total CVD (A), ASCVD (B), HF (C), CHD (D), and stroke (E).
-
Similarly, the qgcomp analysis also showed an increase of all urinary OH-PAHs levels per quantile was associated with the risk of Total CVD and ASCVD in all group ages, and HF in total (OR: 1.07, 95% CI: 1.02, 1.11) and younger (OR: 1.23, 95% CI: 1.15, 1.31). The scale weights calculated by qgcomp for each urinary OH-PAHs is shown in Figure 6, which revealed that ΣuNAP and ΣuFLU had the largest positive effect weights in the positive direction. Similarly, the associations were more significant in younger participants (Figure 4B).
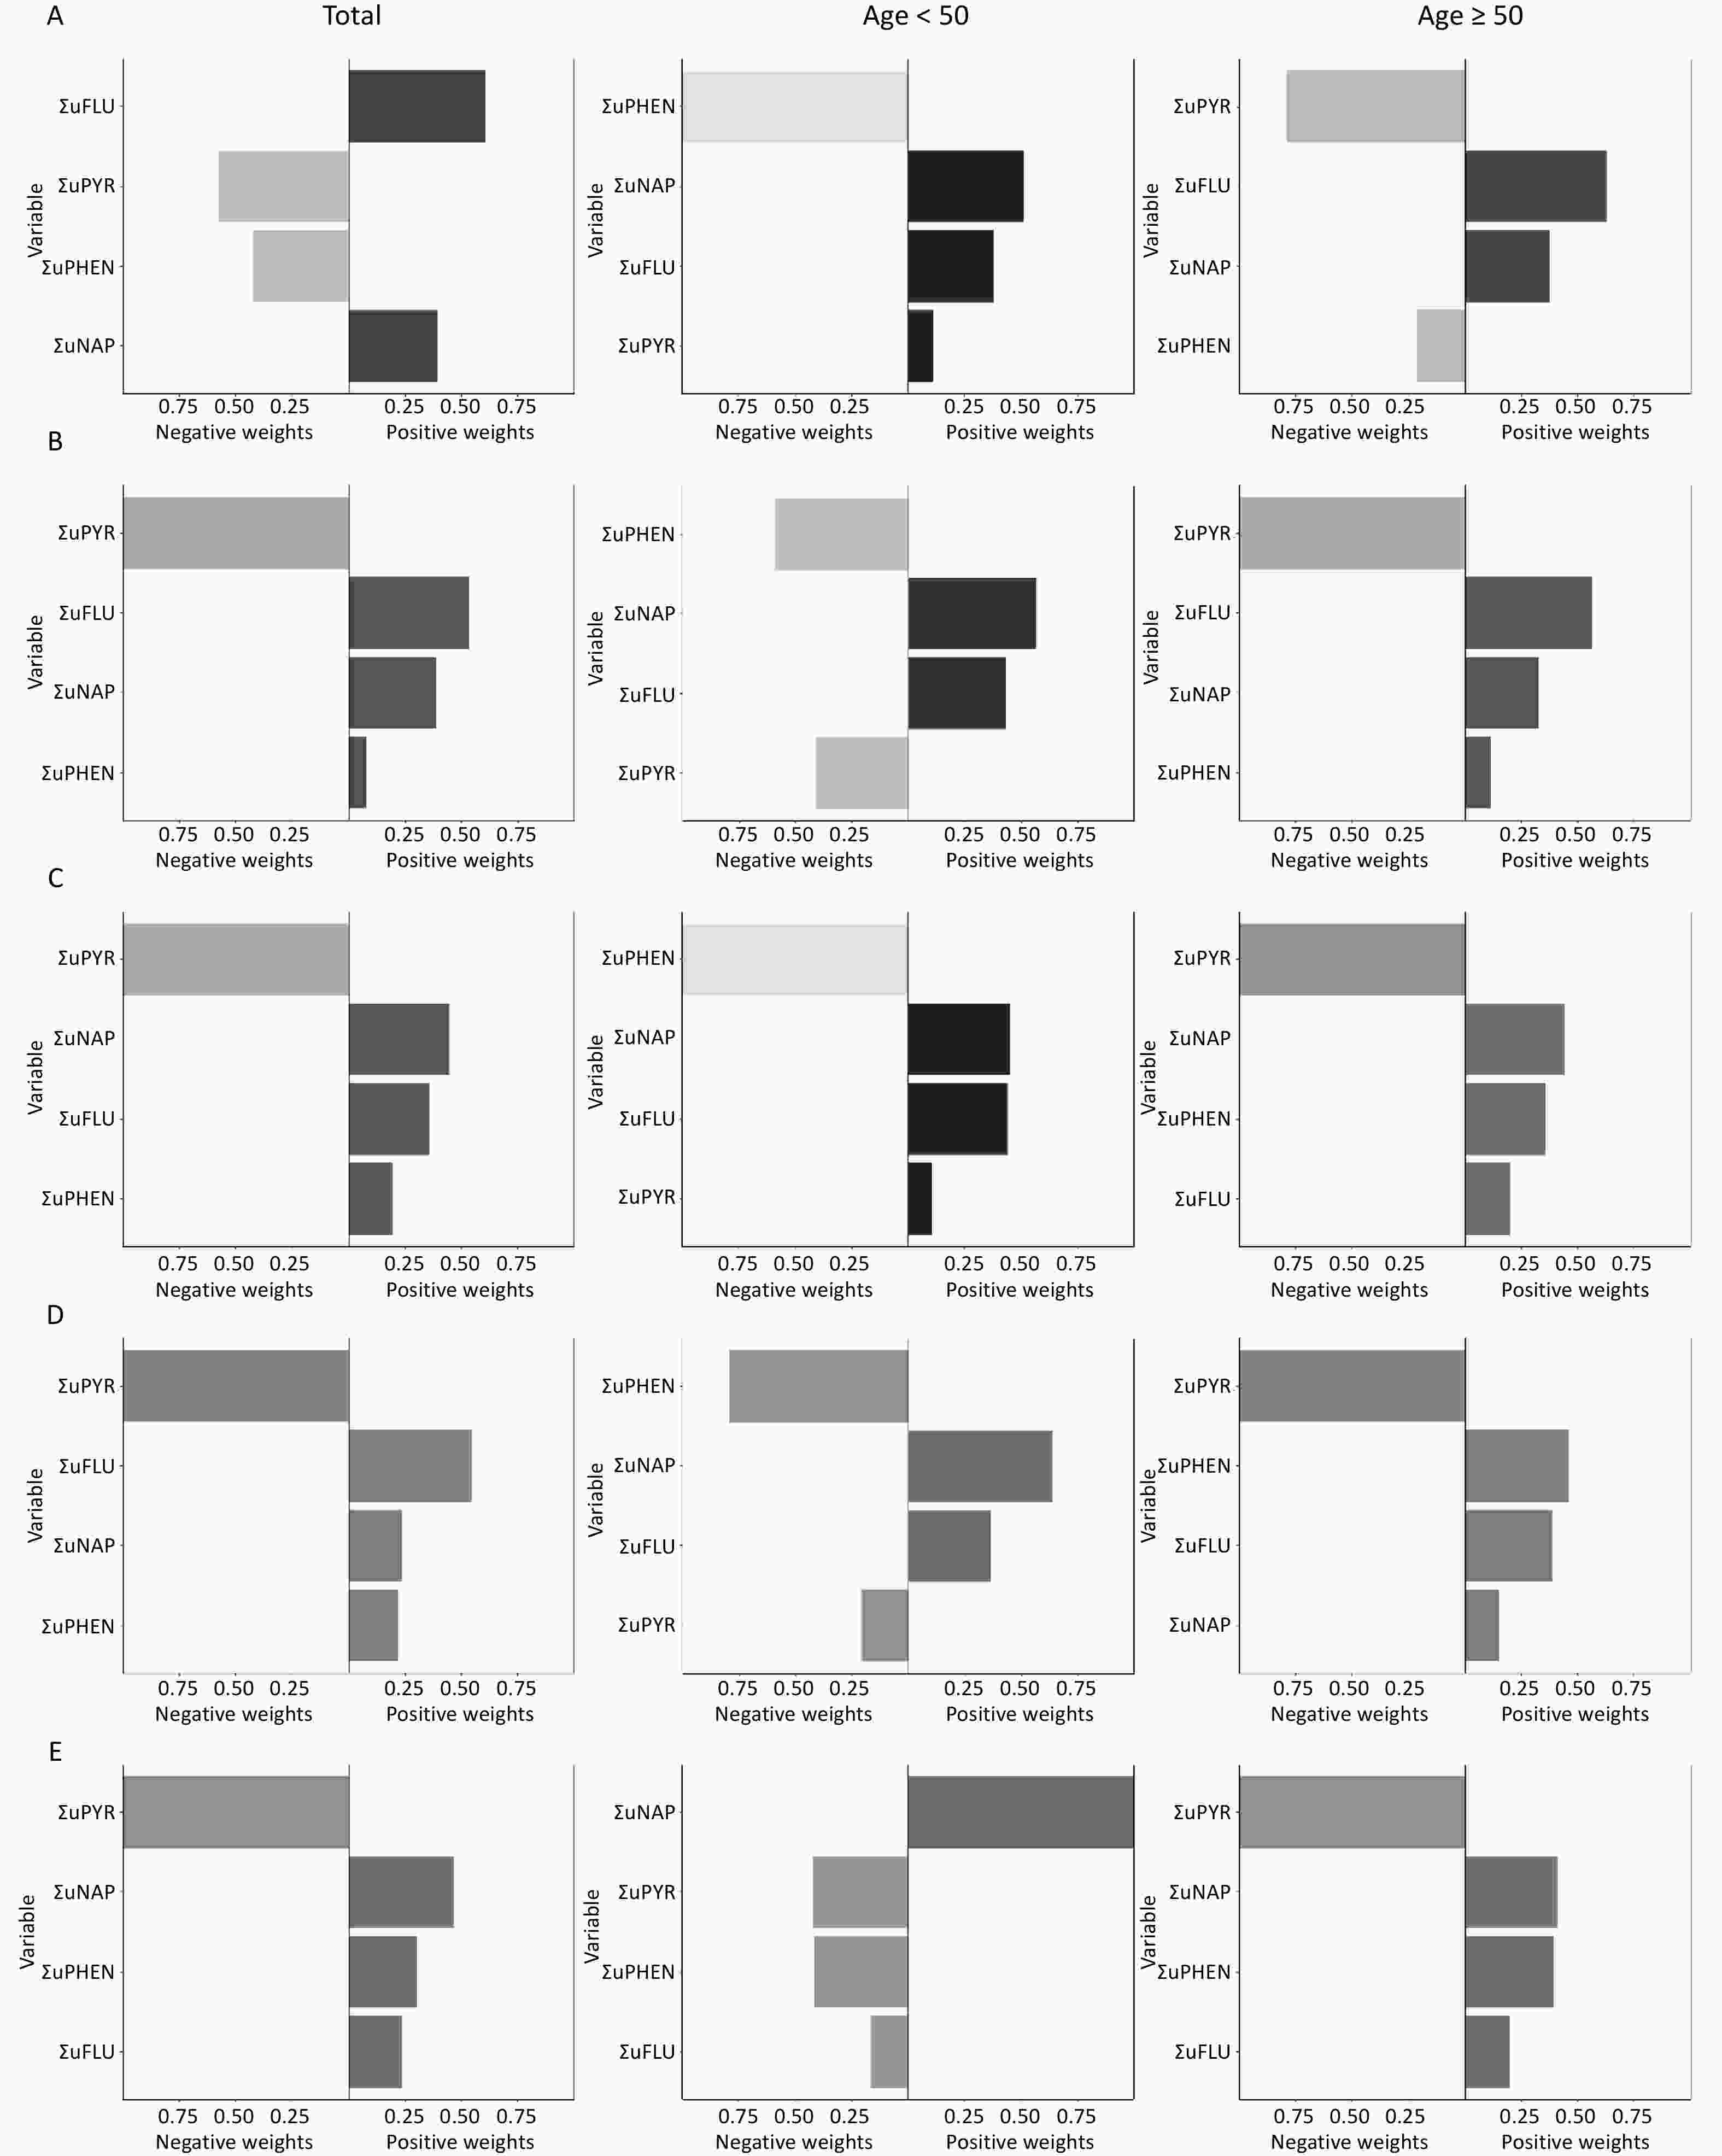
Figure 6. The qgcomp model weights of urinary OH-PAHs for CVD risk in the total population and subgroups. Urinary OH-PAHs mixture on Total CVD (A), ASCVD (B), HF (C), CHD (D), and stroke (E). In the graphic results of the QG-C model, the length of the bars represents the magnitude of the weights. A darker color on the right side of the bar indicates an overall positive association, whereas similar or indistinct colors reveal a non-significant or negligible relationship.
-
Polycyclic aromatic hydrocarbons (PAHs) are environmental toxins that adversely affect the cardiovascular system. In this study, novel PREVENT equations were used to investigate the impact of PAH exposure on CVD risk in the US adult population, and showed that ΣuPAHS, specifically ΣuNAP and ΣuFLU, were significantly associated with increased risk of total CVD, ASCVD and HF in younger participants (30 ≤ age < 50), but the associations of ΣuPHEN with ASCVD, HF, CHD and stroke were dominant in aging participants (age ≥ 50). Notably, ΣuPYR showed significantly negatively associations with the risk of ASCVD, HF, CHD and stroke in aging participants (age ≥ 50). Our results revealed that diverse PAHs metabolites had different effects on the four CVD subtypes in different age groups.
PAHs are common environmental pollutants and long-term exposure to PAHs can increase the risk of CVD, as shown in numerous previous studies. The Wuhan Zhuhai (WHZH) cohort, a Chinese cohort of general population, observed strong positive correlations between urinary 2-FLU, 9- FLU, 1-PYR, ΣuNAP, or ΣuPAHS levels and 10-year ASCVD risk, which was calculated by China-PAR model[38,39]. Similar results were also observed in 10-year ASCVD risk (evaluated by Framingham model) with increasing urinary levels of ΣuOH-PAHs[40]. These studies have primarily focused on the impact of PAHs on ASCVD, but there are few reports on their impact on other subtypes of CVD, such as HF, CHD and Stroke.
The PREVENT model builds on traditional cardiovascular risk factors, eGFR, HbA1c, UACR, and sociodemographic indicators. Consequently, it provides a more personalized cardiovascular risk assessment for patients with chronic kidney disease or diabetes than other models such as the PCE, Framingham, and SCORE. We used the PREVENT model to evaluate the 10-year risk of total CVD and four subtypes of CVD in American adults. Consistent with previous studies, ΣuPAH, ΣuNAP and ΣuFLU also showed significantly positive association with the risks of total CVD, ASCVD and HF in NHANES 2001–2016. Furthermore, these effects were noticeable among younger participants (30 ≤ age < 50); however, the association of ΣuPHEN with ASCVD, HF, CHD, and stroke were dominant in aging participants (age ≥ 50). Notably, negative association of ΣuPYR with the risk of ASCVD, HF, CHD and stroke in aging participants (age ≥ 50), but the impact on total CVD was not significant.
A possible reason for this may be related to the different health outcomes. Previous studies, ASCVD risk were evaluated the risk of ASCVD. In addition to ASCVD, the risk of total CVD and other CVD subtypes (HF, CHD and Stroke) was assessed. Therefore, the total CVD risk may differ from the 10-year ASCVD risk evaluated using the China-PAR or Framingham model[38-40]. Another reason may be the different models used to assess CVD risk. The PREVENT model predominantly yields lower risk estimates than the PCE in estimating the 10-year ASCVD risk in the NHANES cohort[41]. In analyses adjusted for the NHANES survey design, the PREVENT risk models performed significantly better than PCEs[42]. In a separate validation cohort of 3,330,085 individuals, PREVENT-ASCVD risk estimates closely approximated the observed ASCVD event rates with calibration ratios of observed-to-predicted events of approximately 1 compared with calibration ratios of approximately 0.5[43]. The PREVENT equations also reflect substantial changes in the inputs used to estimate ASCVD risk, adding kidney function in recognition of the link between cardiovascular, kidney, and metabolic health, adding the current use of statins, and removing race[44]. The PREVENT equations facilitate their application to a more diverse population with enhanced calibration compared to PCEs.
In addition to CVD risk prediction, self-reported CVD has also been used in many cross-sectional studies[45-47]. A US population-based study that pooled NHANES 2001-2010 data and included 7301 participants revealed a positive association between PAHs exposure and CVD[45]. Similarly, Xu et al. used NHANES 2001–2004 data and reported a dose-response relationship between PAHs exposure and self-reported CVD[46]. Duan et al. obtained similar results; specifically, 1-NAP and 2-FLU were positively associated with CVD and all-cause mortality[47]. Similarly, a study of 13,792 adults using NHANES data showed that elevated urinary 1-NAP, 2-NAP, 3-FLU, 2-FLU, 1-PHE, and 1-PYR levels were positively associated with self-reported CVD[48], which was slightly different from our results.
In the aforementioned study, several investigators discovered that NAP and FLU metabolites were linked to CVD, a finding that aligns with our conclusions. However, our findings did not indicate an association between phenanthrene or pyrene metabolites and an increased risk of developing CVD. Conversely, our results indicate a potential protective effect of pyrene metabolites against certain types of CVD. The observed differences can be attributed to three primary factors. First, the selected metabolites may have varied among researchers. Second, the study population was required to be at least 30 years of age to ensure the applicability of the PREVENT equations. Third, the aforementioned studies focused on the association between PAHs and self-reported CVD or death due to CVD. In contrast, the present study focused on the association between PAHs and the risk of developing CVD.
Our findings indicate that NAP, FLU, and their metabolites are important risk factors for CVDs. This association may be mediated by activation of oxidative stress and inflammatory pathways. Previous studies have shown that exposure to PAHs induces the expression of CYP enzymes (CYP1A1 and CYP1B1), leading to the production and onset of oxidative stress responses[49]. Concurrently, increased levels of inflammatory cytokines such as IL-6 and TNF-α may further exacerbate vascular endothelial dysfunction[50]. These biological processes are likely to promote the development and progression of adverse cardiovascular phenotypes including atherosclerosis, elevated blood pressure, and arrhythmias.
The present study showed that pyrene metabolites (such as 1-hydroxypyrene) were negatively associated with CVDs, including atherosclerosis, HF, and CHD. This inverse relationship may reflect physiological regulatory mechanisms or activation of detoxification pathways at low exposure levels[51]. Previous studies have shown that different PAHs differentially activate the aryl hydrocarbon receptor (AhR) signalling pathway and CYP-mediated detoxification system. Compared with benzo[a]pyrene, pyrene compounds are more likely to induce antioxidant pathways such as NQO1 and GST, which may, to some extent, mitigate inflammation and oxidative stress-related damage[52]. In addition to age-related metabolic differences, variations in lifestyle, health awareness, and wellness practices between middle-aged and older individuals may significantly influence the level of exposure to pyrene compounds (pyrene and its metabolites) and their biological effects on the cardiovascular system. Middle-aged individuals are often subject to higher occupational stress and a faster-paced lifestyle, which may be accompanied by more frequent environmental exposure (e.g., traffic-related air pollution and industrial emissions) and unhealthy behaviors (such as smoking and physical inactivity), thereby potentially amplifying the adverse health impacts of pyrene. In contrast, elderly individuals tend to pay more attention to health maintenance, with more cautious approaches to diet, exercise, and environmental exposure, which may mitigate the toxic effects of pyrene. Therefore, differences in the sources of exposure, behavioral patterns, and metabolic responses across age groups may collectively influence the strength of the association between pyrene exposure and CVD.
Age is an important factor in the future risk of CVD, and this study showed that the impact of PAHs on the risk of CVD is more significant in middle-aged individuals than in elderly individuals. In the elderly, age may play a primary role in the development of CVD, with PAHs acting as accelerants or contributing factors. In contrast, in the middle-aged group, PAHs appeared to play a more significant role in CVD risk than age. Nevertheless, exposure to PAHs increases the risk of CVD, regardless of age. Our findings provide a theoretical basis for preventing health problems induced by PAHs through enhancing personal protective measures, improving unhealthy dietary habits, controlling tobacco use, and avoiding exposure to secondhand smoke.
The major advantage of the present study is that we used PREVENT equations to investigate the association between urinary PAHs metabolites and total CVD risk, including ASCVD, HF, CHD and Stroke. Second, we used multipollutant models to enhance the robustness of our findings. The WQS and QG-C models are commonly used to analyze the effects of mixed exposures and exhibit strong adaptability to various data distributions. However, this study has some limitations. First, the cross-sectional study design was insufficient to prove the possibility of establishing a causal association between PAHs exposure and CVD risk. Second, our analysis was constrained to PAHs metabolite data that were publicly accessible for analysis through the NHANES, which can potentially elevate the risk of measurement bias. Moreover, the single-spot measurements of urinary PAHs metabolites used in the analysis may not accurately reflect continuous exposure and intra-individual differences among participants given the relatively short half-life of PAHs. Finally, despite the rigorous control of a range of covariates in our analysis, there was the potential for residual and unmeasured confounding, as well as measurement error, to introduce bias into our findings, which may have been caused by co-exposure to other chemicals or air pollution.
-
In this study, a novel CVD evaluation model, the PREVENT equation, was used, and various impacts of different PAHs on diverse subtypes of CVD were discovered. NAP and FLU had significant impact on total CVD, ASCVD, and HF risk in younger groups (30 ≤ age < 50), whereas PHEN had dominant effect on ASCVD, HF, CHD, and stroke in the aging groups (age ≥ 50). Surprisingly, a protective effect of PYR on the risk of ASCVD, HF, CHD, and stroke was discovered in the aging groups (aged ≥ 50), which was still controversial and required further in-depth research. Our study provided new findings and directions for understanding the relationship between PAHs exposure and CVD risk.
Diverse Subtypes of Cardiovascular Disease Risk Evaluated by Novel PREVENT Associated with Different Polycyclic Aromatic Hydrocarbon Metabolites
doi: 10.3967/bes2025.125
- Received Date: 2025-01-08
- Accepted Date: 2025-09-08
-
Key words:
- Cardiovascular disease /
- PREVENT equation /
- Polycyclic aromatic hydrocarbon /
- NHANES
Abstract:
The authors declare that they have no competing financial interests or personal relationships that may have influenced the work reported in this paper.
This study used data from the NHANES, approved by the Ethical Review Board at the National Center for Health Statistics, and written informed consent was obtained from all participants.
&These authors contributed equally to this work.
| Citation: | Ye Xin, Yucheng Sun, Fengtao Cui, Yingge Duan, Hanyun Wang, Li Chen, Tian Chen, Piye Niu, Junxiang Ma. Diverse Subtypes of Cardiovascular Disease Risk Evaluated by Novel PREVENT Associated with Different Polycyclic Aromatic Hydrocarbon Metabolites[J]. Biomedical and Environmental Sciences. doi: 10.3967/bes2025.125

|

 Quick Links
 DownLoad: