
-
Body mass index (BMI) has been commonly used as a surrogate marker for identifying underweight, overweight, or obese individuals and is calculated as weight (kg)/height2 (m2). Prior prospective cohort studies have demonstrated that overweight and obesity increase the prevalence of various non-communicable diseases, including hypertension[1], cardiovascular diseases (CVD)[2], diabetes mellitus[3], respiratory diseases[4], and cancer[5]. In addition, accumulating evidence suggests a U-shaped or J-shaped relationship between BMI and mortality[6–8], indicating that overweight or obesity is linked to an increased risk of death. A meta-analysis involving 10.62 million participants on different continents from 239 prospective studies, with a median follow-up year of 13.7 years, found that all-cause mortality was lowest at a BMI of 20.0–25.0 kg/m2 (normal BMI) and increased significantly both below and above this range[9]. However, there are several clinical conditions in which the ideal BMI range of 18.5 to 24.0 kg/m2 fails to be a good indicator. For instance, studies have shown that patients with hypertension[10,11], diabetes[12,13] and respiratory diseases[14,15] have lower mortality when they are overweight or obese than when they have normal weight. A recent meta-analysis of 82 original studies involving 2.7 million individuals and 23.4 million person-years found similar outcomes, indicating that the lowest mortality rate was among those classified as overweight with a BMI between 25 and 30 kg/m2[16]. This phenomenon is referred to as the “obesity paradox”, highlighting that the association between BMI and mortality is more complex than previously thought.
The BMI categories for defining overweight and obesity are influenced by factors such as age and race. The Chinese criteria differ from the World Health Organization (WHO) criteria used in the aforementioned studies. Based on the Chinese criteria, the most recent national data (2015–2019) revealed that 16.4% of Chinese adults were obese (BMI ≥ 28.0 kg/m2) and 34.3% were overweight (≥ 24.0 to < 28.0 kg/m2)[17]. Given this heavy burden, the potential effects of overweight and obesity on mortality in China are worth exploring. A recent Mendelian randomization study revealed an association between a higher BMI and a decreased risk of death, with an hazard ratios (HR) of 0.96 for each 1 kg/m2 increment in BMI. It also revealed a nonlinear, reverse J-shaped relationship between genetically predicted BMI and all-cause mortality, with the lowest mortality risk observed at a BMI of approximately 28.0 kg/m2[18]. Two additional prospective cohort studies corroborated these findings[12,19]; however, they focused on elderly people (> 80 years old) and individuals with particular diseases, which limits the generalizability of their results. Furthermore, the median follow-up duration ranged from three to six years, which was potentially insufficient for capturing the relevant endpoints. Additional research is warranted to confirm these findings.
Our research team established a population-based, multicenter, prospective cohort involving the rural population aged ≥ 5 years old in 2013[20] and completed a 10-year follow-up in 2023. By utilizing the mortality data collected during the follow-up period, in conjunction with the baseline information obtained in 2023, we aimed to further explore the association between BMI and all-cause and cause-specific mortality.
-
In July 2013, a population-based multicenter baseline survey was conducted to assess latent tuberculosis infection among registered residents of rural China. Details of the baseline survey have been reported previously[20]. Briefly, 21,832 rural residents (≥ 5 years old) registered in the four local study sites (characterized by various tuberculosis epidemics, economic conditions, and geographical locations) participated in the baseline survey. Sociodemographic information and self-reported health status data were collected using a standardized questionnaire. Height and weight were measured for each participant, with height recorded to the nearest 0.1 cm (without hat) and weight measured to the nearest 0.01 kg (with light clothing). Baseline BMI was calculated by dividing weight (kg) by the square of height (m2) and classified into four categories according to the Chinese criteria: underweight (BMI < 18.5 kg/m2), desirable (BMI ≥ 18.5 to < 24.0 kg/m2), overweight (BMI ≥ 24.0 to < 28.0 kg/m2), and obese (BM ≥ 28.0 kg/m2).
In October 2023, a 10-year follow-up was conducted at the same four study sites. All 21,832 participants were invited to participate in the closing survey. Those who declined the invitation, who could not be contacted, or who died were excluded. Considering that an obvious change in BMI would be expected in children and adolescents over the course of a decade, only individuals with a baseline age ≥ 15 years were included in the follow-up analysis.
-
During the 10-year follow-up period, each study participant was contacted by a local village doctor, who invited them to attend a physical examination and to respond a questionnaire at a designated location. For those who resided outside the local area during the follow-up period, a telephone survey was conducted. Trained interviewers collected sociodemographic information as well as self-reported information on primary disease history, including the presence and onset timing of various conditions such as hypertension, diabetes mellitus, CVD, respiratory diseases, cancer, liver and renal diseases, neuropsychiatric disorders, and immune system diseases. In addition to obtaining information on the primary disease history via a questionnaire, individuals diagnosed with hypertension, diabetes mellitus, CVD, respiratory diseases, or cancer who were registered in the Chronic Disease Management System were identified and matched with the study participants by their identification numbers. For participants who died, information regarding the time and cause of death and primary disease history was obtained from the Mortality Registration System (MRS).
-
Information on mortality, including the precise date and cause of death, was obtained from the local MRS. If the information was not documented in the MRS owing to recent fatalities or a change of residential address, it was collected from the closest relatives or village doctors. Survival time was defined as the period from the baseline survey to the date of death for the deceased (December 31, 2023) or to the date of their last follow-up for the survivors. Cause-specific mortality was classified into four types: CVD, respiratory diseases, cancer, and other reasons, according to the International Classification of Diseases (ICD, 10th revision codes).
-
Proportional hazard assumptions were first evaluated using Kolmogorov-type supremum tests. Cox proportional hazard regression models and Cox non-proportional hazard models (a combined model incorporating covariate stratification and time-interaction terms) were used according to the proportional hazard assumption results. Univariate incidence rate ratios were first calculated to explore potential factors associated with the all-cause mortality rate, and Cox models were used to estimate the associations of BMI with all-cause mortality and cause-specific mortality, utilizing aHRs and 95% confidence intervals (CIs) after adjusting for potential confounders. Covariates adjusted in the multivariable Cox models included sex, baseline age, baseline educational level, baseline marital status, baseline household per capita income, baseline smoking status, baseline alcohol drinking status, study sites, history of primary disease (self-reported both at baseline and at the 10-year follow-up combined with information exported from the Chronic Disease Management System and MRS), dietary confounders (frequence of meat and bean consumption) and job intensity. Subgroup analyses of the association between BMI and all-cause mortality were conducted for several potential confounders, including sex, baseline age, baseline smoking status, baseline alcohol drinking status, and history of primary disease (hypertension, diabetes mellitus, CVD, respiratory diseases, and cancer). The risk of death across the four BMI categories was visualized and estimated using the Kaplan-Meier function (the P-value was calculated using the log-rank test). Additionally, restricted cubic spline analyses were conducted to assess the multivariable-adjusted associations between BMI, treated as a continuous variable, and all-cause mortality across different subgroups defined by sex and age, employing three knots in the spline analysis. To decrease the possibility of reverse causality, a sensitivity analysis was conducted after excluding individuals who died within the initial two years of the study (2013–2015). All statistical analyses were performed using SAS (version 9.4) and R (version 4.4.1).
-
After excluding one participant with missing height or weight data and 2,724 participants younger than 15 years, 19,107 participants with a total of 163,095 person-years were included in the current analysis. A little over half of the participants (10,345/19,107, 54.14%) were women, and most participants were younger than 60 years (13,751/19,107, 71.97%). Approximately 30% (5,496/19,107, 28.76%) and 20% (4,160/19,107, 21.77%) of the study participants had smoking and drinking habits, respectively. At baseline, 15.20% (2,905/19,107), 5.20% (993/19,107), 6.41% (1,224/19,107), 6.58% (1,258/19,107), and 0.96% (183/19,107) of the participants had a history of hypertension, diabetes mellitus, CVD, respiratory diseases, or cancer, respectively. Among the enrolled participants, 6.41% (1,224/19,107) were underweight, 53.01% (10,128/19,107) had desirable weight, 29.78% (5,691/19,107) were overweight, and 10.80% (2,064/19,107) were obese. The distributions of BMI according to each characteristic were significantly different, except for history of cancer (Table 1).
Characteristics Total
N (%)BMIa P for χ2 test Underweight
(< 18.5 kg/m2)Desirable
(≥ 18.5 to < 24.0 kg/m2)Overweight
(≥ 24.0 to < 28.0 kg/m2)Obesity
(≥ 28.0 kg/m2)Total 19,107 (100) 1,224 (6.41) 10,128 (53.01) 5,691 (29.78) 2,064 (10.80) Sex 0.016 Women 10,345 (54.14) 639 (52.21) 5,423 (53.54) 3,108 (54.61) 1,175 (56.93) Men 8,762 (45.86) 585 (47.79) 4,705 (46.46) 2,583 (45.39) 889 (43.07) Age (years) < 0.001 < 40 5,233 (27.39) 580 (47.39) 3,045 (30.07) 1,115 (19.59) 493 (23.89) 40–49 4,760 (24.91) 121 (9.89) 2,282 (22.53) 1,727 (30.35) 630 (30.52) 50–59 3,758 (19.67) 119 (9.72) 1,849 (18.26) 1,348 (23.69) 442 (21.41) ≥ 60 5,356 (28.03) 404 (33.01) 2,952 (29.15) 1,501 (26.37) 499 (24.18) Education level < 0.001 Primary school or lower 9,385 (49.12) 532 (43.46) 4,831 (47.70) 2,904 (51.03) 1,118 (54.17) Middle school 6,681 (34.97) 383 (31.29) 3,541 (34.96) 2,060 (36.20) 697 (33.77) High school 2,377 (12.44) 245 (20.02) 1,362 (13.45) 583 (10.24) 187 (9.06) College or higher 664 (3.48) 64 (5.23) 394 (3.89) 144 (2.53) 62 (3.00) Marital status < 0.001 Unmarried 1,921 (10.05) 416 (33.99) 1,201 (11.86) 215 (3.78) 89 (4.31) Married 15,944 (83.45) 719 (58.74) 8,228 (81.24) 5,128 (90.11) 1,869 (90.55) Divorced 88 (0.46) 4 (0.33) 53 (0.52) 28 (0.49) 3 (0.15) Widowed 1,154 (6.04) 85 (6.94) 646 (6.38) 320 (5.62) 103 (4.99) Household per capita income (RMB) < 0.001 < 6,000 11,582 (60.62) 934 (76.31) 6,155 (60.77) 3,217 (56.53) 1,276 (61.82) ≥ 6,000 7,525 (39.38) 290 (23.69) 3,973 (39.23) 2,474 (43.47) 788 (38.18) Smoking status 0.002 Never smoker 13,611 (71.24) 907 (74.10) 7,106 (70.16) 4,088 (71.83) 1,510 (73.16) Ever—smoker or current smoker 5,496 (28.76) 317 (25.90) 3,022 (29.84) 1,603 (28.17) 554 (26.84) Alcohol drinking < 0.001 No 14,947 (78.23) 1,070 (87.42) 7,990 (78.89) 4,315 (75.82) 1,572 (76.16) Yes 4,160 (21.77) 154 (12.58) 2,138 (21.11) 1,376 (24.18) 492 (23.84) History of hypertensionb < 0.001 No 16,202 (84.80) 1,130 (92.32) 8,918 (88.05) 4,584 (80.55) 1,570 (76.07) Yes 2,905 (15.20) 94 (7.68) 1,210 (11.95) 1,107 (19.45) 494 (23.93) History of diabetes mellitusc < 0.001 No 18,114 (94.80) 1,200 (98.04) 9,778 (96.54) 5,303 (93.18) 1,833 (88.81) Yes 993 (5.20) 24 (1.96) 350 (3.46) 388 (6.82) 231 (11.19) History of cardiovascular diseasesd < 0.001 No 17,883 (93.59) 1,152 (94.12) 9,568 (94.47) 5,279 (92.76) 1,884 (91.28) Yes 1,224 (6.41) 72 (5.88) 560 (5.53) 412 (7.24) 180 (8.72) History of respiratory diseasese < 0.001 No 17,849 (93.42) 1,085 (88.64) 9,495 (93.75) 5,329 (93.64) 1,940 (93.99) Yes 1,258 (6.58) 139 (11.36) 633 (6.25) 362 (6.36) 124 (6.01) History of cancerf 0.750 No 18,924 (99.04) 1,210 (98.86) 10,031 (99.04) 5,635 (99.02) 2,048 (99.22) Yes 183 (0.96) 14 (1.14) 97 (0.96) 56 (0.98) 16 (0.78) Study sites < 0.001 Longxi Site 5,265 (27.56) 260 (21.24) 2,914 (28.77) 1,653 (29.05) 438 (21.22) Danyang Site 4,456 (23.32) 166 (13.56) 1,991 (19.66) 1,438 (25.27) 861 (41.72) Zhongmu Site 4,933 (25.82) 381 (31.13) 2,710 (26.76) 1,383 (24.30) 459 (22.24) Xiangtan Site 4,453 (23.31) 417 (34.07) 2,513 (24.81) 1,217 (21.38) 306 (14.83) Frequence of fruit intake (per week) 0.06 < 1 day 38 (0.20) 7 (0.57) 15 (0.15) 11 (0.19) 5 (0.24) 1–3 days 207 (1.08) 13 (1.06) 112 (1.11) 65 (1.14) 17 (0.82) 4–6 days 637 (3.33) 44 (3.59) 360 (3.55) 176 (3.09) 57 (2.76) 7 days 18,225 (95.38) 1,160 (94.77) 9,641 (95.19) 5,439 (95.57) 1,985 (96.17) Frequence of meat intake (per week) 0.002 < 1 day 2,437 (12.75) 156 (12.75) 1,303 (12.87) 696 (12.23) 282 (13.66) 1–3 days 7,110 (37.21) 442 (36.11) 3,811 (37.63) 2,059 (36.18) 798 (38.66) 4–6 days 4,455 (23.32) 303 (24.75) 2,381 (23.51) 1,366 (24.00) 405 (19.62) 7 days 5,105 (26.72) 323 (26.39) 2,633 (26.00) 1,570 (27.59) 579 (28.05) Frequence of bean intake (per week) < 0.001 < 1 day 7,627 (39.92) 469 (38.32) 3,927 (38.77) 2,280 (40.06) 951 (46.08) 1–3 days 8,014 (41.94) 514 (41.99) 4,360 (43.05) 2,375 (41.73) 765 (37.06) 4–6 days 2,368 (12.39) 166 (13.56) 1,280 (12.64) 681 (11.97) 241 (11.68) 7 days 1,098 (5.75) 75 (6.13) 561 (5.54) 355 (6.24) 107 (5.18) Intensity of job < 0.001 Mild 7,224 (37.81) 689 (56.29) 3,956 (39.06) 1,882 (33.07) 697 (33.77) Moderate 10,217 (53.47) 464 (37.91) 5,225 (51.59) 3,302 (58.02) 1,226 (59.40) Severe 95 (0.50) 3 (0.25) 48 (0.47) 32 (0.56) 12 (0.58) Extreme severe 1,571 (8.22) 68 (5.56) 899 (8.88) 475 (8.35) 129 (6.25) Note. BMI, body mass index. Data are presented as n (%), unless otherwise specified. The sum of the percentages may not always be 100%, because of rounding. aBMI was classified into four categories according to Chinese standard: Underweight (< 18.5 kg/m2), Desirable weight (≥ 18.5 to < 24.0 kg/m2) (reference), Overweight (≥ 24.0 to < 28.0 kg/m2), Obesity (≥ 28.0 kg/m2). bSelf-reported history of hypertension or hypertension records from the chronic disease system or the cause of death system of the local Center for Disease Control and Prevention. cSelf-reported history of diabetes mellitus or fasting blood glucose ≥ 7 mmol/L at baseline, diabetes mellitus records from the Chronic Diseases Management System, or the Cause of Mortality Registration System of the local Center for Disease Control and Prevention. dSelf-reported history of cardiovascular diseases or cardiovascular diseases records from the Chronic Diseases Management System or Cause of Mortality Registration System of the local Center for Disease Control and Prevention, including myocardial infarction, coronary syndrome, atherosclerosis, stenosis, coronary heart disease, and cerebral infarction. eSelf-reported history of respiratory diseases or respiratory disease records from the Chronic Diseases Management System or the Cause of Mortality Registration System of the local Center for Disease Control and Prevention, including chronic obstructive pulmonary disease, pneumonia, chronic bronchitis, asthma, and pulmonary emphysema. fSelf-reported history of cancer or cancer records from the Chronic Diseases Management System or the Cause of Mortality Registration System of the local Center for Disease Control and Prevention. Table 1. Characteristics of study population at baseline survey in 2013
-
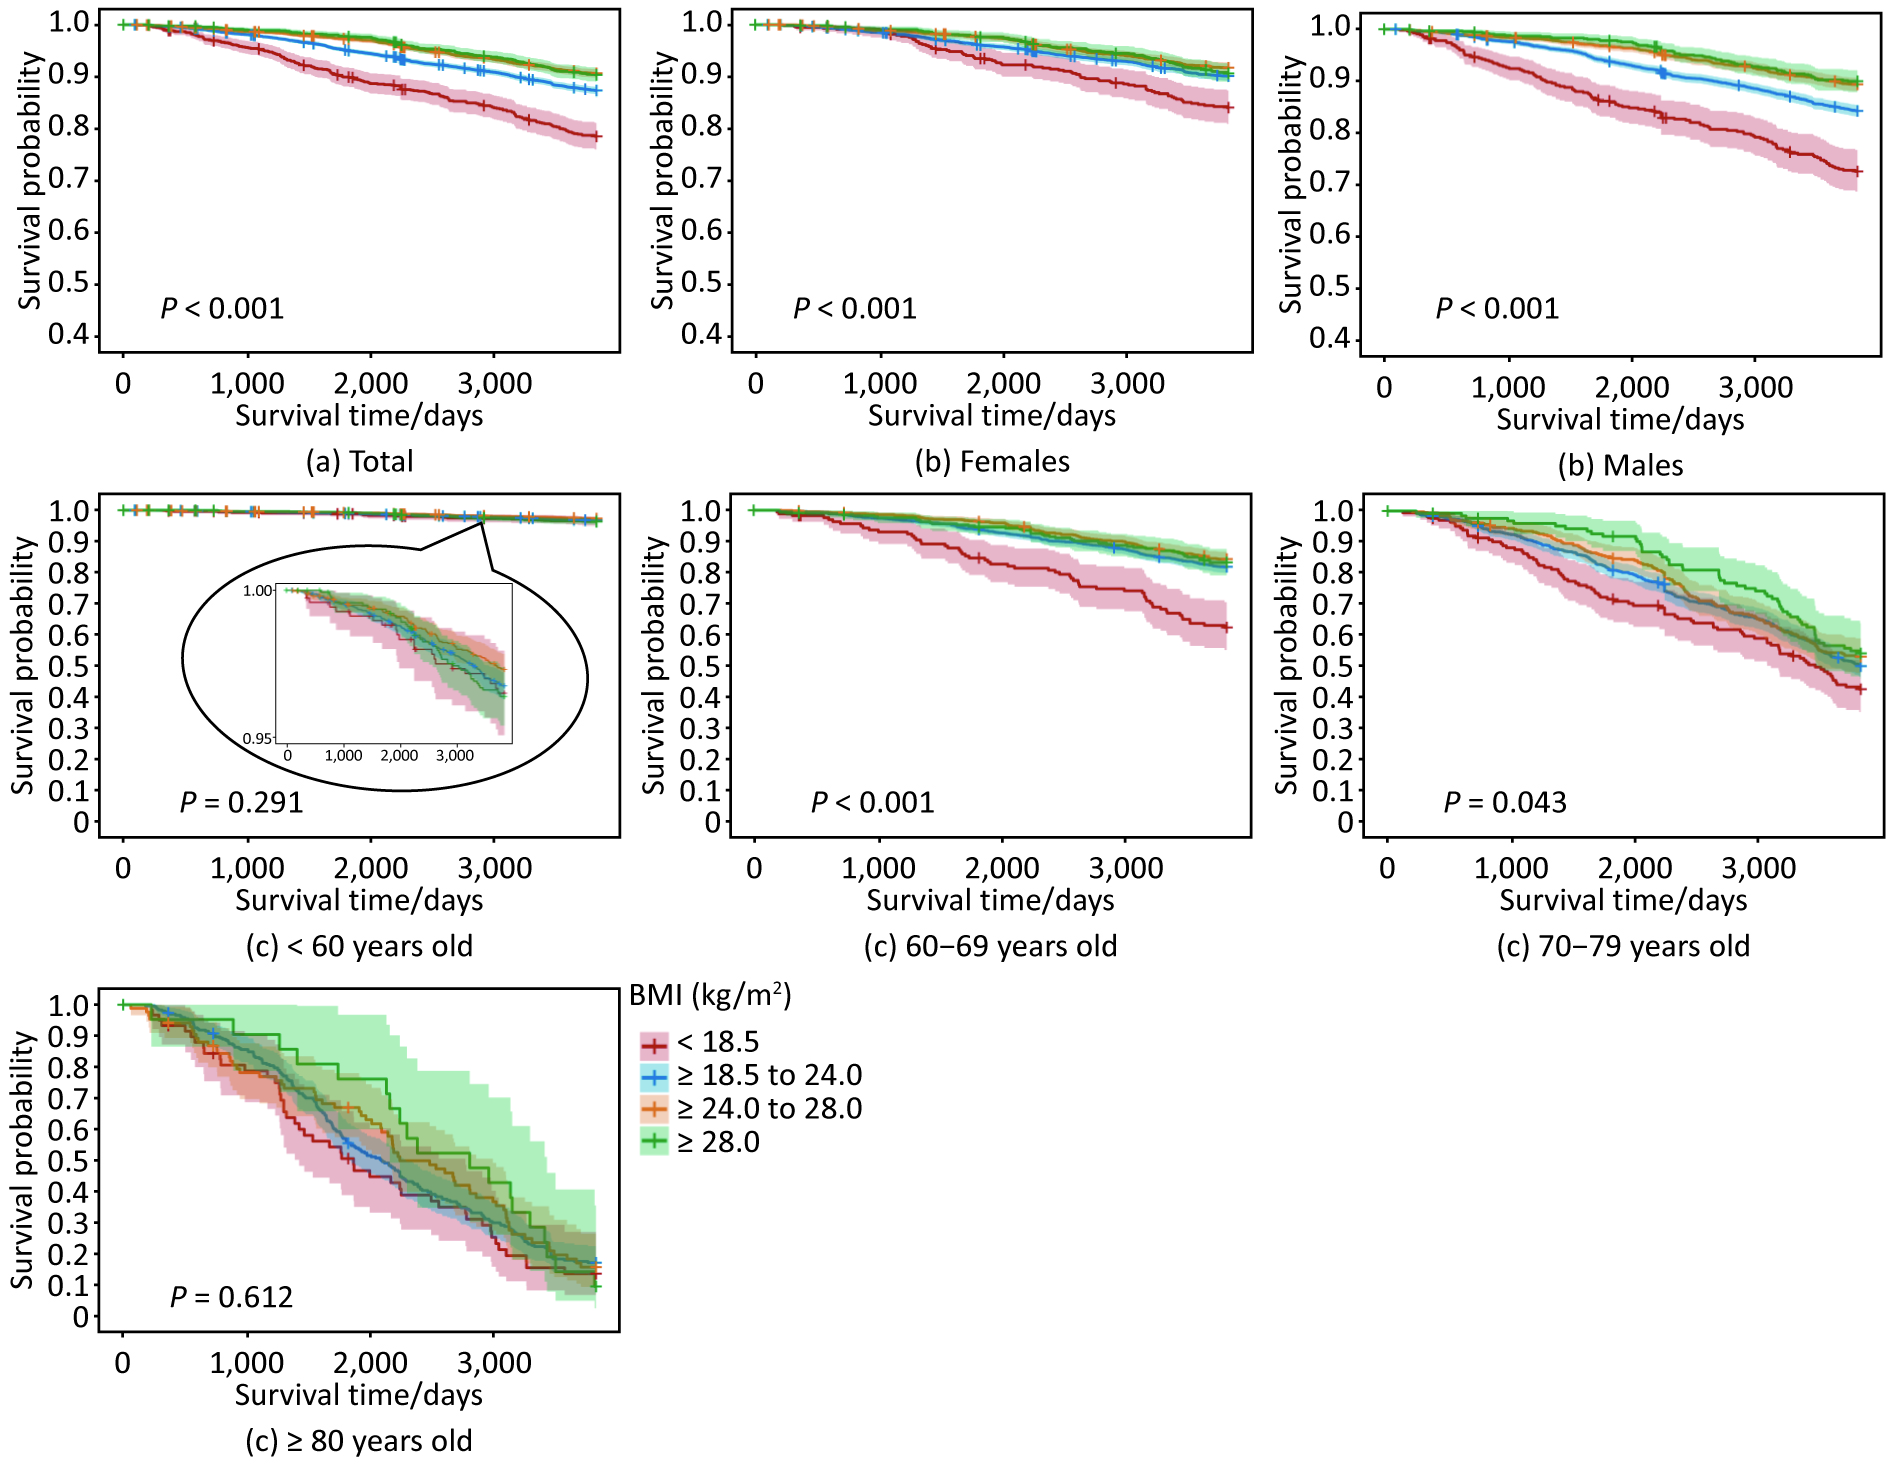
During the 10-year follow-up period, 1,910 participants died, corresponding to a mortality of 11.71 per 1,000 person-years. The overall mortalities were 22.57 (212/9,394), 12.57 (1,072/85,275), 9.07 (453/49,925), and 9.35 (173/18,500) per 1,000 person-years in the underweight, desirable weight, overweight and obese groups, respectively. Kaplan–Meier survival curves were analyzed based on BMI, as illustrated in Figure 1. Overall survival probability was inversely associated with BMI (P < 0.001). Similar trends were observed in both sex groups (P < 0.001), the 60–69 years age group (P < 0.001) and the 70–79 years age group (P = 0.04), whereas no significant differences were found in the < 60 years age group (P = 0.29) or the ≥ 80 years age group (P = 0.61). After adjusting for other covariates, including sex, age, education level, smoking status, marital status, household per-capita income, history of primary diseases, study sites, dietary confounders, and intensity of job, BMI was also found to be associated with all-cause mortality. Compared with the desirable BMI group (reference), the overweight and obese groups had a 39% (aHR = 0.61, 95% CI: 0.52–0.73) and 49% (aHR = 0.51, 95% CI: 0.37–0.70) reduction in all-cause mortality, respectively. In contrast, the all-cause mortality of the underweight group was 2.00 times higher (95% CI: 1.66–2.41) (Table 2).
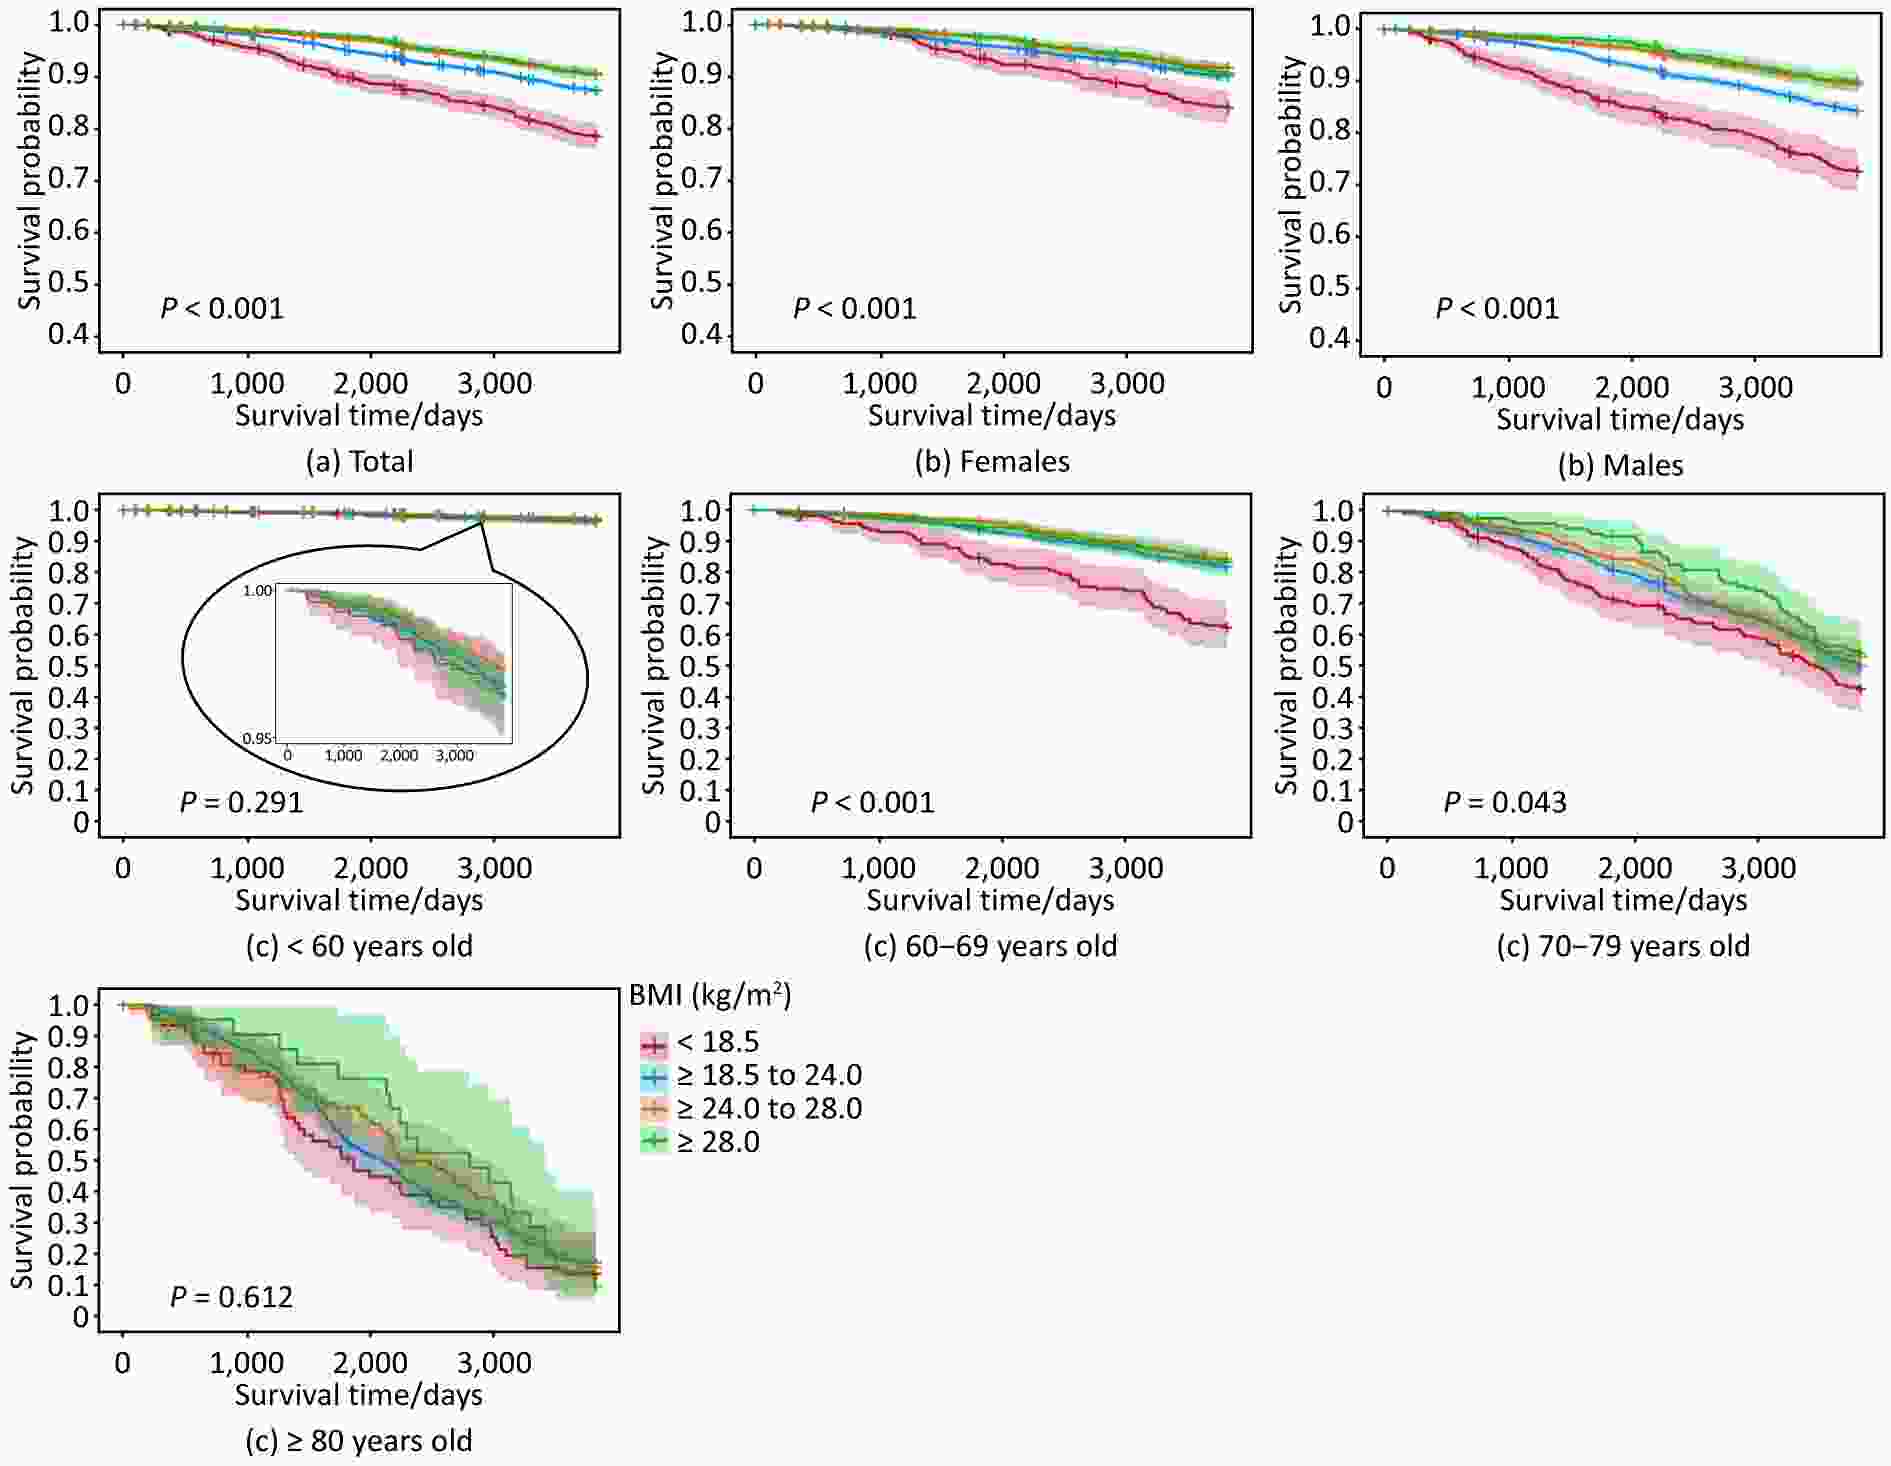
Figure 1. Cumulative hazards of all-cause mortality in 10 years stratified across BMI categories in different sex and age groups.
Baseline Characteristics Incidence of death (ID)per 1,000 person-years ID ratio (95% CI) Adjusted HR (95% CI)a Total 1,910/163,095 (11.71) NA NA Sex Women 830/87,956 (9.44) Reference Reference Men 1,080/75,138 (14.37) 2.13 (1.88–2.42) Age (years) < 40 20/43,303 (0.46) Reference Reference 40–49 121/42,686 (2.83) 6.14 (3.82–9.85) 6.51 (3.95–10.72) 50–59 217/33,995 (6.38) 13.82 (8.74–21.85) 12.12 (7.46–19.68) ≥ 60 1,552/43,109 (36.00) 77.95 (50.15–121.20) 40.69 (25.25–65.57) BMI (kg/m2) < 18.5 212/9,394 (22.57) 1.80 (1.55–2.08) 2.00 (1.66–2.41) ≥ 18.5 to < 24.0 1,072/85,275 (12.57) Reference Reference ≥ 24.0 o < 28.0 453/49,925 (9.07) 0.72 (0.64–0.81) 0.61 (0.52–0.73) ≥ 28.0 173/18,500 (9.35) 0.74 (0.63–0.87) 0.51 (0.37–0.70) Education level Primary school or lower 1,550/79,901 (19.40) Reference Reference Middle school 289/57,913 (4.99) 0.26 (0.23–0.29) 0.71 (0.62–0.81) High school 66/20,100 (3.28) 0.17 (0.13–0.22) 0.65 (0.50–0.84) College or higher 5/5,179 (0.97) 0.05 (0.02–0.12) 0.55 (0.22–1.34) Marital status Unmarried 50/15,210 (3.29) Reference Reference Married 1,436/138,381 (10.38) 3.16 (2.38–4.19) 1.05 (0.78–1.41) Divorced 9/765 (11.76) 3.58 (1.76–7.28) 1.18 (0.58–2.42) Widowed 415/8,736 (47.50) 14.45 (10.78–19.38) 1.89 (1.38–2.57) Household per capita income (RMB) < 6,000 1,580/98,011 (16.12) Reference Reference ≥ 6,000 330/65,083 (5.07) 0.31 (0.28–0.35) 0.62 (0.54–0.71) Smoking status Never smoker 1,181/115,127 (10.26) Reference Reference Ever—smoker or current smoker 729/47,968 (15.20) 1.48 (1.35–1.63) 1.08 (0.95–1.22) Alcohol drinking No 1,515/126,020 (12.02) Reference Reference Yes 395/37,074 (10.65) 0.89 (0.79–0.99) 0.90 (0.79–1.02) History of hypertension No 1,296/137,938 (9.40) Reference Reference Yes 614/25,156 (24.41) 2.60 (2.36–2.86) 1.07 (0.96–1.19) History of diabetes mellitus No 1,704/154,797 (11.01) Reference Reference Yes 206/8,298 (24.83) 2.26 (1.95–2.61) 1.54 (1.33–1.79) History of cardiovascular diseases No 1,510/153,739 (9.82) Reference Reference Yes 400/9,356 (42.75) 4.35 (3.90–4.86) 2.44 (1.89–3.13) History of respiratory diseases No 1,615/155,458 (10.39) Reference Reference Yes 295/7,637 (38.63) 3.72 (3.28–4.21) 2.01 (1.52–2.65) History of cancer No 1,845/161,792 (11.40) Reference Reference Yes 65/1,302 (49.92) 4.38 (3.42–5.61) 3.20 (2.49–4.12) Study sites Longxi Site 271/35,321 (7.67) Reference Reference Danyang Site 546/44,822 (12.18) 1.59 (1.37–1.84) 1.01 (0.85–1.20) Zhongmu Site 360/40,662 (8.85) 1.15 (0.99–1.35) 1.25 (1.06–1.47) Xiangtan Site 733/42,288 (17.33) 2.26 (1.97–2.60) 1.29 (1.12–1.50) Frequence of fruit intake (per week) NA < 1 day 5/282 (17.73) Reference 1–3 days 21/1,840 (11.41) 0.64 (0.24–1.71) 4–6 days 62/5,197 (11.93) 0.67 (0.27–1.67) 7 days 1,822/155,774 (11.70) 0.66 (0.27–1.59) Frequence of meat intake (per week) < 1 day 388/20,965 (18.51) Reference Reference 1–3 days 780/61,371 (12.71) 0.69 (0.61–0.78) 0.87 (0.77–0.99) 4–6 days 356/37,312 (9.54) 0.52 (0.45–0.60) 0.82 (0.71–0.96) 7 days 386/43,446 (8.88) 0.48 (0.42–0.55) 0.81 (0.70–0.94) Frequence of bean intake (per week) < 1 day 873/66,506 (13.13) Reference Reference 1–3 days 766/67,316 (11.38) 0.87 (0.79–0.96) 0.99 (0.89–1.11) 4–6 days 202/19,858 (10.17) 0.77 (0.67–0.90) 0.96 (0.81–1.14) 7 days 69/9,412 (7.33) 0.56 (0.44–0.71) 0.81 (0.62–1.05) Intensity of job Mild 947/57,658 (16.42) Reference Reference Moderate 899/90,426 (9.94) 0.61 (0.55–0.66) 0.57 (0.52–0.64) Severe 10/792 (12.63) 0.77 (0.41–1.43) 0.98 (0.84–2.97) Extremely severe 54/14,217 (3.80) 0.23 (0.18–0.30) 0.89 (0.44–1.29) Note. BMI, body mass index. ID: Incidence of death. NA, not available. CI, confidence interval. HR, hazards ratio. Data were death/total (%), unless otherwise specified. BMI was classified into four categories according to Chinese standard: Underweight (< 18.5 kg/m2), Desirable weight (≥ 18.5 to < 24.0 kg/m2) (reference), Overweight (≥ 24.0 to < 28.0 kg/m2), Obesity (≥ 28.0 kg/m2). aAdjusted for sex, age, education level, marital status, income, smoking status, alcohol drinking status, history of hypertension, diabetes mellitus, cardiovascular diseases, respiratory diseases and cancer, study sites of participants, frequency of meat intake, frequency of bean intake, and job intensity using Cox models. Table 2. Potential factors associated with all-cause mortality rate in 10 years in the study population
The subgroup analyses revealed similar associations between BMI and all-cause mortality. The association between underweight and an increase in all-cause mortality persisted for all subgroups except the < 60 years old subgroup. In addition, there were significant inverse links between overweight and all-cause mortality across all subgroups, except for the group with alcohol drinking habits and a history of cancer. Negative associations between obesity and all-cause mortality were found among women, individuals ≥ 60 years old, non-smokers, non-drinkers, individuals with a history of hypertension, diabetes mellitus or CVD, and those without a history of respiratory diseases or cancer (Figure 2).
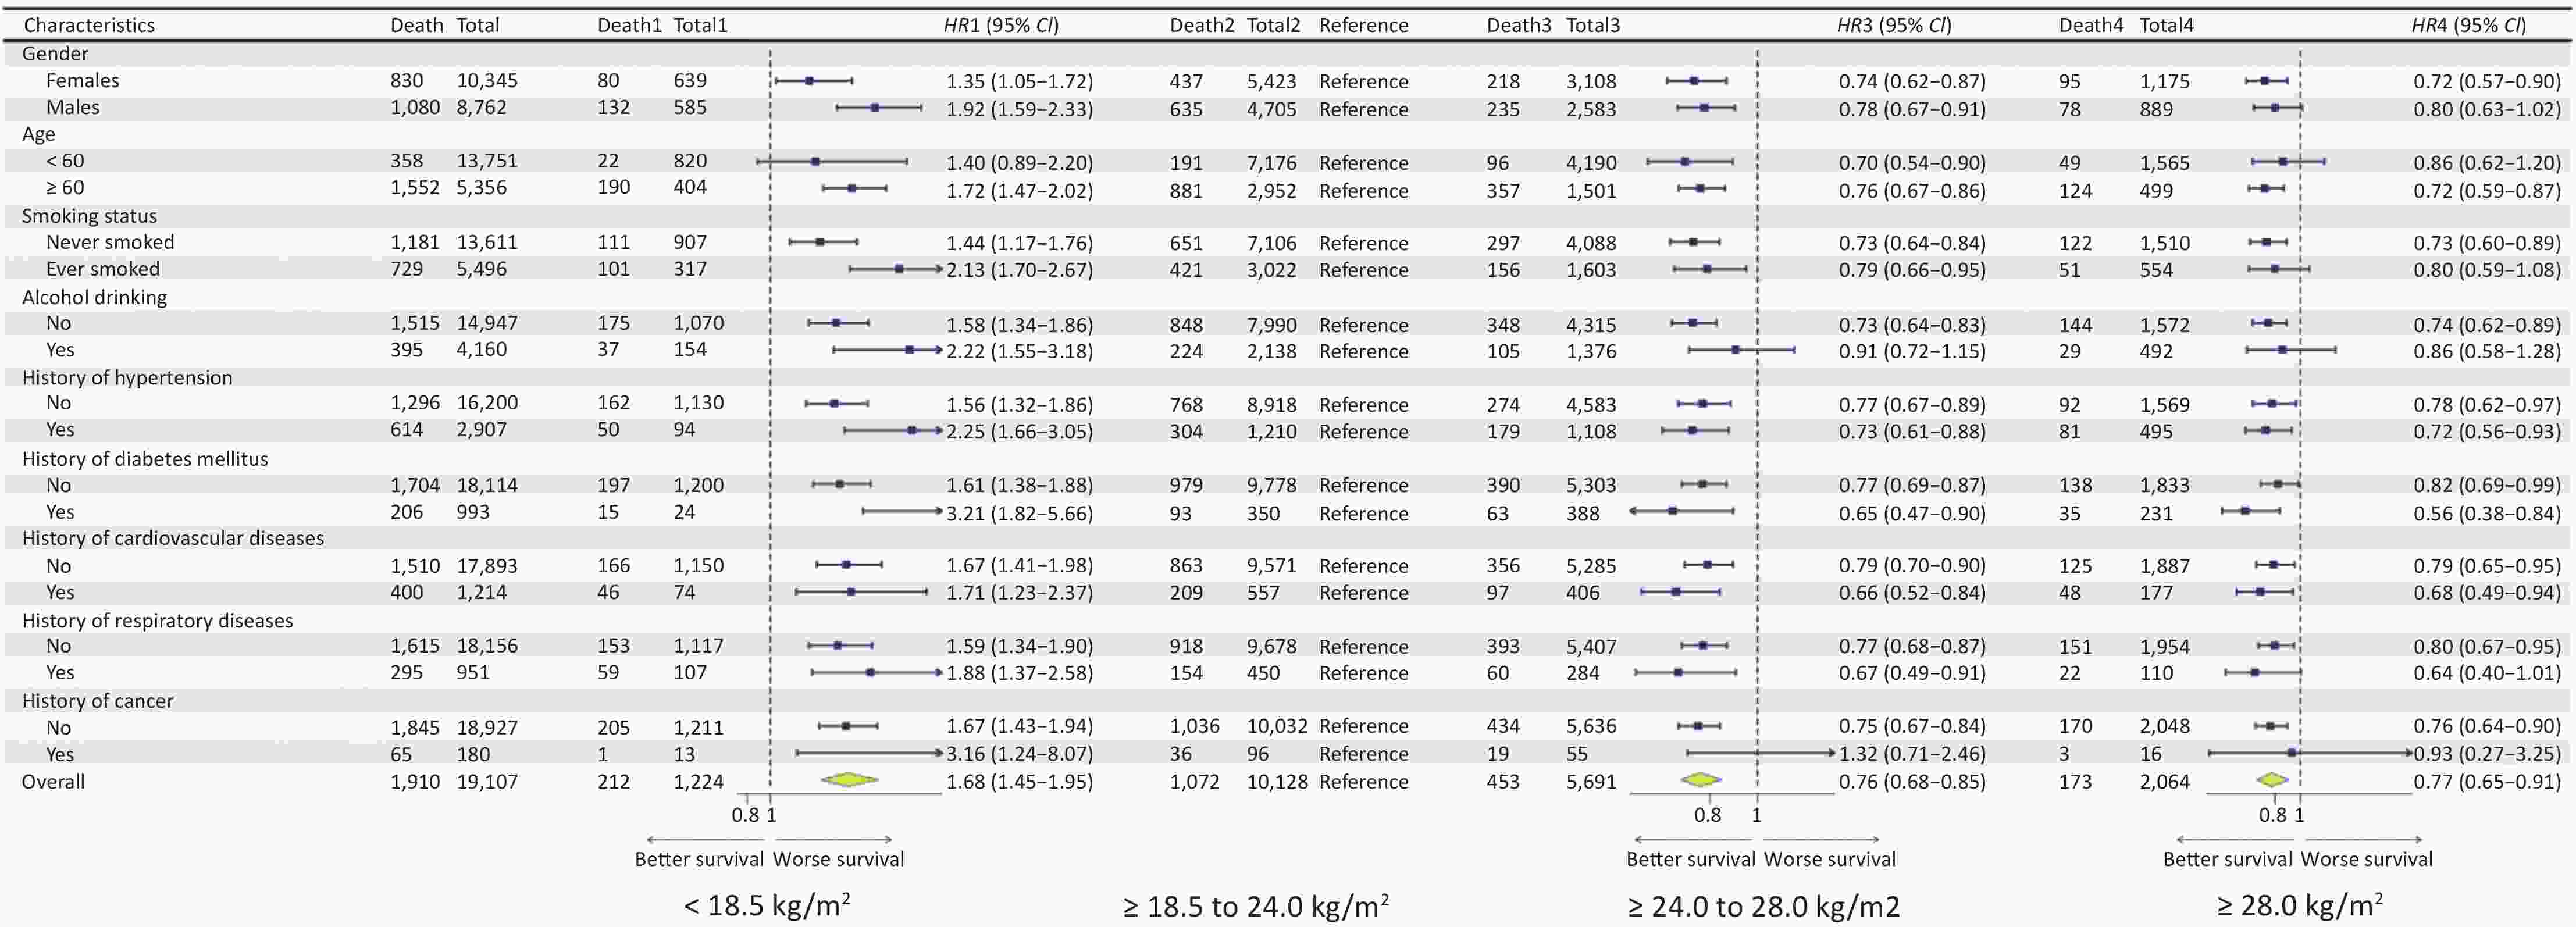
Figure 2. Subgroup analysis for the associations between BMI and all-cause mortality in 10 years.
-
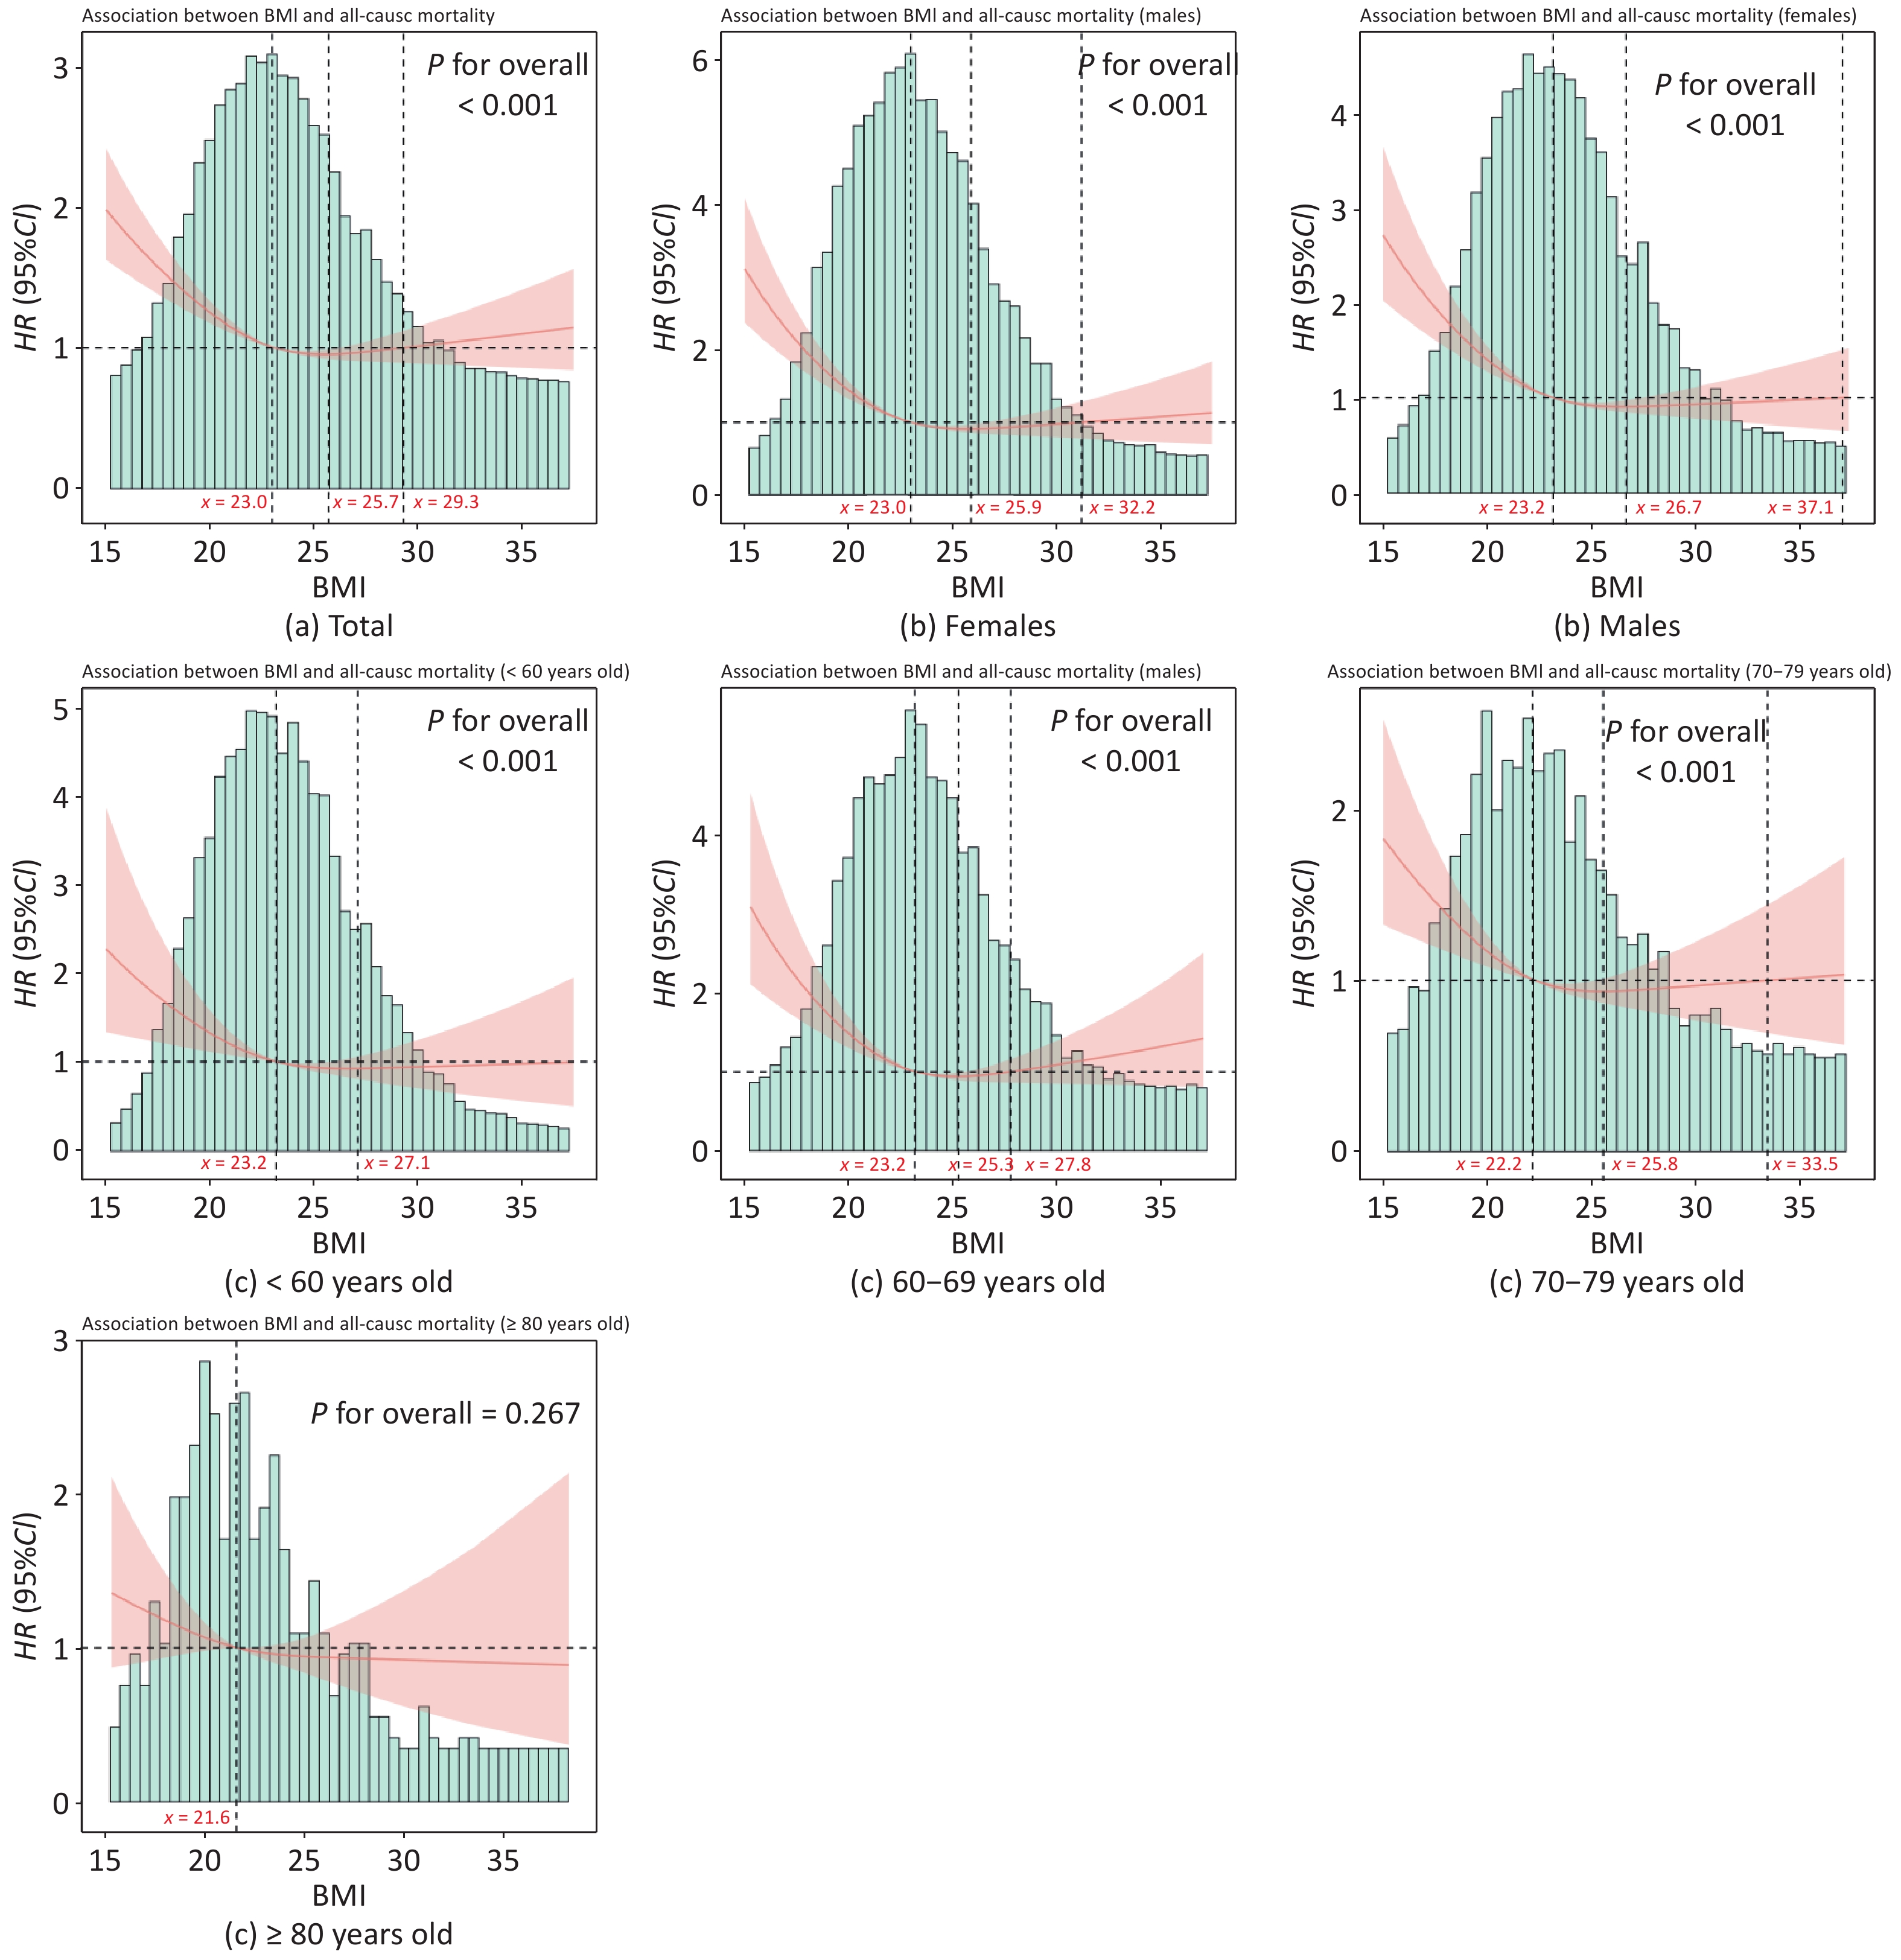
Similar results were observed in the continuous analysis using restricted cubic splines, revealing a U-shaped association between BMI and the risk of all-cause death (Figure 3). Among the overall population, the risk of all-cause death was minimal at 23.0–29.3 kg/m2 (aHR < 1), with a significant increase observed both below and above this range (aHR > 1). The nadir for the risk of death was estimated to be 25.7 kg/m2 (aHR = 0.95, 95% CI: 0.92–0.98). Subgroup analyses stratified by sex and age did not alter the U-shaped association, except for those aged ≥ 80 years. A reverse J-shaped association between BMI and the risk of death was found, with a nadir of 21.6 kg/m2 for individuals aged ≥ 80 years, but the association did not reach statistical significance (P = 0.267).
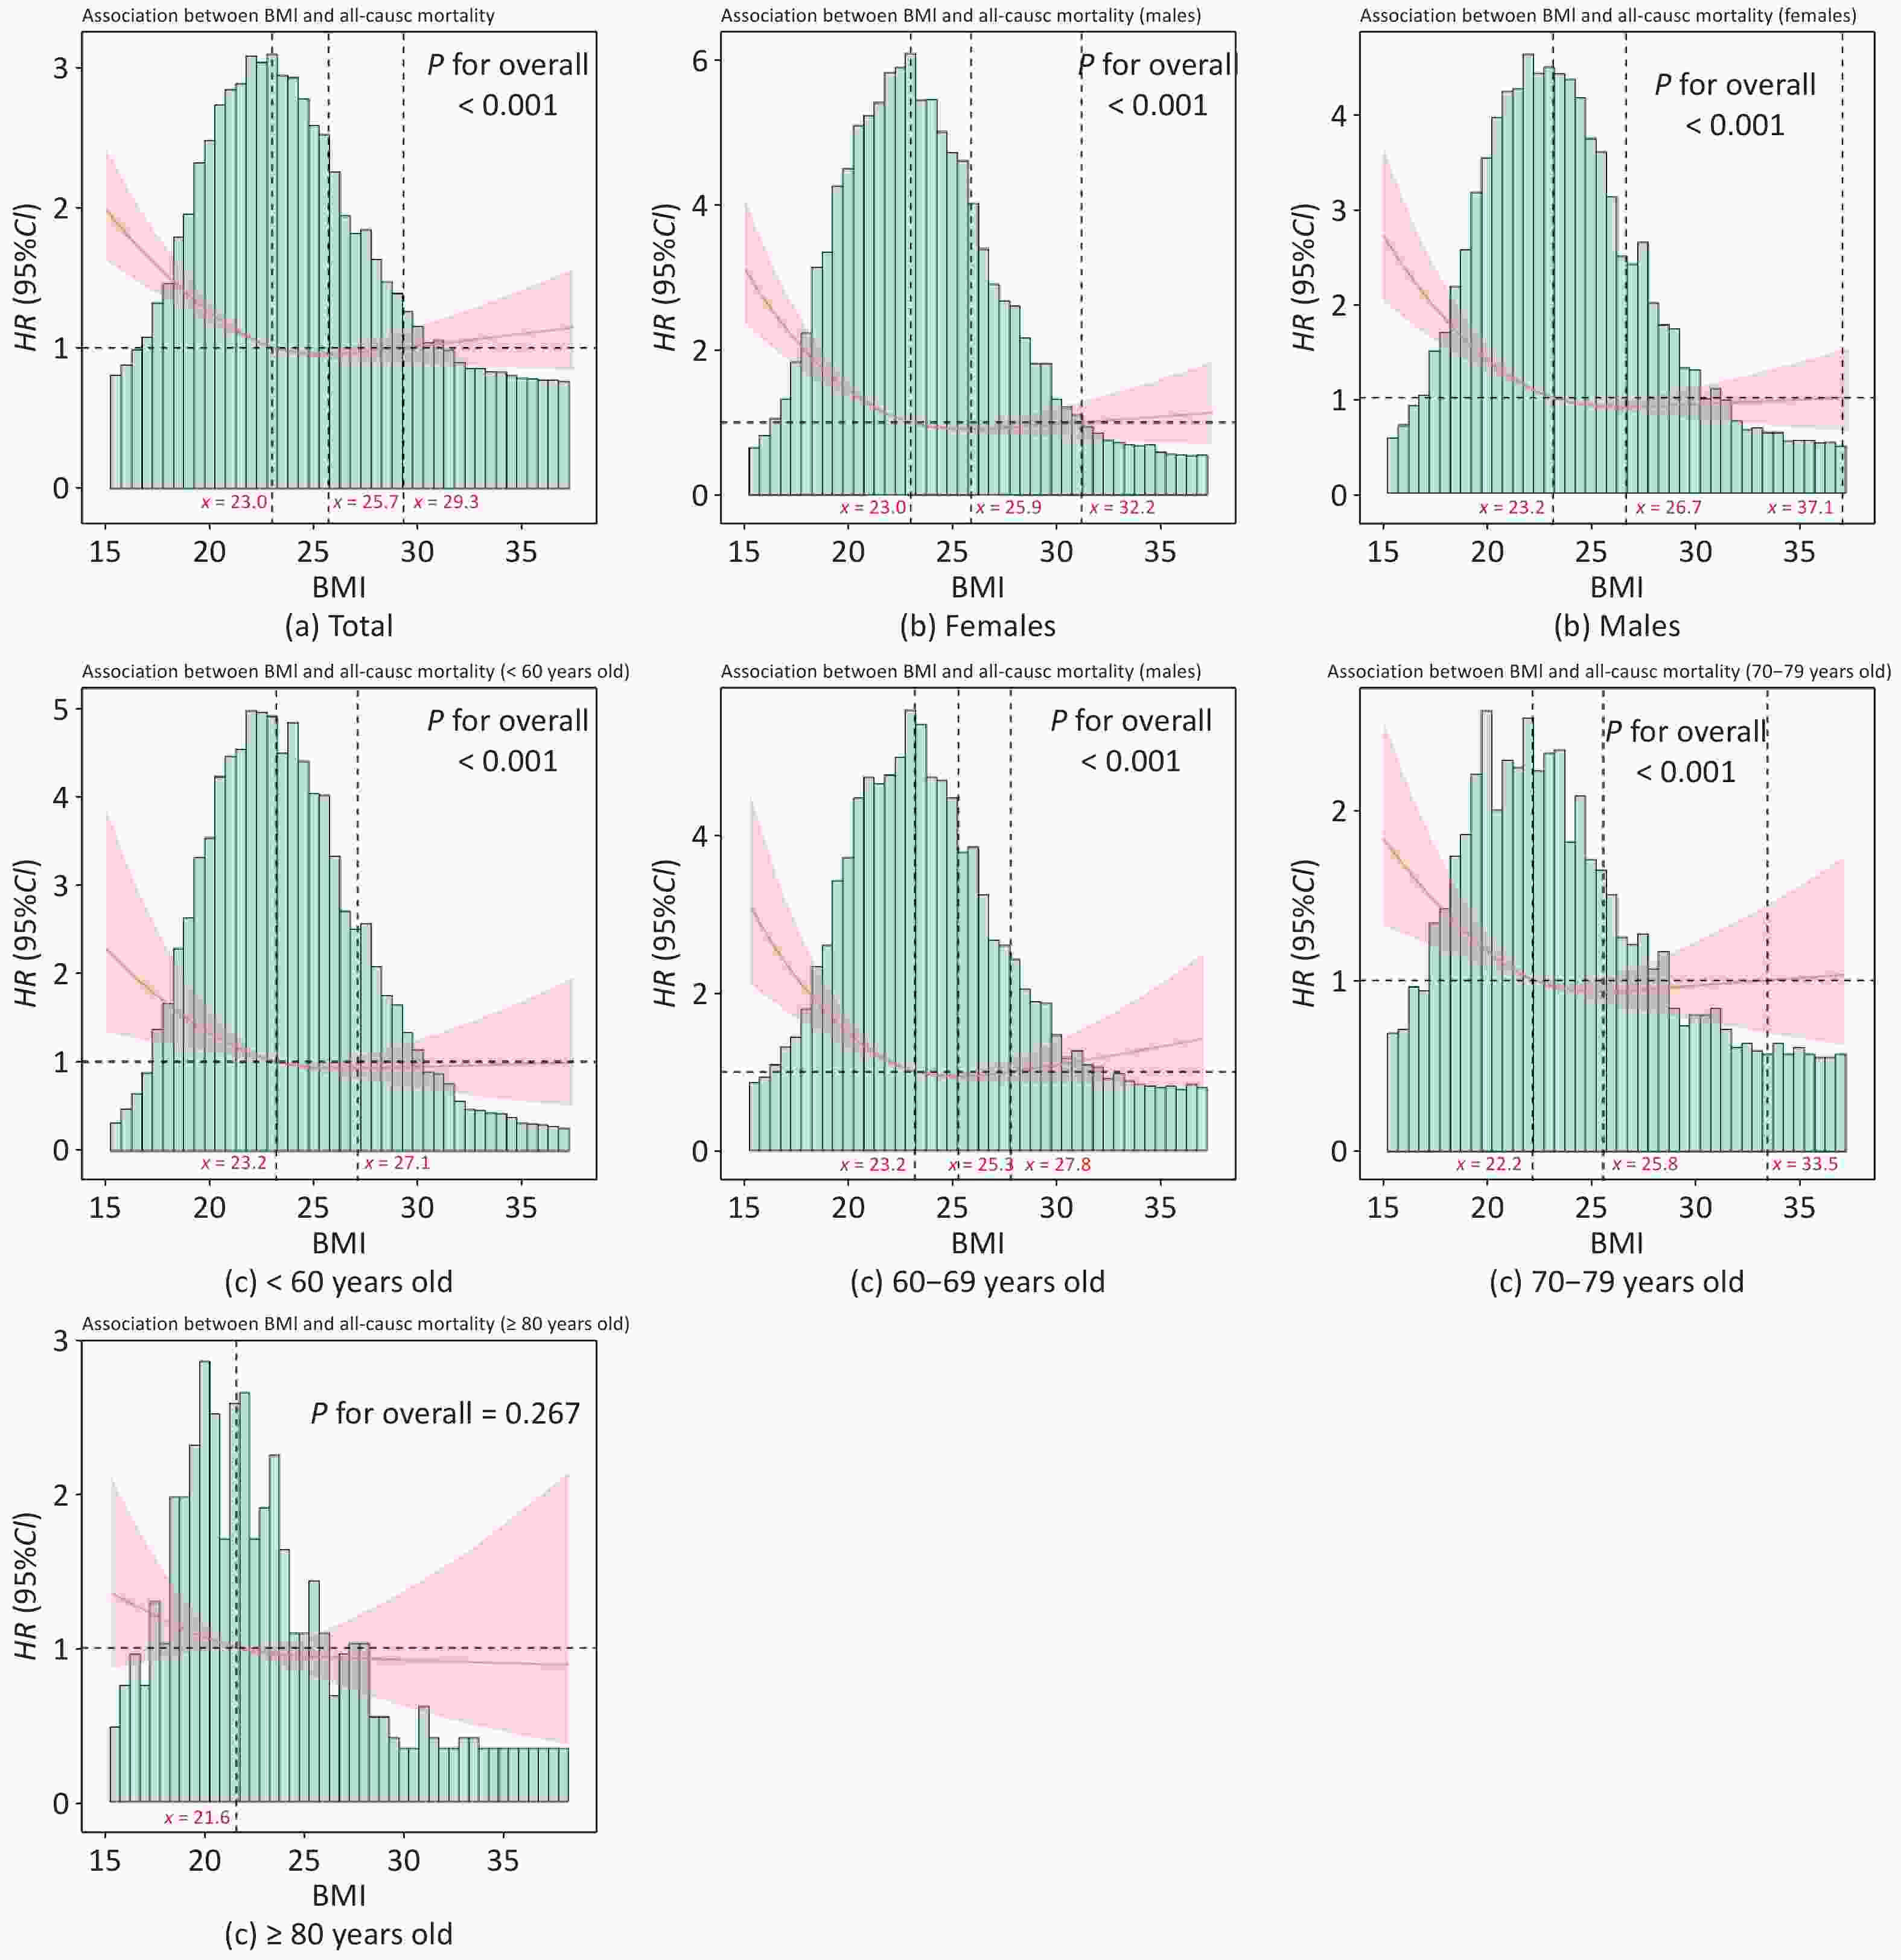
Figure 3. Continuous association between BMI and all-cause mortality in 10 years in different sex and age groups.
-
The cause-specific mortalities were 5.22 (851/163,095), 1.19 (194/163,095), 2.64 (430/163,095) and 2.67 (435/163,095) per 1,000 person-years for individuals who died of CVD, respiratory diseases, cancer, and other reasons (including traffic accidents, suicide and other diseases), respectively. Underweight was consistently found to be significantly associated with increased cause-specific mortality, except for cancer. The reverse relationships between being overweight and death of CVD and respiratory disease persisted, whereas no significant relationships were found between obesity and cause-specific mortality (Table 3).
Cause-specific mortality Incidence of death per 1,000 person-years BMI Underweight (< 18.5 kg/m2) Desirable (≥ 18.5 to < 24.0 kg/m2) Overweight (≥ 24.0 to < 28.0 kg/m2) Obesity (≥ 28.0 kg/m2) Incidence of death1 per 1000 person–years aHR1
(95% CI)aIncidence of death2 per 1000 person–years aHR2
(95% CI)aIncidence of death3 per 1000 person–years aHR3
(95% CI)aIncidence of death4 per 1000 person–years aHR4
(95% CI) aCVD mortality 851/163,095
(5.22)94/9,394
(10.01)2.09 (1.59–2.74) 476/85,275
(5.58)Reference 189/49,925
(3.79)0.52 (0.40–0.67) 92/18,500
(4.97)0.46 (0.29–0.74) Respiratory diseases mortality 194/163,095
(1.19)42/9,394
(4.47)1.78 (1.08–2.91) 114/85,275
(1.34)Reference 26/49,925
(0.52)0.49 (0.28–0.86) 12/18,500
(0.65)0.84 (0.34–2.13) Cancer mortality 430/163,095
(2.64)30/9,394
(3.19)1.54 (0.98–2.41) 243/85,275
(2.85)Reference 127/49,925
(2.54)0.79 (0.55–1.12) 30/18,500
(1.62)0.46 (0.22–0.94) Other reasons mortality 435/163,095
(2.67)46/9,394
(4.90)2.16 (1.40–3.32) 239/85,275
(2.80)Reference 111/49,925
(2.22)0.67 (0.45–1.00) 39/18,500
(2.11)0.46 (0.21–0.97) Note. BMI, body mass index. aHR, adjusted hazard ratio. Data are presented as n/N (%), unless otherwise specified. BMI was classified into four categories according to Chinese standard: Underweight (< 18.5.0 kg/m2), Desirable weight (≥ 18.5 to < 24.0 kg/m2) (reference), Overweight (≥ 24.0 to < 28.0 kg/m2), and Obesity (≥ 28.0 kg/m2). a Adjusted for sex, age, education level, marital status, per income, smoking status, current alcohol drinking status, history of hypertension, diabetes mellitus, cardiovascular diseases, respiratory diseases and cancer, study sites of participants, frequency of meat intake, frequency of bean intake, and job intensity, using Cox models. Table 3. Associations between BMI and cause-specific mortality in 10 years
In the sensitivity analyses, the associations between BMI and all-cause or cause-specific mortality remained unchanged, as shown in Supplementary Table S1.
-
Our study investigated the association between BMI and all-cause mortality in the general population in a 10-year population-based cohort study conducted in rural China. Individuals with a BMI < 18.5 kg/m2 had a 2fold risk of all-cause death, and individuals with a BMI ≥ 24.0 kg/m2 were associated with one-fourth reduction of all-cause mortality compared to the desirable BMI group (≥ 18.5 to < 24 kg/m2), after adjusting for potential confounders. Further qualitative analysis revealed that the risk of all-cause mortality decreased rapidly to the lowest BMI of 25.7 kg/m2 and then increased slightly above this value, presenting a U-shaped association. The results were robust in most subgroups, and the sensitivity analysis did not change our main results. Our findings provide additional evidence for the “obesity paradox” and have substantial implications for guiding weight management among the general rural population.
We observed U-shaped associations between BMI and all-cause mortality in the general population aged 15 years and older. All-cause mortality decreased at 23.0–29.3 kg/m2 and increased significantly below and above this range, indicating that overweight was negatively associated with mortality, whereas underweight and obesity, especially severe obesity, positively influenced mortality. Our results are supported by recent studies[21–23]. A prospective study of 4,565 older adults (≥ 65 years old) in rural America, overweight (≥ 25.0 to < 30.0 kg/m2) and mild obesity (class Ι obesity, ≥ 30 to < 35 kg/m2) were associated with a lower mortality, while underweight (< 18.5 kg/m2) individuals had a higher mortality among different characteristic populations[21]. Similarly, a meta-analysis involving 97 studies with sample sizes of more than 2.88 million participants and 27,000 deaths reported HRs of 0.94 (95% CI: 0.91–0.96) for overweight (≥ 25.0 to < 30.0 kg/m2), 0.95 (95% CI: 0.88–1.01) for grade 1 obesity, and 1.29 (95% CI: 1.18–1.41) for grades 2 and 3 obesity, based on the BMI criteria of the WHO[22]. Although the WHO criteria differ from the Chinese criteria, the trends were consistent. These findings indicate that appropriate extra fat could be beneficial, but being underweight and having too much fat might increase mortality. Several potential mechanisms can explain this phenomenon. Underweight individuals have widespread nutritional deficiencies, including an insufficient intake of proteins, vitamins, and minerals, which may compromise immune function and increase the risk of falls and fractures[24,25]. Furthermore, metabolic disorders such as hyperthyroidism and adrenocortical insufficiency may arise, leading to increased energy expenditure and negatively affecting nutrient absorption and utilization, thereby exacerbating malnutrition and mortality. Conversely, overweight and mildly obese individuals may benefit from sufficient nutrients that allow them to maintain normal function during illness, malnutrition, or injury, owing to the energy support of extra fat[26]. Overweight and mild obesity may strengthen immune function through beneficial molecules such as adiponectin, which possesses anti-inflammatory and anti-atherosclerotic properties. Moreover, the risk of fracture, an important cause of mortality, might be reduced owing to extra fat, which is a protective factor against osteoporosis[27]. Compared with normal-weight patients, patients with moderate obesity are twice as likely to experience in-hospital complications, which may increase mortality[28]. The proinflammatory milieu of cytokines and adipokines, along with altered functions of monocytes and macrophages in obese patients, may contribute to in-hospital complications[29].
In our study, a reverse J-shaped association was found in the population older than 80 years. Although the results were not statistically significant, they were in agreement with those of a Mendelian randomization study conducted in participants older than 80 years[18], which reported that each 1 kg/m2 increase in genetically predicted BMI was associated with a 4.5% decrease in all-cause mortality (HR = 0.96, 95% CI: 0.96–0.97). Older individuals with excess fat may have a better nutritional status and be better able to prevent the adverse consequences caused by falling or fractures. Moreover, the “survival effect” suggests that individuals who are more vulnerable to the complications of obesity may have already died, resulting in a more resilient population[30]. Finally, gene expression is closely associated with the mechanisms underlying healthy aging and longevity in individuals with extended lifespans[31,32], which may extend beyond the explanatory power of BMI alone.
In this study, the notable associations of underweight with increased all-cause mortality and of overweight with decreased all-cause mortality persisted for cause-specific mortality, including CVD and respiratory disease mortality. However, these profound associations have not been observed in obesity. Previous studies have reported contradictory findings. A study with a median follow-up of 1.8 years reported that both overweight (HR = 0.74, 95% CI: 0.65–0.84) and obesity (HR = 0.68, 95% CI: 0.60–0.78)[33] decreased CVD mortality (including from stroke, systemic embolism, and myocardial infarction). A 10-year prospective study conducted among Asian patients with obstructive coronary artery disease found no increase in CVD mortality attributable to obesity[34]. Nonetheless, another study with a 20-year follow-up reported an association between obesity and mortality in patients with stable coronary artery disease[35]. The length of follow-up and the varied clinical and demographic characteristics of the study population made it difficult to draw robust conclusions. Regarding respiratory mortality, a meta-analysis of clinical trials explored the relationship between BMI and the decline in FEV1, an indicator of lung function, in patients with chronic respiratory conditions. It has also been reported that a lower BMI is associated with a faster decrease in FEV1, and a higher BMI is associated with a slower decrease in FEV1, suggesting that weight gain might be a measure for therapeutic intervention in chronic respiratory diseases. A previous study investigated the prospective association between peri-diagnostic (within 1-year post-diagnosis) BMI and all-cause mortality in 114,430 patients with cancer. Compared with the desirable BMI (≥ 18.5 to < 25.0 kg/m2), the hazard ratios were 0.85 (95% CI: 0.83–0.87) for the overweight (≥ 25.0 to < 30.0 kg/m2) and 0.82 (95% CI: 0.80–0.85) for the obese (≥ 30.0 kg/m2), with these associations being generally consistent across cancer types and various subgroups. However, we did not observe any associations between BMI and cancer-related mortality. A possible reason for this discrepancy might be the timing of the BMI measurement. In our study, BMI was measured at baseline rather than during the peri-diagnostic period, with a median time of 4.45 years from baseline to cancer diagnosis. Given that weight loss is a common symptom of cancer and that an obese BMI has been associated with increased life expectancy in some contexts, these factors may influence the observed association between BMI and mortality.
This study has several limitations that warrant discussion. First, despite adjusting for a range of confounders, the effects of residual confounding factors could not be fully excluded. However, neither the subgroup analysis nor the sensitivity analysis contradicted our main findings. Second, BMI was measured only once at baseline, which precludes the evaluation of the relationship between longitudinal changes in BMI and outcomes. Thirdly, data on anthropometric measures such as body composition (body fat to lean body mass) or physical activity were not captured in this cohort and could have provided insight into the “obesity paradox”. In the future, a more comprehensive and accurate health assessment model or indicator that considers waist circumference, body fat percentage, and muscle content should be established. Fourth, this study focused on participants from rural China. Owing to differences caused by the environment, lifestyle, and diet, our findings might not be applicable to urban populations.
This study provides further evidence of the complex relationship between BMI and mortality. Overweight and mild obesity positively affect mortality, indicating the need for tailored approaches to health and weight management. Nutritional support is necessary to reduce adverse outcomes and decrease mortality rates among underweight patients. For obese individuals, an appropriate approach and management, including lifestyle modifications such as dietary regulation and physical activity, should be considered according to age, comorbidities, and BMI. Further investigation is required to better understand the association between obesity and mortality, which might be analyzed across diverse populations using various indicators that define obesity and its evolving trends.
Association of Body Mass Index with All-cause Mortality and Cause-specific Mortality in Rural China: 10-year Follow-up of a Population-based Multicenter Prospective Study
doi: 10.3967/bes2025.128
- Received Date: 2025-01-09
- Accepted Date: 2025-09-25
-
Key words:
- Body mass index /
- Mortality /
- Overweight /
- Prospective study /
- Underweight
Abstract:
The authors declare no competing interests.
&These authors contributed equally to this work.
| Citation: | Juanjuan Huang, Yuanzhi Di, Lingyu Shen, Jianguo Liang, Jiang Du, Xuefang Cao, Weitao Duan, Aiwei He, Jun Liang, Limei Zhu, Zisen Liu, Fang Liu, Shumin Yang, Zuhui Xu, Cheng Chen, Bin Zhang, Jiaoxia Yan, Yanchun Liang, Rong Liu, Tao Zhu, Hongzhi Li, Fei Shen, Boxuan Feng, Yijun He, Zihan Li, Yaqi Zhao, Tonglei Guo, Liqiong Bai, Wei Lu, Qi Jin, Lei Gao, Henan Xin. Association of Body Mass Index with All-cause Mortality and Cause-specific Mortality in Rural China: 10-year Follow-up of a Population-based Multicenter Prospective Study[J]. Biomedical and Environmental Sciences. doi: 10.3967/bes2025.128

|

 Quick Links
 DownLoad: