-
The prevalence of type 2 diabetes mellitus (T2DM) has increased steadily in recent decades, with the global age-standardized prevalence projected to reach 9.8% by 2050[1]. As a leading cause of cardiovascular disease and mortality[2], T2DM imposes substantial health[3] and economic[4] burdens. Established modified risk factors, such as physical inactivity[5] and unhealthy diet[6], contribute significantly to its development. Enhancing our understanding of the modifiable T2DM risk factors is crucial for developing effective prevention and control strategies.
Long-term exposure to ambient fine particulate matter (PM2.5) has emerged as a significant risk factor for T2DM[7-13]. According to the Global Burden of Disease study, ambient PM2.5 exposure may be responsible for approximately 13.4% of T2DM-related deaths and 13.6% of the associated disability-adjusted life years (DALYs)[14]. A previous meta-analysis of studies from Europe and North America reported an 8–10% increase in T2DM risk per 10 μg/m3 increment in PM2.5 concentration[12]. PM2.5 is a complex mixture containing constituents, such as black carbon (BC), ammonium (NH4+), nitrate (NO3-), organic carbon (OC), sulfate (SO42-), and soil dust, each with a distinct toxicological profile[15]. While limited cross-sectional studies have explored the associations between individual PM2.5 constituents and T2DM,[16-18] their long-term impacts remain unclear[19,20]. Prospective investigations are warranted to identify key hazardous constituents and guide targeted strategies to reduce the PM2.5-attributable T2DM burden.
Previous studies have shown that air pollution can lead to adverse health effects via inflammation and oxidative stress[21,22]. Moreover, being overweight increases the risk of developing diabetes through inflammation[23]. Therefore, air pollution and overweight status may contribute to diabetes via shared mechanisms. We hypothesize that overweight status may play a role in the PM2.5 –T2DM relationship. However, findings regarding the modifying effect of overweight status on this association are inconsistent[24-26]. whether overweight acts as an effect modifier is essential for identifying populations susceptible to PM2.5-related T2DM.
Therefore, this study aims to (1) investigate the association between long-term exposure to ambient PM2.5 mass and its chemical constituents and the risk of T2DM incidence, and (2) determine whether being overweight modifies this association.
-
The Rural Deqing Cohort Study (RDCS) is a prospective cohort established in Deqing County, Zhejiang Province, China. Between 2006–2008, 2011–2012, and 2013–2014, a total of 29,229 residents aged ≥ 18 years were recruited from 65 villages across eight rural townships. The detailed study design and participant inclusion criteria have been published previously.[27] The study protocol was approved by the Institutional Review Board of the School of Public Health, Fudan University (Approval Nos. #07-06-0099, #2011-03-0624, #2014-03-480, #2022-04-0956). All participants provided written informed consent at enrollment.
In the current analysis, we excluded participants who were lost to follow-up (n = 295), those younger than 18 years (n = 76), those diagnosed with T2DM at baseline (n = 1,317), and those with missing information on sex (n = 23) or detailed address (n = 11). Consequently, 27,507 eligible participants were included in the final analysis (Supplementary Figure S1).
-
The PM2.5 mass and six main chemical constituents, namely BC, OC, NH4+, NO3-, SO42-, and soil dust, were assessed using a Combined Geoscience Statistical Method (CGSM) developed by the Atmospheric Composition Analysis Group at Dalhousie University[28]. The CGSM methodology has been previously documented[29]. The annual average ground-level concentrations of PM2.5 and constituents were derived from a satellite-based prediction model, which offered estimates at a spatial resolution of 1 km × 1 km for the Deqing County region. Subsequently, these estimates were mapped to the geocoded residential addresses corresponding to the year of enrollment. Detailed information regarding the PM2.5 mass estimate in Deqing County has been provided in an earlier study[30].
-
All participants were followed up annually for incident T2DM from enrollment to October 31st, 2021, via linkage to the Deqing electronic health records system. T2DM was defined if participants met either of the following criteria: (1) self-reported physician diagnosis of diabetes or use of anti-diabetic medications; and/or (2) fasting plasma glucose ≥ 7.0 mmol/L.[31]
-
Data on overweight status and other covariates were collected at baseline. Trained health professionals collected anthropometric data, including body weight and height, to calculate the body mass index (BMI) as weight in kilograms divided by height in meters squared (kg/m2). BMI was categorized according to the Chinese standard (non-overweight: BMI < 24.0 kg/m2, overweight: BMI ≥ 24.0 kg/m2)[32]. Baseline data on demographic characteristics (age, sex, educational attainment, occupation, household income, and residential address), lifestyle (smoking, alcohol consumption, physical activity, diet, and tea consumption), family history of T2DM, and history of chronic diseases were collected using a structured questionnaire. Ever smokers (including former or current smokers) were defined as having smoked at least one cigarette daily for over six months in life[33]. Alcohol consumption was defined as drinking any alcohol at least once per week[33]. Regular physical activity was defined as engaging in at least 30 min of exercise once a week[33]. Tea consumption was defined as daily consumption of any type of tea. Comorbid chronic diseases were defined as having been diagnosed in any secondary or tertiary hospital with at least one of the following diseases: hypertension, asthma, stroke, coronary heart disease, chronic obstructive pulmonary disease, or malignant tumors.
-
Baseline characteristics were summarized according to outcome status. Differences among groups were assessed using the Student’s t-test for continuous variables and the chi-square test for categorical variables. Spearman correlations were used to evaluate associations with air pollutants. The person-years (PYs) were calculated from the date of enrollment to the earliest occurrence of the first diagnosis of T2DM, death, or the end of the current follow-up (October 31st, 2021). Cox proportional hazard regression models were employed to estimate the hazard ratios (HRs) and corresponding 95% confidence intervals (CIs) for the associations between PM2.5 and its constituents, and risk of T2DM incidence. The proportional hazards assumption was tested, and all models were met. Based on previous studies and data accessibility, the following potential confounders were adjusted in Model 1: age (<40, 40–50, 50–60, 60–70, and ≥70 years), sex, and stratified by baseline year (2006–2008, 2011–2012, and 2013–2014). In Model 2, we further included education attainment (< 9 or ≥ 9 years), occupation (farmer, other, and missing), household income (low, middle, high), smoking status (never or ever), alcohol consumption (yes or no), regular physical activity (yes, no, and missing), diet (vegetable mainly, meat mainly, and equally), tea consumption (yes or no), family history of diabetes (yes or no), and history of chronic diseases (yes or no). For PM2.5 and individual constituents, HRs were estimated using both continuous (per 10 μg/m3 increase for PM2.5, per interquartile range [IQR] increase for individual constituents) and categorical (in quartiles) approaches with single-constituent models.
To examine the potential nonlinear exposure-response relationship, we fitted a multivariable Cox model incorporating restricted cubic splines with four knots at the 5th, 35th, 65th, and 95th percentiles of each pollutant. The minimum pollutant concentrations were set as the reference values.
We also performed subgroup analyses by overweight status to evaluate its modifying effect and included the cross-product term in the overall model to test for interactions on a multiplicative scale. Additionally, we estimated the joint association of PM2.5, its constituents (in quartiles), and overweight on the risk of T2DM incidence. The relative excess risk due to interaction (RERI) was used to calculate the interaction on an additive scale, with an interaction unequal to zero indicating significance.
To assess the robustness of the results, several sensitivity analyses were conducted. First, new T2DM cases diagnosed within the first two years of follow-up were excluded to account for potential reverse causality. Second, individuals with prevalent chronic diseases at baseline were excluded. Third, utilizing different exposure time windows: i) exposure level at the baseline year with a one-year lag, and ii) average concentration from 2006–2016. Participants enrolled in the cohort in 2006 were excluded from the one-year lag analysis when exposure was unavailable. Last, models were established after residual adjustment. The residuals were obtained from the linear model, where the dependent variable is the PM2.5 levels and the independent variables are the various components.
Analyses were performed in R software (version 4.0.3; R Foundation for Statistical Computing, Vienna, Austria) using the “survival” package for the Cox regression and “rms” package for the restricted cubic spline. All statistical tests were two-sided, and P<0.05 was considered statistically significant.
-
Table 1 presents the baseline characteristics of the study population stratified by incident T2DM status. Among the 27,507 eligible participants (44.30% were men; mean age 56.79 ± 14.51 years), 3,001 new T2DM cases were identified during a median follow-up of 9.4 years. Compared with participants without T2DM, those who developed T2DM were older, had a higher household income, elevated BMI, greater prevalence of family history of diabetes, and history of chronic disease, and reported higher rates of regular physical activity at baseline. Moreover, incident T2DM cases had lower educational attainment and were less likely to report a balanced diet.
Characteristic Total
(N = 27,507)Non-T2DM
(n = 24,506)T2DM
(n = 3,001)P value Age (years, SD) 56.79 ± 14.51 56.55 ± 14.80 58.70 ± 11.61 < 0.001 18.0− 3,275 (11.91) 3,114 (12.71) 161 (5.36) < 0.001 40.0− 5,543 (20.15) 5,034 (20.54) 509 (16.96) 50.0− 7,064 (25.68) 6,138 (25.05) 926 (30.86) 60.0− 6,653 (24.19) 5,745 (23.44) 908 (30.26) ≥70.0 4,972 (18.08) 4,475 (18.26) 497 (16.56) Men 12,185 (44.30) 10,884 (44.41) 1,301 (43.35) 0.278 Farmera 20,501 (74.53) 18,235 (74.41) 2,266 (75.51) 0.327 Education >9 years 5,619 (20.43) 5,136 (20.96) 483 (16.09) < 0.001 Household income 0.008 Low 4,015 (14.60) 3,592 (14.66) 423 (14.10) Middle 21,336 (77.57) 19,036 (77.68) 2,300 (76.64) High 2,156 (7.84) 1,878 (7.66) 278 (9.26) Ever smoker 6,335 (23.03) 5,661 (23.10) 674 (22.46) 0.445 Alcohol consumption 5,197 (18.89) 4,643 (18.95) 554 (18.46) 0.537 Regular physical activity a 2,771 (10.07) 2,448 (9.99) 323 (10.76) < 0.001 Diet 0.013 Vegetable mainly 3,737 (13.59) 3,318 (13.54) 419 (13.96) Meat mainly 3,357 (12.20) 2,944 (12.01) 413 (13.76) Equally 20,413 (74.21) 18,244 (74.45) 2,169 (72.28) Tea consumption 10,635 (38.66) 9,457 (38.59) 1,178 (39.25) 0.494 BMI (kg/m2) 22.54 ± 2.96 22.42 ± 2.90 23.49 ± 3.29 < 0.001 < 18.5 1,829 (6.65) 1,693 (6.91) 136 (4.53) 18.5- 17,233 (62.65) 15,634 (63.80) 1,599 (53.28) 24.0- 7,482 (27.20) 6,453 (26.33) 1,029 (34.29) ≥ 28.0 963 (3.50) 726 (2.96) 237 (7.90) Family history of diabetes 379 (1.38) 312 (1.27) 67 (2.23) < 0.001 History of chronic disease 10,195 (37.06) 8,693 (35.47) 1,502 (50.05) < 0.001 Note. Descriptive statistics are presented as mean ± standard deviation for continuous variables and as N (%) for categorical variables. Student’s t-test was used for continuous variables, and the chi-square test was used for categorical variables. a missing data. Abbreviation: T2DM, type 2 diabetes; BMI, body mass index. Table 1. Baseline characteristics of the study population
The average baseline PM2.5 mass concentration was 50.88 μg/m3. Among six chemical constituents, the highest concentration of PM2.5 mass was observed in NO3- (14.17 μg/m3), followed by SO42- (13.06 μg/m3), NH4+ (8.91 μg/m3), OC (8.90 μg/m3), BC (3.23 μg/m3), and soil dust (2.64 μg/m3) (Supplementary Table S1). Strong correlations were observed between the total PM2.5 mass and six chemical constituents, with Spearman correlation coefficients ranging from 0.78 to 0.97 (Supplementary Table S2).
-
Long-term exposure to ambient PM2.5 was significantly associated with an increased risk of incident, both at the continuous level (HR: 1.30; 95% CI: 1.17, 1.45; per 10 μg/m3 increase) and categorical level (HRQ4 vs. Q1:1.66; 95% CI: 1.42, 1.94) in the fully adjusted model (Table 2). Among the six chemical constituents, the strongest adverse association with T2DM was observed for BC, followed by SO42-, NO3-, NH4+, OC, and soil dust, with HRs ranging from 1.15 to 1.33 per IQR increase in concentration. Restricted cubic spline analysis revealed a significant nonlinear association between PM2.5 and the risk of T2DM incidence (overall P <0.001, nonlinear P = 0.005; Figure 1). Similar nonlinear associations were observed for BC, NH4+, and NO3- (overall and nonlinear P < 0.05), whereas OC and SO42- exhibited linear associations (overall P < 0.05, nonlinear P > 0.05) (Supplementary Figure S2).
Pollutants Model 1 Model 2 HR (95% CI) P value HR (95% CI) P value PM2.5 a 1.32 (1.19, 1.46) <0.001 1.30 (1.17, 1.45) <0.001 Q1 1.00 1.00 Q2 1.25 (1.13, 1.39) <0.001 1.23 (1.10, 1.37) <0.001 Q3 1.16 (1.03, 1.31) 0.02 1.17 (1.03, 1.33) 0.02 Q4 1.72 (1.48, 2.01) <0.001 1.66 (1.42, 1.94) <0.001 BC b 1.35 (1.22, 1.50) <0.001 1.33 (1.19, 1.48) <0.001 Q1 1.00 1.00 Q2 1.12 (1.00, 1.25) 0.045 1.10 (0.98, 1.23) 0.097 Q3 1.13 (0.99, 1.28) 0.06 1.14 (1.00, 1.30) 0.049 Q4 1.66 (1.42, 1.93) <0.001 1.59 (1.36, 1.87) <0.001 OC b 1.19 (1.08, 1.31) 0.001 1.19 (1.08, 1.32) <0.001 Q1 1.00 1.00 Q2 1.23 (1.07, 1.41) 0.004 1.19 (1.03, 1.37) 0.015 Q3 1.27 (1.09, 1.47) 0.002 1.28 (1.10, 1.49) 0.002 Q4 1.48 (1.27, 1.74) <0.001 1.42 (1.20, 1.67) <0.001 NH4+ b 1.24 (1.15, 1.33) <0.001 1.22 (1.13, 1.31) <0.001 Q1 1.00 1.00 Q2 1.01 (0.91, 1.13) 0.83 1.02 (0.92, 1.14) 0.719 Q3 1.06 (0.95, 1.19) 0.29 1.07 (0.96, 1.21) 0.223 Q4 1.65 (1.42, 1.90) <0.001 1.60 (1.38, 1.85) <0.001 NO3- b 1.26 (1.14, 1.39) <0.001 1.24 (1.12, 1.37) <0.001 Q1 1.00 1.00 Q2 1.06 (0.90, 1.24) 0.51 1.09 (0.93, 1.28) 0.271 Q3 1.04 (0.88, 1.23) 0.64 1.08 (0.91, 1.28) 0.369 Q4 1.56 (1.31, 1.84) <0.001 1.53 (1.29, 1.82) <0.001 SO42- b 1.30 (1.20, 1.42) <0.001 1.27 (1.16, 1.39) <0.001 Q1 1.00 1.00 Q2 1.16 (1.03, 1.30) 0.01 1.16 (1.03, 1.30) 0.014 Q3 1.15 (0.98, 1.34) 0.09 1.15 (0.98, 1.35) 0.091 Q4 1.47 (1.25, 1.73) <0.001 1.41 (1.19, 1.67) <0.001 Soil dust b 1.14 (1.02, 1.28) 0.02 1.15 (1.02, 1.29) 0.03 Q1 1.00 1.00 Q2 0.93 (0.82, 1.07) 0.31 0.93 (0.81, 1.07) 0.294 Q3 1.18 (1.03, 1.35) 0.02 1.18 (1.02, 1.35) 0.024 Q4 1.11 (0.93, 1.33) 0.25 1.09 (0.91, 1.31) 0.367 Note. a per 10 μg/m3 increase; b per IQR increase (BC, 0.65 μg/m3; OC, 1.72 μg/m3; NH4+, 1.28 μg/m3; NO3-, 2.79 μg/m3; SO42-, 2.43 μg/m3; Soil dust: 1.03 μg/m3). Model 1: adjusted for age, sex, stratified by baseline year. Model 2: Model 1 plus education level, occupation, household income, smoking status, alcohol consumption, regular physical activity, tea consumption, diet, family history of T2DM, and history of chronic disease. HR, hazard ratio; 95% CI, 95% confidence interval; PM2.5, fine particulate matter with an aerodynamic diameter of 2.5 μm or less; BC, black carbon; OC, organic carbon; NH4+, ammonium; NO3-, nitrate; SO42-, sulfate. Table 2. Associations of long-term exposure to ambient PM2.5 mass and its chemical constituents with risk of T2DM incidence
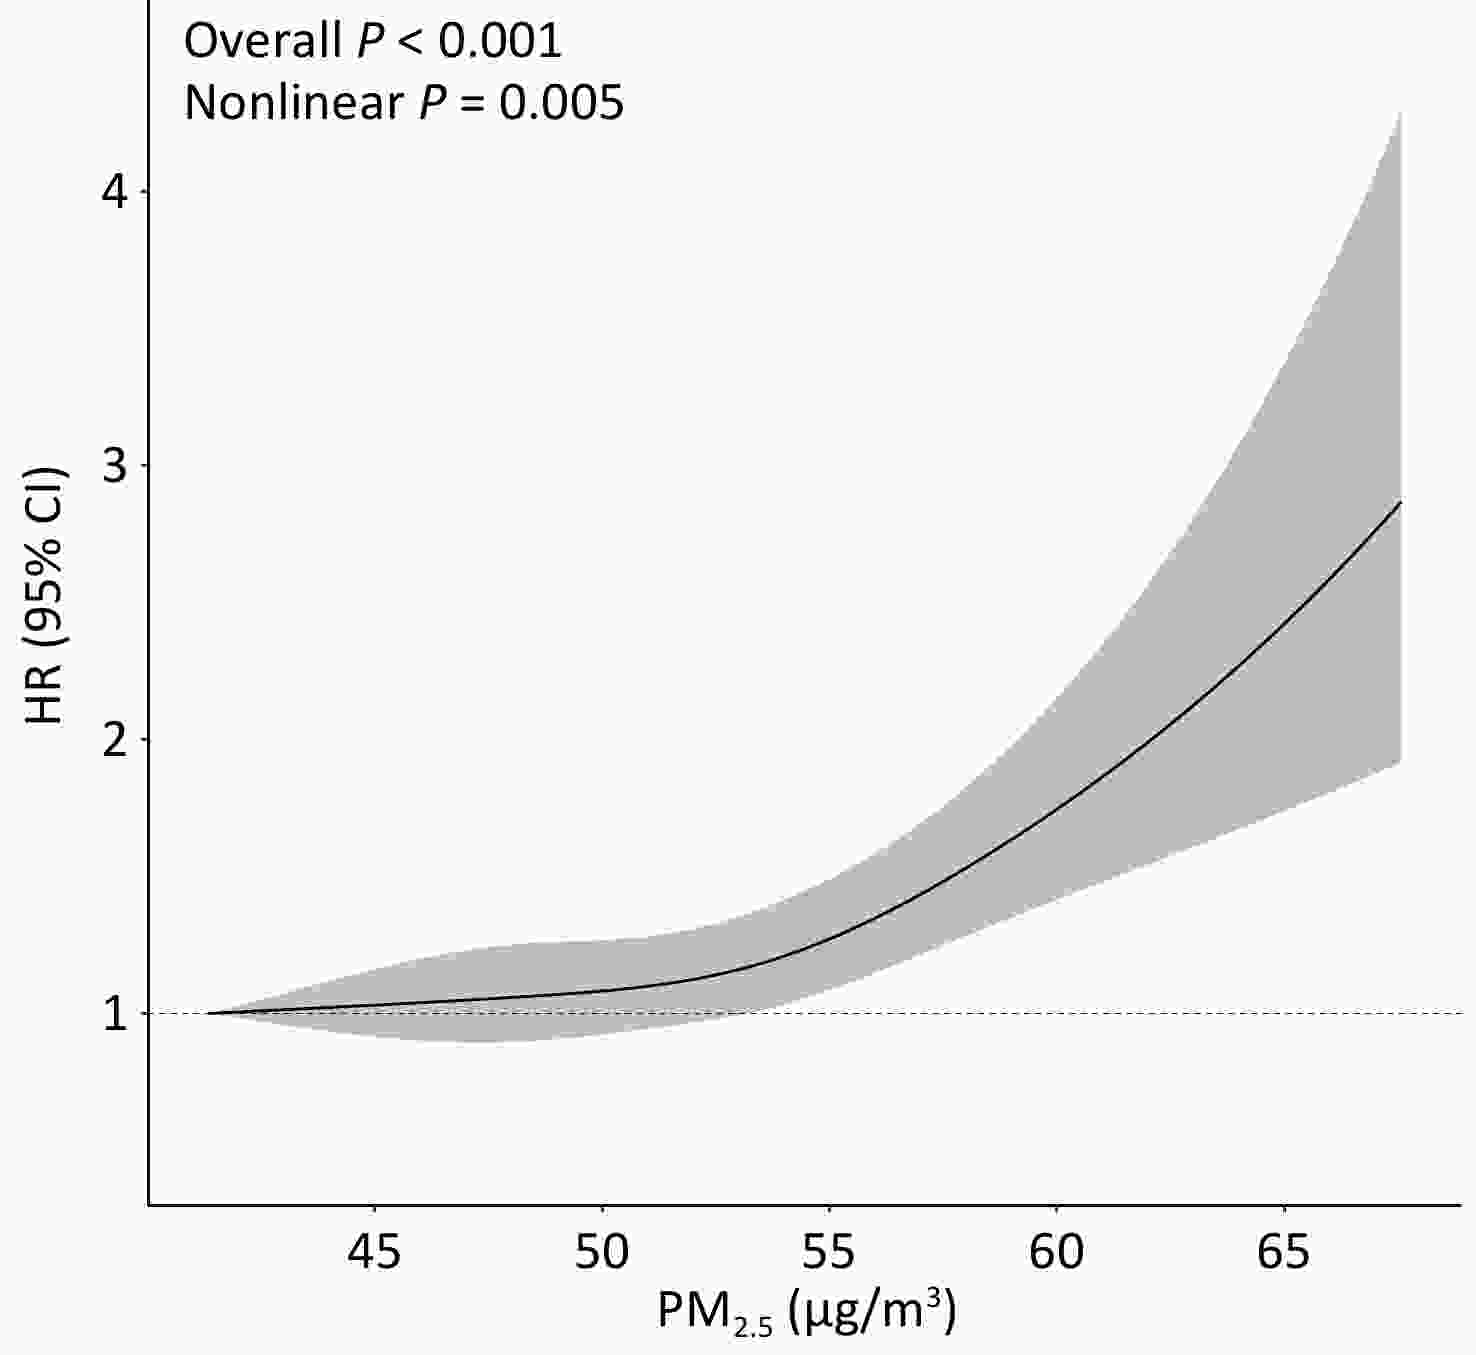
Figure 1. Exposure-response relation between ambient PM2.5 concentrations at baseline and risk of T2DM incidence. Multivariable Cox proportional hazard regression with restricted cubic splines adjusted for age, sex, education level, occupation, household income, smoking status, alcohol consumption, regular physical activity, tea consumption, diet, family history of T2DM, and history of chronic disease, stratified by baseline year.
-
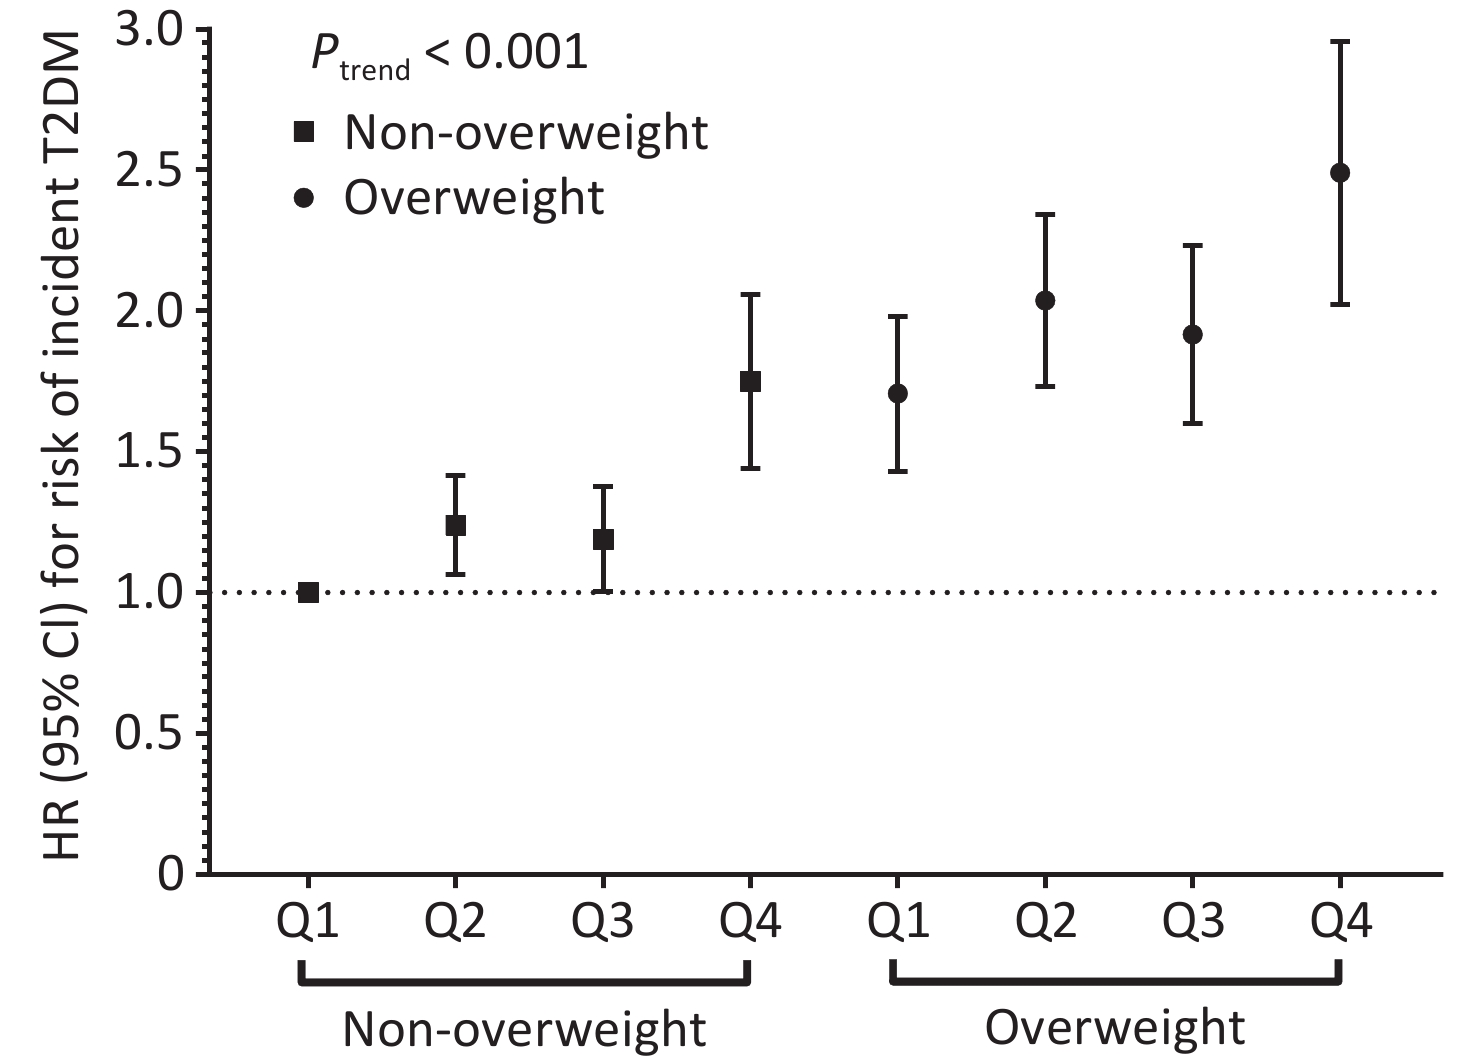
Stratified analyses revealed a marginal modification effect of BMI (Pinteraction = 0.060), with the association appearing stronger among non-overweight participants (Supplementary Table S3). Notably, a significant joint association of PM2.5 and BMI with the risk of T2DM incidence was identified (Figure 2). Overweight participants exposed to the highest quartile of PM2.5 had the highest risk compared to their non-overweight counterparts exposed to the lowest quartile of PM2.5 (HR: 2.46; 95% CI: 2.04, 2.97; Ptrend < 0.001). Similar patterns were observed for PM2.5 chemical constituents, with the highest risk of T2DM observed among overweight participants exposed to the highest quartile of pollutants (Supplementary Figure S3; all Ptrend < 0.001).
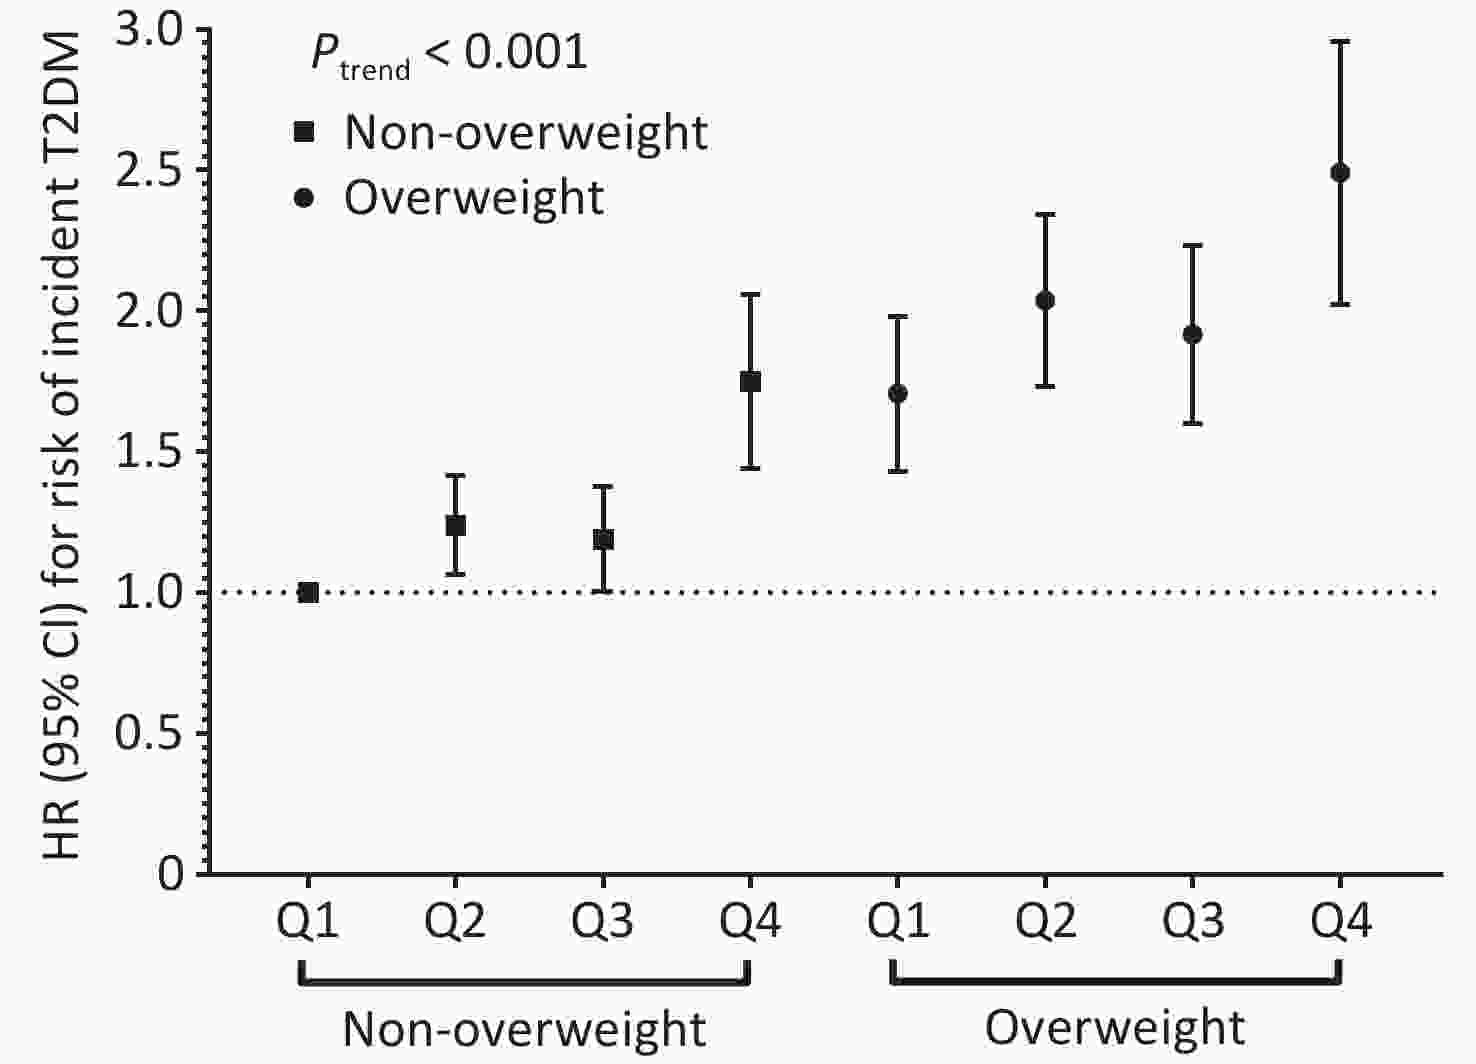
Figure 2. Joint effect of ambient PM2.5 mass exposure and overweight with risk of T2DM incidence. Multivariable Cox proportional hazard regression adjusted for age, sex, education level, occupation, household income, smoking status, alcohol consumption, regular physical activity, tea consumption, diet, family history of T2DM, and history of chronic disease stratified by baseline year. HR, hazard ratio; 95%CI, 95% confidence interval.
-
As shown in Supplementary Table S4, the adverse associations between long-term exposure to PM2.5 and its chemical constituents, and the risk of T2DM incidence were similar and remained robust after excluding new cases diagnosed within the first two years of follow-up, or those with chronic diseases at baseline. Sensitivity analyses further showed that results using baseline exposure were similar to those using one-year lag exposure, although the associations were slightly attenuated using the average concentration. Notably, the association between NO3- and T2DM risk was not significant in the model after adjusting for residual.
-
In this large prospective cohort of rural adults in East China, long-term exposure to higher levels of ambient PM2.5 mass and its constituents was associated with an increased risk of T2DM incidence. Overweight individuals exposed to higher levels of PM2.5 appeared to have a higher risk of T2DM incidence than non-overweight individuals with lower exposure.
Ambient PM2.5 plays a significant role in the development of diabetes.[16-18] A prior study among older Chinese adults indicated that long-term exposure to higher concentrations of PM2.5 was associated with elevated fasting glucose and HbA1c levels, as well as the prevalence and incidence of T2DM.[34] Two Mendelian randomization studies have further demonstrated the causal effect of long-term exposure to PM2.5 on T2DM.[35,36] In this study, we confirmed the significant positive associations between long-term exposure to ambient PM2.5 and risk of T2DM incidence among rural Chinese adults (HR: 1.30, 95% CI: 1.17-1.45, per 10 μg/m3 increase).
Evidence suggests that PM2.5 constituents may play various roles in the adverse health effects of PM2.5.[15] However, studies linking PM2.5 constituents with T2DM, have mostly been cross-sectional, and prospective studies in China are limited.[16-18] A cross-sectional study involving 17,326 participants aged ≥ 45 years in mainland China found that exposure to high concentrations of PM2.5 and its constituents (BC, OC, NO3-, and NH4+) was associated with elevated glucose levels and increased prevalence of diabetes.[16] Another cross-sectional study involving 69,210 adults in Southwest China from 2018 to 2019 identified positive associations between long-term exposure to BC, NO3-, NH4+, OC, and soil dust with diabetes[17]. A more recent cross-sectional study conducted in rural China found that long-term exposure to BC, NO3-, NH4+, OC, SO42-, and soil dust was associated with altered glucose metabolism.[18] To the best of our knowledge, only one prospective study, which included 19,884 participants (791 T2DM cases) in Northwest China, reported that BC, NO3-, NH4+, and OC, based on estimates of concentration at a 10 km × 10 km spatial resolution, were positively associated with the incidence of T2DM.[19] Another prospective study found significant associations between several constituents and T2DM risk.[20] However, few prospective studies have investigated the associations between PM2.5 constituents and T2DM in China, especially in rural areas, using a higher spatial resolution. Based on a large prospective cohort study with 1 × 1 km spatial resolution, we found that BC, NO3-, NH4+, OC, SO42-, and soil dust were positively associated with an increased risk of T2DM incidence. Our findings provide additional evidence that PM2.5 constituents, particularly BC, plays a dual role in increasing the risk of T2DM incidence. Mechanisms such as oxidative stress and inflammatory responses may partially explain how black carbon exposure leads to diabetes[37]. The BC emissions in rural China mainly originate from solid fuel combustion[38], highlighting the importance of targeted air pollution control measures to effectively reduce T2DM risk.
While several previous studies have investigated the modification effect of BMI on the associations between PM2.5 and T2DM, the results were inconsistent due to differences in study design, source population, sample size, and exposure duration.[24-26,39,40] A few prospective studies have reported that the association between long-term exposure to PM2.5 and the risk of T2DM incidence was significantly modified by BMI, with adults with lower BMI appearing more susceptible to the adverse effects of PM2.5 exposure[26,40]. However, studies from Western countries suggested that the association between PM2.5 and diabetes was stronger among adults with higher BMI[24,41]. Interestingly, our study found that overweight adults exposed to the highest levels of PM2.5 had the highest risk of T2DM incidence compared to non-overweight individuals exposed to the lowest levels of PM2.5, which is consistent with a previous study among rural Chinese[25]. However, in the subgroup analysis, the adverse association of PM2.5 with risk of T2DM incidence, was stronger among non-overweight participants than their overweight counterparts, although the interaction was borderline significant (Pinteraction=0.060). Similar additive patterns of PM2.5 constituents with overweight were observed, with significant interactions for BC, OC, and NO3-. These findings suggest a potential synergistic effect between PM2.5 and overweight. PM2.5 may emerge as a major contributor to PM2.5/overweight-related T2DM among non-overweight participants, while BMI plays a more significant role among overweight individuals. Biologically, the joint effect of PM2.5 and overweight on T2DM development is plausible. Being overweight may enhance the inflammatory response to PM2.5 and influence several hormones that accentuate the adverse effects of PM2.5[42-45]. A previous study showed that overweight individuals inhaled an average of 8.21 m3 more air than normal-weight individuals[46] which might have led to a greater dose of inhaled PM2.5. Changes in respiratory physiology among obese adults may also explain their increased susceptibility to PM2.5 exposure[47].
This study had several strengths, including the use of a large prospective cohort of rural Chinese adults with a long follow-up duration, and a comprehensive assessment of ambient PM2.5 and its constituents in relation to T2DM development. In addition, the role of overweight in the association between PM2.5 and T2DM using stratified approaches was comprehensively studied. However, this study has several limitations. First, the findings may have been confounded by unmeasured factors, such as O3 and NO2 although typical T2DM related risk factors have been comprehensively considered. Second, the exposure level of PM2.5 was assessed based on the fixed addresses of participants, without considering their daily activity patterns, such as transport from home to office and other environmental pollutants, including indoor air pollution. Third, this analysis was conducted in one of the most developed regions of rural China, which may limit the generalizability of our results to urban Chinese populations with higher pollution levels. In addition, T2DM cases were predominantly identified through a single test for fasting plasma glucose or self-reporting in the baseline study, which could potentially increase the risk of underdiagnosis.
-
Based on this large prospective cohort in rural China, long-term exposure to ambient PM2.5 and its constituents was positively associated with the risk of T2DM incidence. Adults who were overweight and exposed to high concentrations of ambient PM2.5 had the highest risk of T2DM incidence, which further highlights the importance of controlling overweight status in reducing the effect of ambient PM2.5 on incident T2DM. The findings of this study suggest that government policies should implement measures targeting air pollution control and overweight prevention to help mitigate the burden of T2DM.
Overweight Modified the Associations Between Long-Term Exposure to Ambient Fine Particulate Matter and Its Constituent and the Risk of Type 2 Diabetes in Rural China
doi: 10.3967/bes2025.136
-
Key words:
- PM2.5 /
- Constituents /
- Overweight /
- T2DM /
- Cohort study
Abstract:
The authors declare that they have no competing financial interests or personal relationships that may have influenced the work reported in this study.
This study was approved by the Institutional Review Board of the School of Public Health, Fudan University (No. #07-06-0099, #2011-03-0624, #2014-03-480, #2022-04-0956). All participants provided written informed consent at enrollment.
&These authors contributed equally to this work.
| Citation: | Donghui Yang, Yun Chen, Xia Meng, Xiaolian Dong, Haidong Kan, Chaowei Fu. Overweight Modified the Associations Between Long-Term Exposure to Ambient Fine Particulate Matter and Its Constituent and the Risk of Type 2 Diabetes in Rural China[J]. Biomedical and Environmental Sciences. doi: 10.3967/bes2025.136

|

 Quick Links
 DownLoad: