


-
Chronic kidney disease (CKD) is a recognized global public health burden affecting over 15% of the general population[1]. By 2040, CKD is expected to become the fifth-leading cause of death in the world[2]. The neutrophil-to-lymphocyte ratio (NLR) indicates local or systemic inflammation status. The NLR has been demonstrated to exhibit predictive value in various pathological conditions, including—but not limited to—pancreatic cancer, as well as macrovascular and microvascular diseases, and sepsis[3,4]. Patients with elevated NLR values typically exhibit a decreased lymphocyte count and an increased neutrophil count, thereby indirectly reflecting both inflammatory status and cell-mediated immunity[5]. Hence, this cross-sectional study was designed to explore the relationship between the NLR and renal function in individuals aged 20–80 years using data from the National Health and Nutrition Examination Survey (NHANES) 2017–2020.
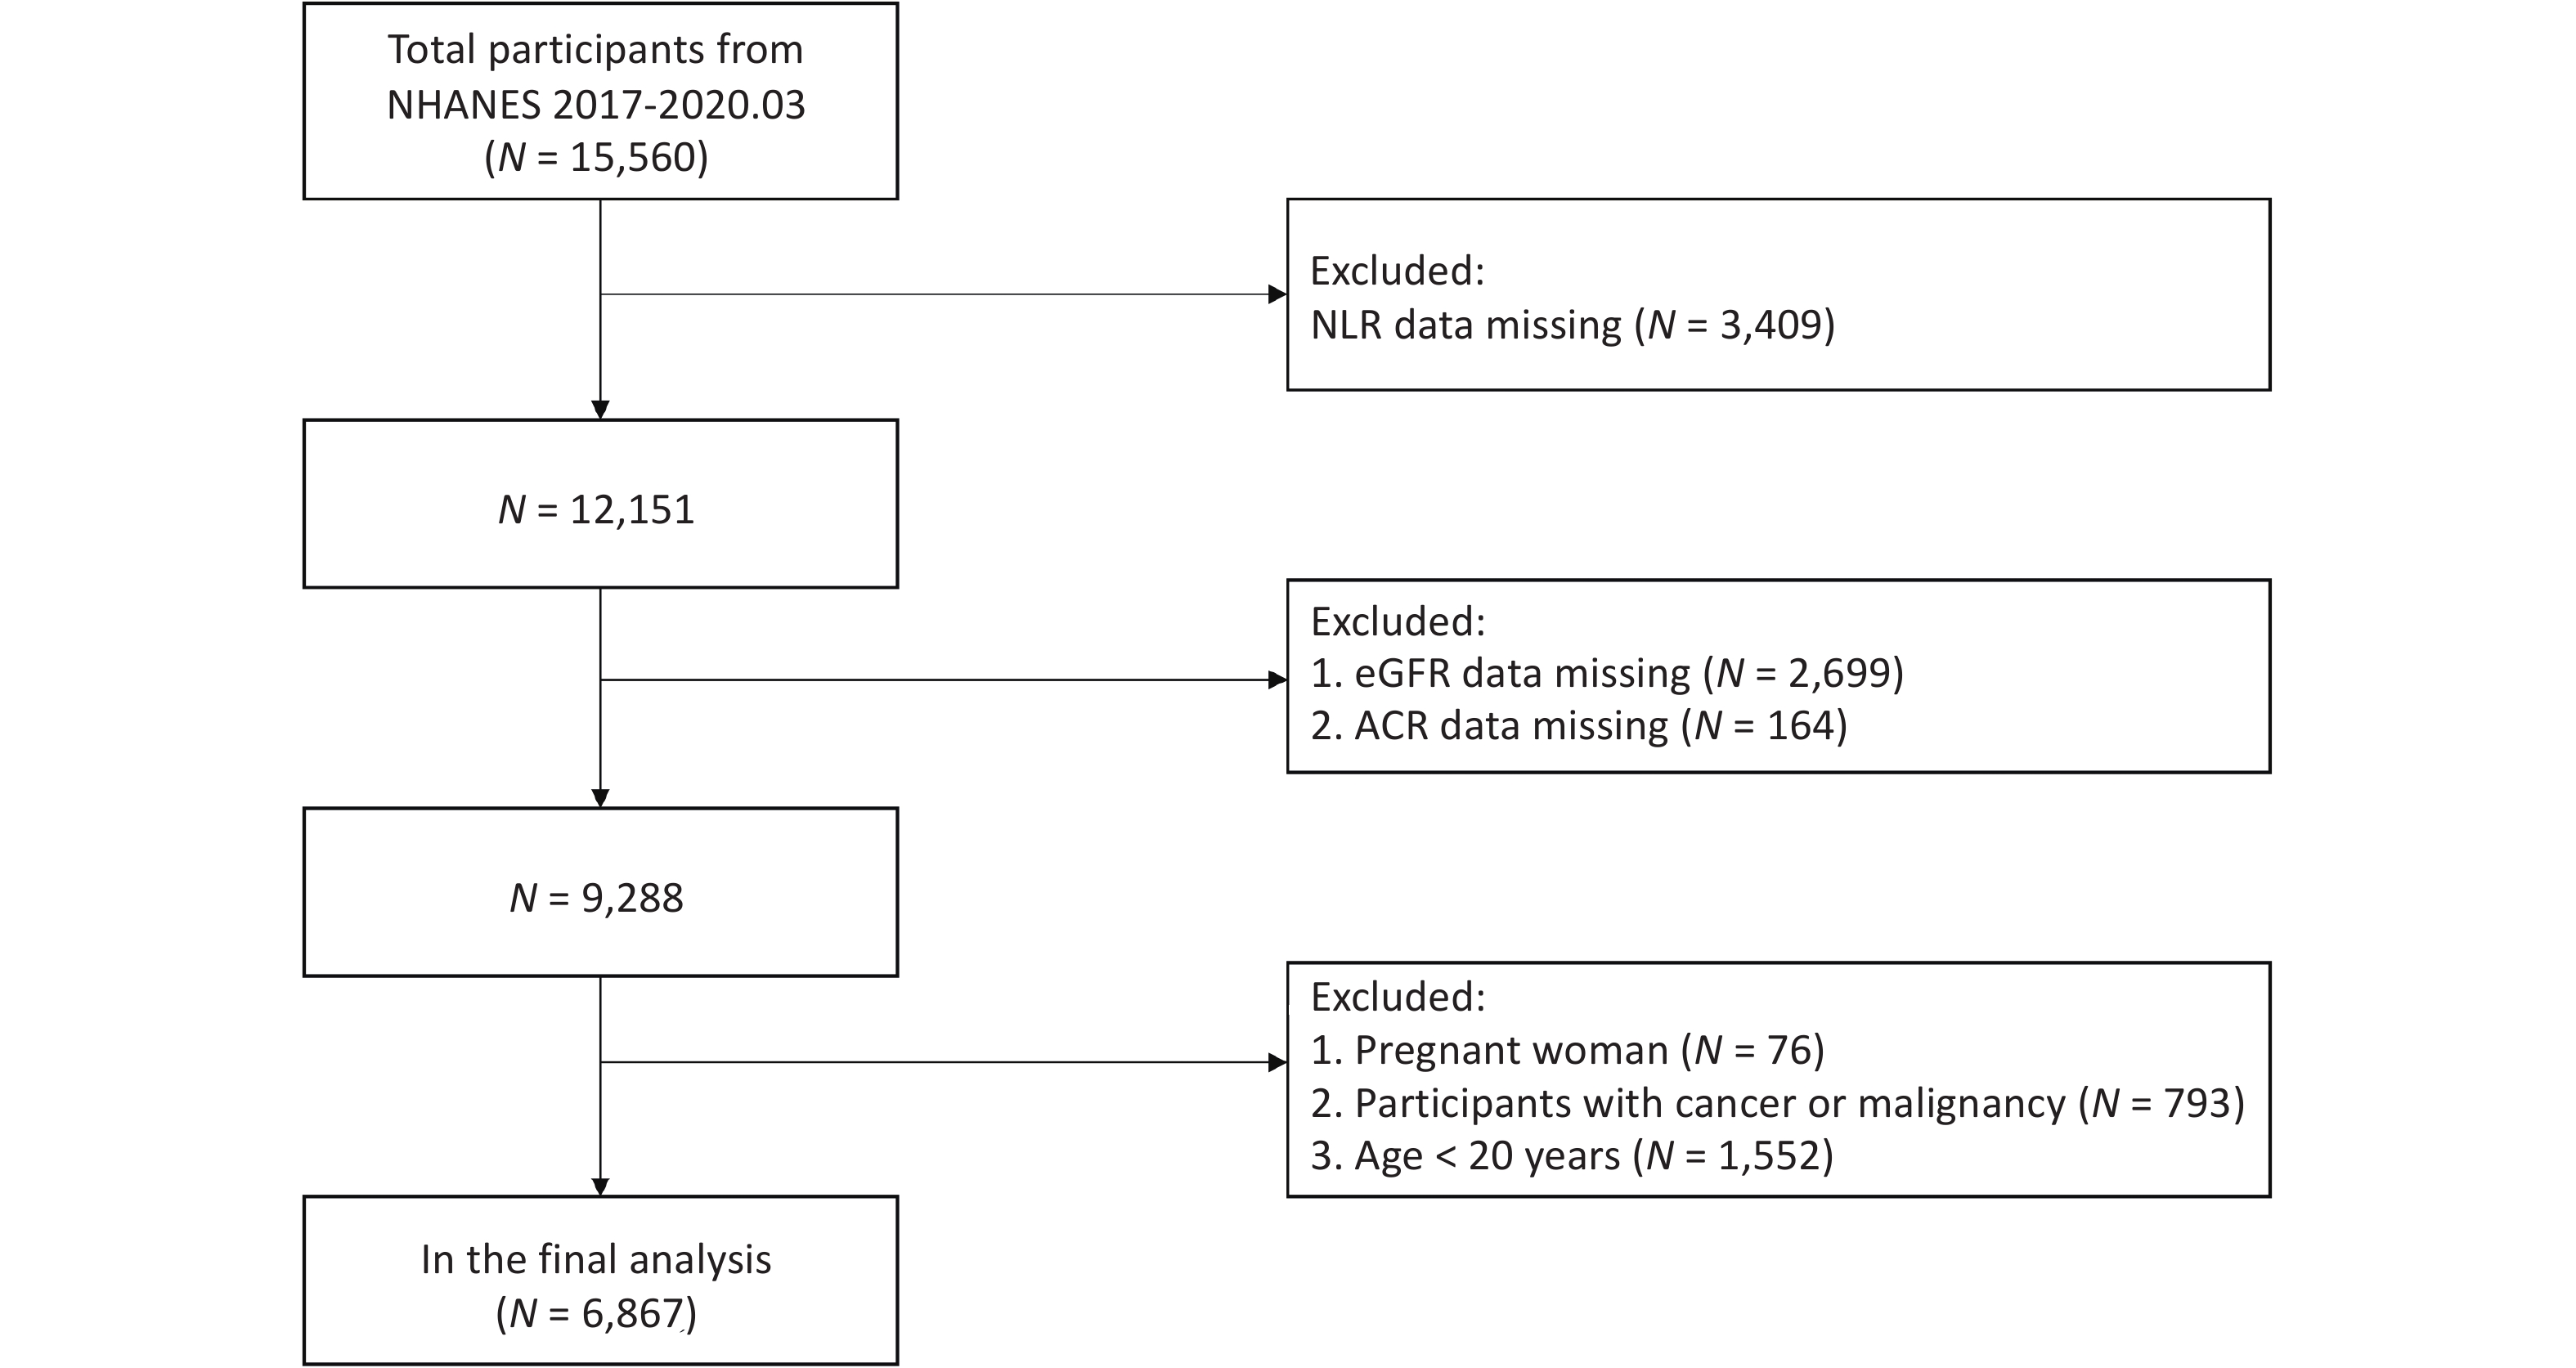
Using weighted NHANES 2017–2020 data, we included adults aged ≥ 20 years and, after excluding participants with missing NLR, estimated glomerular filtration rate (eGFR) or albumin-to-creatinine ratio (ACR) data, pregnancy, cancer/malignancy, or age < 20 years, analyzed 6,867 participants (Figure 1). We measured the exposure—the NLR—using automated complete blood counts. Outcomes included eGFR (CKD-EPI 2021) and urine ACR from spot urine samples. Serum creatinine measured using the Jaffe rate method, and urine albumin using fluorescence immunoassay. Covariates included sociodemographic characteristics, lifestyle/diet, laboratory indices, and comorbidities. Complex survey weights were used in the analyses. We modeled the natural log of NLR (ln-NLR) and ACR (ln-ACR) using weighted multivariable linear regression across three models: unadjusted, adjusted for age, sex, and race, and fully adjusted. NLR quartiles were used to test for linear trends. Restricted cubic splines and piecewise models were used to evaluate the nonlinearity (likelihood-ratio tests). Subgroup analyses according to sex, age, eGFR, and ACR were used to assess the effect modification (interaction P). Statistical significance was set at two-sided P < 0.05.
Figure 1. Flow chart of participants selection from NHANES 2017-202NHANES, National Health and Nutrition Examination Survey; NLR, neutrophil-to-lymphocyte ratio; eGFR, estimated glomerular filtration rate; ACR, albumin-to-creatinine ratio.
A total of 6,867 participants were enrolled in this study. The average age of the participants was 49.29 ± 16.92 years, and 48.99% were males. Supplementary Table S1 lists the weighted characteristics of the study population according to the eGFR group. Three models were constructed to examine the association between the ln-transformed NLR and renal function measures (eGFR and ln-transformed ACR) (Table 1). Significant negative correlations were observed between ln-transformed NLR and eGFR across all models (Models 1–3), with β coefficients (95% confidence intervals [CIs]) of –5.37 (–6.46, –4.27), –1.41 (–2.23, –0.59), and –1.46 (–2.25, –0.66), respectively. Conversely, positive and significant associations were found between ln-transformed NLR and ln-transformed ACR in all models, with β coefficients (95% CIs) of 0.28 (0.22, 0.33), 0.24 (0.19, 0.30), and 0.18 (0.12, 0.23), respectively.
Outcomes Model 1, β (95% CI), P Model 2, β (95% CI), P Model 3, β (95% CI), P eGFR –5.37 (–6.46, –4.27) < 0.001 –1.41 (–2.23, –0.59) < 0.001 –1.46 (–2.25, –0.66) < 0.001 Q1 Reference Reference Reference Q2 –0.15 (–1.55, 1.24) 0.830 0.40 (–0.63, 1.43) 0.450 0.16 (–0.82, 1.15) 0.740 Q3 –0.87 (–2.26, 0.53) 0.220 0.55 (–0.48, 1.58) 0.300 0.24 (–0.75, 1.23) 0.630 Q4 –6.41 (–7.80, –5.02) < 0.001 –1.63 (–2.68, –0.59) 0.002 –1.80 (–2.81, –0.79) < 0.001 P for trend < 0.001 0.002 < 0.001 ACR ln-transformed 0.28 (0.22, 0.33) < 0.001 0.24 (0.19, 0.30) < 0.001 0.18 (0.12, 0.23) < 0.001 Q1 Reference Reference Reference Q2 0.12 (0.05, 0.19) 0.001 0.11 (0.04, 0.18) 0.002 0.12 (0.05, 0.19) < 0.001 Q3 0.16 (0.09, 0.23) < 0.001 0.15 (0.08, 0.22) < 0.001 0.12 (0.05, 0.19) < 0.001 Q4 0.33 (0.26, 0.40) < 0.001 0.28 (0.21, 0.35) < 0.001 0.21 (0.15, 0.28) < 0.001 P for trend < 0.001 < 0.001 < 0.001 Note. Model 1: no covariates were adjusted. Model 2: age, sex, race were adjusted. Model 3: adjusted for age, sex, race, ALT, AST, BMI, HDL, PIR, total calorie intake, education level, marital status, uric acid, physical activity, total cholesterol, diabetes, tobacco exposure, hypertension, CVD, and alcohol consumption. NLR, neutrophil-to-lymphocyte ratio; eGFR, estimated glomerular filtration rate; ACR, albumin-to-creatinine ratio; CI, confidence interval; ALT, alanine aminotransferase; AST, aspartate aminotransferase; BMI, body mass index; HDL, high-density lipoprotein; PIR, poverty income ratio; CVD, cardiovascular disease. Table 1. Associations of in-transformed NLR and renal function (eGFR and ACR)
By categorizing NLR into quartiles (Q1 as the reference, Table 1), higher NLR levels were consistently associated with worse renal function indices. Participants in Q4 had significantly lower eGFR across Models 1–3. For ln-transformed ACR, increasing NLR quartiles corresponded to higher ln-ACR values in all models, with significant dose-response trends (all P for trend < 0.001). These associations remained robust after full adjustment for covariates. Our findings align with previous studies showing elevated NLR in advanced CKD[6], supporting NLR as an inflammation-linked, dose-responsive marker of renal impairment rather than a simple static indicator.
After adjusting for all covariates, we conducted smooth curve fitting to determine the nonlinear association between the ln-transformed NLR and renal function (Supplementary Figure S1). Consistent with the multiple linear regression results, a positive correlation was observed between the ln-NLR and ln-ACR (Supplementary Figure S1A). A threshold saturation effect was detected between ln-NLR and eGFR (log-likelihood ratio = 0.026), with an inflection point at 0.54 (Supplementary Figure S1B and Table 2). Beyond this inflection point (ln-NLR = 0.54), a significant negative association was found, with β coefficients (95% CIs) of –2.55 (–3.80, –1.30) between ln-NLR and eGFR. This suggests that the effect of systemic inflammation, as indicated by elevated NLR, may become particularly pronounced after crossing a certain threshold, thereby accelerating renal function decline.
Inflection point Adjusted β (95% CI), P value eGFR, mL·min--1·1-.73 m-2 Inflection point 0.54 ln-transformed NLR < 0.54 0.31 (–1.44, 2.07), 0.730 ln-transformed NLR ≥ 0.54 –2.55 (–3.80, –1.30), < 0.001 log likelihood ratio 0.026 ln-transformed ACR Inflection point 1.04 ln-transformed NLR < 1.04 0.15 (0.08, 0.21), < 0.001 ln-transformed NLR ≥ 1.04 0.28 (0.12, 0.45) , < 0.001 log likelihood ratio 0.173 Note. Adjusted for age, sex, race, ALT, AST, BMI, HDL, PIR, total calorie intake, education level, marital status, uric acid, physical activity, total cholesterol, diabetes, tobacco exposure, hypertension, CVD, and alcohol consumption. The log-likelihood ratio was used to compare one-line and piecewise linear regression models. A P value < 0.05 suggests that the piecewise linear regression models fit the data better than the one-line linear regression model. NLR, neutrophil-to-lymphocyte ratio; eGFR, estimated glomerular filtration rate; ACR, albumin-to-creatinine ratio; CI, confidence interval; ALT, alanine aminotransferase; AST, aspartate aminotransferase; BMI, body mass index; HDL, high-density lipoprotein; PIR, poverty income ratio; CVD, cardiovascular disease. Table 2. Threshold effect analysis of ln-transformed NLR on renal function indicators
Subgroup analyses showed a stronger association between NLR and eGFR in males than in females (Supplementary Table S2): in males, higher NLR was significantly associated with greater eGFR decline (−2.08 [−3.23, −0.93], P < 0.001), whereas the association was not significant in females (P = 0.24). In contrast, the NLR–ACR association was significant in both sexes, suggesting that NLR may be a stronger indicator of ACR than eGFR in females. These sex differences may reflect variations in inflammatory responses. Previous studies report that oxidative and inflammatory markers differ by sex and suggest that these differences may contribute to lifespan disparities, with males generally exhibiting higher levels of oxidative stress and baseline inflammation[7].
In fully adjusted subgroup analyses (Supplementary Table S2), ln-NLR was inversely associated with eGFR among males, participants aged 40–59 and 60–80 years, those with eGFR 45–60 mL/min/1.73 m2, and participants with ACR > 30 mg/g (interaction P < 0.05 for age and ACR). Additionally, ln-NLR was positively associated with ln-ACR across both sexes, participants aged 40–80, those with eGFR ≥ 60 mL/min/1.73 m2, and individuals with ACR ≤ 30 mg/g (interaction P < 0.05 for age).
Our analysis revealed age-dependent variations in the relationship between NLR and renal function (Supplementary Table S2). Among individuals aged 40–59 years, we observed the strongest negative association between NLR and eGFR (−1.73 [−3.10, −0.36], P = 0.01) and a highly significant positive association with ACR (0.29 [0.20, 0.38], P < 0.001). These findings suggest that NLR is an important marker of renal function decline in middle-aged individuals who may be at a higher risk of CKD progression due to the combined effects of inflammation and age-related renal decline[8]. In younger adults, this association was less pronounced, potentially reflecting lower baseline inflammation. Stratified by baseline eGFR, the NLR–eGFR association was strongest in those with moderate impairment (45–60 mL/min/1.73 m2) (−1.06 [−2.13, −0.01], P = 0.04), suggesting its potential utility for monitoring early-stage CKD. The association was not significant in severe impairment (< 45 mL·min-1·1.73 m-2), likely due to advanced disease characterized by widespread inflammation and other contributing factors. When stratified by ACR, the association was significant at ACR ≤ 30 mg/g (0.11 [0.08, 0.15], P < 0.001) but weaker at ACR > 30 mg/g (P > 0.05), indicating greater sensitivity to earlier glomerular injury. Overall, the direction of associations was consistent, though their strength varied across subgroups. These findings highlight the importance of considering demographic and clinical characteristics when using the NLR as a biomarker for CKD risk assessment. Specifically, for middle-aged individuals and males, NLR may serve as a more sensitive indicator of renal decline. Furthermore, the stronger association of NLR with ACR compared to eGFR in certain subgroups suggests that NLR may be particularly useful for detecting early glomerular damage before significant declines in filtration function occur.
Two-piece smooth curve fitting (after adjusting for all the covariables) was used to explore the non-linear associations between ln-transformed NLR and renal function (eGFR and ACR) stratified by age, sex, ACR, and eGFR groups (Supplementary Figures S2–3 and Tables S3–4). An inverted U-shaped curve was observed between ln-transformed NLR and eGFR in participants aged 40–59 years (inflection point [ln-transformed NLR] = 0.87) (Supplementary Figure S2A and Table S3). When ln-transformed NLR was below 0.87 (Supplementary Table S3), there was a significant positive association with eGFR (β = 2.11; 95% CI: 0.05, 4.16). Above this threshold, the association became significantly negative (β = −9.57; 95% CI: −12.99, −6.15). One possible explanation is that middle-aged individuals may maintain renal reserve and compensatory mechanisms, so early inflammation (elevated NLR) may trigger compensatory hyperfiltration that temporarily delays damage, with differences between individuals contributing to variability. These thresholds imply that low-to-moderate NLR may have a limited impact, whereas higher levels (above critical points) could increase the risk of renal injury and CKD progression. Clinically, NLR may serve both as a continuous biomarker and—if cut-offs are validated—as a risk marker. Monitoring thresholds may aid in early detection and timely intervention. Longitudinal studies are needed to establish optimal cut-offs and determine whether reducing NLR improves patient outcomes.
Furthermore, significant negative associations were observed for eGFR in males (β = –4.19 [95% CI: –6.01, –2.38], Supplementary Figure S2B; inflection point [ln-NLR] = 0.55) and in the ACR ≤ 30 group (β = –2.15 [95% CI: –3.83, –0.47], Supplementary Figure S2C; inflection point [ln-NLR] = 0.76), occurring after their respective inflection points (Supplementary Table S3). For ln-transformed ACR, consistent with the above multiple linear regression results, positive correlations were observed between ln-transformed NLR and ln-transformed ACR (Supplementary Figure S3 and Table S4). Before the corresponding inflection points (Supplementary Table S4), significant positive associations were observed between ln-transformed NLR and ln-transformed ACR, with inflection points at 0.67 (β = 1.41 [95% CI: 0.74, 2.07]) for participants with eGFR 45–60 mL/min/1.73 m2 (Supplementary Figure S3A), 1.29 (β = 0.21 [95% CI: 0.10, 0.31]) for those aged 40–59 years, and 1.39 (β = 0.31 [95% CI: 0.19, 0.43]) for those aged 60–80 years (Supplementary Figure S3B). Meanwhile, significant positive associations were observed after the corresponding inflection points between ln-transformed NLR and ln-transformed ACR, with inflection points at 1.11 (β = 0.45 [95% CI: 0.20, 0.71]) for participants with eGFR ≥ 90 mL·min-1·1.73 m-2 (Supplementary Figure S3A) and 1.29 (β = 1.10 [95% CI: 0.62, 1.57]) for those aged 40–59 years (Supplementary Figure S3B).
In conclusion, NLR may be a simple and accessible risk marker for CKD progression that could inform early intervention. However, the cross-sectional design precludes causal inference, and prospective longitudinal studies are needed.
Association between Neutrophil-to-lymphocyte Ratio and Renal Function: A Cross-sectional Study with Threshold Effects
doi: 10.3967/bes2025.140
- Received Date: 2025-05-27
- Accepted Date: 2025-10-13
The authors declare that this study was conducted without any commercial or financial relationships that could be construed as potential conflicts of interest.
&These authors contributed equally to this work.
| Citation: | Lin Hu, Mingcong Chen, Qiuwei Tian, Zisai Wang, Mingyi Zhao, Qingnan He. Association between Neutrophil-to-lymphocyte Ratio and Renal Function: A Cross-sectional Study with Threshold Effects[J]. Biomedical and Environmental Sciences. doi: 10.3967/bes2025.140

|

 Quick Links
 DownLoad: