
-
Anemia is a condition characterized by an insufficient number of red blood cells and, consequently, a reduced oxygen-carrying capacity that fails to meet the body’s physiological needs[1].
Anemia is one of the most significant public health problems worldwide, particularly in developing countries. The Global Burden of Disease 2021 Anemia Collaborators estimated that the global prevalence of anemia across all age groups was 24.3%, corresponding to approximately 1.92 billion cases[2]. Children under five years of age, pregnant women, and the elderly are considered high-risk groups for anemia. In children, anemia is associated with impaired cognitive, motor, and behavioral development, as well as increased susceptibility to infections[3]. Normal hemoglobin (Hb) levels vary according to age, sex, physiological status, and altitude. Peripheral blood Hb concentration is internationally recognized as the standard indicator for diagnosing anemia.
The World Health Organization (WHO) published the latest guideline on hemoglobin cutoffs for defining anemia using a statistical approach in 2024. This guideline encompasses nearly all population groups, except for infants aged 0–5 months[1]. In 2002, the WHO established anemia thresholds of 135 g/L at birth and 95 g/L for infants aged 2–6 months[4]; however, these thresholds were not adopted in the 2024 guideline[1]. Few studies have established anemia thresholds for infants younger than 6 months. Most of these studies either did not include “healthy infants”[5] or included those who were not sufficiently healthy[6]. Although some studies defined “healthy infants,” they did not account for the dynamic changes in hemoglobin levels during the first six months of life. Instead, they proposed hemoglobin cutoffs for the entire 0–6-month period or for specific age groups[7]. At present, there is no universally accepted hemoglobin cutoff for infants of specific monthly ages worldwide.
Infancy is a rapid and dynamic period of human growth and development. Anemia during this stage can exert long-term adverse effects on health and development. It is crucial to establish the critical Hb levels for diagnosing anemia in infants. Therefore, this study aimed to utilize data from the National Nutrition and Health Systematic Survey for Children Aged 0–17 Years in China (CNHSC) to develop Hb percentiles for infants aged 0–5 months. These findings will provide a foundation for further research and the establishment of reference Hb thresholds for diagnosing anemia in this age group.
-
This study was part of CNHSC, a nationwide, population-based cross-sectional survey designed to collect representative data on the nutritional status, growth, and health of children aged 0–17 years across different regions of China between 2019 and 2021. Detailed descriptions of the survey design and methods have been published elsewhere[8]. In brief, a multistage stratified randomized cluster sampling design was employed. Two provinces were randomly selected from each of the seven regions of China—eastern, northern, central, southern, southwestern, northwestern, and northeastern. From each selected province, one urban district and one rural county were further randomly chosen.
In this study, data from infants aged 0–5 months were extracted to examine Hb levels and to establish anemia thresholds for this age group in China. The inclusion criteria were healthy, locally born infants younger than six months. The exclusion criteria included infants with acute or chronic illnesses, such as acute respiratory tract infection, acute gastroenteritis, or congenital heart defects. “Healthy infants” were defined as those with adequate iron reserves at birth[9], exclusive breastfeeding (EBF), normal physical and neuropsychological development, and absence of acute or chronic diseases. Specific definitions are provided in Table 1. Infants aged 0–5 months were categorized into monthly groups: 0-month (0–30 days), 1-month (31–60 days), 2-month (61–90 days), 3-month (91–120 days), 4-month (121–150 days), and 5-month (151–180 days). The total sample comprised 11,088 infants from 14 provinces, with 1,848 infants per monthly group.
Indicators Standards Adequate iron reserves at birth7 Singleton
Term delivery,37 weeks≤gestational week≤42 weeks
No small-gestational-age(SGA) and large-gestational-age(LGA)
No low-birthweight and macrosomia (2500 g≤birthweight≤4000 g)EBF Breastfeeding after birth, not consuming complementary foods or formula
Not consuming dietary supplements containing ironNormal physical development -2SD ≤ WAZ ≤ 2SD
-2SD ≤ Growth velocity based on weight ≤ 2SDNormal neuropsychological development Score of CNBS-R2016 ≥70 Disease status No acute and chronic diseases reported Note. SGA, Small-gestational-age; LGA, Lager-gestational-age; EBF, Exclusively breastfeeding; SD, Standard deviation; WAZ, Weight-for-age Z-score; CNBS-R2016, Children Neuropsychological and Behavioral Scale – Revision 2016. Table 1. Definition of healthy infants
The study was approved by the Medical Ethics Review Committee of the National Institute for Nutrition and Health, Chinese Center for Disease Control and Prevention (Approval No. 2019-009). Written informed consent was obtained from all parents or guardians of the participating infants.
-
Hb levels were measured using the HemoCue Hb 201+ system (HemoCue AB, Ängelholm, Sweden). A trained staff member disinfected the outer surface of the infant’s left middle finger, punctured it with a disposable lancet (STERiLANCE, 26G, 1.8 mm), and gently pressed the finger using the left index finger and thumb to promote blood flow. The first two drops of blood were wiped away with a dry cotton ball, and the following large drop (more than 20 μL) was collected to fill the entire HemoCue microcuvette. Another staff member wiped away any excess blood from the infant’s finger with a dry cotton ball and promptly (within 40 seconds) inserted the filled microcuvette into the analyzer for measurement. The Hb values were adjusted for altitude.
A structured questionnaire was administered to collect information on each infant, including date of birth, sex, ethnicity, gestational age, birth weight, birth length, feeding mode, and use of nutritional supplements. The infant’s date of birth, sex, ethnicity, gestational age, birth weight, and birth length were obtained from the birth certificate by trained investigators. The infant’s age was calculated by subtracting the date of birth from the date of the interview. The investigator asked the caregiver about the infant’s feeding method. Infants aged 0–5 months were weighed in the morning using a Seca digital baby scale (Seca 335, Germany). The WHO Anthro Survey Analyzer was used to calculate the weight-for-age Z-score. Weight gain was calculated by subtracting birth weight from the weight measured during the survey. Weight velocity was expressed in 1-month increments up to 6 months. According to the WHO Child Growth Standards[10], infants were classified as having normal or abnormal growth velocity based on weight. Because the WHO standards do not include data for the 4-month group, the value for 4 months was derived as the mean of the 3- and 5-month groups. EBF was defined as infants receiving only breast milk, without any additional food or liquid.
Neuropsychological and behavioral development was assessed using the Children Neuropsychological and Behavioral Scale – Revision 2016 (CNBS-R2016), which includes five domains: gross motor, personal-social, language, fine motor, and adaptive behavior[11]. A trained developmental pediatrician administered the CNBS-R2016 using standardized procedures and assessment tools. The mean score of the CNBS-R2016 General Developmental Quotient is 100, with scores below 70 indicating developmental delay.
-
All investigators and laboratory personnel completed national-level training before the initiation of the project. The training mainly included questionaire survey and Hb testing. Personnel were certified and authorized to perform their respective duties only after passing a competency assessment that verified proficiency in assigned tasks.
A computer-aided survey system as a data collector was established, including a collection and storage data function, monitoring operations and control quality to ensure standardization and high quality of information collection.
Before each day’s Hb analysis, a quality control (QC) panel consisting of both high- and low-level QC solutions was tested once. During the analysis, a QC slide was analyzed after every 30 samples. Test results were compared with the target values and allowable deviation ranges of the QC solutions, and data within these ranges were considered acceptable. The target value for the QC sample was 120 g/L, and the mean coefficient of variation was 1.47%.
-
Differences in sociodemographic characteristics between the analytical and non-analytical samples were evaluated using chi-square (χ2) tests or t-tests in SAS software (version 9.4). A generalized additive model for location, scale, and shape (GAMLSS) was applied to fit the Hb percentiles for infants aged 0–5 months in China using R software (version 4.3.1)[12]. The GAMLSS model is suitable for analyses focusing not only on shifts in the mean (location) of the Hb distribution but also on its variance, skewness, kurtosis, and quantiles. Continuous distributions were employed because the response variable (Hb concentration) was continuous. Based on the principle of minimizing the Akaike Information Criterion, the cubic spline transformation was applied to estimate the location, scale, and shape parameters using the GAMLSS package. The 5th percentile of the Hb distribution, adjusted for altitude, was defined as the threshold for diagnosing anemia. Selecting the 5th percentile provides greater sensitivity for identifying infants with potential underlying conditions associated with anemia, thereby facilitating timely intervention.
-
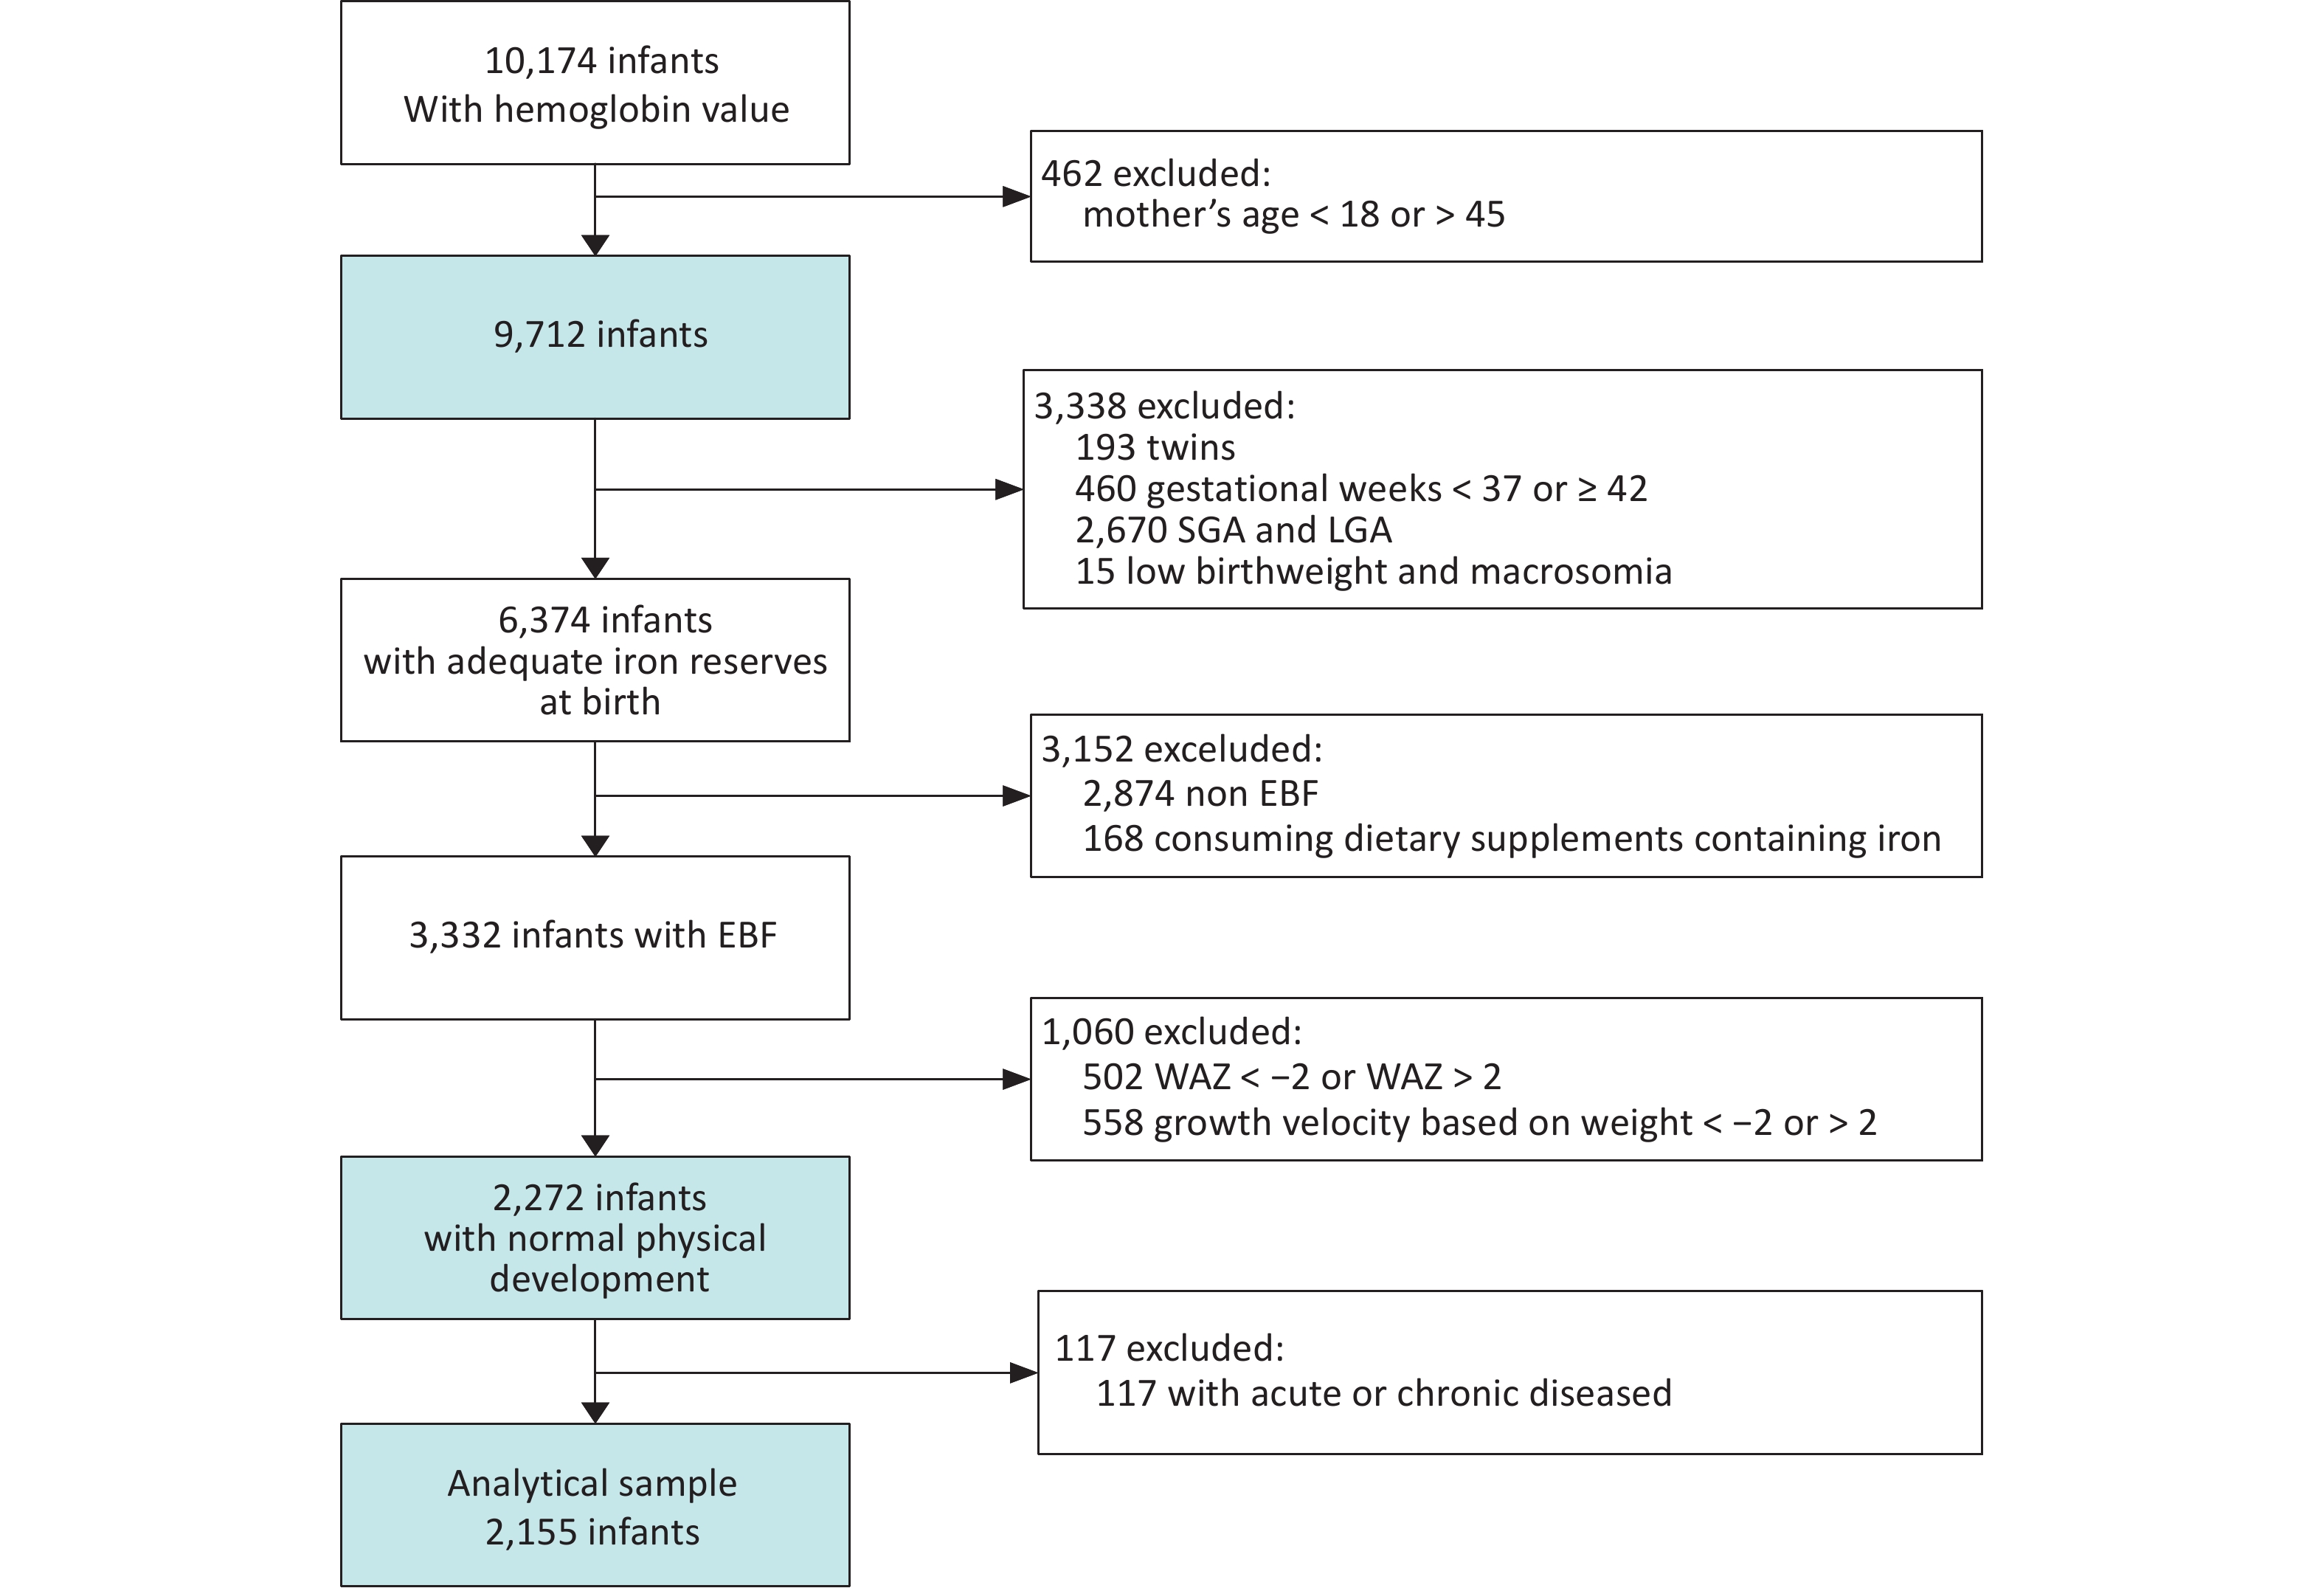
A total of 10,174 infants aged 0–5 months completed the CNHSC survey and had Hb measurements, including 1,695, 1,722, 1,661, 1,687, 1,739, and 1,670 infants in the 0-, 1-, 2-, 3-, 4-, and 5-month groups, respectively. After excluding infants whose mothers were younger than 18 years or older than 45 years, 9,712 infants were included in the analysis. Following the exclusion of individuals with insufficient iron stores, non-EBF, or physical development abnormalities (non-analytical samples), 2,155 infants remained in the analytical sample (Figure 1).
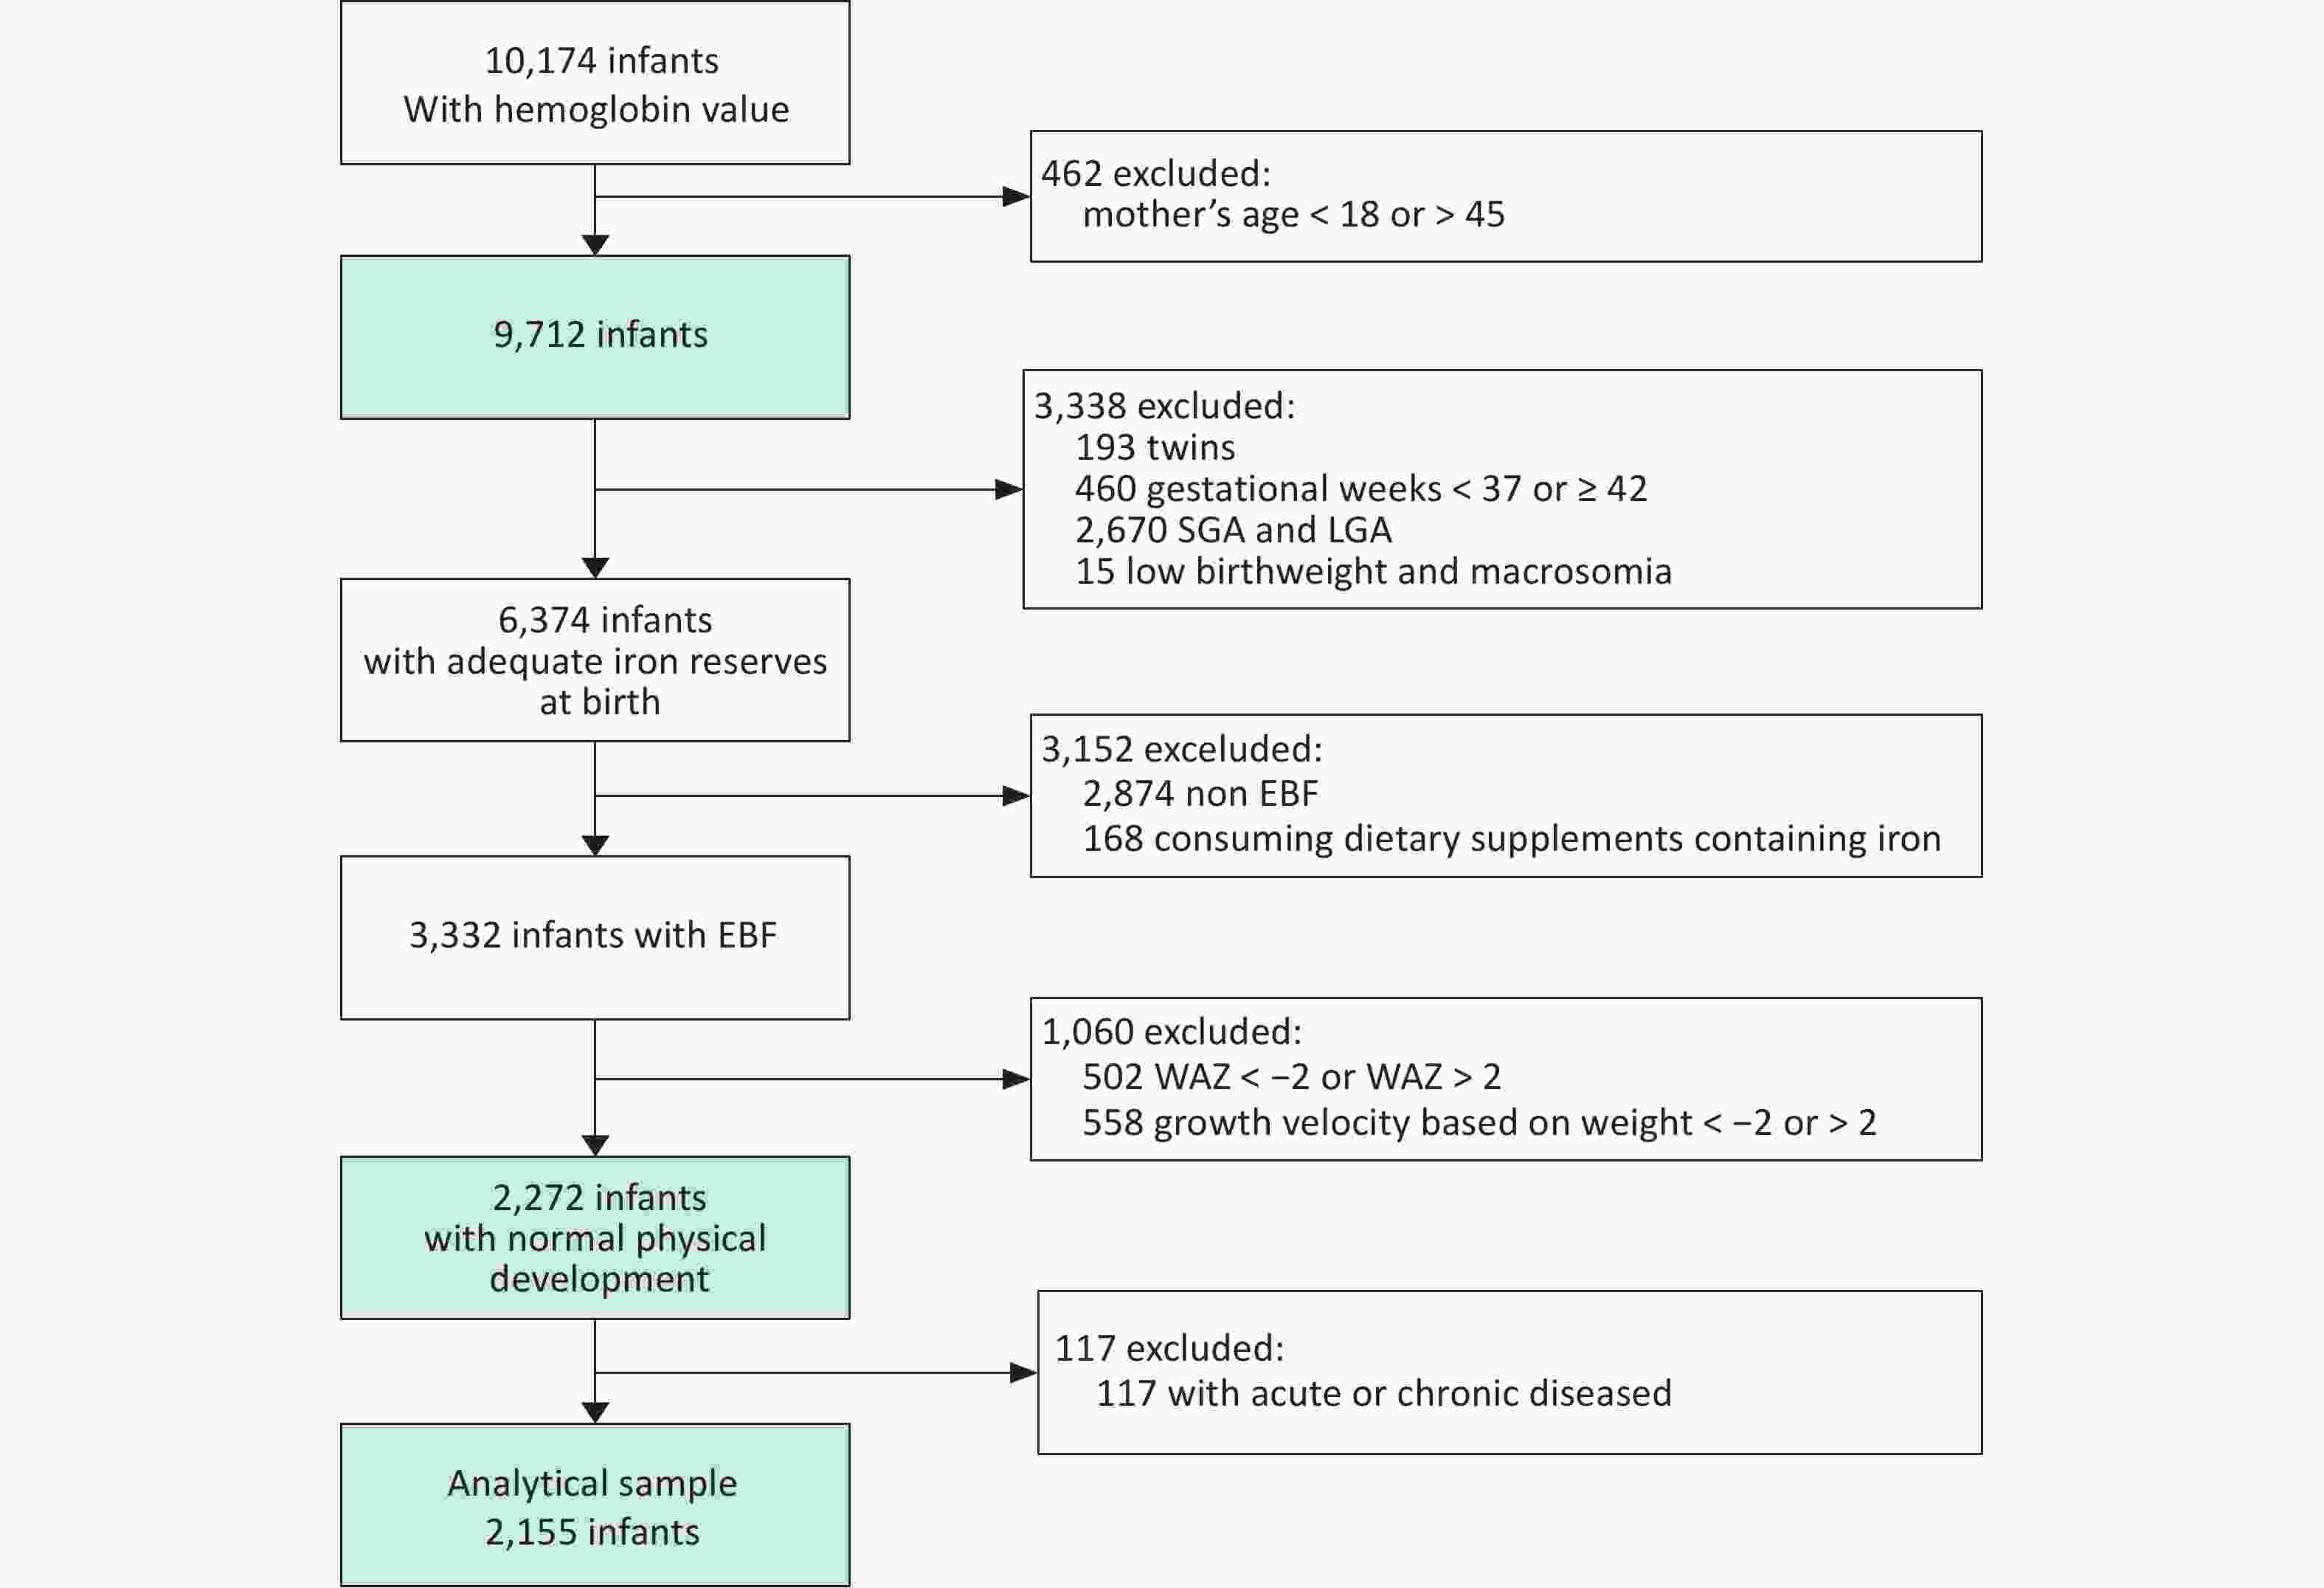
Figure 1. Flowchart of subject selection.
-
In the analytical sample, there were 190, 381, 413, 427, 403, and 341 infants in the 0-, 1-, 2-, 3-, 4-, and 5-month groups, respectively. The proportion of male infants was 47.9%, and 92.3% of the infants were of Han ethnicity. The mean birth weight was 3,222.0 ± 259.5 g. Statistically significant differences (P < 0.001) were observed between the analytical and non-analytical samples in terms of age in months, sex, ethnicity, gestational age at delivery, birth weight, age-specific weight, and Hb concentration (Table 2).
Analytical sample 1 Non-analytical sample P n Mean (SD) / % n Mean (SD) / % Months <0.001 0 month~ 190 8.8 1373 18.6 1 month~ 381 17.7 1216 16.5 2 month~ 413 19.2 1109 15.1 3 month~ 427 19.8 1181 16.0 4 month~ 403 18.7 1249 17.0 5 month~ 341 15.8 1236 16.8 Sex 0.022 boy 1033 47.9 3737 50.8 girl 1122 52.1 3627 49.3 Ethnicity <0.001 Han ethnicity 1988 92.3 6521 88.6 Non Han ethnicity 167 7.8 843 11.5 Region <0.001 Northeast China 348 16.2 1196 16.2 North China 296 13.7 1227 16.7 East China 352 16.3 1142 15.5 South China 213 9.9 697 9.5 Central China 284 13.2 918 12.5 Northwest China 310 14.4 1274 17.3 Southwest China 352 16.3 910 12.4 Gestational week at delivery (wk) 2155 39.2 (1.0) 6745 39.0 (1.5) <0.001 Birthweight (g) 2155 3222.0.1 (259.5) 7029 3331.3 (474.4) <0.001 WAZ 2155 0.4 (0.8) 7162 0.5 (1.4) <0.001 Weight gain (g) 0 month~ 190 775.2 (325.2) 1326 1023.2 (1842.5) <0.001 1 month~ 381 1906.3 (487.5) 1176 1856.8 (2217.5) 0.666 2 month~ 413 2880.6 (596.4) 1064 2916.1 (1385.2) 0.615 3 month~ 427 3460.4 (650.1) 1120 3669.6 (1896.0) 0.001 4 month~ 403 3960.0 (685.7) 1176 4197.2 (1209.8) <0.001 5 month~ 341 4458.4 (761.5) 1166 4822.4 (2257.9) <0.001 Hb Concentration (g/L) 2155 118.0 (14.0) 7364 118.9 (18.5) 0.039 Note. SD, Standard deviation; WAZ, Weight-for-age Z-score; Hb, Hemoglobin. Table 2. Comparison of basic characteristics between analytical samples and samples excluded
-
The median Hb values for the 0-, 1-, 2-, 3-, 4-, and 5-month groups were 128.0 g/L, 119.0 g/L, 115.0 g/L, 117.0 g/L, 118.0 g/L, and 117.0 g/L, respectively (Table 3). Hb levels decreased after birth, reached their nadir at approximately 2 months of age, and gradually increased thereafter in both boys and girls.
sex Months n Mean SD P1 P5 P25 P50 P75 P95 P99 All 0 month~ 190 128.8 16.5 98.0 103.0 117.0 128.0 141.0 156.0 185.0 1 month~ 381 118.5 13.5 82.0 97.0 109.0 119.0 127.0 141.0 152.0 2 month~ 413 115.1 14.3 84.0 92.0 106.0 115.0 124.0 140.0 151.0 3 month~ 427 117.4 13.2 87.0 96.0 109.0 117.0 125.0 142.0 151.0 4 month~ 403 117.8 12.8 84.0 98.0 110.0 118.0 124.0 142.0 152.0 5 month~ 341 115.9 12.0 87.0 94.0 109.0 117.0 122.0 135.0 143.0 Boy 0 month~ 101 129.7 16.8 103.0 108.0 117.0 131.0 139.0 156.0 185.0 1 month~ 174 119.3 13.1 87.0 98.0 110.0 120.0 128.0 140.0 147.0 2 month~ 207 115.8 14.9 86.0 94.0 104.0 115.0 126.0 140.0 151.0 3 month~ 192 117.9 13.1 83.0 97.0 110.0 118.0 126.0 141.0 151.0 4 month~ 185 118.8 13.5 84.0 99.0 111.0 119.0 124.0 142.0 158.0 5 month~ 170 116.5 12.4 87.0 94.0 109.0 116.0 124.0 137.0 145.0 Girl 0 month~ 89 131.0 15.7 98.0 107.0 118.0 130.0 144.0 155.0 171.0 1 month~ 207 119.5 13.0 90.0 100.0 110.0 119.0 128.0 141.0 152.0 2 month~ 206 116.3 12.5 92.0 96.0 108.0 116.0 124.0 135.0 149.0 3 month~ 235 119.4 12.4 94.0 100.0 110.0 120.0 127.0 142.0 152.0 4 month~ 218 119.9 11.1 96.0 103.0 113.0 120.0 125.0 141.0 144.0 5 month~ 171 118.2 10.7 88.0 98.0 112.0 119.0 123.0 135.0 144.0 Note. SD, Standard deviation; Hb, Hemoglobin. Table 3. Hb distribution by sex in infants aged 0-5 months in analytical sample (g/L)
-
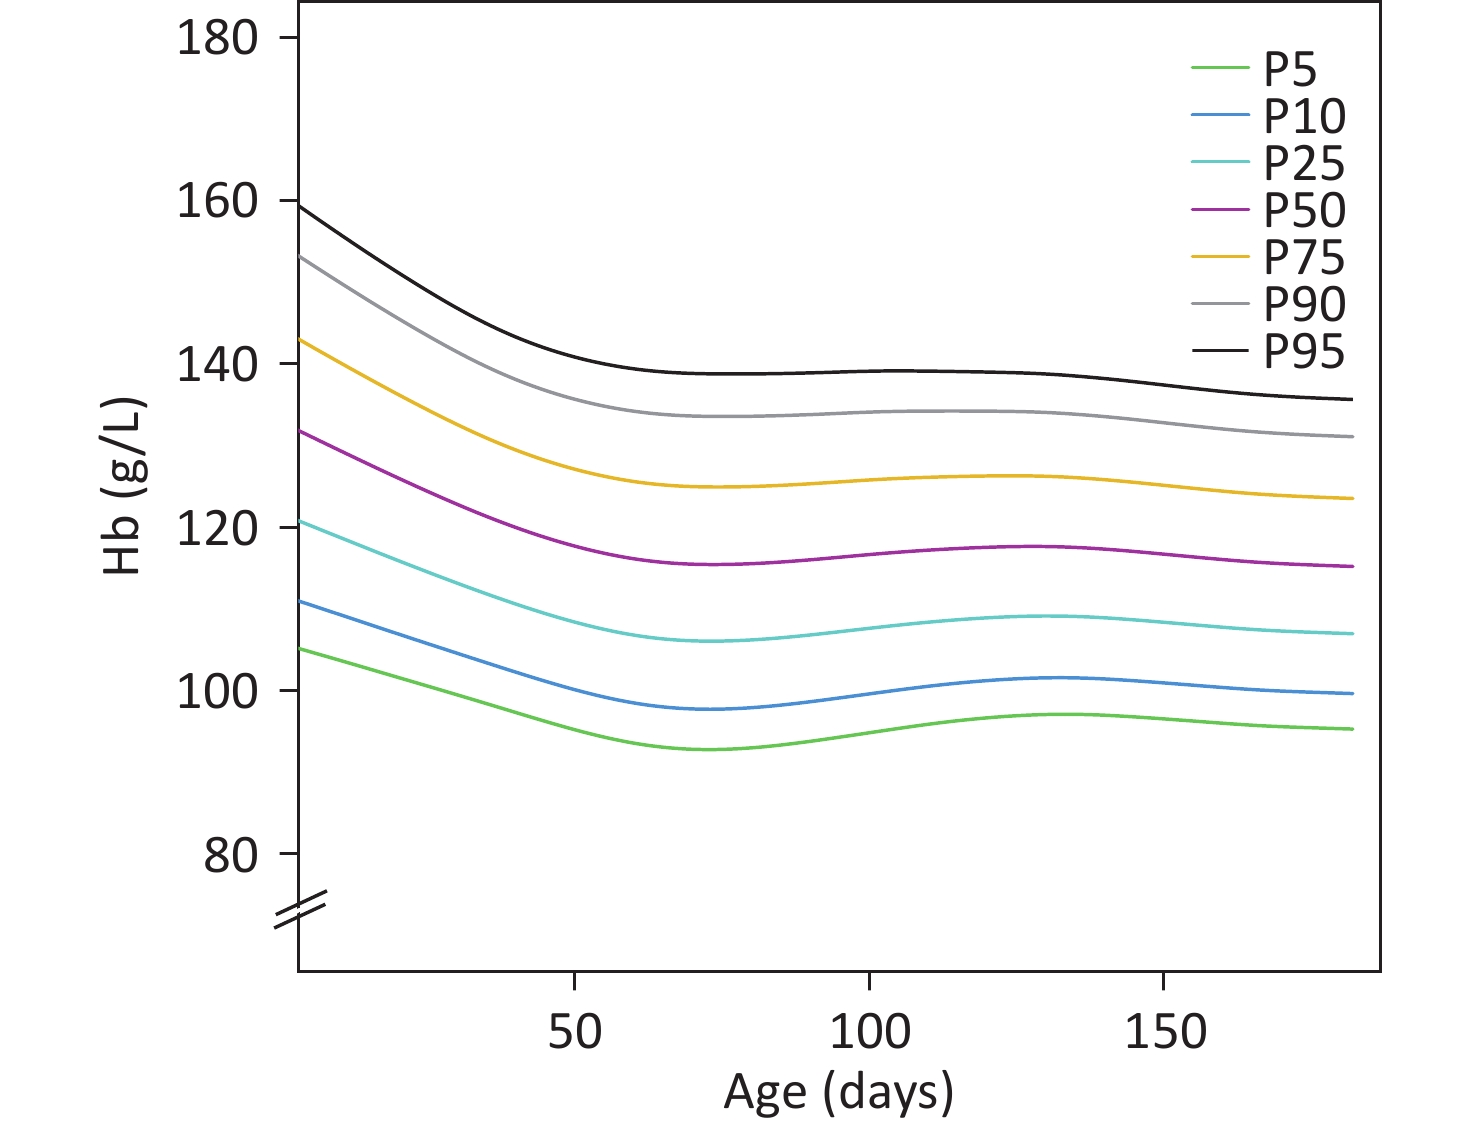
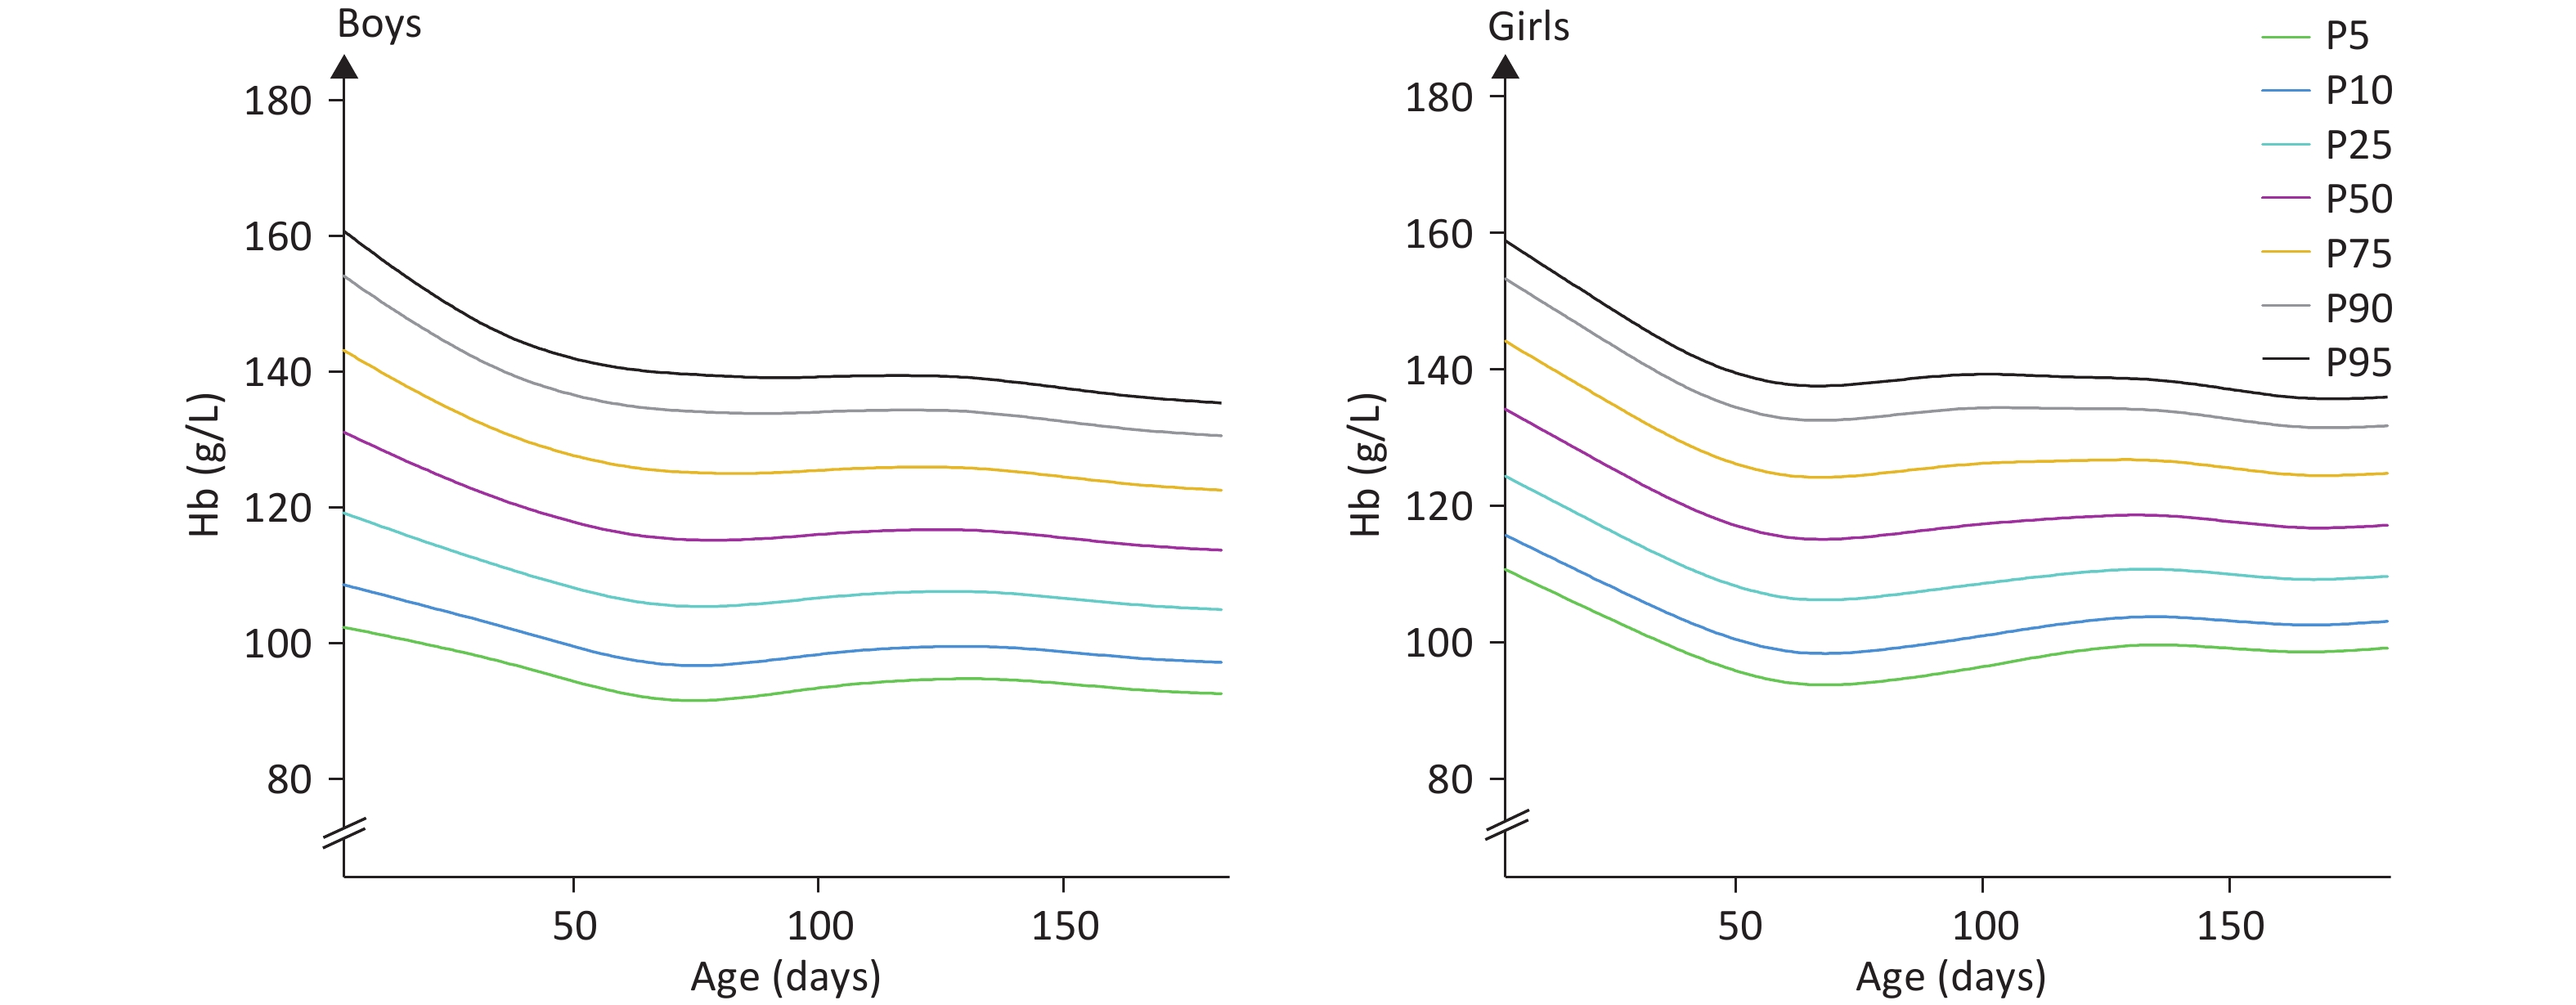
The median Hb values for infants aged 0, 1, 2, 3, 4, and 5 months were 127.8 g/L, 118.8 g/L, 115.5 g/L, 117.0 g/L, 117.6 g/L, and 115.8 g/L, respectively. The analysis results from the GAMLSS indicated that Hb levels peaked at birth and gradually decreased to a nadir at approximately 60 days after birth, representing a decline of about 12.3 g/L at the 50th percentile. Thereafter, Hb levels increased and reached a plateau. These trends were nearly identical for boys and girls. However, the median Hb concentrations at different months varied slightly by sex. The 50th percentile Hb level decreased by 11.9 g/L between 0 and 60 days for boys, whereas it decreased by 14.6 g/L for girls. Subsequently, Hb concentrations increased in both boys and girls from 60 days onward. The results are presented in Figures 2 and 3 and detailed in Table 4.
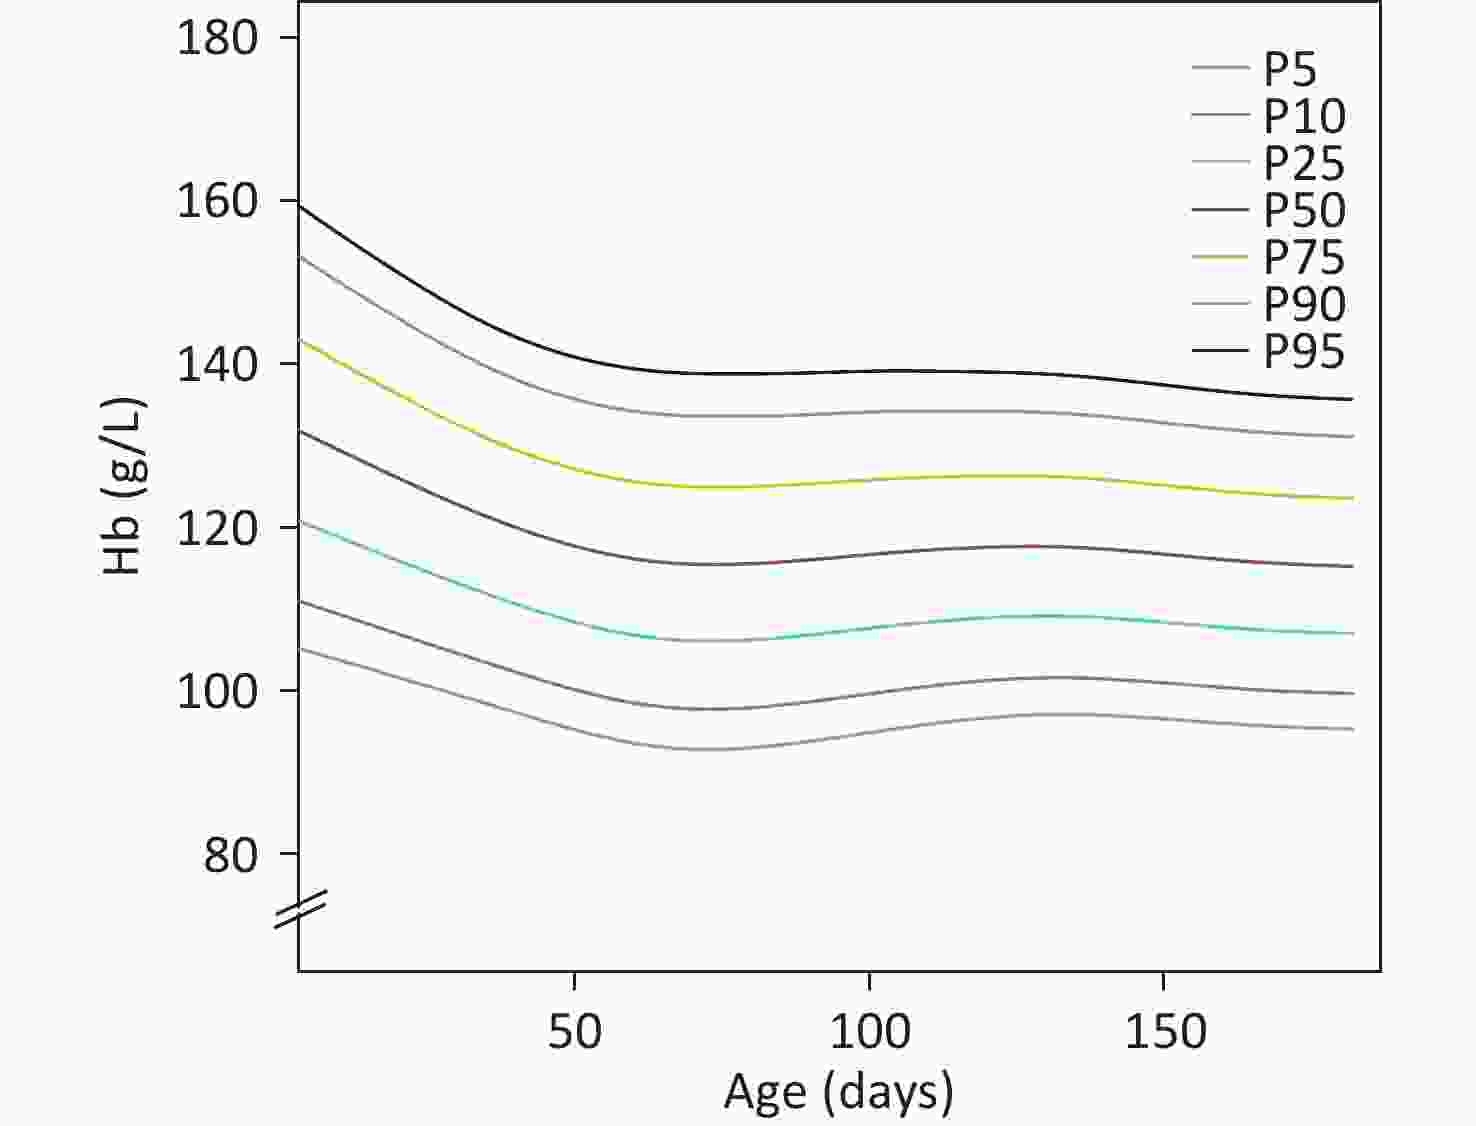
Figure 2. Smoothed hemoglobin percentile curves for infants aged 0–180 days in the analytical sample.
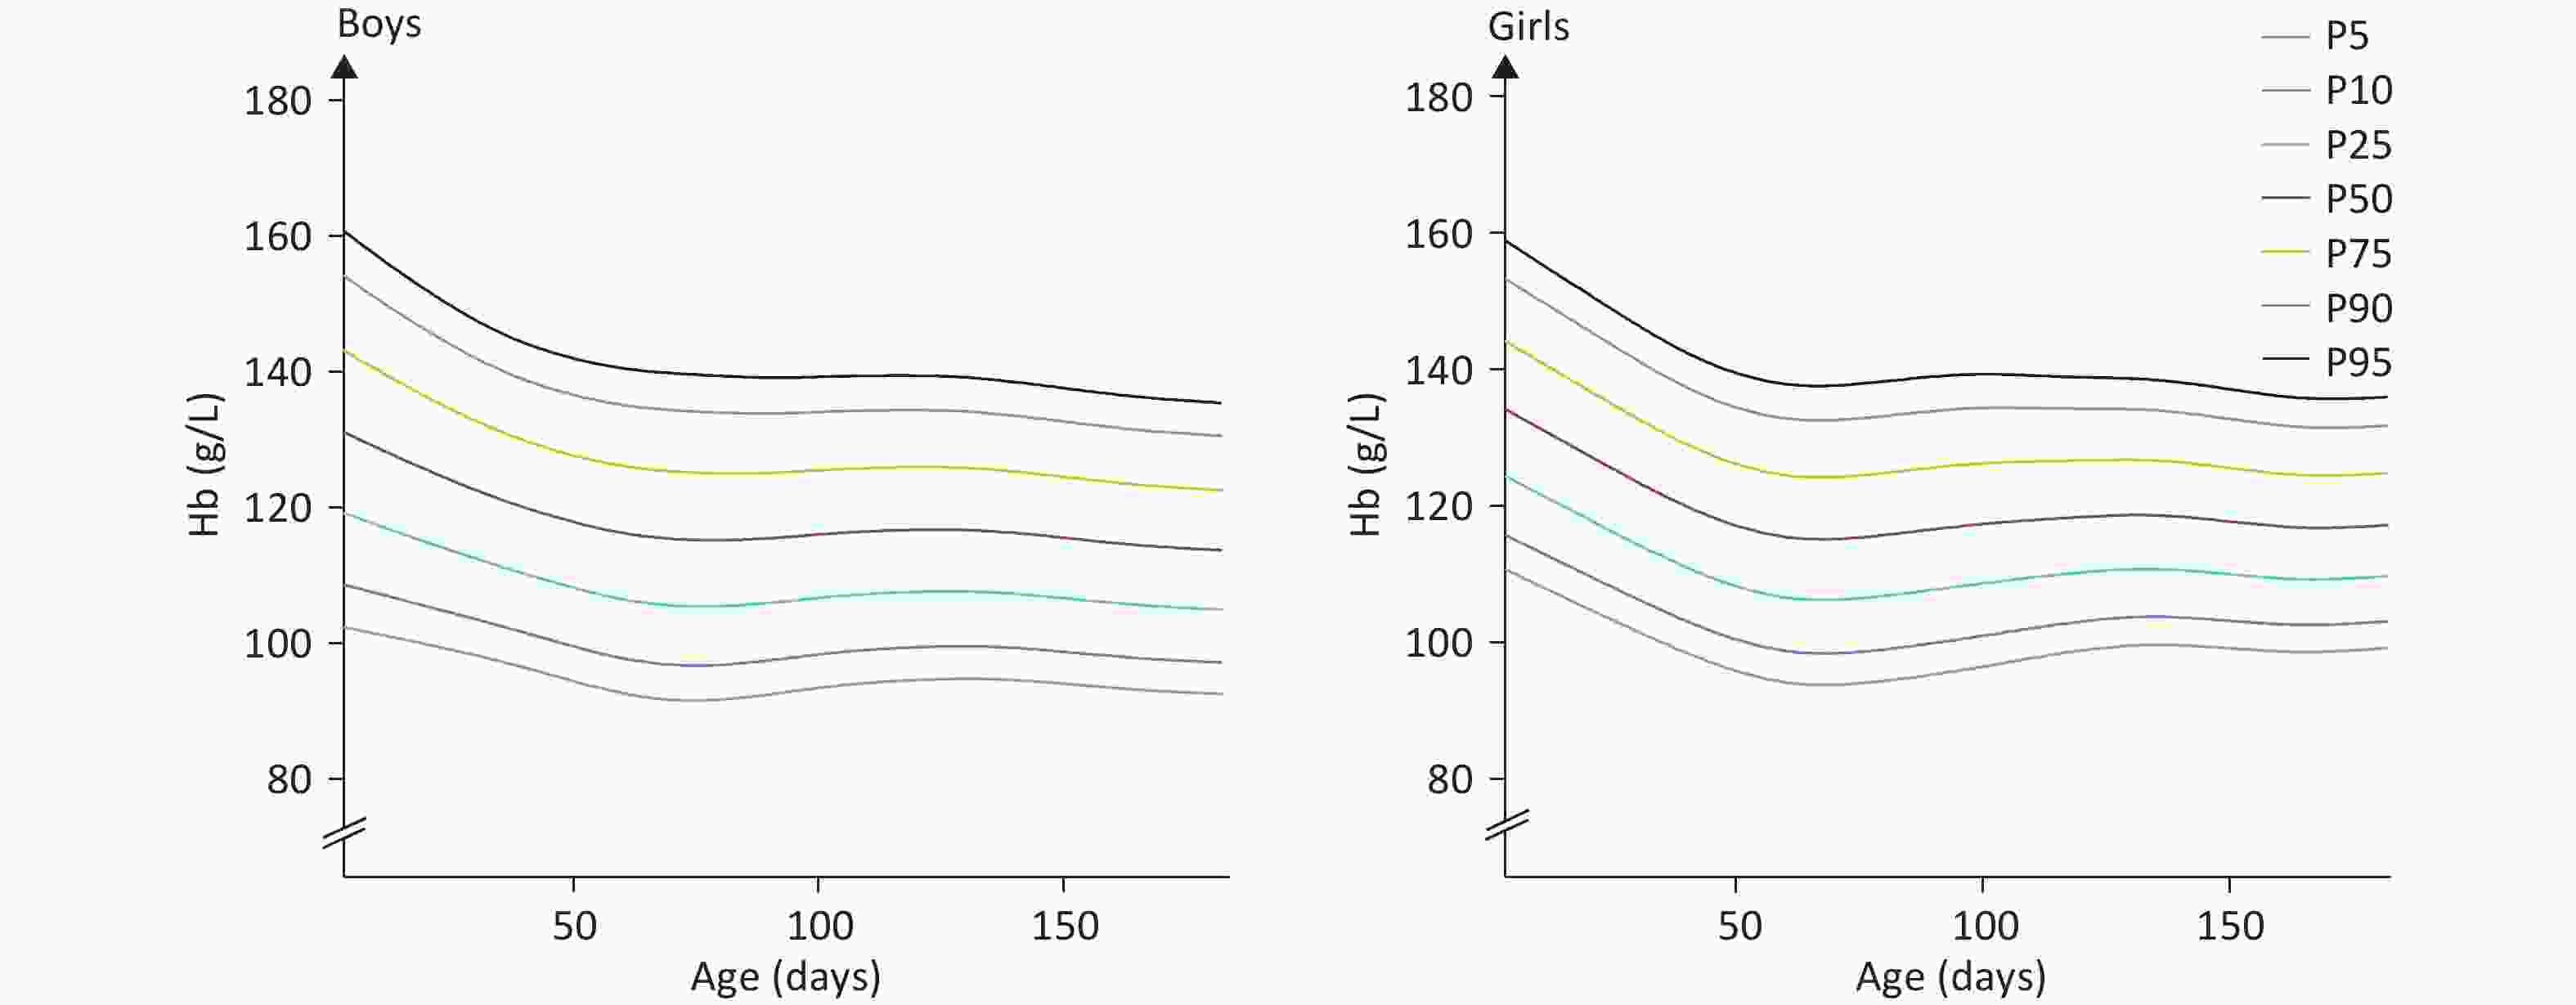
Figure 3. Sex-specific smoothed hemoglobin percentile curves for infants aged 0–180 days in the analytical sample.
Sex Months Day-age (d) P1 P 5 P 10 P 25 P 50 P 75 P90 P95 P99 All 0 month~ 15 92.6 102.7 108.2 117.4 127.8 138.3 147.8 153.6 164.5 1 month~ 45 87.2 96.3 101.2 109.5 118.8 128.2 136.8 142.0 151.8 2 month~ 75 83.7 92.8 97.8 106.1 115.5 125.0 133.6 138.8 148.7 3 month~ 105 86.7 95.4 100.1 108.0 117.0 126.0 134.2 139.2 148.5 4 month~ 135 88.8 97.1 101.6 109.1 117.6 126.1 133.9 138.6 147.4 5 month~ 165 87.7 95.8 100.1 107.5 115.8 124.1 131.7 136.3 145.0 Boy 0 month~ 15 89.9 100.6 106.4 116.2 127.2 138.3 148.4 154.5 166.0 1 month~ 45 85.9 95.4 100.6 109.2 118.9 128.7 137.6 143.0 153.2 2 month~ 75 82.0 91.6 96.8 105.5 115.3 125.2 134.2 139.6 149.9 3 month~ 105 84.8 93.9 98.8 107.0 116.3 125.7 134.3 139.4 149.1 4 month~ 135 85.9 94.8 99.5 107.6 116.6 125.7 133.9 138.9 148.3 5 month~ 165 84.6 93.2 97.9 105.7 114.5 123.4 131.5 136.4 145.6 girl 0 month~ 15 97.5 106.6 111.5 119.9 129.3 139.0 147.9 153.3 163.5 1 month~ 45 88.5 97.0 101.6 109.4 118.3 127.4 135.7 140.7 150.3 2 month~ 75 85.5 94.0 98.6 106.4 115.3 124.4 132.8 137.8 147.5 3 month~ 105 88.8 97.0 101.5 109.0 117.6 126.3 134.3 139.2 148.4 4 month~ 135 92.0 99.6 103.7 110.7 118.6 126.6 133.9 138.4 146.8 5 month~ 165 91.3 98.6 102.5 109.2 116.8 124.5 131.5 135.7 143.8 Note. GAMLSS, Generalised additive model for location scale and shape. Hb, Hemoglobin. Table 4. Hb distribution by sex in infants aged 0-5 months fitted by GAMLSS (g/L)
-
The reference Hb ranges for infants aged 0, 1, 2, 3, 4, and 5 months were 102.7–153.6 g/L, 96.3–142.0 g/L, 92.8–138.8 g/L, 95.4–139.2 g/L, 97.1–138.6 g/L, and 95.8–136.3 g/L, respectively. In this study, the 5th percentile of Hb distribution was defined as the threshold for diagnosing anemia. The Hb thresholds corresponding to the 5th percentile were 102.7 g/L, 96.3 g/L, 92.8 g/L, 95.4 g/L, 97.1 g/L, and 95.8 g/L for the 0-, 1-, 2-, 3-, 4-, and 5-month groups, respectively. The 5th percentile threshold decreased by 9.0 g/L between 0 and 60 days for boys and by 12.6 g/L for girls. The anemia rates in the analytical and non-analytical samples were 4.6% and 5.9%, respectively.
-
Hb concentration exhibits a distinct postnatal pattern characterized by an initial peak at birth, followed by a gradual decline to a nadir around 60 days after birth. Subsequently, Hb levels increase and stabilize. These trends are generally consistent between male and female infants, although the median Hb concentrations at various months differ by sex. Specifically, the 50th percentile Hb level decreased by 11.9 g/L in male infants and by 14.6 g/L in female infants from birth to 60 days. After this period, Hb concentrations began to rise in both sexes. Similarly, the 5th percentile threshold decreased by 9.0 g/L in male infants and by 12.6 g/L in female infants during the same time frame.
The postnatal fluctuations in Hb levels are notable. In the present study, infants in the 0-month cohort exhibited the highest Hb values, which gradually declined from 1 to 2 months, followed by a steady increase from 3 to 5 months, ultimately reaching a plateau. These observed Hb patterns align with trends reported in previous research. Jopling and Christensen established reference ranges for Hb during the neonatal period, reporting a linear decrease from 180.0 g/L at birth to 130.0 g/L at 28 days postpartum, which continued to decline to 110.0 g/L at 90 days postpartum[13,14]. Similarly, a Brazilian cohort study observed a decrease in mean Hb concentration among term infants (n = 21), from 159.6 g/L at birth to 119.5 g/L at 1 month and further to 105.5 g/L at 2 months[15].The rapid decline in Hb during the first month may be attributed to reduced erythropoietin production and mild transient hemolysis, particularly during the first week[16,17]. From approximately 60 days after birth, Hb concentrations in infants begin to rise gradually. In a study involving infants in The Gambia (n = 675), Hb concentrations at the 2.5th and 97.5th percentiles for infants aged 2 to 5 months were reported as 90.0–127.0 g/L for males and 93.0–129.0 g/L for females[18]. Blouin and Marol reported Hb values of 104.0 g/L[19] for infants aged 4 months and 97.0 g/L[20] for those aged 3–5 months, respectively.
Notably, male infants tend to have lower Hb levels than their female counterparts. In Southeast Asia, male infants aged 4–6 months exhibited significantly lower Hb concentrations than females (108.7 g/L vs. 111.4 g/L, P = 0.04)[21]. Similar findings were reported among Gambian infants aged 2–5 months (P = 0.002)[18] and Turkish infants aged 5–7 months (105.0 g/L vs. 108.0 g/L, P = 0.003)[5]. Some studies suggest that lower iron stores in male infants may contribute to their reduced Hb levels, possibly due to sex-based differences in fetal iron absorption or increased iron demands associated with faster growth rates[21].
The reference values for Hb in infants at different ages—specifically 0, 1, 2, 3, 4, and 5 months—were as follows: 102.7–153.6 g/L, 96.3–142.0 g/L, 92.8–138.8 g/L, 95.4–139.2 g/L, 97.1–138.6 g/L, and 95.8–136.3 g/L, respectively. In Nigeria, normative Hb values for healthy infants have been established at 135.0–180.0 g/L for those aged 1–7 days, 130.0–160.0 g/L for infants aged 8–14 days, and 125.0–140.0 g/L for those between 1 month and 1 year[7]. In another African context, Humberg et al. proposed a reference range of 84.0–128.0 g/L for Hb concentrations in infants aged 4 to 9 weeks[22]. Troy et al. suggested reference values of 90.0–119.0 g/L and 90.0–121.0 g/L for infants aged 3 and 5 months, respectively[23]. A study conducted in The Gambia corroborated the findings reported by Troy et al.[18]. Notably, the aforementioned studies did not account for iron stores at birth or feeding mode, which may have contributed to the lower reference values compared with those observed in the present study.
There is a paucity of research establishing Hb thresholds for diagnosing anemia in infants younger than 6 months. Magnus et al. identified an Hb concentration below 105.0 g/L as the cutoff value for anemia in 4-month-old infants with adequate iron stores[6]. Yalcin et al. excluded infants with acute or chronic illnesses or a family history of thalassemia and reported a reference value of 92.0 g/L for infants aged 5–7 months[5]. Using the 5th percentile as a diagnostic threshold among apparently healthy infants, we proposed Hb cutoff values of 102.7 g/L, 96.3 g/L, 92.8 g/L, 95.4 g/L, 97.1 g/L, and 95.8 g/L to define anemia in the 0-, 1-, 2-, 3-, 4-, and 5-month age groups, respectively. Factors such as ethnicity, timing of complementary food introduction, and disease status may influence hemoglobin levels, which may partly explain the inconsistencies between the anemia thresholds identified in this study and those in the WHO guidelines and other studies.
This study has several limitations. First, the Hb thresholds used to define anemia were derived from a statistical approach rather than from associations with health outcomes. Given that this was a cross-sectional study, longitudinal research is warranted to validate the proposed cutoff values. Second, biochemical indicators of the infants’ iron nutritional status were not included. Previous studies have demonstrated that total fetal iron stores are positively correlated with birth weight and gestational age,[9] and infants with abnormal birth weight were excluded from the present analysis. In addition, the malaria infection status of the infants was not assessed. However, the current malaria prevalence in China is extremely low, and the country received malaria-free certification from the WHO in 2021[24]. The timing of umbilical cord clamping was also not recorded in this study. Research has shown that the timing of umbilical cord ligation during delivery directly affects the infant’s Hb concentration, and this influence may persist for a certain period[19]. China adopted the WHO’s Early Essential Newborn Care (EENC) program in 2016, which has since been gradually implemented nationwide. Delayed cord clamping is one of the key recommended interventions under the EENC framework[25]. Although information on cord clamping timing was not collected, most participating hospitals reportedly follow the guidelines for delayed umbilical cord clamping. Finally, the sample size for each age group was relatively limited, particularly for the 0-month-old group. Nevertheless, the sample sizes in studies used by the WHO to define anemia cutoffs for infants aged 6–23 months were comparable or even smaller.
The thresholds for defining anemia in infants aged 0–5 months were established for the first time based on a nationwide, population-based study conducted in China. The Hb thresholds were 102.7 g/L, 96.3 g/L, 92.8 g/L, 95.4 g/L, 97.1 g/L, and 95.8 g/L for the 0-, 1-, 2-, 3-, 4-, and 5-month age groups, respectively. These thresholds are expected to facilitate the early identification of anemia in infants and to advance the timing of subsequent interventions at both national and global levels.
Hemoglobin Thresholds for Defining Anemia Among Healthy Infants Aged 0–5 Months in China: A Population-Based Study
doi: 10.3967/bes2025.144
- Received Date: 2025-06-09
- Accepted Date: 2025-10-16
-
Key words:
- Infant /
- Hemoglobin /
- Anemia
Abstract:
The authors declare that they have no conflicts of interest.
This study protocol was reviewed and approved by the Medical Ethical Review Committee of the National Institute for Nutrition and Health, Chinese Center for Disease Control and Prevention (Approval No. 2019-009). All parents or legal guardians of the participants provided written informed consent.
| Citation: | Shuxia Wang, Shan Jiang, Xuehong Pang, Qian Zhang, Bowen Chen, Tao Xu, Yuying Wang, Wenhua Zhao, Zhenyu Yang. Hemoglobin Thresholds for Defining Anemia Among Healthy Infants Aged 0–5 Months in China: A Population-Based Study[J]. Biomedical and Environmental Sciences. doi: 10.3967/bes2025.144

|

 Quick Links
 DownLoad: