


-
Physical activity is defined as any bodily movement produced by skeletal muscles that results in energy expenditure above resting levels[1,2]. An insufficient level of physical activity to meet current recommendations is referred to as physical inactivity[2–4], a leading risk factor for global mortality and a major contributor to the increasing prevalence of overweight and obesity[5,6]. In contrast, sedentary behavior is any waking activity characterized by an energy expenditure of ≤ 1.5 metabolic equivalents (METs) while in a sitting, reclining, or lying posture[7]. Classified by energy expenditure, 24-hour movement comprises physical activity, sedentary behavior, and sleep[8]. These three components are interrelated and mutually reinforcing, collectively contributing to overall health benefits [9,10].
Emerging evidence suggests that higher levels of physical activity are associated with improved bone health and a reduced risk of excessive weight gain and obesity among children aged 3–6 years[9]. Conversely, physical inactivity during childhood has been linked to diminished cardiorespiratory fitness, impaired musculoskeletal development, adiposity accumulation, and increased susceptibility to metabolic disorders[10,11]. Furthermore, inadequate physical activity is correlated with poorer cognitive and psychosocial outcomes, including reduced academic achievement, elevated anxiety and depressive symptoms, and inferior sleep quality[12,13]. Alarmingly, many young children fail to achieve recommended physical activity levels while engaging in increasing amounts of sedentary behavior[14]. Prolonged sedentary time has been associated with adverse psychological outcomes, such as anxiety and depression[15], and with an elevated risk of noncommunicable diseases, including obesity, cardiovascular disease, and type 2 diabetes[16,17]. Concurrently, insufficient sleep has become increasingly prevalent among children[18] and may contribute to behavioral and psychological difficulties, obesity, and delayed cognitive development in preschoolers[19,20]. Within the 24-hour day, physical activity, sedentary behavior, and sleep are interdependent, exhibiting dynamic interactions and combined effects on health [21,22]. Replacing sedentary time with either sleep or physical activity can substantially reduce cardiovascular risk, improve weight management, alleviate sleep disorders, and enhance overall well-being[22–24]. The preschool years represent a critical developmental period for establishing lifelong behavioral patterns, underscoring the importance of cultivating healthy habits during this formative stage[25].
In 2019, the World Health Organization (WHO) published guidelines on physical activity, sedentary behavior, and sleep for children under 5 years of age[6] to address existing gaps in this population and contribute to the implementation of the Global Action Plan on Physical Activity 2018–2030[26]. The WHO recommends that children aged 3–4 years engage in at least 180 minutes of various types of physical activity at any intensity per day, limit sedentary screen time to no more than 1 hour, and have 10–13 hours of good quality sleep. These recommendations align with those of other major countries, including Canada[27], Australia[28], and the United Kingdom[29]. Similarly, the Chinese government issued physical activity guidelines in 2021 that are consistent with the WHO recommendations for children aged 3–5 years[30]. However, limited information is available on 24-hour movement behaviors of preschool-aged children in China, as no nationally representative data have been published since the release of these guidelines. Monitoring 24-hour movement behaviors among children aged 3–5 years is essential to identify research gaps and inform the development of public health initiatives. Regular large-scale surveillance would enable evaluation of adherence to these guidelines and provide insight into the health benefits of physical activity among Chinese children[10].
This study aims to describe the current status of 24-hour movement behaviors, including physical activity, sedentary behavior, and sleep period, among Chinese children aged 3–5 years using nationally representative data, and to investigate disparities by age, sex, and residential area to address deficiencies in existing evidence. Understanding these differences is crucial for developing targeted interventions that promote the establishment of healthy lifestyle habits from early childhood.
-
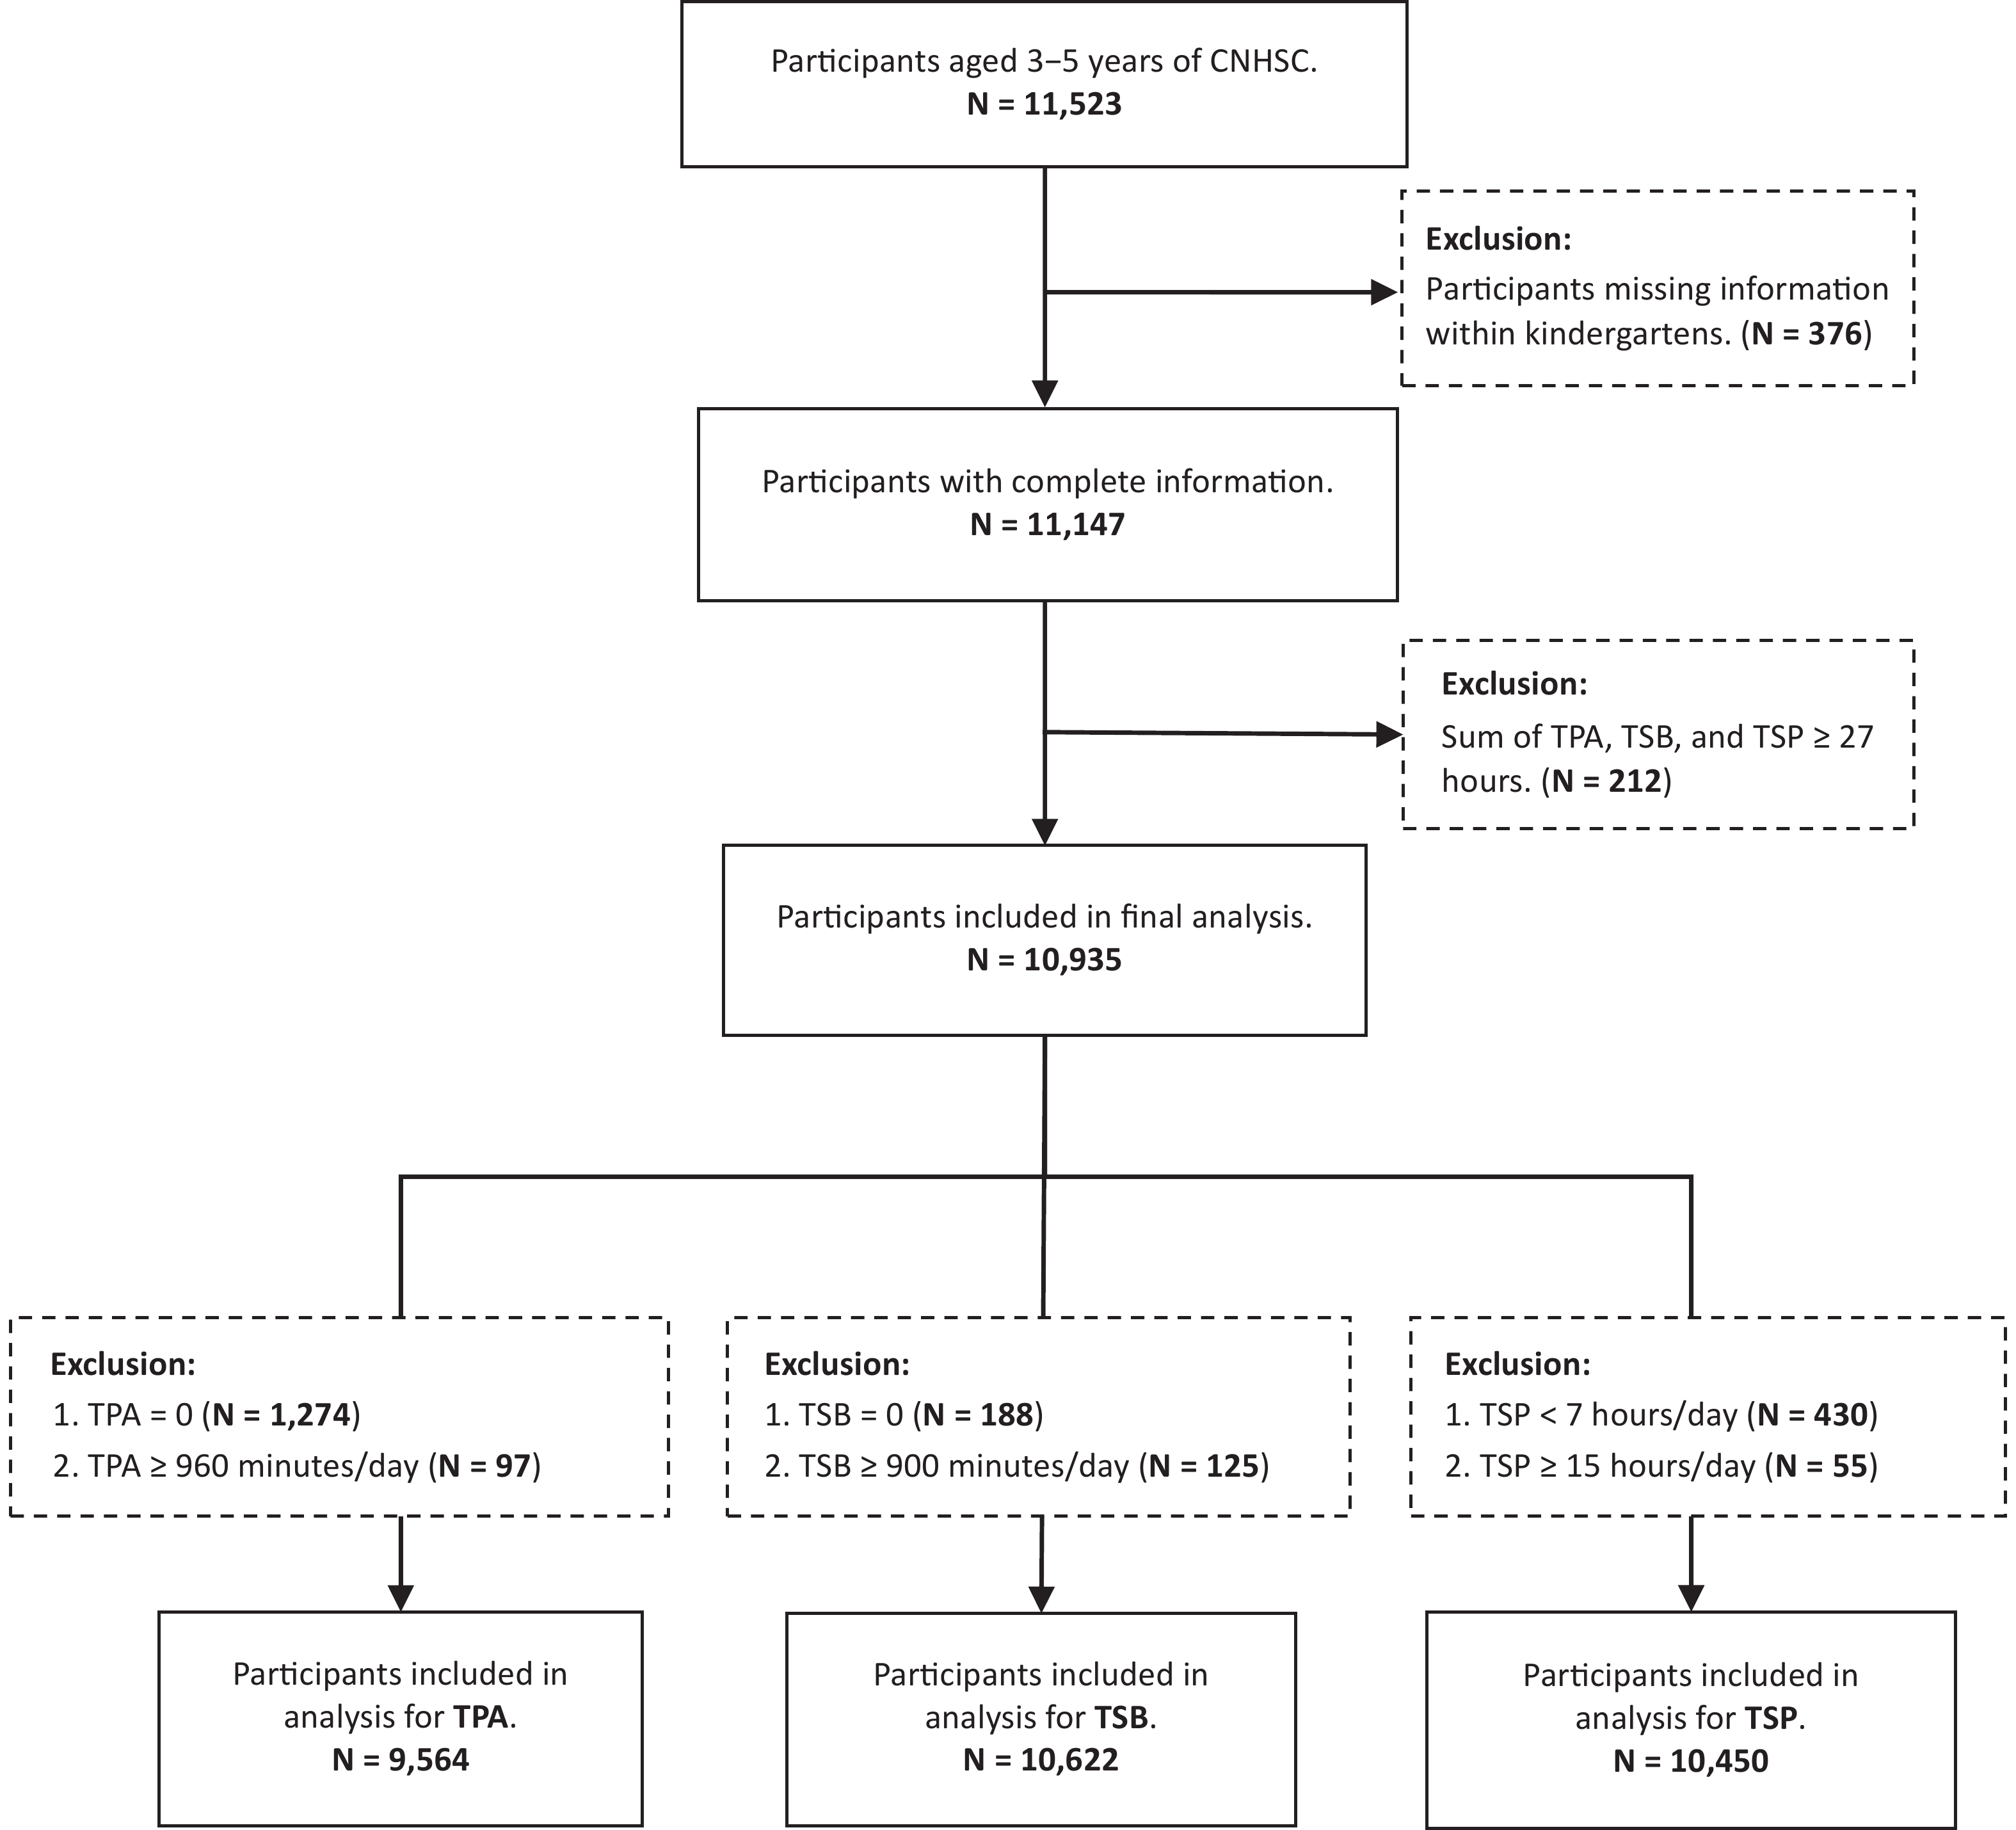
This study was derived from the China National Nutrition and Health Systematic Survey (CNHSC), a nationally representative, cross-sectional survey conducted between 2019 and 2021. The CNHSC included children and adolescents aged 0–17 years across China. The survey employed a multi-stage, stratified, randomized cluster sampling method, dividing China into seven regions based on economic development levels: South, Southwest, North, Northwest, East, Central, and Northeast China. Within each region, two provinces (autonomous regions or municipalities) were randomly selected. In each selected province, one urban district and one rural county were then randomly chosen, yielding a total of 28 survey counties or districts across 14 provinces (autonomous regions or municipalities). In this study, a subsample of children aged 3–5 years from CNHSC was analyzed, with further exclusions applied to each component as appropriate. Figure 1 illustrates a detailed flowchart of sample inclusion and analysis, and a comprehensive description of the study design has been previously published[31]. Ethical approval for the study was obtained from the Medical Ethical Review Committee at the National Institute for Nutrition and Health, Chinese Center for Disease Control and Prevention (Approval No. 2019-009). Written informed consent was obtained from the parents or legal guardians of all participants before data collection.

Figure 1. Flowchart of participants’ inclusion and analysis in this study. CNHSC: China National Nutrition and Health Systematic Survey; TPA: daily total time of physical activity; TSB: daily total time of sedentary behaviors; TSP: daily total sleep period.
-
Trained investigators conducted face-to-face interviews with the primary caregivers of preschool-aged children, while teachers provided information on activities occurring within kindergarten. A structured questionnaire, adapted from the Chinese Children Physical Activity Questionnaire (CCPAQ), was used to assess children’s movements and energy expenditure over a 24-hour period during the previous week. The CCPAQ has been proven to be a reliable tool with validity and reliability[32]. For this study, the questionnaire was updated and refined to capture movement characteristics specific to preschool-aged children. The instrument is a 7-day recall questionnaire comprising 21 items designed to collect information on preschool children’s 24-hour movement patterns. Caregivers and teachers were asked to recall the children’s activities throughout the entire days, both inside and outside kindergarten settings, over the previous week. Daily wake-up, nap, and bedtime schedules were recorded. Additional information was collected on the mode of transportation to and from kindergarten, the need to climb stairs, and any indoor or outdoor activities that induced heavy breathing or sweating. Sedentary activities performed while sitting, reclining, or lying down—including reading, drawing, arts and crafts, playing with toys, screen time (e.g., television [TV], tablets, phones), and playing musical instruments—were also recorded. These activities encompassed all types of interest classes and extracurricular tutoring sessions. The coding scheme for children’s activity types was largely consistent with the CCPAQ and classified activities by intensity into three categories: mode of transport, physical activities, and sedentary behaviors. Data on demographic and social factors were also collected, including age, sex, residential location (urban or rural), relationship to primary caregivers (parents, grandparents, or others), left-behind status (yes or no), primary caregiver’s education level (primary school or lower, middle school, college or higher), and kindergarten attendance.
-
A 24-hour period of movement can be categorized into three components: total physical activity (TPA, minutes/day), total sedentary behavior (TSB, minutes/day), and total sleep period (TSP, hours/day). TPA included the time children spend being physically active at kindergarten, at home, and during after-school classes, encompassing various forms of physical activity at any intensity, such as climbing, walking, running, and jumping. TSB represented the average daily time spent in sedentary activities while sitting, reclining, or standing. These activities include reading, drawing, arts and crafts, playing with toys, screen time (e.g., watching TV, using tablets or cell phones), and playing musical instruments. TSP encompassed both daytime napping and overnight sleep. The duration of each activity type was calculated from reported frequency and session length. Activity data were then classified according to the coding scheme and summarized to calculate TPA and TSB. TSP was calculated by subtracting recorded wake-up time from recorded bedtime, and adding the duration of daytime naps. Movement data from inside and outside kindergarten settings were combined based on each child’s attendance during the previous week. For each child, the total time spent in physical activity, sedentary behavior, and sleep was calculated daily, summed over the week, and then divided by seven to obtain the average daily time for each behavior. These averages represented the final TPA, TSB, and TSP values.
-
In this study, physical inactivity was defined as engaging in less than 180 minutes of TPA per day. Additional cutoffs of 120 and 60 minutes per day were used to delineate various degrees of physical inactivity. The prevalence of physical inactivity was calculated as the proportion of children aged 3–5 years whose average daily TPA during the previous week was less than 180 minutes.
-
Descriptive analyses were performed to present the mean, standard deviation, and percentile distribution (P5–P95) for TPA, TSB, and TSP, along with the prevalence of physical inactivity across different age groups, sexes, and residential areas. Group differences in normally distributed continuous variables (TSP) were analyzed using one-way analysis of variance. For non-normally distributed continuous variables (TPA and TSB), two-group comparisons were conducted using the Wilcoxon test, and comparisons among three groups were performed using the Kruskal–Wallis test. Differences in categorical variables (prevalence of physical inactivity) between groups were examined using the Chi-square test. All analyses were performed using SAS software (version 9.4; SAS Institute Inc., Cary, NC, USA).
-
After excluding children with missing or implausible data, a total of 10,935 children aged 3–5 years were included in the final analysis. Among them, 51.0% (5,574/10,935) were boys, and 50.1% (5,477/10,935) resided in urban areas. Approximately one-third of the total sample comprised children aged 3, 4, and 5 years, respectively. Most children were primarily cared for by their parents (74.3%; 8,115/10,920), and the majority of primary caregivers had received at least a middle school education. Nearly 10% of the children were classified as left-behind. Table 1 presents the sociodemographic characteristics of the participants. Furthermore, the proportions of children being cared for by their grandparents, those whose primary caregivers had only a primary school education or lower, and left-behind children were significantly higher in rural than in urban areas.
Characteristics Total % (n/N) Urban % (n/N) Rural % (n/N) P value Age group (years) 0.504 3–3.9 32.3 (3,516/10,935) 32.1 (1,759/5,477) 32.4 (1,767/5,458) 4–4.9 34.6 (3,787/10,935) 34.3 (1,876/5,477) 35.0 (1,911/5,458) 5–5.9 33.1 (3,622/10,935) 33.6 (1,842/5,477) 32.6 (1,780/5,458) Sex 0.209 Boys 51.0 (5,574/10,935) 50.4 (2,759/5,477) 51.6 (2,815/5,458) Girls 49.0 (5,361/10,935) 49.6 (2,718/5,477) 48.4 (2,643/5,458) Primary caregiver* < 0.001 Parents 74.3 (8,115/10,920) 76.6 (4,185/5,467) 72.1 (3,930/5,453) Grandparents 25.5 (2,779/10,920) 23.2 (1,269/5,467) 27.7 (1,510/5,453) Others 0.2 (26/10,920) 0.2 (13/5,467) 0.2 (13/5,453) Education level of the primary caregiver* < 0.001 Primary school and below 13.3 (1,437/10,820) 8.8 (478/5,414) 17.7 (959/5,406) Middle school 45.2 (4,888/10,820) 41.5 (2,249/5,414) 48.8 (2,639/5,406) College and higher 41.5 (4,495/10,820) 49.6 (2,687/5,414) 33.4 (1,808/5,406) Left-behind children* < 0.001 Yes 9.1 (998/10,921) 5.9 (321/5,473) 12.4 (677/5,448) No 90.9 (9,923/10,921) 94.1 (5,152/5,473) 87.6 (4,771/5,448) Note. *There were missing values in the corresponding variables. Table 1. Sociodemographic characteristics of the participants
-
Chinese children aged 3–5 years spent a median of 121.4 minutes/day (P25: 71.4; P75: 209.6) in TPA and 231.4 minutes/day (P25: 175.0; P75: 304.3) in TSB. The average TSP was 11.46 ± 1.00 hours/day. With increasing age, both TPA and TSB increased, whereas TSP decreased (all P < 0.001). The median TPA for children aged 3, 4, and 5 years was 108.6, 121.4, and 130.0 minutes/day, respectively. Correspondingly, the median TSB was 220.0, 234.8, and 238.6 minutes/day, respectively, and the average TSP was 11.62 ± 1.01, 11.46 ± 0.98, and 11.30 ± 1.00 hours/day, respectively.
No significant sex disparities were observed in TPA (P = 0.177), TSB (P = 0.056), and TSP (P = 0.703). However, children living in rural areas exhibited significantly lower levels of TPA (P < 0.001) and TSP (P = 0.005) compared with those living in urban areas. The urban–rural disparity in TSB was not statistically significant (P = 0.831). Tables 2–4 provide detailed results, which also display the 5th to 95th percentiles of TPA, TSB, and TSP, stratified by age group, sex, and residential area.
Age group Characteristics n Mean SD 5th 10th 25th 50th 75th 90th 95th 3–3.9 years Boys 1,522 148.8 127.5 17.1 28.6 54.3 112.9 192.9 330.0 450.0 Girls 1,470 139.7 121.4 14.3 25.7 48.6 107.1 192.9 296.4 397.1 Urban 1,589 161.2 130.8 17.1 30.6 71.4 123.3 217.1 357.1 450.0 Rural 1,403 125.3 114.3 12.9 25.7 40.0 92.9 171.4 257.1 354.3 Sub-total 2,992 144.4 124.6 17.1 25.7 51.4 108.6 192.9 320.0 419.3 4–4.9 years Boys 1,712 158.4 122.7 25.0 35.7 77.1 121.8 212.1 328.6 411.4 Girls 1,654 156.2 122.2 21.4 34.3 71.1 121.4 210.3 317.1 407.1 Urban 1,731 164.0 125.9 17.1 36.0 78.6 125.7 227.1 341.4 420.0 Rural 1,635 150.2 118.4 28.6 34.3 68.6 121.4 192.9 300.0 390.0 Sub-total 3,366 157.3 122.5 22.9 35.7 74.3 121.4 211.4 321.4 408.6 5–5.9 years Boys 1,619 168.1 130.3 23.7 34.3 85.7 128.6 221.4 345.7 450.0 Girls 1,587 162.7 119.3 26.3 40.0 85.7 131.4 214.3 317.1 419.3 Urban 1,703 180.2 130.8 25.0 42.9 94.3 142.9 234.3 358.6 464.3 Rural 1,503 148.7 115.8 28.6 34.3 71.4 111.4 194.3 308.6 394.3 Sub-total 3,206 165.4 124.9 25.7 37.9 85.7 130.0 217.1 337.1 438.6 3–5.9 years Boys 4,853 158.6 127.0 21.4 34.3 72.9 121.4 211.4 337.1 437.1 Girls 4,711 153.2 121.3 18.6 31.4 68.6 121.4 207.1 312.9 407.1 Urban 5,023 168.6 129.4 17.1 34.3 85.7 132.1 227.1 347.1 450.0 Rural 4,541 142.0 116.8 22.9 30.0 57.1 108.6 185.7 294.3 385.7 Total 9,564 156.0 124.3 20.0 32.9 71.4 121.4 209.6 326.4 420.7 Note. SD, standard deviation. Table 2. Distribution of total physical activity (TPA) time in Chinese children aged 3–5 years by sex and residential areas (minutes/day)
Age group Characteristics n Mean SD 5th 10th 25th 50th 75th 90th 95th 3–3.9 years Boys 1,744 230.4 111.3 60.0 95.7 157.9 218.2 300.0 364.3 414.3 Girls 1,648 236.5 115.0 70.0 114.3 162.1 220.1 300.0 373.6 434.3 Urban 1,704 231.7 101.1 90.0 120.0 167.1 217.1 287.1 360.0 418.6 Rural 1,688 235.1 124.0 60.0 90.0 150.0 223.2 306.8 377.1 430.0 Sub-total 3,392 233.4 113.1 60.0 103.6 160.0 220.0 300.0 367.3 425.7 4–4.9 years Boys 1,867 245.6 111.9 84.3 120.0 175.7 234.3 305.7 378.6 441.7 Girls 1,821 247.5 107.8 94.0 120.0 178.6 235.0 306.0 376.0 436.7 Urban 1,828 247.1 106.5 99.3 128.6 180.0 231.4 300.5 371.4 443.9 Rural 1,860 246.1 113.2 71.4 120.0 174.3 239.4 311.4 381.4 432.9 Sub-total 3,688 246.6 109.9 90.0 120.0 177.1 234.8 305.7 377.7 440.0 5–5.9 years Boys 1,802 249.4 109.6 100.0 121.4 180.0 237.1 305.7 387.1 437.1 Girls 1,740 254.5 106.8 110.0 131.4 181.2 240.0 310.4 395.9 443.6 Urban 1,819 252.2 104.1 112.9 133.6 182.9 239.9 305.7 382.9 438.1 Rural 1,723 251.7 112.5 97.1 120.0 180.0 237.1 311.4 395.7 442.9 Sub-total 3,542 251.9 108.3 104.3 128.6 180.0 238.6 308.6 391.4 438.6 3–5.9 years Boys 5,413 242.0 111.2 80.0 120.0 172.6 231.0 302.9 377.7 432.9 Girls 5,209 246.4 110.0 90.0 120.0 177.1 232.9 305.7 381.4 437.4 Urban 5,351 243.9 104.3 100.0 128.6 178.1 230.0 300.0 371.4 435.0 Rural 5,271 244.4 116.7 70.0 111.4 171.4 234.3 310.0 384.3 434.3 Total 10,622 244.1 110.6 86.4 120.0 175.0 231.4 304.3 379.3 434.3 Table 3. Distribution of daily total time of sedentary behavior (TSB) in Chinese children aged 3–5 years by sex and residential areas (minutes/day)
Age group Characteristics n Mean SD 5th 10th 25th 50th 75th 90th 95th 3–3.9 years Boys 1,722 11.62 1.03 10.00 10.36 11.00 11.68 12.24 12.86 13.14 Girls 1,624 11.62 0.99 10.00 10.43 11.00 11.64 12.17 12.74 13.07 Urban 1,700 11.64 0.90 10.07 10.60 11.10 11.64 12.14 12.71 13.00 Rural 1,646 11.60 1.11 9.86 10.00 11.00 11.68 12.29 13.00 13.21 Sub-total 3,346 11.62 1.01 10.00 10.43 11.00 11.64 12.21 12.81 13.13 4–4.9 years Boys 1,842 11.46 0.99 9.93 10.26 10.93 11.50 12.02 12.59 13.00 Girls 1,789 11.45 0.96 9.88 10.17 11.00 11.52 12.00 12.56 12.86 Urban 1,818 11.51 0.86 10.00 10.50 11.00 11.57 12.00 12.50 12.83 Rural 1,813 11.41 1.08 9.52 10.00 10.86 11.43 12.03 12.64 13.00 Sub-total 3,631 11.46 0.98 9.93 10.21 10.96 11.50 12.00 12.57 13.00 5–5.9 years Boys 1,773 11.28 1.03 9.29 10.00 10.79 11.40 11.93 12.43 12.79 Girls 1,700 11.32 0.97 9.88 10.00 10.79 11.40 12.00 12.36 12.75 Urban 1,796 11.31 0.85 10.00 10.21 10.79 11.33 11.86 12.31 12.64 Rural 1,677 11.28 1.14 9.00 10.00 10.76 11.43 12.00 12.50 12.93 Sub-total 3,473 11.30 1.00 9.57 10.00 10.79 11.40 11.95 12.43 12.79 3–5.9 years Boys 5,337 11.45 1.03 9.83 10.14 10.93 11.50 12.04 12.64 13.00 Girls 5,113 11.46 0.98 9.96 10.21 10.99 11.50 12.00 12.57 13.00 Urban 5,314 11.48 0.88 10.00 10.43 11.00 11.50 12.00 12.50 12.86 Rural 5,136 11.43 1.12 9.43 10.00 10.86 11.50 12.07 12.71 13.00 Total 10,450 11.46 1.00 9.88 10.15 10.95 11.50 12.00 12.60 13.00 Table 4. Distribution of daily total sleep period (TSP) in Chinese children aged 3–5 years by sex and residential areas (hours/day)
-
The overall prevalence of physical inactivity, defined as engaging in less than 180 minutes of TPA per day, was 68.8% among children aged 3–5 years. Furthermore, 48.4% of children engaged in less than 120 minutes of physical activity per day, and 21.3% performed less than 60 minutes of physical activity daily.
The prevalence of physical inactivity decreased slightly with age, from 72.1% among 3-year-olds to 68.5% among 4-year-olds and 66.2% among 5-year-olds (P < 0.001). No statistically significant sex differences were observed in the prevalence of physical inactivity (68.4% for boys vs. 69.4% for girls, P = 0.292). However, a marked urban–rural disparity was evident, with children living in rural areas showing a significantly higher prevalence of physical inactivity than those living in urban areas (73.3% vs. 64.8%, P < 0.001). More than half of the rural children did not achieve at least 120 minutes of physical activity daily (53.3% vs. 44.0%, P < 0.001), and one-quarter failed to reach 60 minutes per day (25.3% vs. 17.7%, P < 0.001), both significantly higher than the proportions among urban children. Specifically, the prevalence of physical inactivity decreased from 67.5% among 3-year-olds to 61.5% among 5-year-olds in urban children, and from 77.3% among 3-year-olds to 71.5% among 5-year-olds in rural children (Table 5).
TPA
Age groupTotal Boys Girls Urban Rural P value Urban Rural P value Urban Rural P value % (n/N) 95% CI % (n/N) 95% CI % (n/N) 95% CI % (n/N) 95% CI % (n/N) 95% CI % (n/N) 95% CI < 180 min/day 3–3.9 years 67.5
(1,072/1,589)65.2–69.8 77.3
(1,085/1,403)75.1–79.5 < 0.001 66.8
(537/804)63.5–70.1 77.2
(554/718)74.1–80.2 < 0.001 68.2
(535/785)64.9–71.4 77.5
(531/685)74.4–80.6 < 0.001 4–4.9 years 65.7
(1,137/1,731)63.5–67.9 71.5
(1,169/1,635)69.3–73.7 < 0.001 65.9
(581/882)62.7–69.0 71.0
(589/830)67.9–74.1 0.024 65.5
(556/849)62.3–68.7 72.1
(580/805)69.0–75.2 0.004 5–5.9 years 61.5
(1,047/1,703)59.2–63.8 71.5
(1,074/1,503)69.2–73.7 < 0.001 59.4
(501/843)56.1–62.8 71.5
(555/776)68.4–74.7 < 0.001 63.5
(546/860)60.3–66.7 71.4
(519/727)68.1–74.7 < 0.001 P value 0.001 < 0.001 0.003 0.012 0.137 0.017 <120 min/day 3–3.9 years 47.8
(760/1,589)45.4–50.3 59.6
(836/1,403)57.0–62.2 < 0.001 47.0
(378/804)43.6–50.5 57.1
(410/718)53.5–60.7 < 0.001 48.7
(382/785)45.2–52.2 62.2
(426/685)58.6–65.8 < 0.001 4–4.9 years 46.6
(807/1,731)44.3–49.0 49.1
(802/1,635)46.6–51.5 0.158 46.7
(412/882)43.4–50.0 48.8
(405/830)45.4–52.2 0.388 46.5
(395/849)43.2–49.9 49.3
(397/805)45.9–52.8 0.256 5–5.9 years 37.9
(645/1,703)35.6–40.2 52.0
(781/1,503)49.4–54.5 < 0.001 38.0
(320/843)34.7–41.2 52.8
(410/776)49.3–56.4 < 0.001 37.8
(325/860)34.6–41.0 51.0
(371/727)47.4–54.7 < 0.001 P value < 0.001 < 0.001 < 0.001 0.005 < 0.001 < 0.001 <60 min/day 3–3.9 years 22.0
(350/1,589)20.0–24.1 34.6
(485/1,403)32.1–37.1 < 0.001 20.5
(165/804)17.7–23.3 33.0
(237/718)29.6–36.5 < 0.001 23.6
(185/785)20.6–26.5 36.2
(248/685)32.6–39.8 < 0.001 4–4.9 years 18.1
(313/1,731)16.3–19.9 21.9
(358/1,635)19.9–23.9 0.006 17.9
(158/882)15.4–20.4 19.9
(165/830)17.2–22.6 0.299 18.3
(155/849)15.7–20.9 24.0
(193/805)21.0–26.9 0.004 5–5.9 years 13.4
(228/1,703)11.8–15.0 20.4
(306/1,503)18.3–22.4 < 0.001 14.8
(125/843)12.4–17.2 21.1
(164/776)18.3–24.0 < 0.001 12.0
(103/860)9.8–14.2 19.5
(142/727)16.7–22.4 < 0.001 P value < 0.001 < 0.001 0.010 < 0.001 < 0.001 < 0.001 Table 5. Prevalence of physical inactivity in Chinese children aged 3–5 by residential areas and sex
-
To the best of our knowledge, this is the first study to provide a nationwide description of 24-hour movement behaviors among Chinese children aged 3–5 years. Children in this age group engaged in a median of 121.4 minutes of physical activities, 231.4 minutes of sedentary behavior, and an average of 11.46 hours of sleep per day. The findings reveal concerning levels of insufficient physical activity and excessive sedentary behavior among preschool children, although sleep duration was generally adequate. No significant sex differences were found across any of these components. Both TPA and TSB increased slightly with age from 3–5 years, while TSP exhibited a gradual decline. However, notable urban–rural disparities were observed in this study: children living in rural areas demonstrated significantly lower levels of TPA and TSP than their urban counterparts.
Children in this study engaged in a median duration of 121.4 minutes of physical activities per day, which was lower than the 4–6 hours per day reported in previous studies that mainly used accelerometers to measure physical activity[33–35]. However, it is important to note that accelerometer-derived MET values may overestimate physical activity levels in children, as previously reported[36]. Disparities in evaluation tools and measurement methodologies can also result in divergent outcomes. Furthermore, prior studies were geographically limited (Zhuzhou[33], Zhuhai[35], and Hengyang[34]), thereby reducing comparability with this nationally representative data. Insufficient physical activity has become a global public health concern affecting both adults and children[37], yet a paucity of physical activity during childhood may lead to more severe and long-term consequences. In this study, nearly 70% of children were classified as physically inactive (TPA < 180 minutes/day), a proportion slightly lower than that reported among Chinese school-aged children but comparable to findings among Canadian preschool children[38–41]. A lack of regular movement during early childhood can impair cardiorespiratory fitness and musculoskeletal development, resulting in lower bone mineral density, reduced muscle strength, and an increased risk of osteoporosis later in life. Insufficient physical activity has also been associated with adverse metabolic profiles, including insulin resistance, dyslipidemia, and early manifestations of metabolic syndrome[10,11]. Beyond physical health, physical inactivity may negatively affect cognitive development and psychological well-being, being linked to poorer attention, lower academic performance, heightened anxiety and depressive symptoms, and reduced sleep quality[12,13] . Therefore, insufficient activity during the preschool years represents not only a behavioral issue but also a critical biomedical risk factor with long-term health implications.
In this sample of children aged 3–5 years, TPA showed a slight increase with age, while the prevalence of physical inactivity demonstrated a slight decrease. This pattern aligns with findings from several studies conducted in other countries. For instance, results from the PLAYCE cohort indicated that total daily physical activity increased between ages 2 and 5[42], and a cross-sectional study in Norway similarly found that TPA peaked at age 5[43]. This study found no significant sex differences in TPA or the prevalence of physical inactivity, which differs from previous research suggesting that boys exhibit significantly higher levels of physical activity than girls[42,44]. However, when physical activity was analyzed by intensity, the observed inequality in activity between boys and girls was primarily attributable to moderate-to-vigorous physical activity (MVPA). Concurrently, higher mean volumes of MVPA in boys were accompanied by greater variability[45]. This study did not differentiate between physical activity intensity and had a narrower age range (3–5 years), which may explain why this association was not detected. Regarding the urban–rural disparities identified in this study, existing literature provides limited direct evidence comparing TPA levels among preschool children across urban and rural settings. However, indirect evidence indicates that place of residence (urban vs. rural) may influence physical activity attainment rates[46], with rural children potentially facing barriers such as limited access to natural environments and inadequate recreational facilities[47]. Furthermore, children from households with relatively higher socioeconomic status (typically associated with urban settings) were more likely to meet physical activity guidelines (OR = 1.21) and engage in longer durations of physical activity[48]. Conversely, children from low-income households (more common in rural areas) tended to have relatively lower activity levels, potentially influenced by seasonal and environmental factors[49].
Previous research has demonstrated that Chinese children spend more total time in sedentary behaviors than in physical activity[50-52]. Consistent with these findings, this study revealed that Chinese children aged 3–5 years spent nearly twice as much time being sedentary as they did engaging in physical activity. Excessive sedentary behavior among preschool children is a global concern[18]. Cohort studies conducted in Norway[42] and Australia[43,50] found that children aged 3–5 years engaged in approximately 5.8–7.5 hours of sedentary behavior daily, which was slightly higher than the results obtained in this study. Similar to the assessment of TPA, both studies used accelerometers for measurement and evaluation. Methodological discrepancies give rise to a diminished capacity for meaningful comparison of outcomes, whilst significant heterogeneity is observed across diverse national contexts. The age-related increase in TSB observed in this study aligns with findings from prior research, which has identified age as a significant predictor of greater time spent in sedentary behaviors[42]. Similar to findings on physical activity, other studies have reported that boys engage in less sedentary behavior than girls[42,43,53]; however, this study found no significant sex differences in sedentary behavior. Additionally, direct evidence quantifying urban–rural disparities in sedentary behavior among preschool-aged children remains limited. Although this study did not detect significant differences between urban and rural children, sedentary behavior continues to be a critical issue that warrants ongoing attention.
The findings of this study indicate that the average TSP among the children surveyed was 11.46 ± 1.00 hours, with the percentile distribution showing that nearly all children in this age group met the WHO-recommended range of 10–13 hours per day. These results align with previous research[34,51,54] and suggest that the TSP among Chinese children aged 3–5 years is generally adequate. Additionally, TSP decreased slightly with increasing age, which is consistent with other studies [54] and expected physiological characteristics. In a sample of American children, boys were reported to sleep approximately 7 minutes less than girls on average, indicating a relatively minimal difference[55]. However, no sex differences in TSP were observed in this study. Rural children, however, slept for shorter durations than their urban counterparts. Direct evidence in the literature comparing urban–rural differences in total sleep duration among preschool children is limited. Nonetheless, a study conducted in rural Anhui Province among children aged 3–6 years suggests that neighborhood factors in rural settings may influence children's sleep duration[56]. This finding is corroborated by data from American children and a systematic review, where 58% of studies reported an association between low–socioeconomic-status neighborhoods and shorter sleep duration[57], providing a plausible explanation for the observed urban–rural disparities. Other studies have similarly found no significant sex differences in TSP[54]. However, Jing Hua et al. reported that approximately 15%–20% of children in this age group experience sleep quality issues, which are more prevalent among urban children[54]. Evidence also indicates that MVPA can reduce the incidence of sleep problems[52,58]. These findings underscore the intrinsic relationship between physical activity and sleep quality, highlighting the need for future guidelines and behavioral interventions to address sleep quality and duration.
This study has several limitations. First, data on physical activity, sedentary behavior, and sleep duration of children aged 3–5 were obtained through questionnaires, which may be subject to recall bias. Future studies are recommended to incorporate accelerometers or other wearable devices to provide objective data on varying intensities of physical activity in this age group. Second, the field survey was conducted from May 2019 to November 2021, covering multiple seasons throughout the year, which may have influenced the outcomes. Additionally, applying sampling weights could help adjust for residual imbalances and non-response bias; therefore, this approach should be considered in future study designs. Third, the cross-sectional design of this survey precludes the establishment of causal relationships; future research should include in-depth biomedical analyses and longitudinal studies to examine the interactions among physical activity, sedentary behavior, and sleep duration, as well as their short-term and long-term health effects on children.
-
This study comprehensively described the distribution of physical activity, sedentary behavior, and sleep duration among Chinese children aged 3–5 years. The findings indicate generally insufficient physical activity and excessive sedentary behavior in this population, highlighting notable urban–rural disparities and an age-related increase in activity and sedentary time. Ongoing monitoring of children's 24-hour movement behaviors is essential, with particular attention to those living in rural areas.
-
ChiCTR1900022825.
HTML
Study Design and Participants
Data Collection
24-Hour. Movement Behaviors Assessment
Physical Inactivity Definition
Statistical Analysis
Sociodemographic Characteristics
Levels and disparities in Physical Activity, Sedentary Behavior, and Sleep Period
Prevalence of Physical Inactivity
Competing Interests The authors declare no competing interests.
Ethics This study was approved by the Medical Ethical Review Committee at the National Institute for Nutrition and Health, Chinese Center for Disease Control and Prevention (approval number: 2019-009). Informed consent forms were signed by the parents or guardians of the study subjects prior to the investigation.
Data Sharing The datasets generated and/or analyzed during the current study are available from the corresponding author upon reasonable request.
&These authors contributed equally to this work.

 Quick Links
 DownLoad: