
-
Accelerated aging occurs when biological age exceeds chronological age and is associated with a higher risk of cardiovascular disease (CVD) and mortality, which challenges our understanding of aging and its effects on health[1]. Characterized by diminished physical function, frailty can serve as an indicator of accelerated aging and is linked to adverse health outcomes[2]. Evidence has documented that frailty is independently associated with all-cause mortality and incident chronic diseases, including cardiovascular disorders[3], diabetes[4,5], and neurodegenerative conditions[6].
Metabolic status, encompassing central obesity, hypertension, hyperglycemia, and dyslipidemia, has emerged as a pivotal determinant of morbidity and mortality across the lifespan[7,8]. Over the past two decades, there has been a 49.4% increase in disability-adjusted life years (DALYs) attributable to metabolic risks[9]. Additionally, metabolic syndrome has been shown to increase the risk of CVD by more than threefold[10].
Frailty and metabolic status share risk factors (e.g., sedentary lifestyle and unhealthy diet) and pathophysiological pathways (e.g., systemic inflammation, oxidative stress, mitochondrial dysfunction, and body composition remodeling)[11]. This evidence suggests their interrelation in contributing to adverse health outcomes[12]. However, previous epidemiological studies have predominantly focused on their individual associations with CVD and mortality risks; the mediating and moderating roles of metabolic status in the relationship between frailty and health outcomes remain poorly characterized.
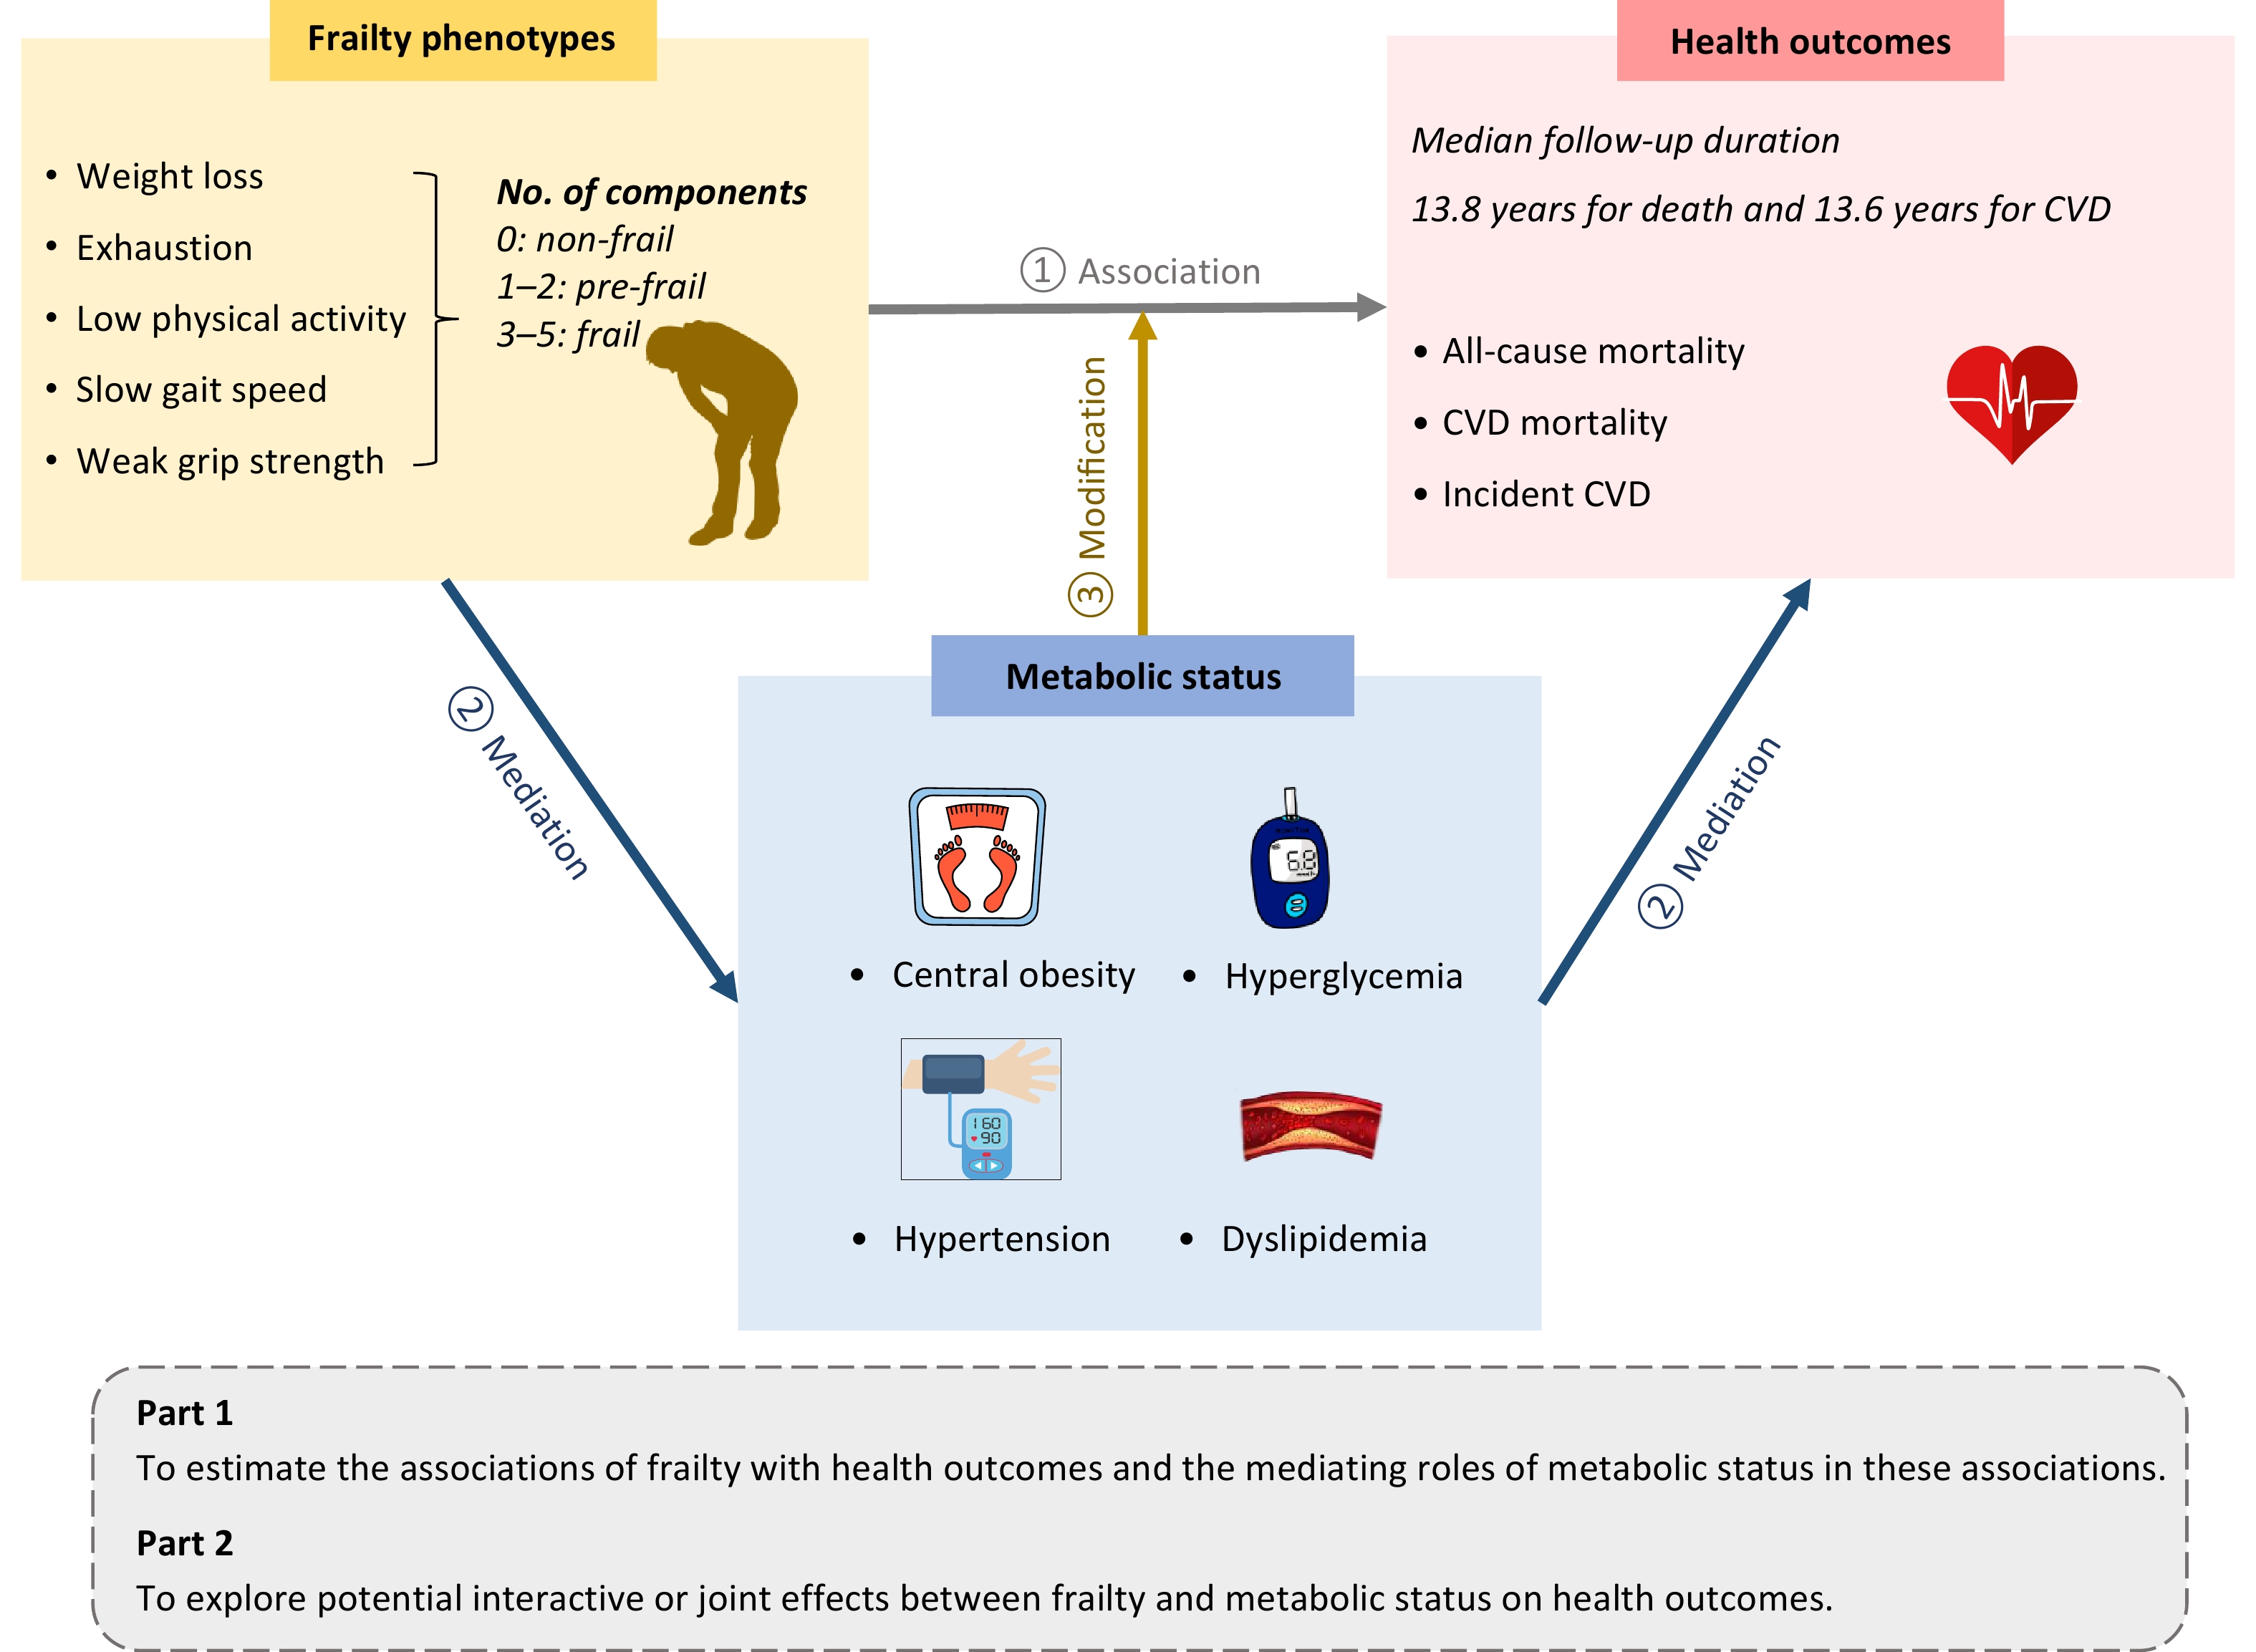
To address these knowledge gaps, we explored the complex relationships between frailty, metabolic status, and health outcomes, including all-cause mortality, CVD mortality, and incident CVD. In addition, we investigated whether metabolic status could mediate the associations of frailty with mortality and incident CVD, and explored potential interactive or joint effects between frailty and metabolic status on these outcomes. An overview of the study design is shown in Figure 1.
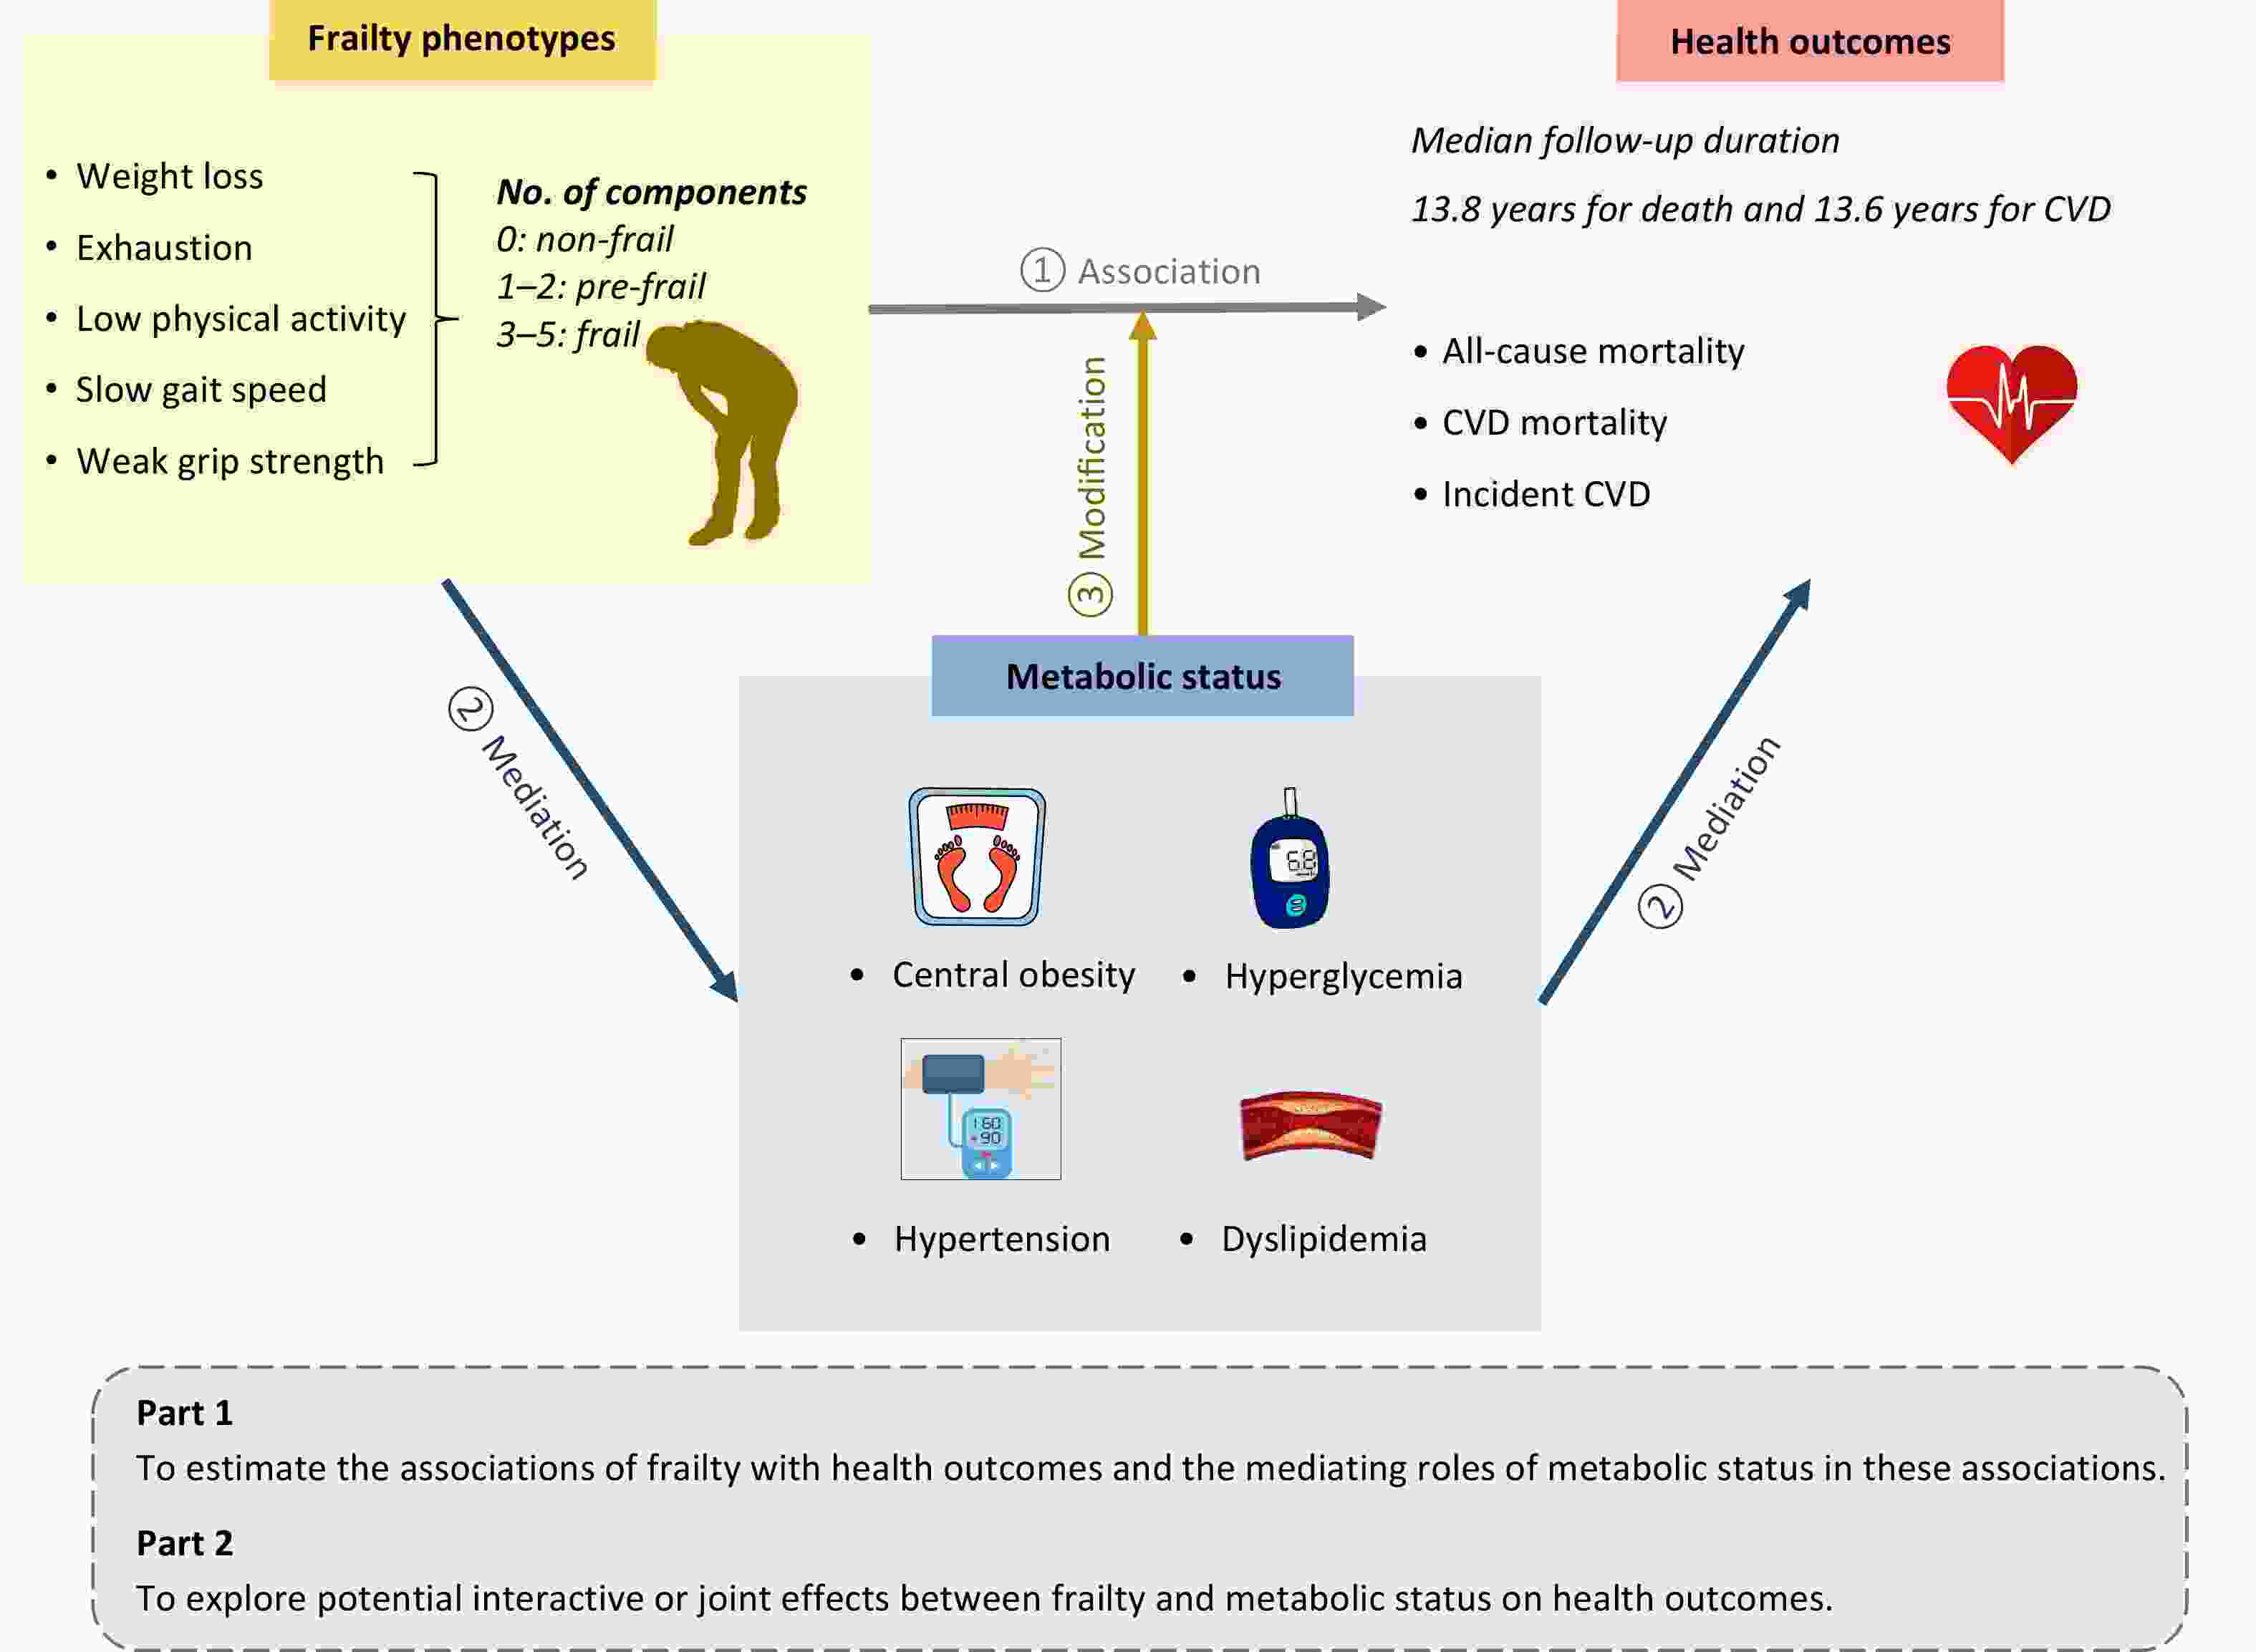
Figure 1. Overview of the study design. This prospective cohort study utilized data from the UK Biobank. Frailty phenotypes and metabolic status were assessed at baseline, and health outcomes were ascertained via health-related electronic records. In Part 1, we estimated the associations between frailty and health outcomes, as well as the mediating role of metabolic status in these associations. In Part 2, stratified analysis, interaction analysis, and joint effect analysis were conducted to explore the modifying effects of metabolic status on the relationship between frailty and health outcomes. CVD, cardiovascular disease.
-
This study utilized data from the UK Biobank, a large-scale prospective cohort study that enrolled over 500,000 participants across 22 assessment centers in England, Scotland, and Wales between 2006 and 2010. Participants underwent comprehensive baseline assessments, including questionnaire surveys, physical examinations, and biological sample collection. Detailed information has been reported elsewhere[13]. The UK Biobank study was approved by the North West Multi-Centre Research Ethics Committee (REC reference numbers: 11/NW/0382, 16/NW/0274, and 21/NW/0157), and the current study was conducted under an approved application (#109546).
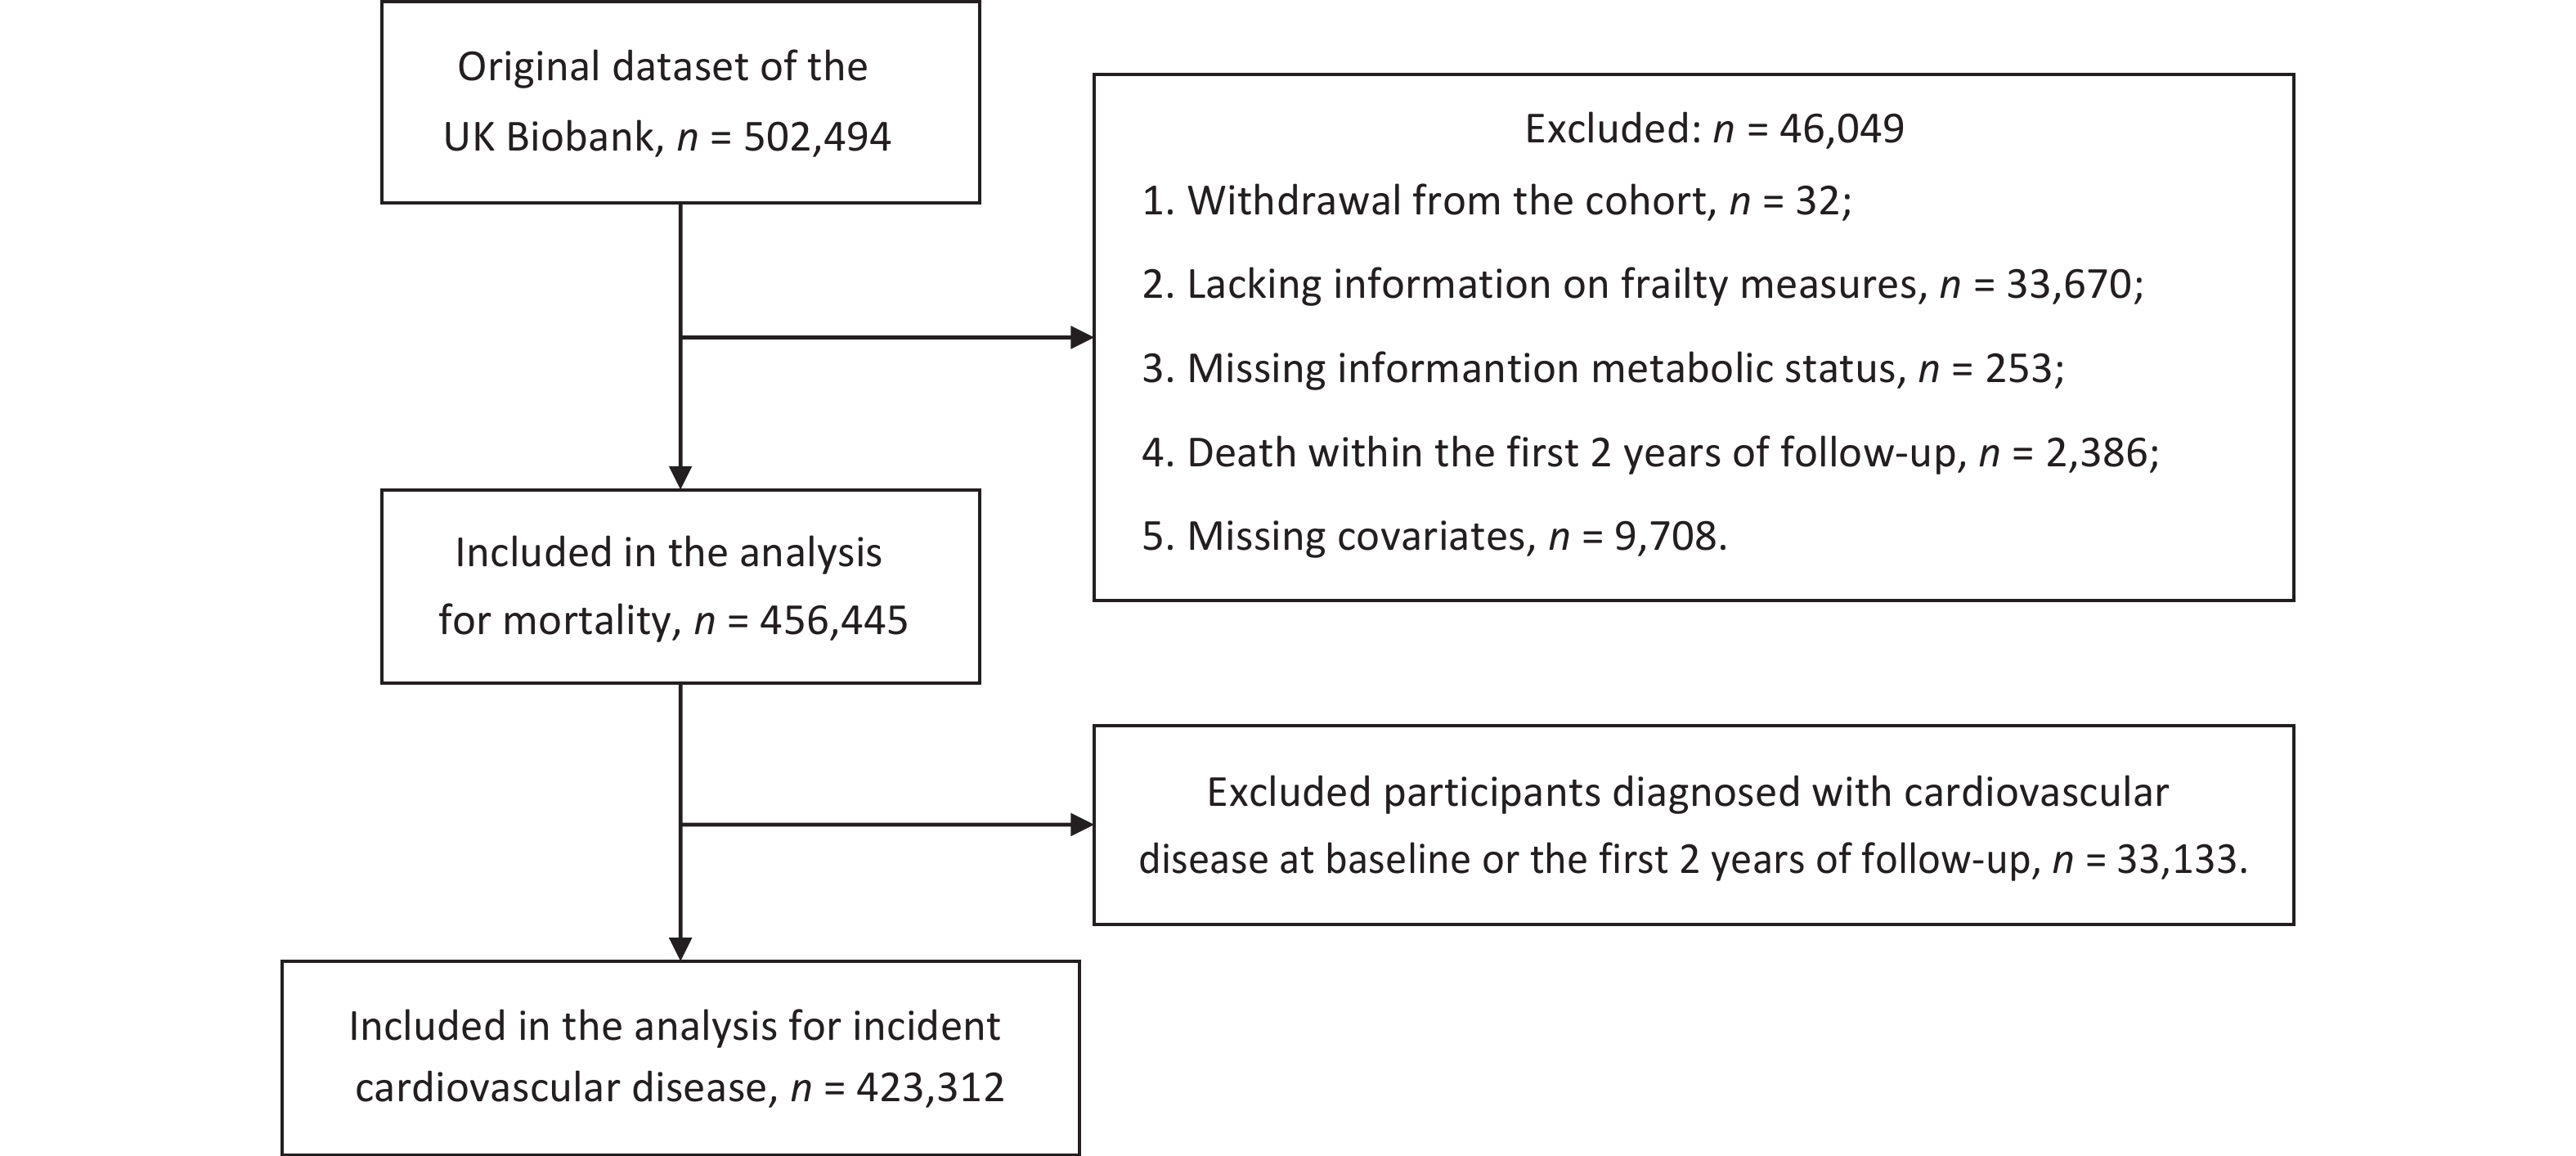
As shown in Figure 2, among the 502,494 participants, those who withdrew from the cohort (n = 32), were missing information for frailty phenotypes (n = 33,670), metabolic status (n = 253), or covariates (n = 9,708), or who died within the first two years of follow-up (n = 2,386) were excluded. This left 456,445 participants for the analyses of mortality. A total of 33,133 participants diagnosed with CVD at baseline or within the first two years of follow-up were further excluded from the CVD analyses, and 423,312 participants remained for the analyses of incident CVD.

Figure 2. Flowchart of the study.
-
Frailty was assessed using five components[2,14]: weight loss, exhaustion, low physical activity, slow walking speed, and low grip strength. Grip strength was measured using dynamometers, and the other components were assessed using self-reported information (detailed in Supplementary Table S1). Each component was scored dichotomously (0 or 1), yielding a cumulative frailty score ranging from 0 to 5 points, with higher scores indicating greater frailty severity. Frailty states were categorized as non-frail (0 points), pre-frail (1–2 points), and frail (3–5 points).
Metabolic status was evaluated based on four metabolic dysfunction components[15]: central obesity, hypertension, hyperglycemia, and dyslipidemia. These disorders were identified through physical measurements, biochemical measurements, self-reported diseases, or the use of corresponding medications (details are provided in Supplementary Table S2). Participants received one point for each component, resulting in a metabolic status score ranging from 0 to 4, with higher scores indicating worse metabolic health. To increase statistical power, participants with scores of 0 or 1 point were combined, as were those with scores of 3 or 4 points.
-
At baseline, information on age, sex, ethnicity, education, assessment center, smoking status, alcohol intake, and sleep duration was acquired through a touchscreen questionnaire. Given the small number of participants in the mixed, Asian or Asian British, Black or Black British, Chinese, and “other” ethnic groups, these were collapsed into a non-white category, and ethnicity was classified as either white or non-white. As both insufficient and prolonged sleep durations are associated with adverse health outcomes, sleep duration was categorized into two groups: 7–8 hours and less than 7 or more than 8 hours[16]. The Townsend Deprivation Index (TDI) was calculated using national census data according to postcodes of residence, with higher scores indicating greater deprivation[17]. Dietary quality was evaluated based on dietary recommendations for cardiovascular health, which emphasize adequate consumption of healthy foods (vegetables, fruit, seafood, whole grains, dairy, and vegetable oils) and reduced consumption of unhealthy foods (processed meats, refined grains, unprocessed meats, and sugar-sweetened beverages)[18]. The definitions and criteria for a healthy diet are detailed in Supplementary Table S3.
-
The primary outcomes of the study were all-cause mortality, CVD mortality, and incident CVD. All-cause and CVD-related deaths (International Classification of Diseases, 10th Revision [ICD-10] codes: I00–I99) were identified through linkage to death registry records. Cases of incident CVD (ICD-10 codes: I20–I25, I60, I61, I63, I64) were ascertained by linking to hospital inpatient data and applying the first-occurrence algorithm for health-related outcomes. Details are provided in Supplementary Table S4. Data on deaths were available up to 19 December 2022, while data on hospital admissions were available up to 31 October 2022. Person-years were calculated from the date of recruitment to the date of disease diagnosis, death, loss to follow-up, or administrative censoring, whichever occurred first.
-
Baseline characteristics were described across different levels of frailty as means [standard deviations (SD)] or medians [interquartile ranges (IQR)] for continuous variables, and frequencies (percentages) for categorical variables. Differences among groups were evaluated using analysis of variance for normally distributed continuous variables, the Kruskal-Wallis test for non-normally distributed continuous variables, or the chi-square test for categorical variables.
Hazard ratios (HRs) and 95% confidence intervals (CIs) were estimated using multivariable-adjusted Cox proportional hazards models to evaluate associations between frailty states or metabolic status and mortality or incident CVD, with adjustment for age (years, continuous), sex (women, men), assessment center (England, Scotland, Wales), ethnicity (white, non-white), educational level (college or university degree, secondary school, vocational, others), TDI (continuous), smoking status (never, previous, or current smokers), drinking frequency (daily or almost daily, 1–4 times a week, less than once a week), diet (healthy, unhealthy), and sleep duration (7–8 hours per day, less than 7 or more than 8 hours per day)[14,19]. The proportional hazards assumption was assessed using Schoenfeld residuals.
Mediation analysis was used to assess the mediating proportions of metabolic status in the associations between frailty states and health outcomes. To examine the independent effects of individual frailty components or metabolic disorders, we conducted two additional analyses. First, we repeated the mediation analyses by replacing frailty states with each individual frailty component. Second, we used individual metabolic disorders instead of the composite score in the models to evaluate whether specific metabolic disorders acted as mediators.
Stratifying by metabolic status, we further evaluated whether pre-frailty or frailty remained associated with higher risks of adverse outcomes compared with non-frailty across different groups. To quantify the interaction of frailty and metabolic status on health outcomes, we included a product term for frailty states (non-frail or frail) and metabolic disorders (0–1 or 3–4) in the final model. The multiplicative interaction was evaluated using the P-value for interaction or the HR (95% CI) for the product term. The additive interaction was quantified using three indices: relative excess risk due to interaction (RERI), attributable proportion (AP), and synergy index (S). These were calculated using the coefficients and corresponding standard errors of the product term, frailty, and metabolic disorders, as well as the covariance matrix[20]. To assess the joint associations, participants were classified into nine groups according to frailty states and metabolic disorders, with non-frailty and 0–1 metabolic disorder as the reference group.
We repeated the mediation and joint analysis in subgroups stratified by age (< 60 years vs. ≥ 60 years) and sex (men vs. women). Two sensitivity analyses were performed to test the robustness of the mediation, interaction, and joint effects. First, we retained the population with missing covariate information and repeated the primary analyses after imputing the missing variables. Second, we replaced metabolic status (0–4 points) with metabolic syndrome (0–5 points) as the method for assessing metabolic disorder. In this analysis, a total of 61,884 participants were further excluded due to missing data on triglyceride or high-density lipoprotein cholesterol.
Statistical analyses were performed using R software (version 4.4.2) and SAS software (version 9.4). A two-tailed P < 0.05 was considered statistically significant.
-
As presented in Table 1, a total of 456,445 participants were included in this study, with a median age of 58.0 years (IQR, 50.0–63.0) and 207,816 (45.5%) male participants. Of these, 18,439 (4.0%) were classified as frail, 197,569 (43.3%) as pre-frail, and 240,437 (52.7%) as non-frail. In general, frail individuals were more likely to be older; female; non-white; more socioeconomically deprived; current smokers; and to have a higher body mass index, lower educational attainment, infrequent alcohol consumption, sleep durations of less than 7 or more than 8 hours per day, an unhealthy diet, and a higher prevalence of metabolic dysfunction compared with non-frail individuals.
Characteristics Overall Frailty status Non-frail Pre-frail Frail No. of participants, n (%) 456,445 240,437 (52.7) 197,569 (43.3) 18,439 (4.0) Age, years, median (IQR) 58.0 (50.0–63.0) 57.0 (49.0–62.0) 59.0 (51.0–64.0) 59.0 (52.0–64.0) Male participants, n (%) 207,816 (45.5) 115,682 (48.1) 85,073 (43.1) 7,061 (38.3) White ethnicity, n (%) 434,664 (95.2) 232,858 (96.8) 185,461 (93.9) 16,345 (88.6) Townsend Deprivation Index (TDI), median (IQR) −2.2 (−3.7 to 0.4) −2.5 (−3.8 to −0.2) −1.9 (−3.5 to 0.8) 0.0 (−2.6 to 3.1) Body mass index (BMI), kg/m2, mean (standard deviation [SD]) 27.4 (4.8) 26.8 (4.2) 27.8 (5.0) 30.4 (6.7) Educational attainment, n (%) College or university 152,488 (33.4) 90,251 (37.5) 59,079 (29.9) 3,158 (17.1) Secondary school 175,132 (38.4) 92,639 (38.5) 76,278 (38.6) 6,215 (33.7) Vocational 54,132 (11.9) 27,648 (11.5) 24,182 (12.2) 2,302 (12.5) Other 74,693 (16.4) 29,899 (12.4) 38,030 (19.2) 6,764 (36.7) Smoking status, n (%) Never 250,489 (54.9) 135,983 (56.6) 106,088 (53.7) 8,418 (45.7) Former 159,094 (34.9) 83,316 (34.7) 69,383 (35.1) 6,395 (34.7) Current 46,862 (10.3) 21,138 (8.8) 22,098 (11.2) 3,626 (19.7) Alcohol consumption, n (%) Daily or almost daily 94,833 (20.8) 55,731 (23.2) 37,001 (18.7) 2,101 (11.4) 1–4 times per week 225,678 (49.4) 126,852 (52.8) 92,862 (47.0) 5,964 (32.3) Less than once per week 135,934 (29.8) 57,854 (24.1) 67,706 (34.3) 10,374 (56.3) Healthy diet, n (%) 68,984 (15.1) 35,969 (15.0) 30,593 (15.5) 2,422 (13.1) Sleep duration of 7–8 hours, n (%) 310,686 (68.1) 174,692 (72.7) 127,720 (64.6) 8,274 (44.9) Metabolic factors, n (%) Central obesity 154,856 (33.9) 67,362 (28.0) 76,483 (38.7) 11,011 (59.7) Hyperglycemia 83,393 (18.3) 34,702 (14.4) 42,013 (21.3) 6,678 (36.2) Hypertension 327,817 (71.8) 169,357 (70.4) 143,665 (72.7) 14,795 (80.2) Dyslipidemia 238,191 (52.2) 115,596 (48.1) 109,626 (55.5) 12,969 (70.3) Note. Characteristics are presented by frailty status. Normally distributed continuous variables are shown as means with standard deviations (SDs); non-normally distributed continuous variables are presented as medians with interquartile ranges (IQRs); and categorical variables are reported as frequencies with percentages. P values were derived using analysis of variance or the Kruskal–Wallis test for continuous variables, and the chi-squared test for categorical variables. All differences between groups were statistically significant (P < 0.001). TDI, Townsend Deprivation Index; BMI, body mass index; IQR, interquartile range; SD, standard deviation. Table 1. Baseline characteristics of the study population according to frailty status
-
During a median follow-up of 13.8 years (IQR, 13.0–14.5), 30,907 deaths (6.8%) were recorded, including 7,467 (1.6%) CVD deaths. During a median follow-up of 13.6 years (IQR, 12.7–14.3), 37,115 participants (8.8%) developed CVD. Table 2 shows the associations between frailty and the risks of mortality and incident CVD. After full adjustment for confounders, the HRs and 95% CIs for frail adults compared with non-frail adults were 2.41 (2.31–2.51) for all-cause mortality, 2.64 (2.43–2.87) for CVD mortality, and 1.83 (1.75–1.91) for incident CVD. Each one-point increase in metabolic status score was also associated with 17%, 42%, and 27% higher risks of all-cause mortality, CVD mortality, and incident CVD, respectively (Supplementary Table S5). When comparing frail with non-frail individuals, the proportions of the associations mediated by metabolic status were 8.7% (95% CI, 8.0%–9.5%) for all-cause mortality, 16.1% (95% CI, 14.5%–17.8%) for CVD mortality, and 16.4% (95% CI, 15.1%–17.9%) for incident CVD. Similar results were observed when frailty was treated as a continuous variable (Table 2).
Group Events Incidence rate HR (95% CI) Mediation proportion
(%, 95% CI)Unadjusted for
metabolic statusAdjusted for
metabolic statusAll-cause mortality Non-frail 12,133 3.71 1.00 1.00 − Pre-frail 15,493 5.87 1.37 (1.34–1.40) 1.33 (1.30–1.37) 8.4 (7.5–9.4) Frail 3,281 13.91 2.62 (2.52–2.73) 2.41 (2.31–2.51) 8.7 (8.0–9.5) Per-point increment in frailty score − − 1.34 (1.32–1.35) 1.30 (1.29–1.32) 8.5 (7.8–9.3) CVD mortality Non-frail 2,691 0.82 1.00 1.00 − Pre-frail 3,878 1.47 1.55 (1.48–1.63) 1.46 (1.39–1.53) 14.4 (12.4–16.5) Frail 898 3.81 3.18 (2.93–3.45) 2.64 (2.43–2.87) 16.1 (14.5–17.8) Per-point increment in frailty score − − 1.44 (1.41–1.47) 1.36 (1.33–1.39) 15.3 (13.9–16.8) Incident CVD Non-frail 16,809 5.59 1.00 1.00 − Pre-frail 17,887 7.71 1.27 (1.24–1.29) 1.22 (1.20–1.25) 15.0 (13.4–16.8) Frail 2,419 13.79 2.06 (1.97–2.15) 1.83 (1.75–1.91) 16.4 (15.1–17.9) Per-point increment in frailty score − − 1.24 (1.23–1.26) 1.20 (1.19–1.22) 16.0 (14.8–17.2) Note. Incidence rates were calculated at the end of follow-up and are reported per 1,000 person-years. All models were adjusted for age, sex, ethnicity, Townsend Deprivation Index, assessment center, educational attainment, smoking status, alcohol consumption, diet, and sleep duration. Metabolic status was defined using a summary score (range: 0–4) based on central obesity, hyperglycemia, hypertension, and dyslipidemia. Only participants free from CVD at baseline and during the first two years of follow-up were included in the analysis of incident CVD (n = 423,312). CVD, cardiovascular disease; HR, hazard ratio; CI, confidence interval. Table 2. Associations between frailty and mortality and incident CVD, and the mediating role of metabolic status
Supplementary Table S6 presents the associations of each individual frailty component with mortality and incident CVD. Participants exhibiting individual frailty components had higher risks of these outcomes, with HRs ranging from 1.11 to 1.92. The proportions of these associations mediated by metabolic status ranged from less than 1% for low grip strength to 32.6% for low physical activity. Supplementary Table S7 shows the mediation proportions of each individual metabolic disorder in the relationship between frailty and outcomes, with all proportions being less than 10%.
-
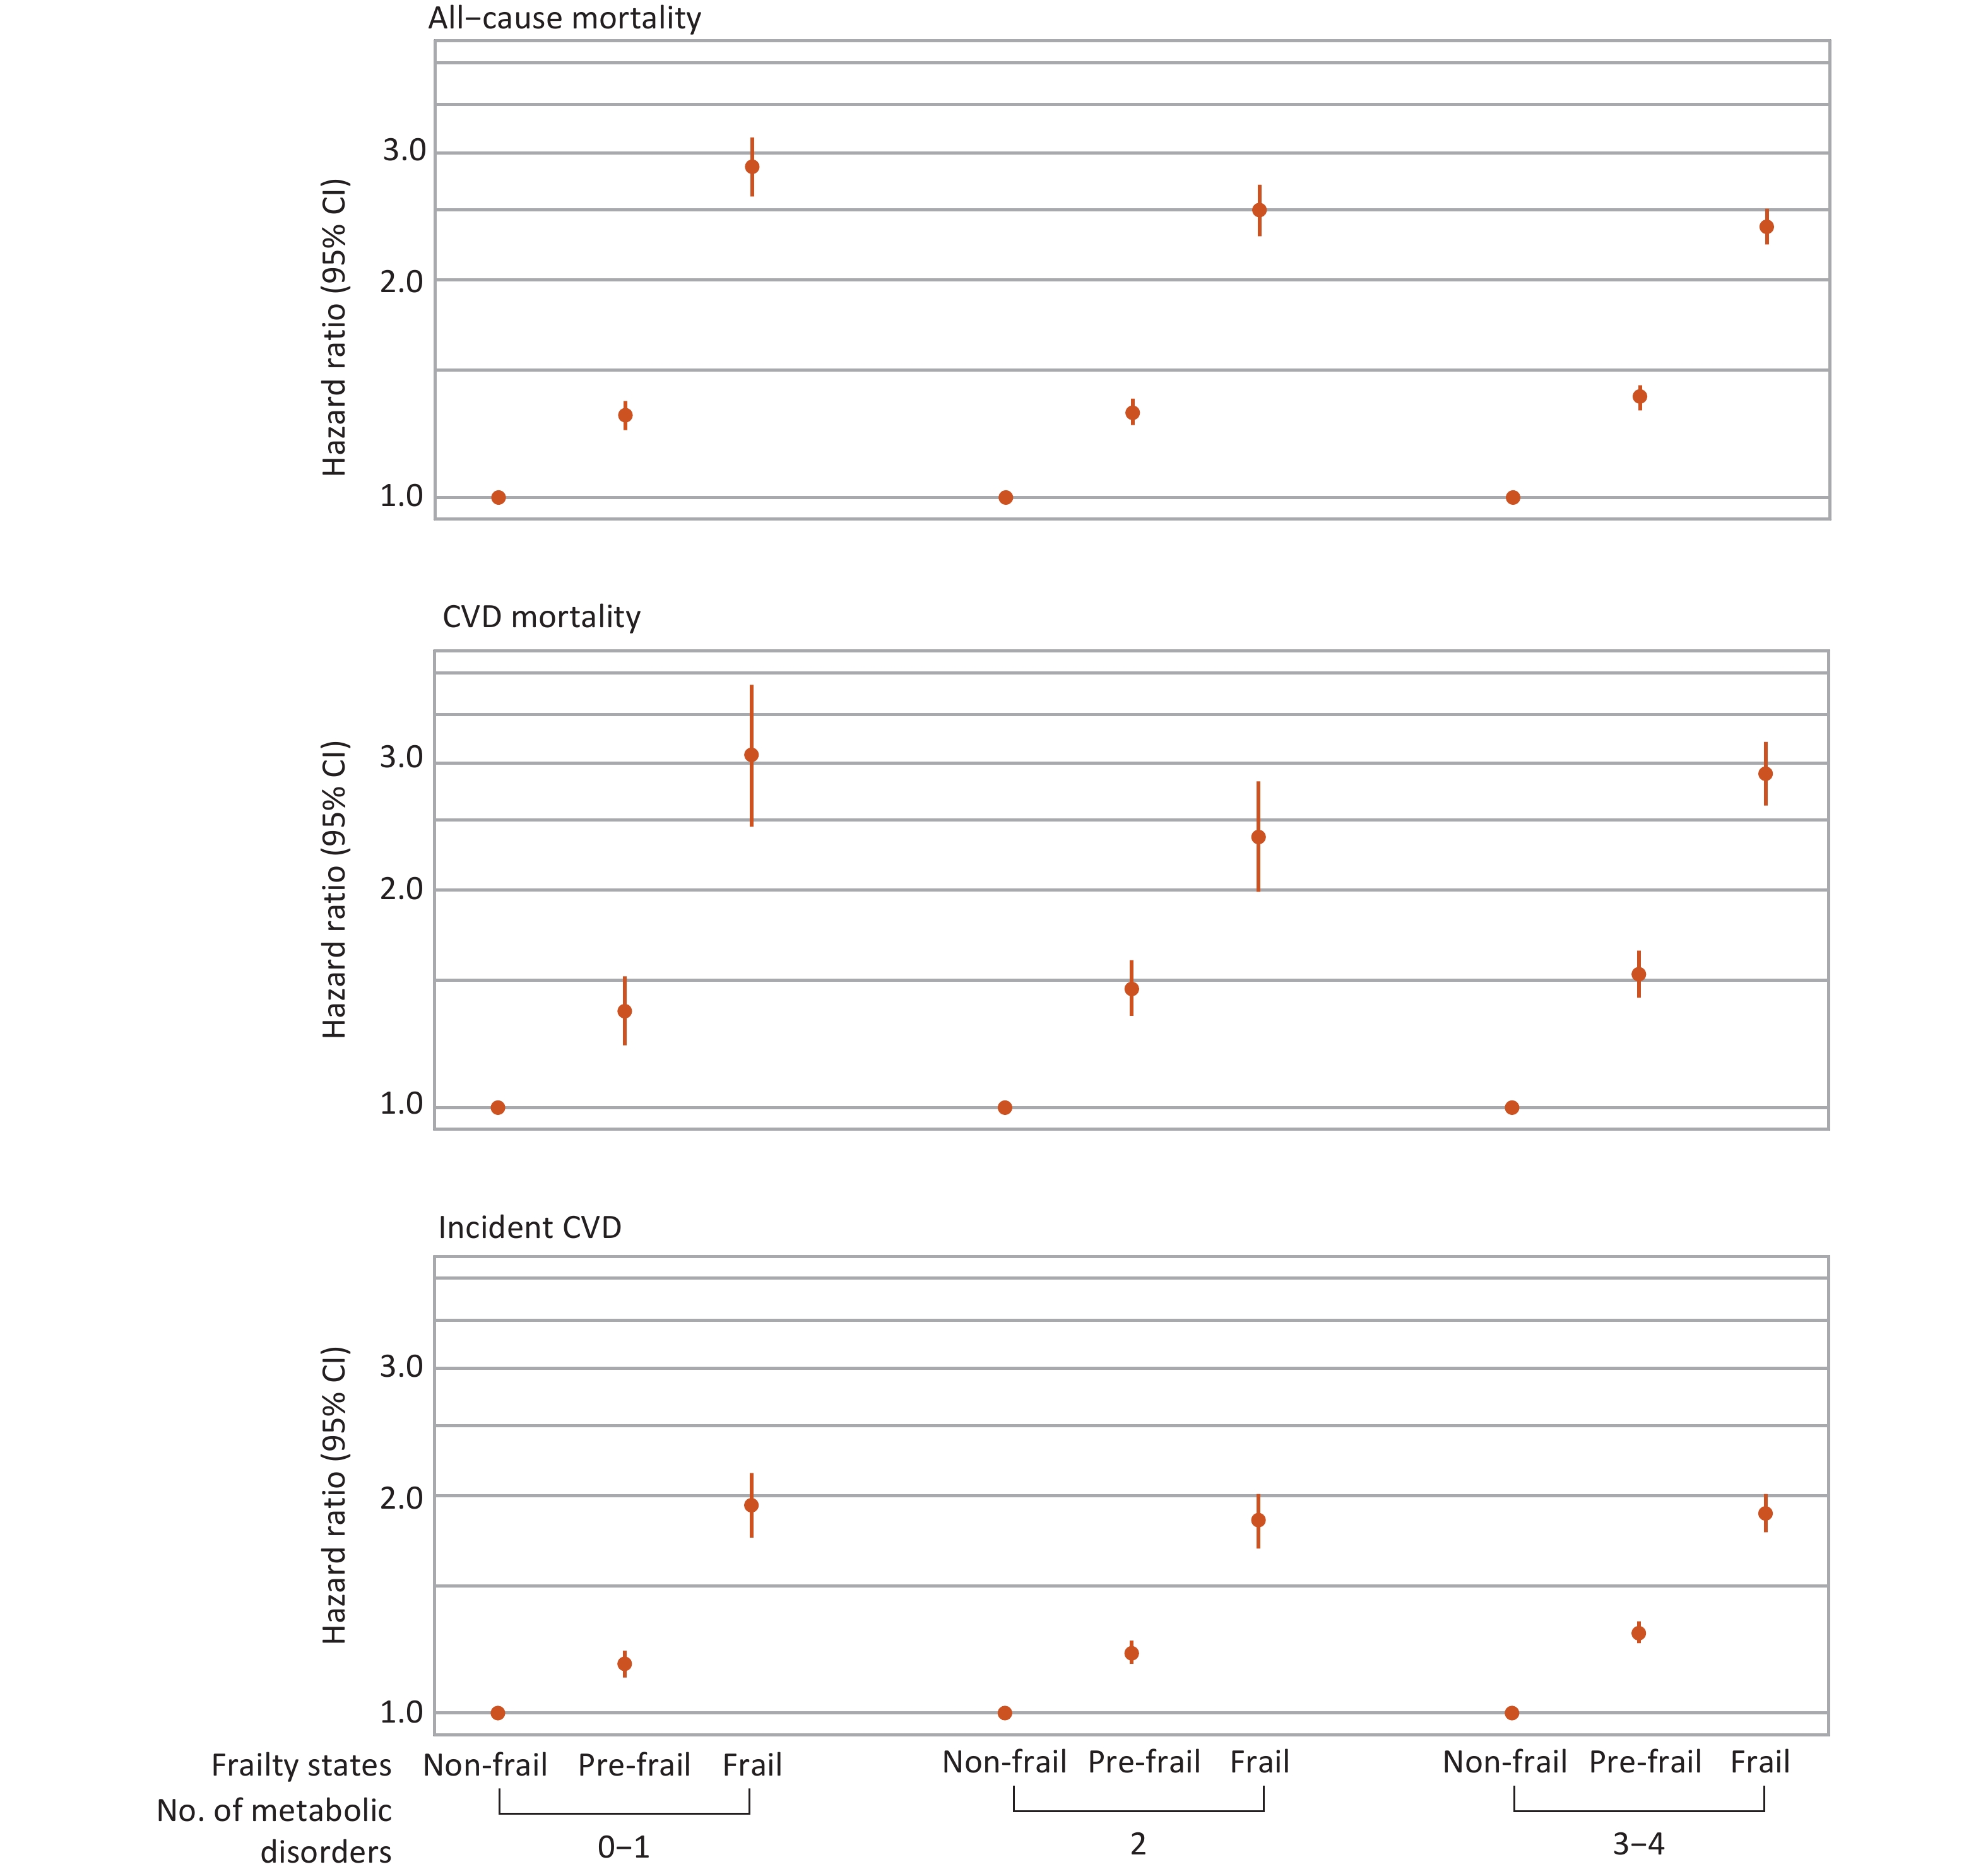
Interactions between frailty and metabolic status in relation to mortality and incident CVD are shown in Table 3. A significant multiplicative interaction was observed only for all-cause mortality (P-value for interaction < 0.001). Stratified analyses further revealed that frailty was associated with higher risks of all primary outcomes compared with non-frailty across different metabolic subgroups (Figure 3). Specifically, for all-cause mortality, the HRs and 95% CIs for frailty compared with non-frailty were 2.87 (2.61–3.15), 2.50 (2.30–2.71), and 2.37 (2.17–2.58) among individuals with 0–1, 2, and 3–4 metabolic disorders, respectively (Supplementary Table S8).
Interaction Metrics All-cause mortality CVD mortality Incident CVD Multiplicative interaction HR (95% CI) for product term 0.94 (0.91–0.96) 0.96 (0.90–1.02) 0.99 (0.97–1.02) P-value for interaction < 0.001 0.146 0.648 Additive interaction RERI −0.08 (−0.39–0.22) 1.78 (0.88–2.68) 0.60 (0.33–0.86) AP −0.02 (−0.11–0.07) 0.27 (0.15–0.40) 0.18 (0.11–0.26) S 0.97 (0.85–1.10) 1.48 (1.19–1.84) 1.36 (1.18–1.56) Note. The product term between frailty (non-frail vs. frail) and metabolic status (0–1 points vs. 3–4 points) was included in the model to quantify both multiplicative and additive interactions. Multiplicative interaction was assessed using the HR with 95% confidence interval (CI) for the product term or the P-value for interaction. Additive interaction was assessed using three indices: RERI, AP, and synergy index (S). RERI quantifies the excess risk attributable to interaction; a value > 0 indicates a positive interaction, while < 0 indicates a negative interaction. AP represents the proportion of disease risk attributable to interaction, ranging from −∞ to 1, with values > 0 indicating a meaningful interaction. S reflects the ratio of combined effects to the sum of individual effects; S > 1 indicates positive interaction, and S < 1 indicates negative interaction. CVD, cardiovascular disease; HR, hazard ratio; CI, confidence interval; RERI, relative excess risk due to interaction; AP, attributable proportion; S, synergy index. Table 3. Interactions between frailty and metabolic status in relation to mortality and incident CVD
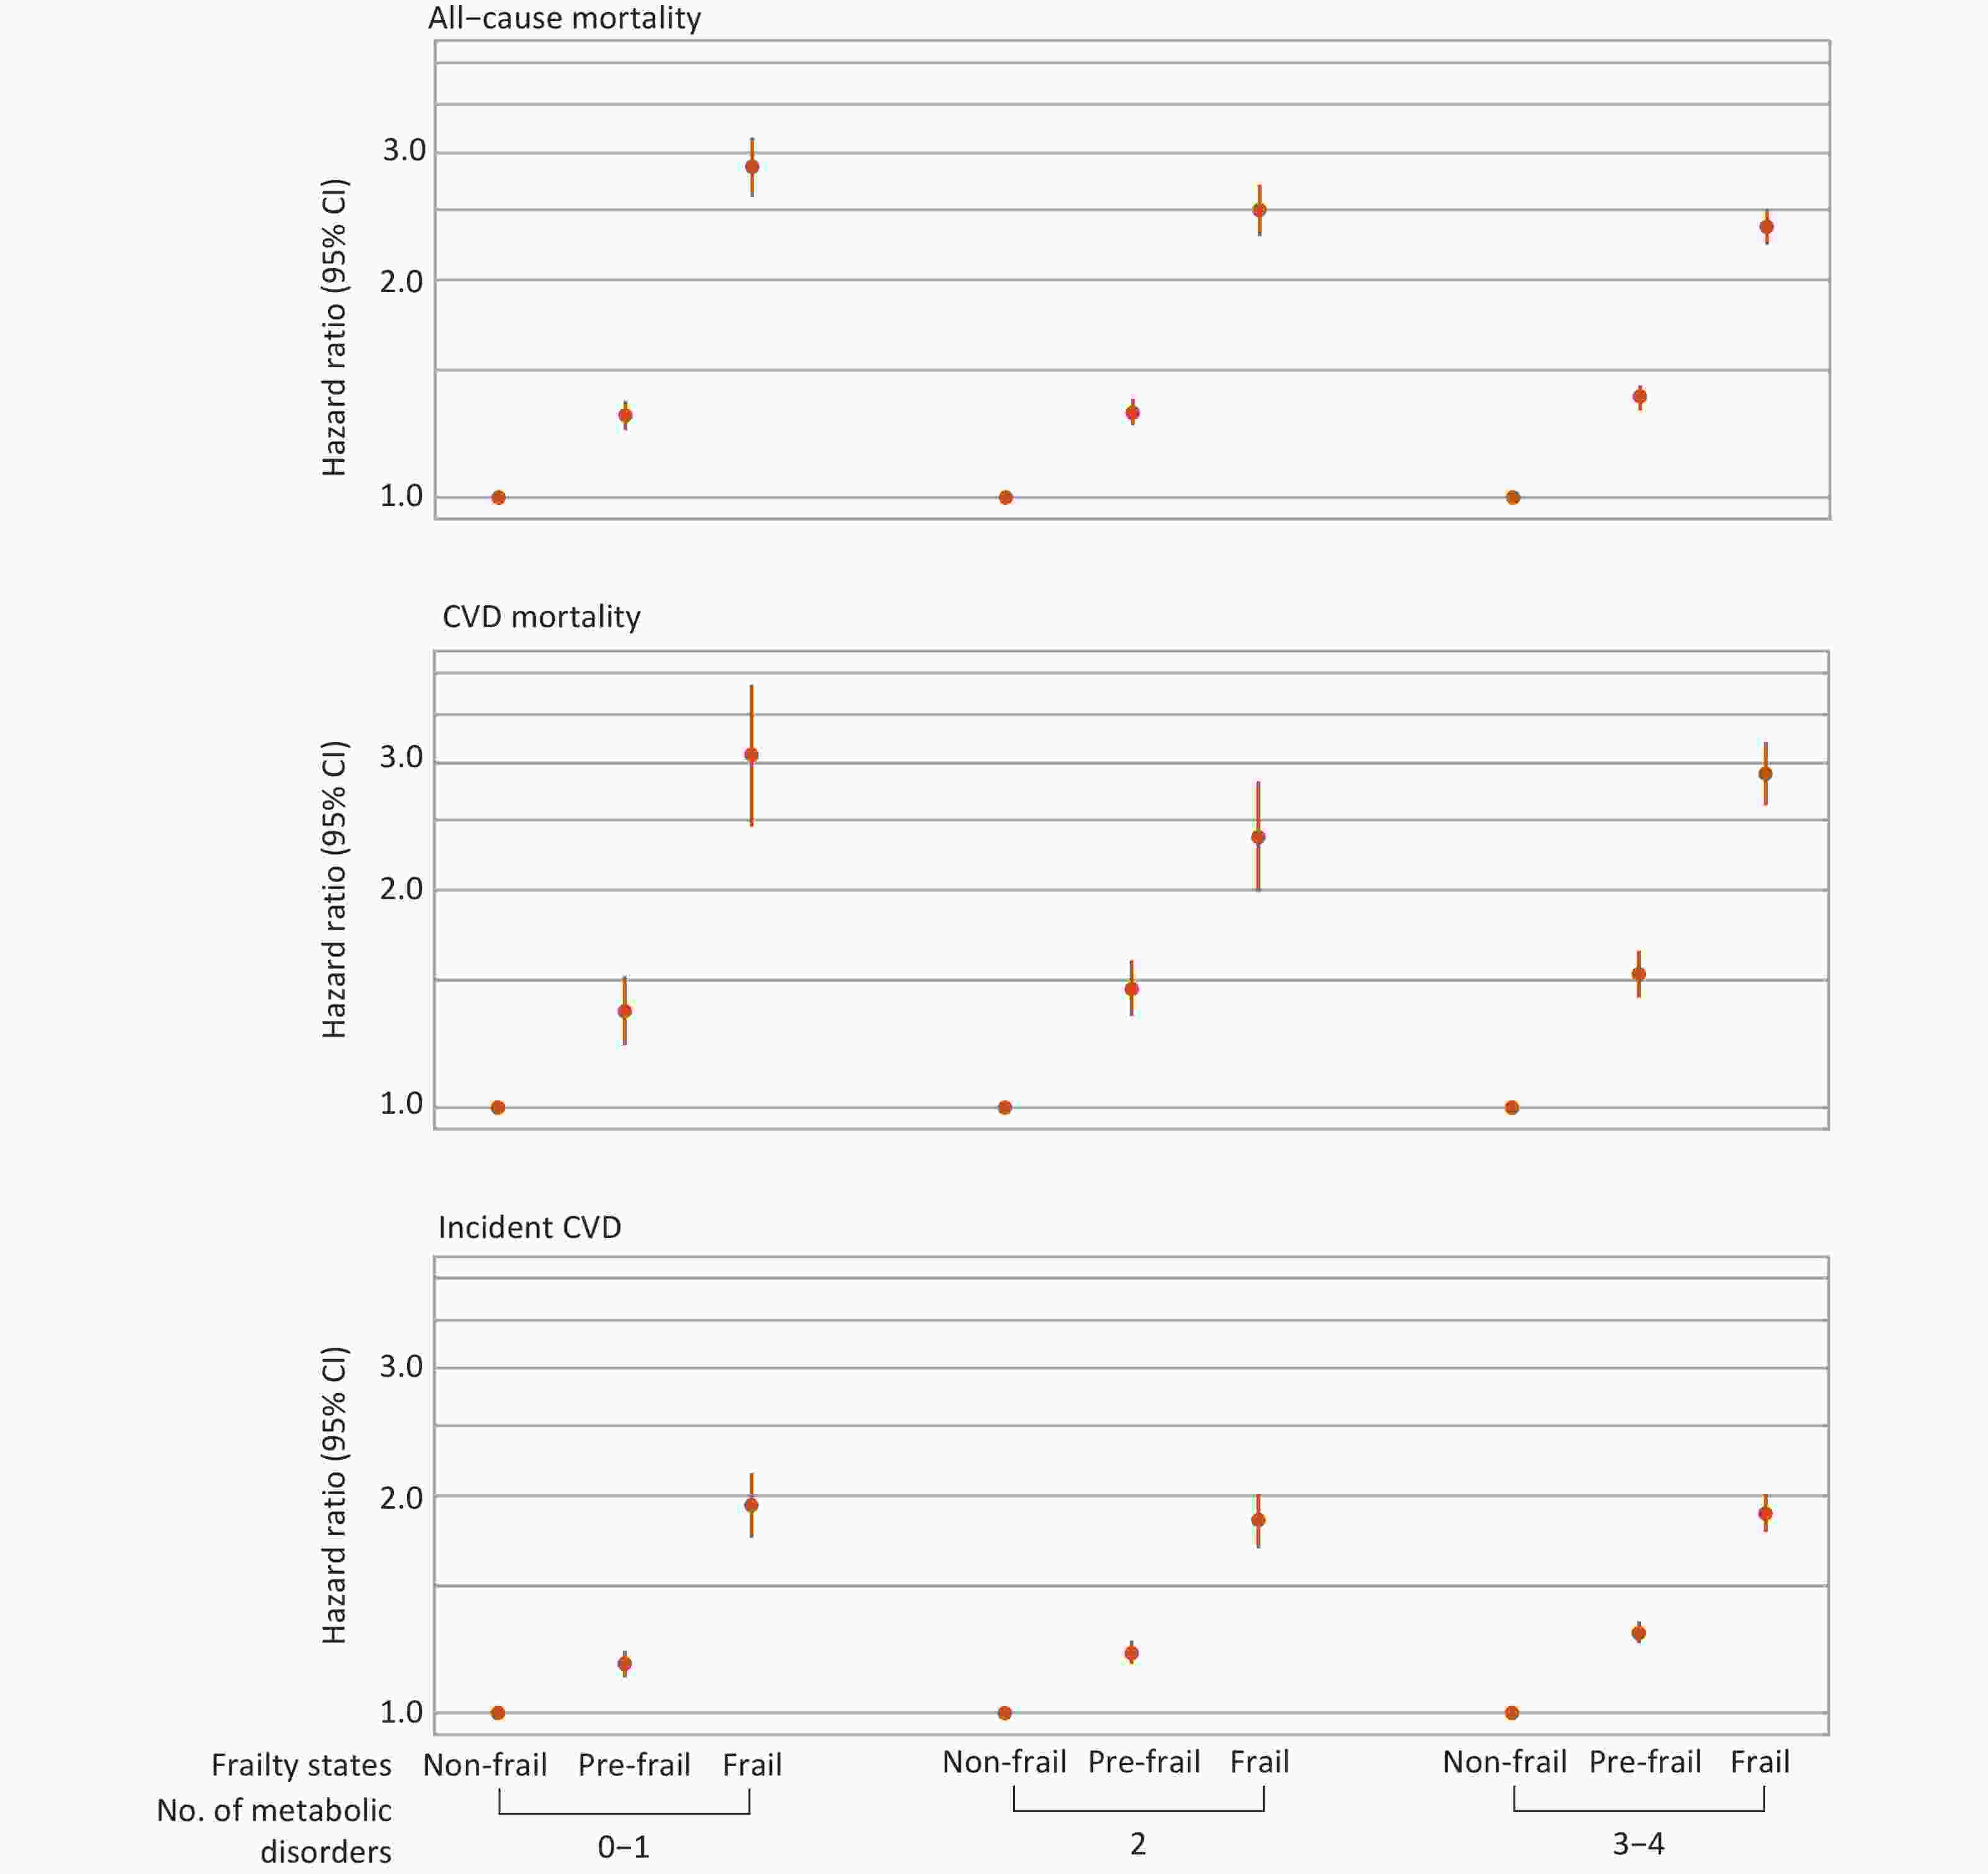
Figure 3. Associations between frailty and mortality and incident CVD stratified by metabolic status. Hazard ratios were adjusted for age, sex, ethnicity, Townsend Deprivation Index, assessment center, educational attainment, smoking status, alcohol consumption, diet, and sleep duration. Only individuals free from CVD at baseline and during the first two years of follow-up were included in the analysis for incident CVD (n = 423,312). CVD, cardiovascular disease; CI, confidence interval.
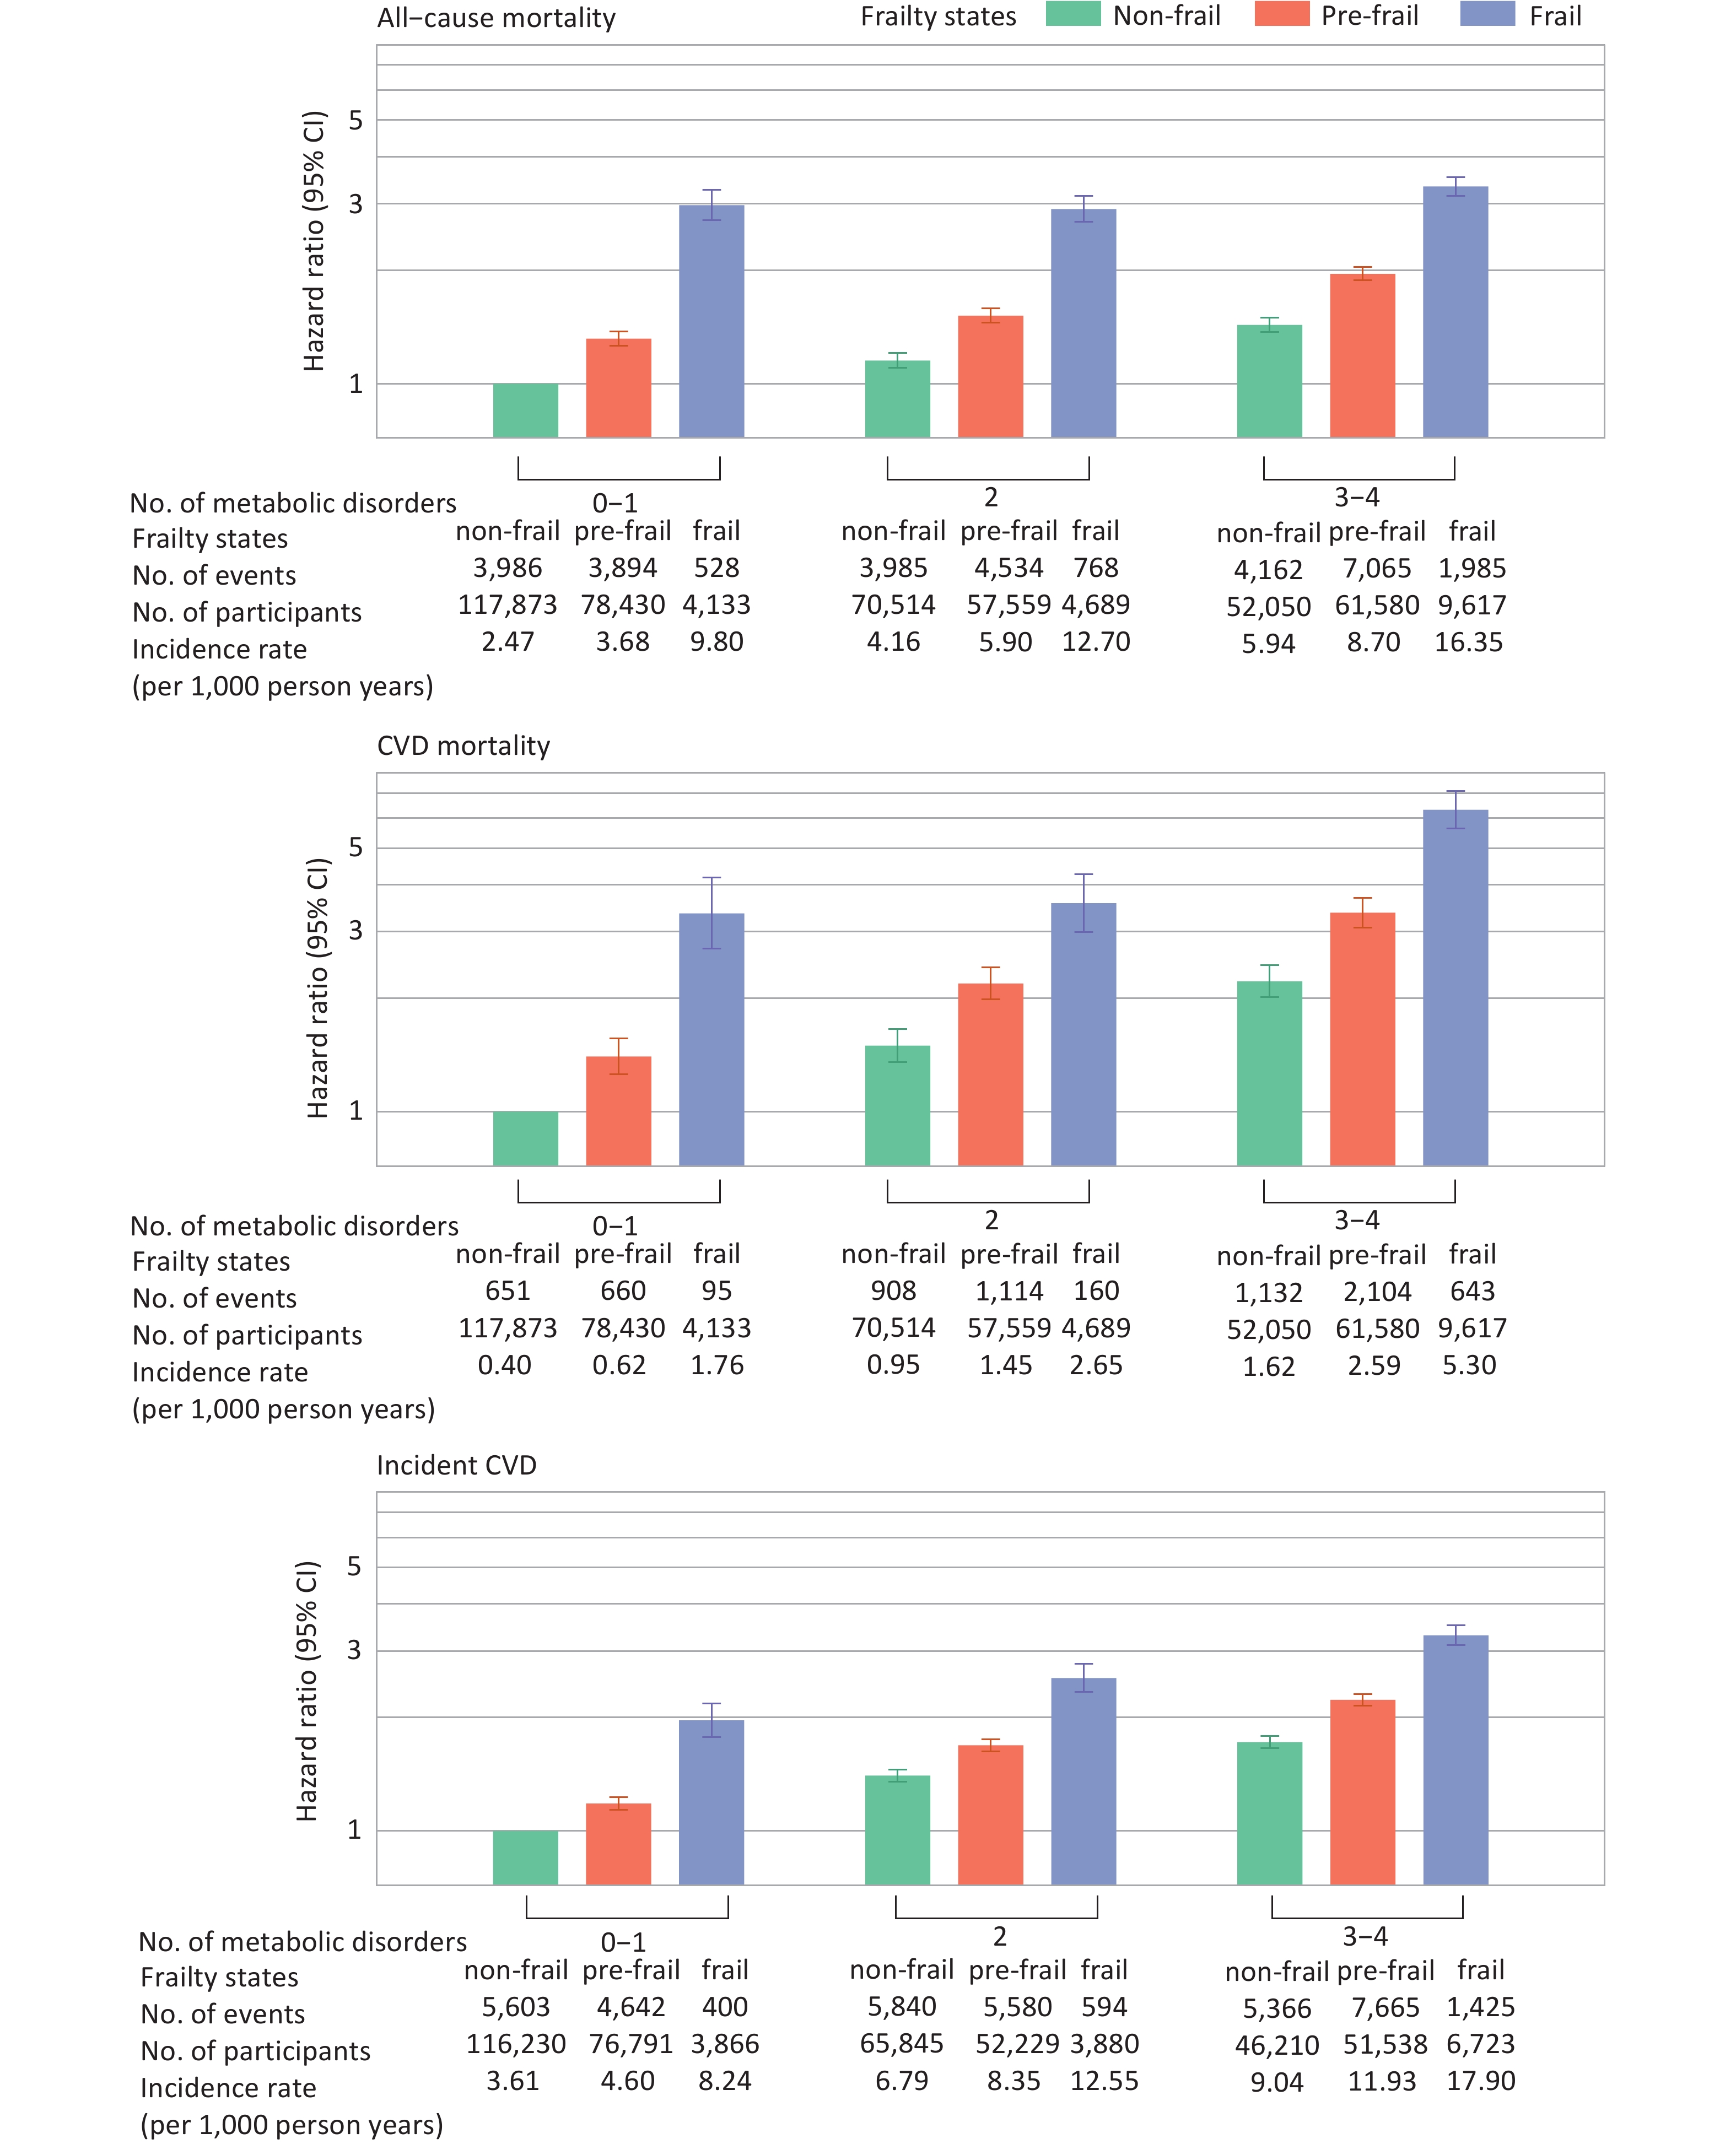
Significant additive interactions were observed for CVD mortality (RERI, 1.78 [95% CI, 0.88–2.68]; AP, 0.27 [95% CI, 0.15–0.40]; S, 1.48 [95% CI, 1.19–1.84]) and incident CVD (RERI, 0.60 [95% CI, 0.33–0.86]; AP, 0.18 [95% CI, 0.11–0.26]; S, 1.36 [95% CI, 1.18–1.56]). Figure 4 illustrates the joint association of metabolic status and frailty with health outcomes. HRs (95% CIs) for individuals with frailty and 3–4 metabolic disorders, compared with those with non-frailty and 0–1 metabolic disorder, were 3.34 (3.15–3.53) for all-cause mortality, 6.32 (5.64–7.09) for CVD mortality, and 3.30 (3.11–3.51) for incident CVD (Supplementary Table S9).
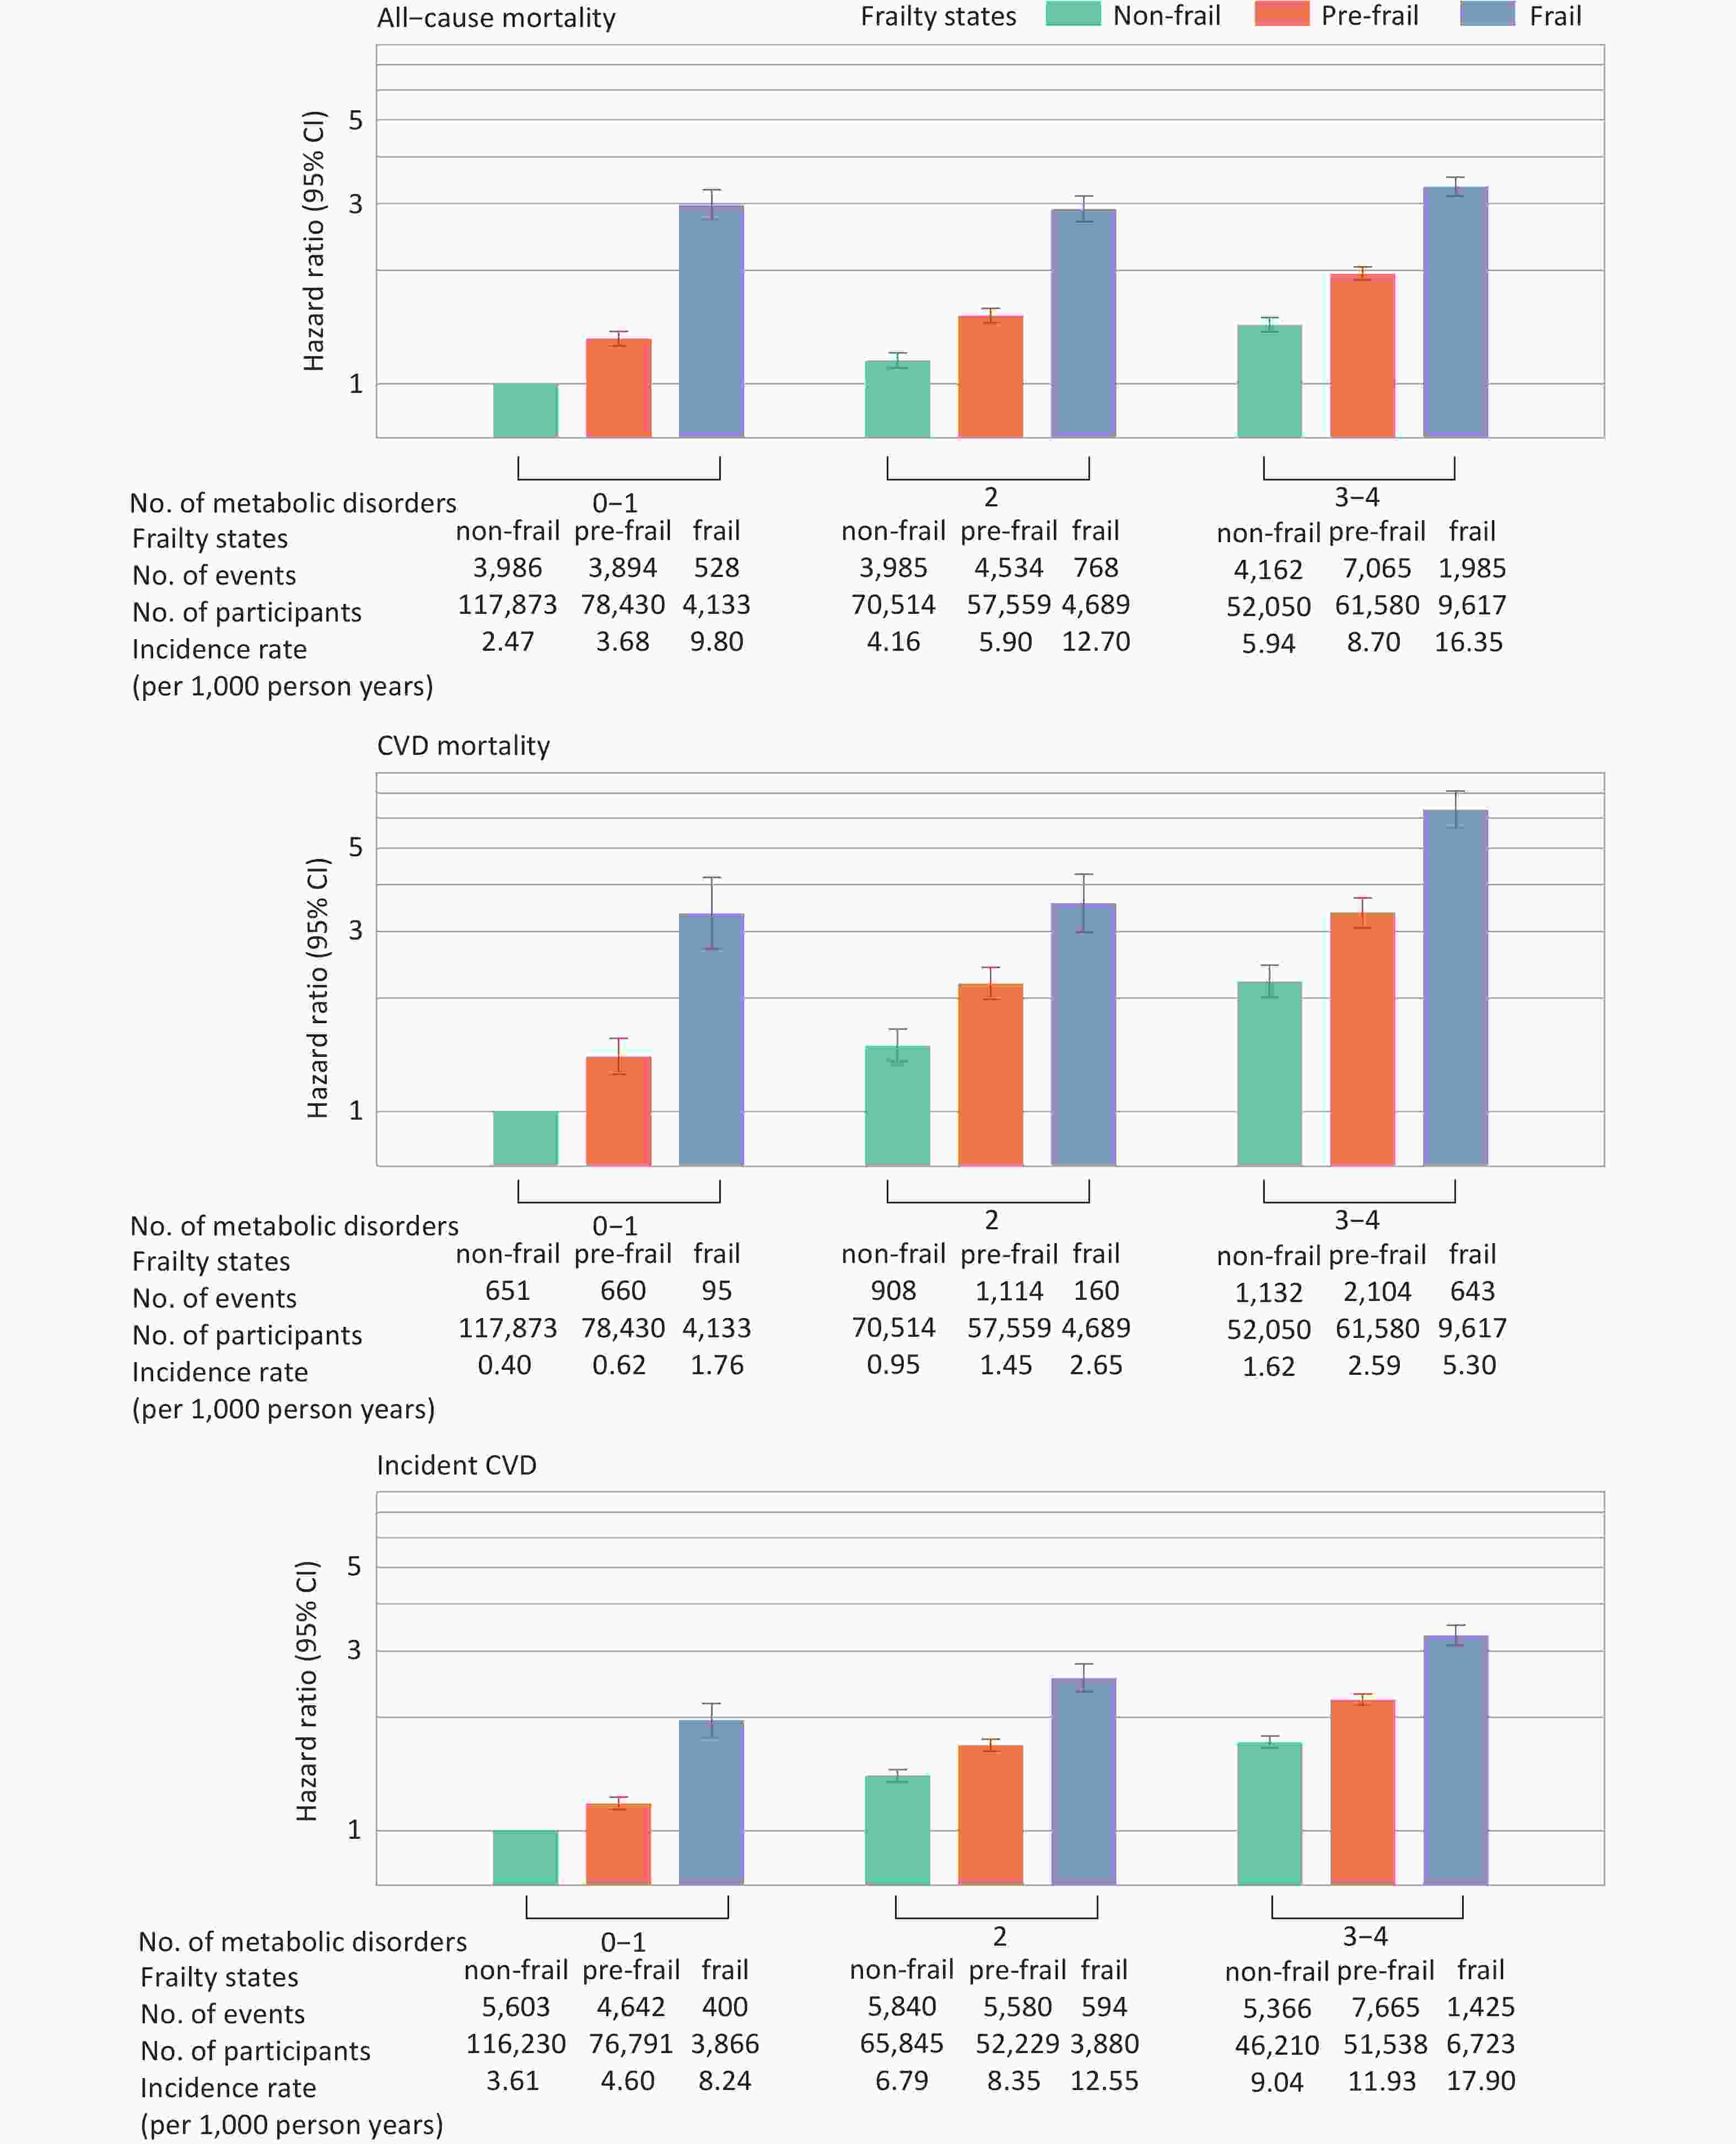
Figure 4. Joint associations between frailty and metabolic status with mortality and incident CVD. Hazard ratios were adjusted for age, sex, ethnicity, Townsend Deprivation Index, assessment center, educational attainment, smoking status, alcohol consumption, diet, and sleep duration. Metabolic status and frailty were each treated as three-category variables. The nine combinations of these two variables were included in the Cox proportional hazards model to estimate their joint effects. Only individuals free from CVD at baseline and during the first two years of follow-up were included in the analysis for incident CVD (n = 423,312). CVD, cardiovascular disease; CI, confidence interval.
-
Supplementary Tables S10 and S11 present the results of subgroup analyses stratified by age and sex, which were broadly consistent with the main analyses. However, significant interactions (P-value for interaction < 0.001) were detected between age and the joint exposure to frailty and metabolic disorders. Compared with non-frail individuals with 0–1 metabolic disorder, frail individuals with 3–4 metabolic disorders exhibited higher risks of all-cause mortality, CVD mortality, and incident CVD among younger adults than among older adults. Supplementary Tables S12, S13, and S14 present the sensitivity analyses for mediation, interaction, and joint effects, respectively, with results generally consistent with the primary analyses.
-
In this large-scale cohort study, we found that frailty was associated with increased risks of all-cause mortality, CVD mortality, and incident CVD, with mediation proportions by metabolic status of 8.7%, 16.1%, and 16.4%, respectively. Significant interactions between frailty and metabolic status were observed for mortality and incident CVD. The highest risks of mortality and CVD were observed among adults with frailty and 3–4 metabolic disorders. Younger adults exhibited higher risks of these outcomes than older adults in the joint effect analyses.
The associations between frailty and mortality or incident CVD have also been reported in previous studies[14,21,22]. In a meta-analysis of 56 studies including more than 1.8 million individuals, researchers identified a positive association between frailty and increased all-cause mortality[23]. Our findings further expand this knowledge by revealing the interplay between frailty and metabolic status in shaping health outcomes. Specifically, we observed that metabolic disorders significantly mediated the association between frailty and adverse health events. Frailty may reflect the deterioration of brain and muscle function[24]. In the frail state, insufficient physical activity contributes to impaired metabolism[25,26], which, in turn, leads to a range of diseases and elevated mortality risk. We also examined the role of metabolic disorders as mediators between each frailty component and health outcomes, and found significant mediating effects for all frailty components except low grip strength. Previous studies have proposed that the effect of low grip strength on health may be driven primarily by neuromuscular mechanisms rather than metabolic dysregulation[27]. In both Mendelian randomization[28] and prospective cohort studies[29], the direct link between grip strength and mortality was shown to be independent of metabolic pathways. Overall, our mediation analyses indicate that metabolic status contributes to a portion of the indirect effects of frailty.
Another important finding of our study is the significant joint effect of frailty and metabolic disorders on adverse health outcomes. As metabolic disorders and frailty components accumulated, the risk of mortality and incident CVD also increased. Few studies have examined the combined effects of physical frailty and metabolic dysfunction. A study conducted using the National Health and Nutrition Examination Survey datasets compared the independent effects of the frailty index and metabolic syndrome on mortality, but did not assess their joint effects[30]. Although emerging evidence suggests that combined exercise and protein supplementation interventions may attenuate frailty progression in older adults[31–34], these findings remain inconclusive due to small sample sizes (typically fewer than 100 participants per study) and short follow-up durations (less than one year).
Furthermore, the interaction analysis revealed synergistic effects between frailty and metabolic disorders on CVD mortality and incident CVD, but not on all-cause mortality. This additive interaction may be attributed to their shared pathophysiological mechanisms. Declining insulin sensitivity leads to alterations in the oxidant-antioxidant balance and an accelerated inflammatory response, establishing a bidirectional vicious cycle: metabolic syndrome promotes frailty, and frailty also increases the risk of metabolic syndrome[12,35–37]. Notably, the significant multiplicative interaction for all-cause mortality should be interpreted with caution. Large-scale studies frequently yield statistically significant yet clinically negligible effects, and the near-null effect size may be attributed to residual confounding factors [38]. In summary, the complex interplay between frailty and metabolism underscores the necessity of promoting both physical function and metabolic health to prevent premature mortality and reduce the burden of disease.
Frailty is viewed as an age-related condition, and interventions to reverse frailty or improve outcomes have almost exclusively focused on the elderly[12]. However, in our study, the combined effects of frailty and metabolic disorders were found to be particularly pronounced in younger populations, suggesting that early identification and intervention could substantially reduce the long-term burden of disease. One potential explanation is that individuals with early-onset metabolic disorders may carry relevant pathogenic genes, such as TMOD4, COL6A3, CXCL8, MARCH1, PLCB2, and VPS33B, which contribute to major adverse cardiovascular events[39]. Previous studies have also shown that earlier onset of hypertension and diabetes in adults increases the risks of CVD and death[40,41]. Public health initiatives should prioritize identifying individuals at risk early—particularly younger individuals—in whom the combined effects of frailty and metabolic disorders may lead to the earlier onset of adverse health outcomes.
Our results suggest that individuals with both frailty and metabolic dysfunction face significantly higher risks of mortality and incident CVD, emphasizing the need for early screening and integrated management strategies. Interventions targeting both frailty and metabolic conditions, such as lifestyle modifications, could reduce the burden of cardiovascular disease and improve overall population health. This dual approach is particularly important as healthcare systems globally face increasing pressure from the growing prevalence of chronic conditions. Effective public health strategies should promote coordinated care that addresses both physical and metabolic health to reduce long-term risks and improve quality of life for individuals at risk.
The strengths of this study include its prospective design, large sample size, and long-term follow-up, which allowed for joint and stratified analyses with sufficient statistical power. However, several limitations should be noted. First, the observational nature of the study precludes the establishment of causal relationships. Second, frailty phenotype and metabolic status were measured at baseline, and the temporal sequence between exposure and mediator could not be ascertained; thus, the possibility of reverse causation cannot be excluded. Third, frailty assessment relied on self-reported data, introducing potential measurement error. Finally, the generalizability of the findings may be limited, as the majority of UK Biobank participants are of European ancestry.
-
In this study, we comprehensively evaluated the complex relationship between frailty and metabolic status in relation to health outcomes. The associations between frailty and both mortality and incident CVD were partly mediated by metabolic status. Additionally, individuals with frailty and unhealthy metabolic status exhibited the highest risks of adverse outcomes. These findings highlight the importance of promoting metabolic health to reduce the burden of disease, particularly among individuals with frailty.
Association of Frailty with Mortality and Incident Cardiovascular Disease: The Role of Metabolic Status
doi: 10.3967/bes2025.154
- Received Date: 2025-03-02
- Accepted Date: 2025-06-09
-
Key words:
- Frailty /
- Metabolic status /
- Mediation analysis /
- Joint effect
Abstract:
The authors declare no competing interests.
The UK Biobank study was approved by the North West Multi-Centre Research Ethics Committee (REC reference numbers: 11/NW/0382, 16/NW/0274, and 21/NW/0157), and the current study was conducted under an approved application (#109546).
| Citation: | Youjing Wang, Tingting Geng, Ku Xun, Jinchi Xie, Dan Xue, Yuxiang Wang, Gang Liu, An Pan. Association of Frailty with Mortality and Incident Cardiovascular Disease: The Role of Metabolic Status[J]. Biomedical and Environmental Sciences. doi: 10.3967/bes2025.154

|

 Quick Links
 DownLoad: