
-
In the event of nuclear accidents and incidents, when emergency resources are scarce, rapid and high-throughput biodosimeters for massive population triage and estimation are essential to guide medical treatment. Lymphocyte dynamics, chromosome aberration analysis, and micronucleus assays are mainly used to estimate the biological dose of radiation[1]. However, these technologies require highly trained personnel to perform and interpret and have the limitations of time consumption and low throughput, underscoring the urgent need for the development of radiation biomarkers and early classification. Dose and temporal responses as well as efficient triage models are important facets of radiation biodosimeters.
Recently, lipidomics has emerged in the radiobiological field as a promising radiation biodosimetry technique. Perturbations in lipid classes have been delineated in many studies to identify biomarkers in the biospecimens of mice, nonhuman primates, and humans[2,3]. Machine learning (ML) has gained popularity in terms of classification and prediction for the analysis and integration of complex biomedical data[4,5]. Coupling lipidomics and ML methods performed on peripheral blood can enhance early triage following radiation exposure.
Previously, we employed targeted lipidomics to screen plasma radiosensitive lipids after 0, 1, 2, 3, 5, and 8 Gy of TBI for 4 h, 1 d, and 3 d[6]. Determining the effects of radiation at higher doses and longer postirradiation durations is important. Herein, we delineated lipidomic signatures and radiation responses of rat plasma after 0, 5 and 10 Gy TBI at 1, 7 and 14 d. Lipid biomarkers screened in rat plasma in previous study were used to establish triage models by seven commonly used ML algorithms of least absolute shrinkage and selection operator (LASSO), random forest, support vector machine, neural network model (NN), K-nearest neighbor algorithm, light gradient boosting machine and decision tree (DT)[7]. Moreover, the same lipid biomarkers used in the present study externally validated the performance of the different models.
Targeted lipidomics analyze lipid species including fatty acid (FA), ceramide (Cer), dihexosylceramide, sphingomyelin (SM), cholesteryl ester, diacylglyceride (DG), triacylglyceride (TG), phosphatidylcholine (PC), phosphatidylethanolamine (PE), ether-linked phosphatidylcholine (PC-O), ether-linked phosphatidylethanolamine (PE-O), phosphatidic acid (PA), phosphatidylglycerol (PG), and phosphatidylserine (PS), phosphatidylinositol, lysophosphatidylcholine (LPC), ether-linked lysophosphatidylcholine (LPC-O), lysophosphatidylethanolamine (LPE).
On day 1 postirradiation, the principal component analysis (PCA) plot showed a distinct separation of lipid profiles among the 0, 5, and 10 Gy groups (Supplementary Figure S1A). Consistent with the PCA plot, 11 individual lipids fluctuated significantly after exposure to 10 Gy compared with the 0 Gy group. Specifically, 10 lipids were upregulated, including 4 SMs, 3 PCes, 2 PCs, and 1 TG, and 1 lipid of TG54:5(18:2) was downregulated (Supplementary Figure S1B-1D, Supplementary Table S1, S4). On day 7 postirradiation, the PCA plot also showed a distinct separation of lipid profiles among the 0, 5, and 10 Gy groups, explaining 50.9% of the total data variance (Supplementary Figure S1E). A total of 145 lipid metabolites were distinctly altered following exposure to 10 Gy compared with the 0 Gy group, of which 144 lipid metabolites decreased, including 85 TGs, 25 PCs, 11 PEs, 5 DGs, 4 PCes, 4 SMs, 3 FFAs, 3 PSs, 1 PG, 1 PEe, 1 LysoPC, and 1 LysoPE; one lipid metabolite of PS38:1(18:1/20:0) increased. The most marked reductions were observed in TG54:8(22:6) (0.05-fold) and TG51:5(18:3) (0.05-fold) (Supplementary Figure S1F-1H, Supplementary Table S2, S5). On day 14 postirradiation, 34 lipid metabolites were distinctly altered following exposure to 5 Gy irradiation (Supplementary Figure S1I, Supplementary Table S3). Specifically, seven lipid metabolites were elevated, consisting of 3 TGs, 2 PCs, 1 PS, and 1 PG, and 27 lipid metabolites were reduced, including 13 FAs, 7 SMs, 5 PCs, 1 PA, and 1 TG. The most pronounced increases in TG56:5(22:4) (4.47-fold) and TG60:5(24:1) (4.32-fold), and reductions in TG58:11(20:5) (0.12-fold) and FA(18:3) (0.16-fold) were observed.
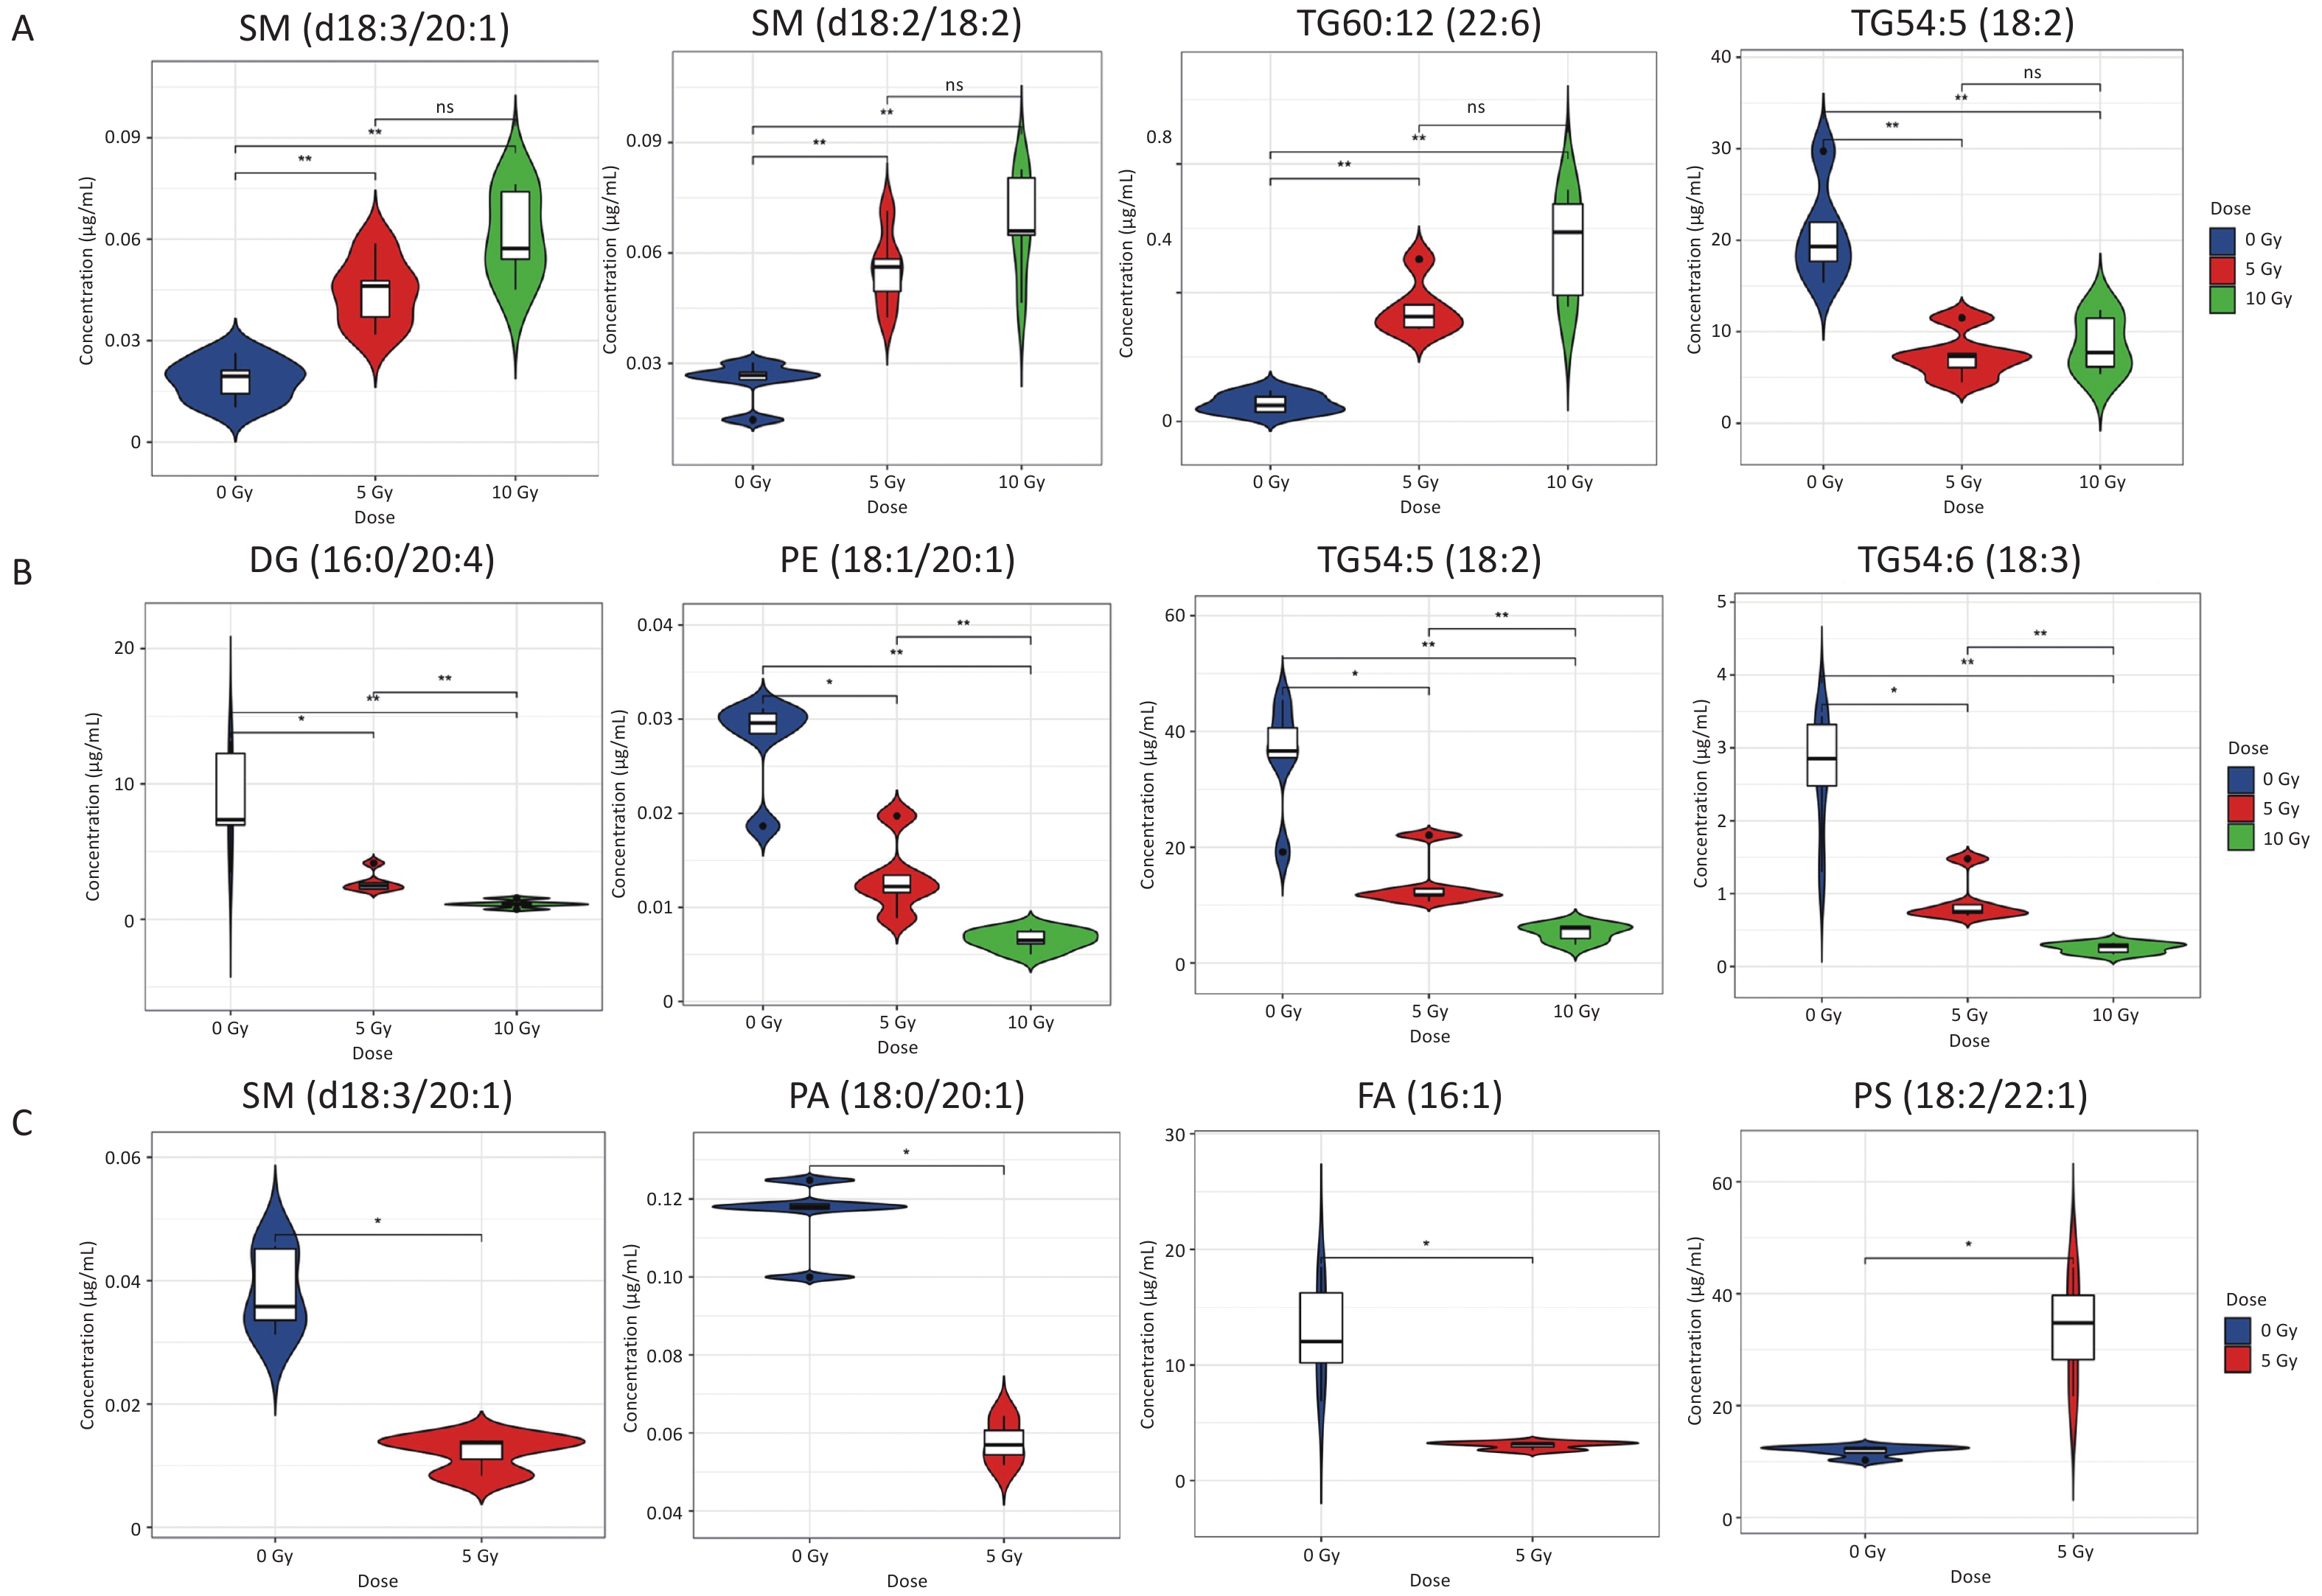
Metabolites with a dose-dependent trend within the dose range of 0–10 Gy were screened based on differential lipid species in the radiation groups. On day 1 postirradiation, four lipid metabolites (2SMs and 2TGs) were distinctly altered in both the 5 and 10 Gy irradiation groups (Figure 1A, Supplementary Table S6). Levels of SM(d18:3/20:1), SM(d18:2/18:2), and TG60:12(22:6) increased in a dose-dependent manner, whereas TG54:5(18:2) decreased. On day 7 postirradiation, 24 radiosensitive lipid metabolites (1DG, 3PEs, and 20TGs) significantly decreased in a dose-dependent manner in and between the 5 and 10 Gy groups (Figure 1B, Supplementary Table S7). On day 14 postirradiation, 34 lipid metabolites were distinctly altered following exposure to 5 Gy (Figure 1C). Seven individual lipid species (3 TGs, 2 PCs, 1 PS, and 1 PG) were elevated, whereas 27 individual lipid species (13 FAs, 7 SMs, 5 PCs, 1 PA, and 1 TG) were reduced.
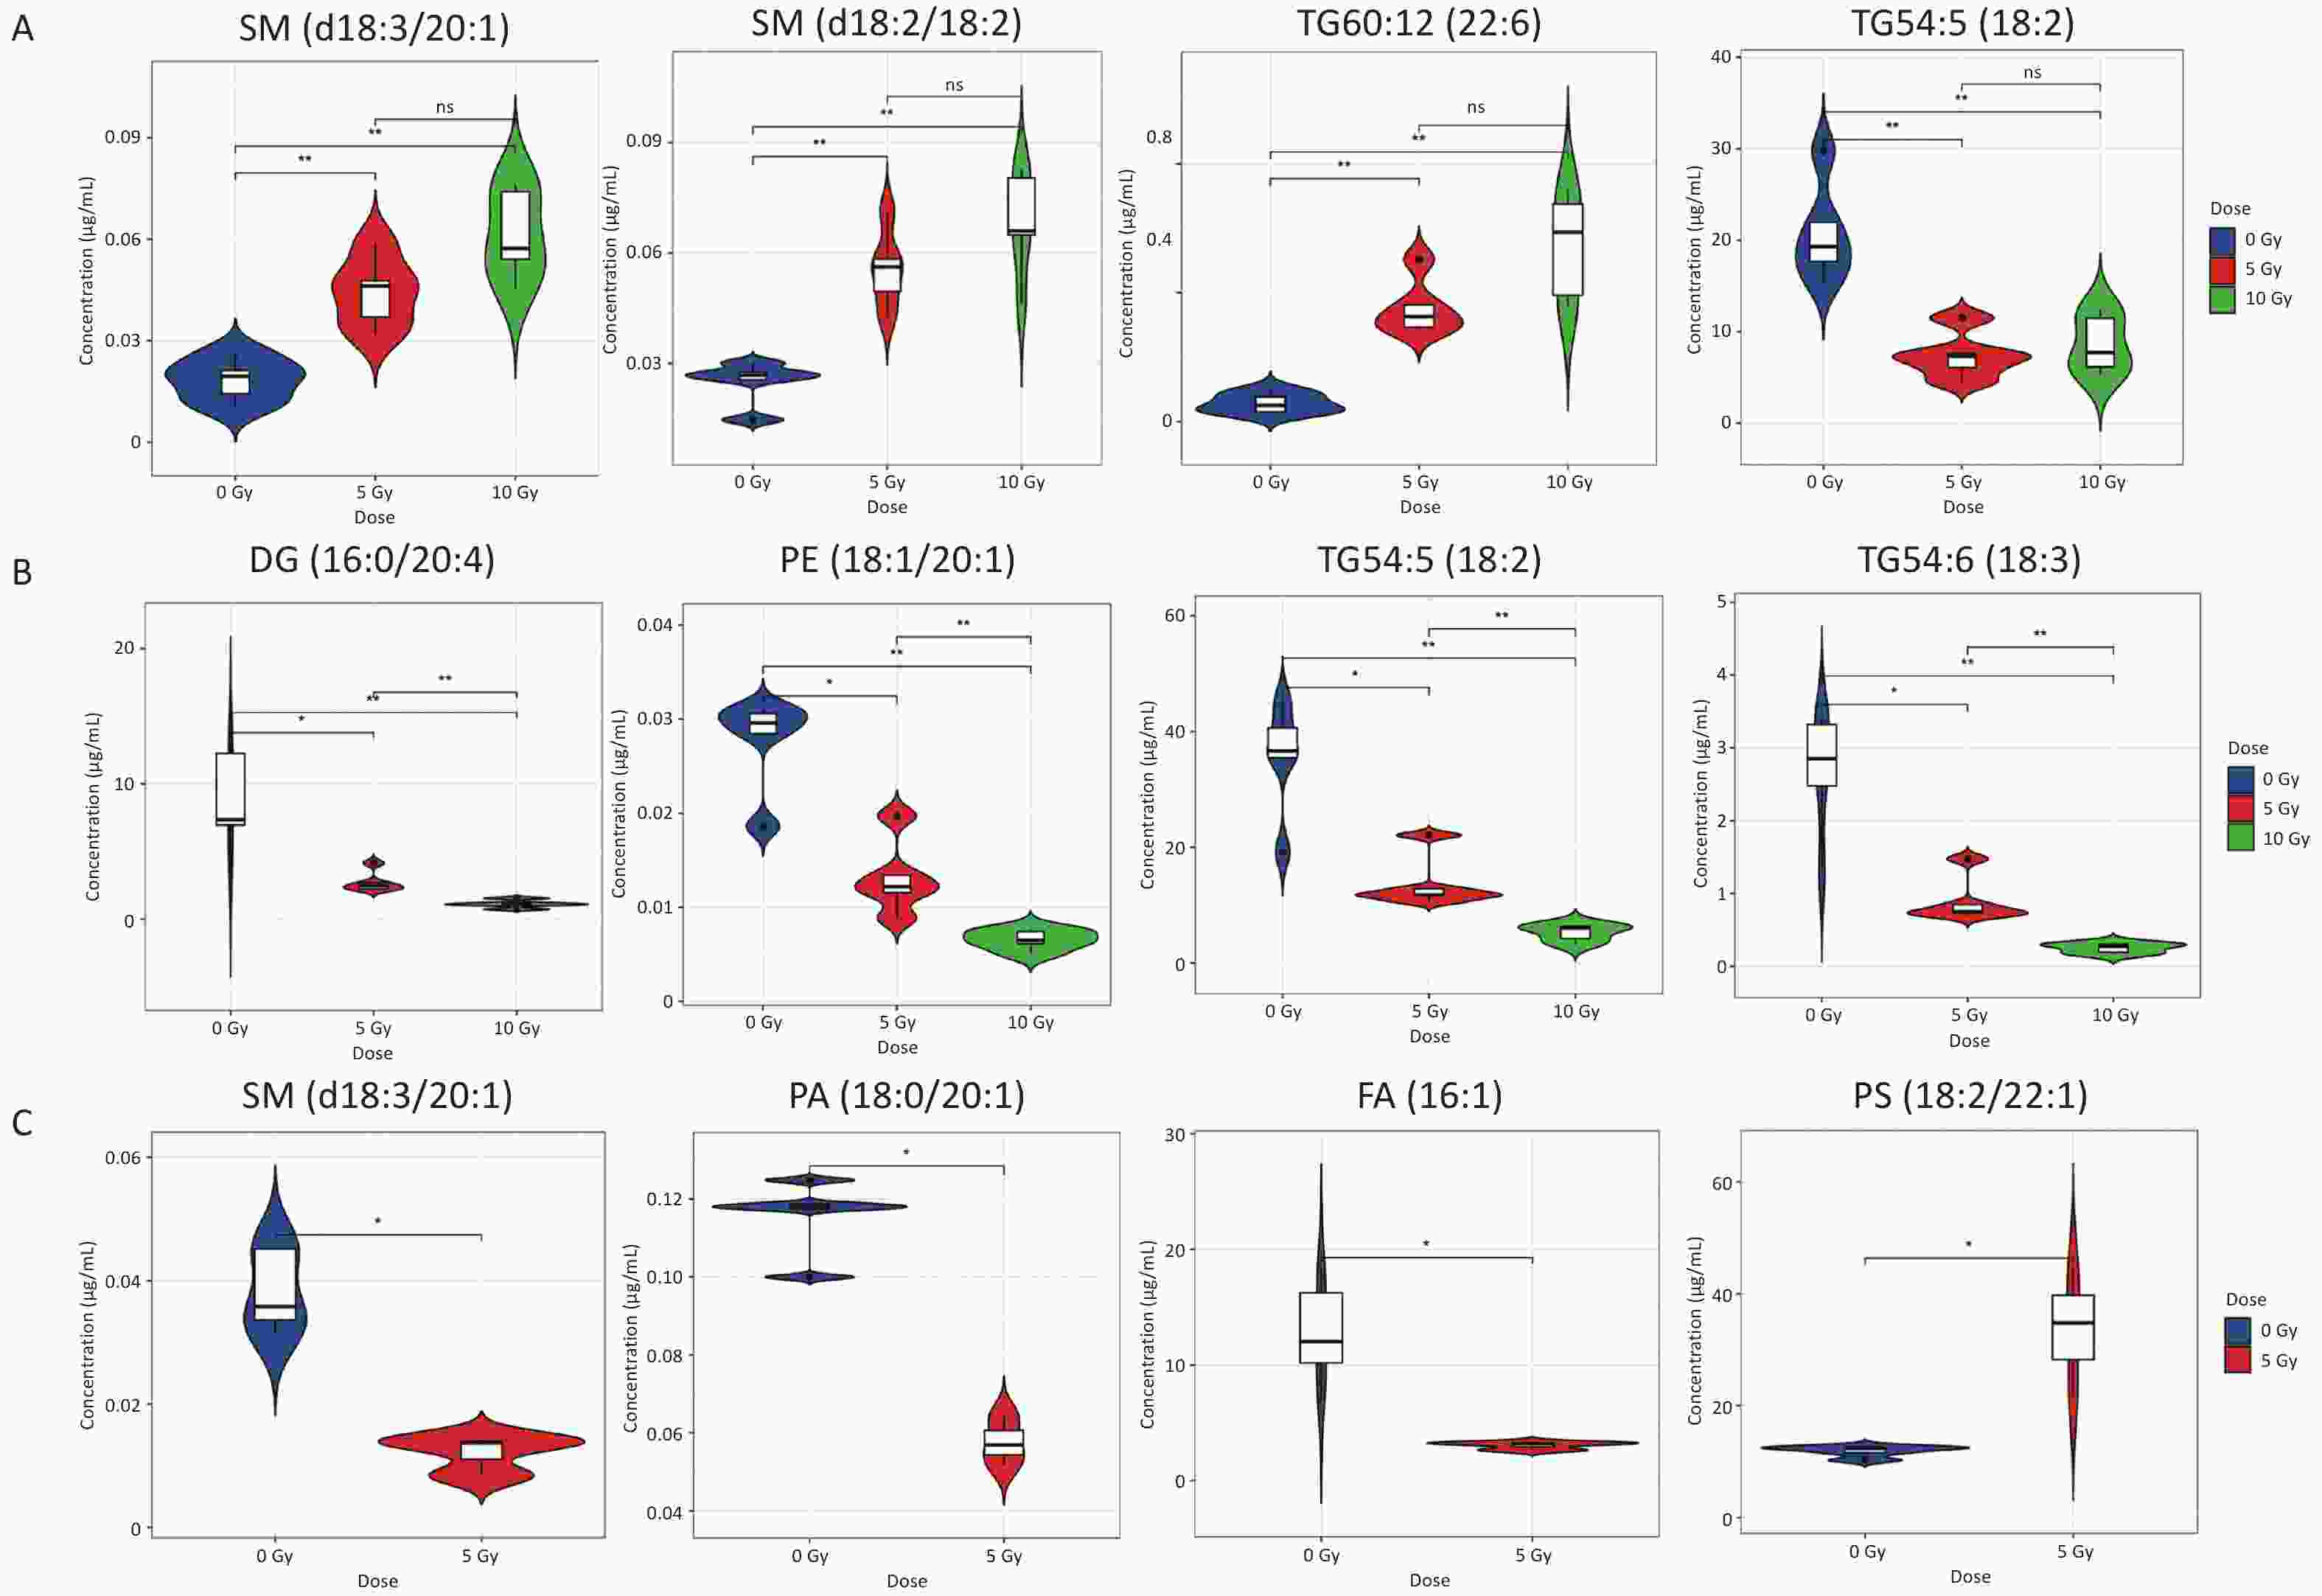
Figure 1. Violin plots depicting the concentration of representative lipids signatures which were dose-dependent within 0–10 Gy. (A) 1 d postirradiation; (B) 7 d postirradiation; (C) 14 d postirradiation. *P < 0.05, **P < 0.01.
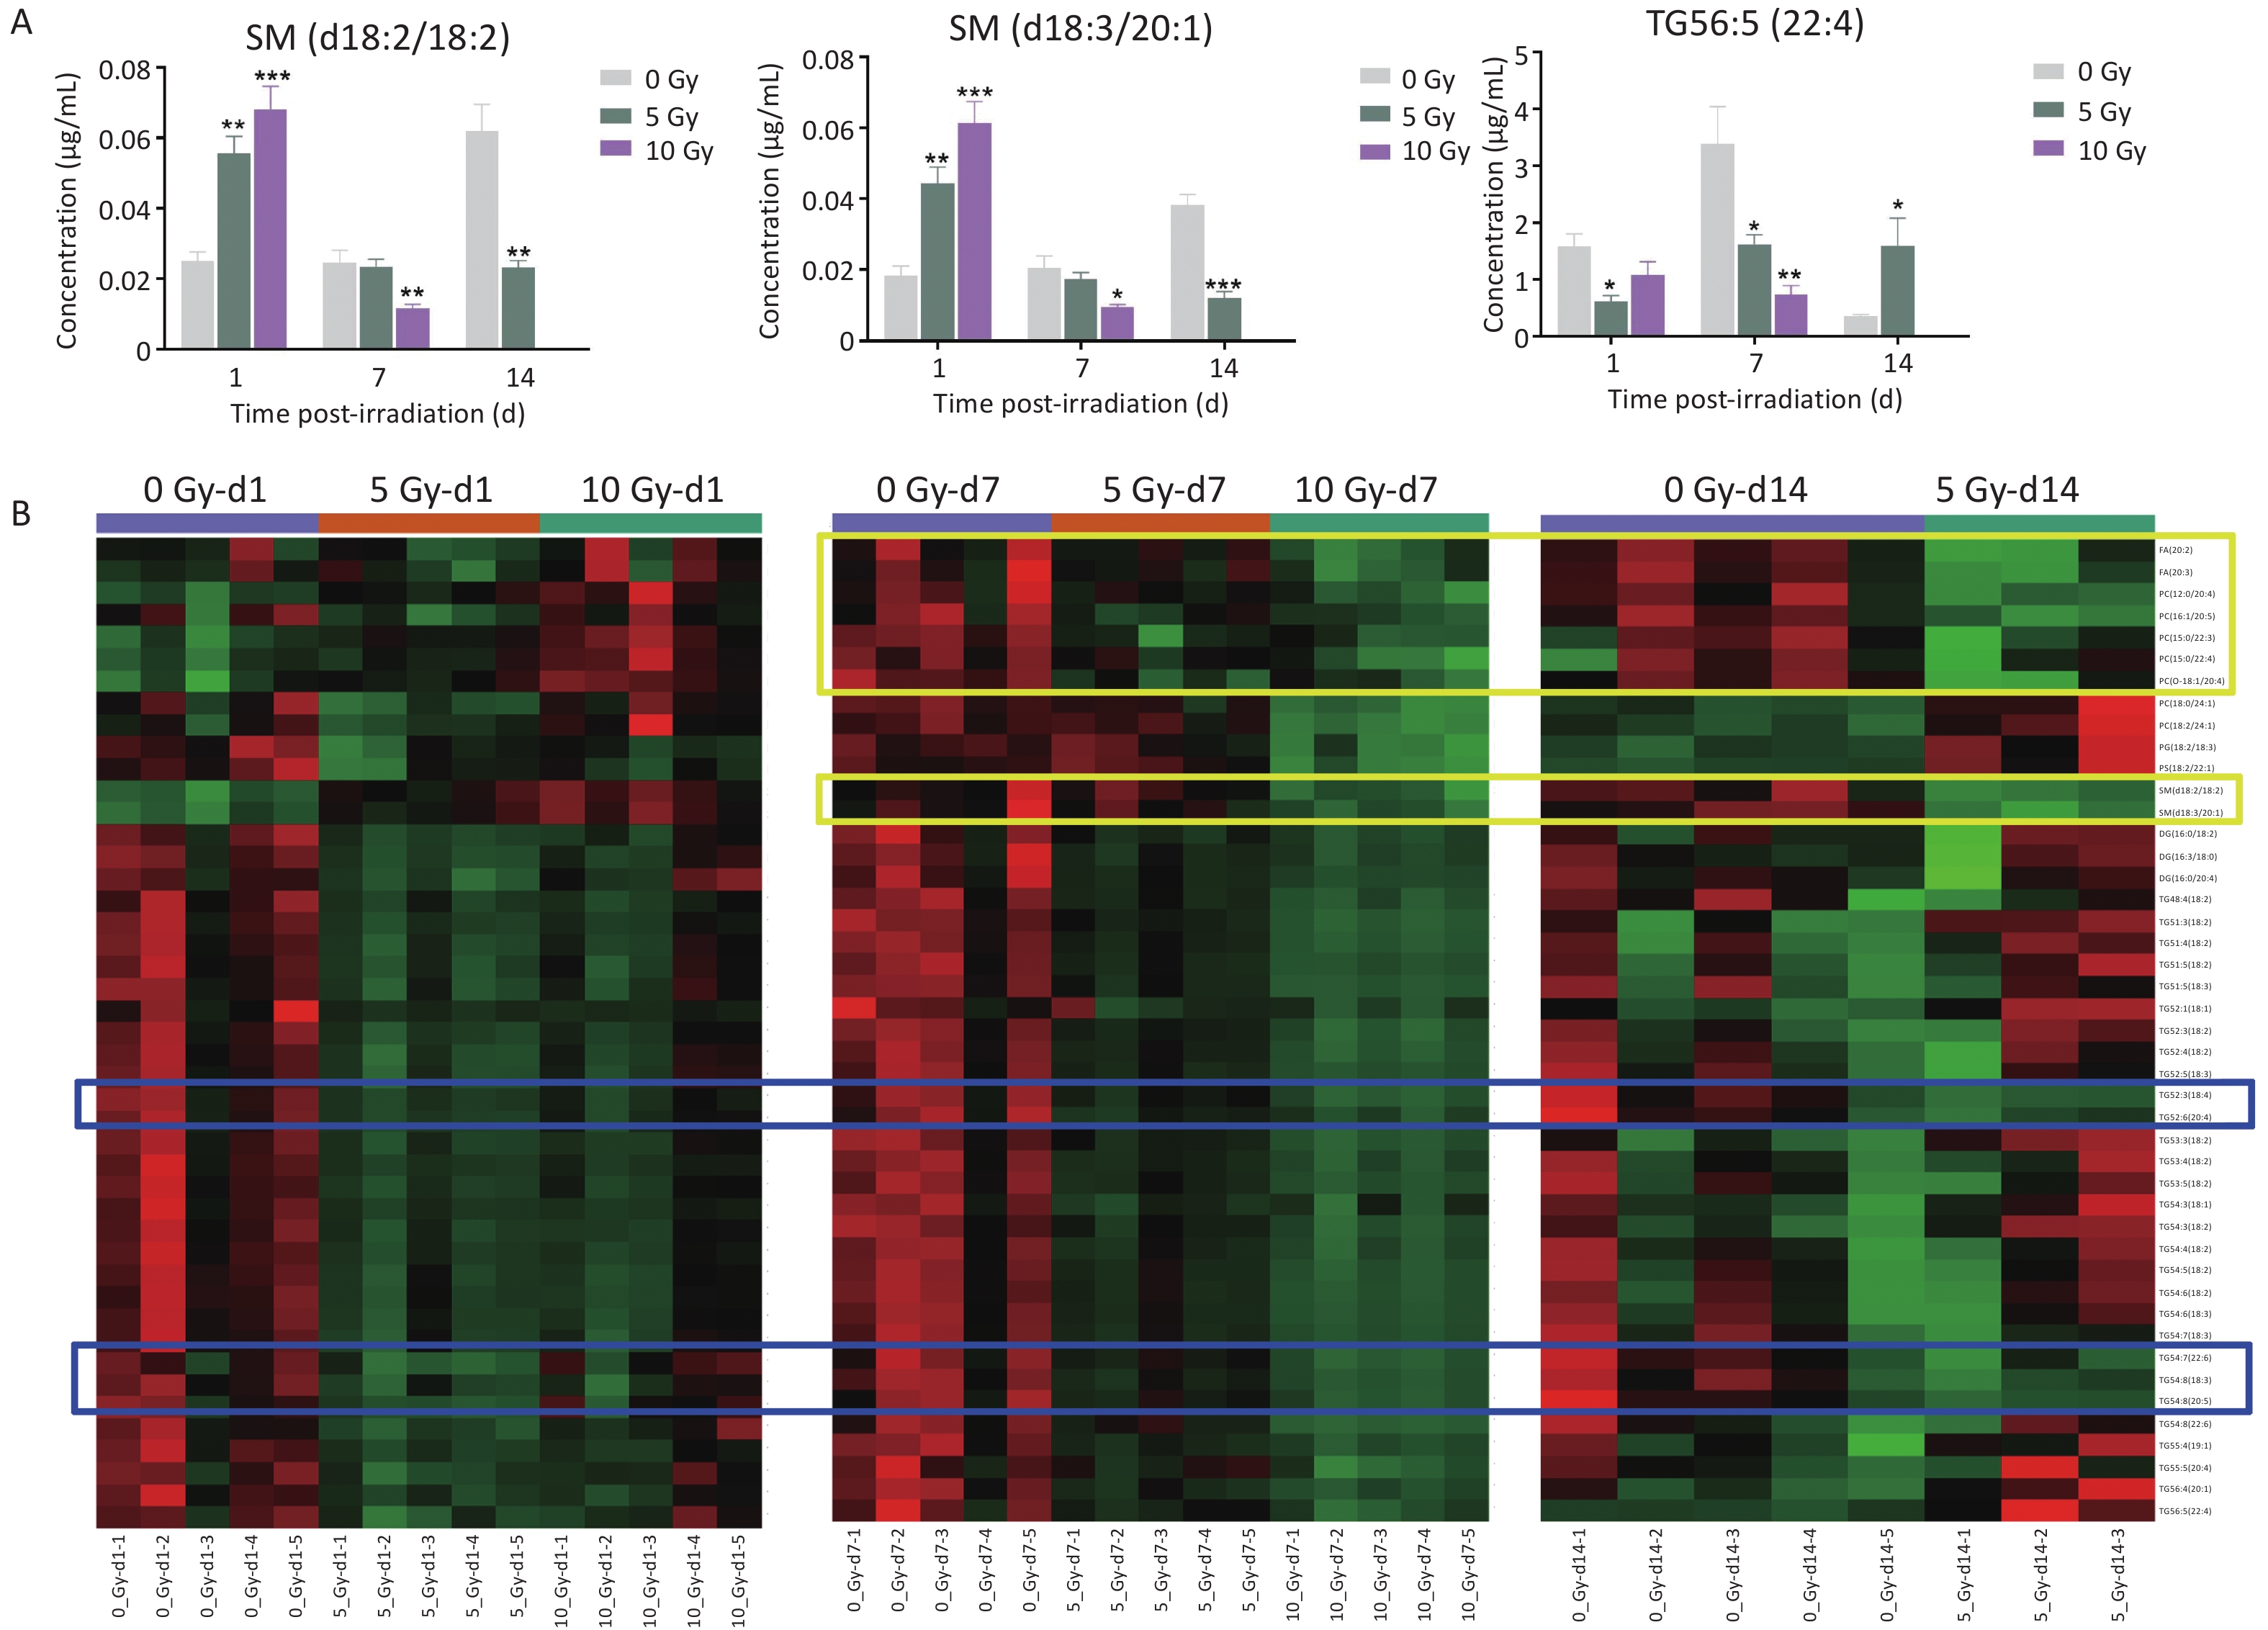
Lipids significantly fluctuated at the three time points and were comprehensively analyzed to illustrate the temporal responses of radiosensitive lipids within 14 days postirradiation. SM(d18:2/18:2), SM(d18:3/20:1), and TG56:5(22:4) levels were significantly altered at all three time points (Figure 2A). SM(d18:2/18:2) and SM(d18:3/20:1) levels were elevated on d1, then dampened on d7 and d14. In contrast, TG56:5(22:4) decreased on d1 and d7, but increased on d14.
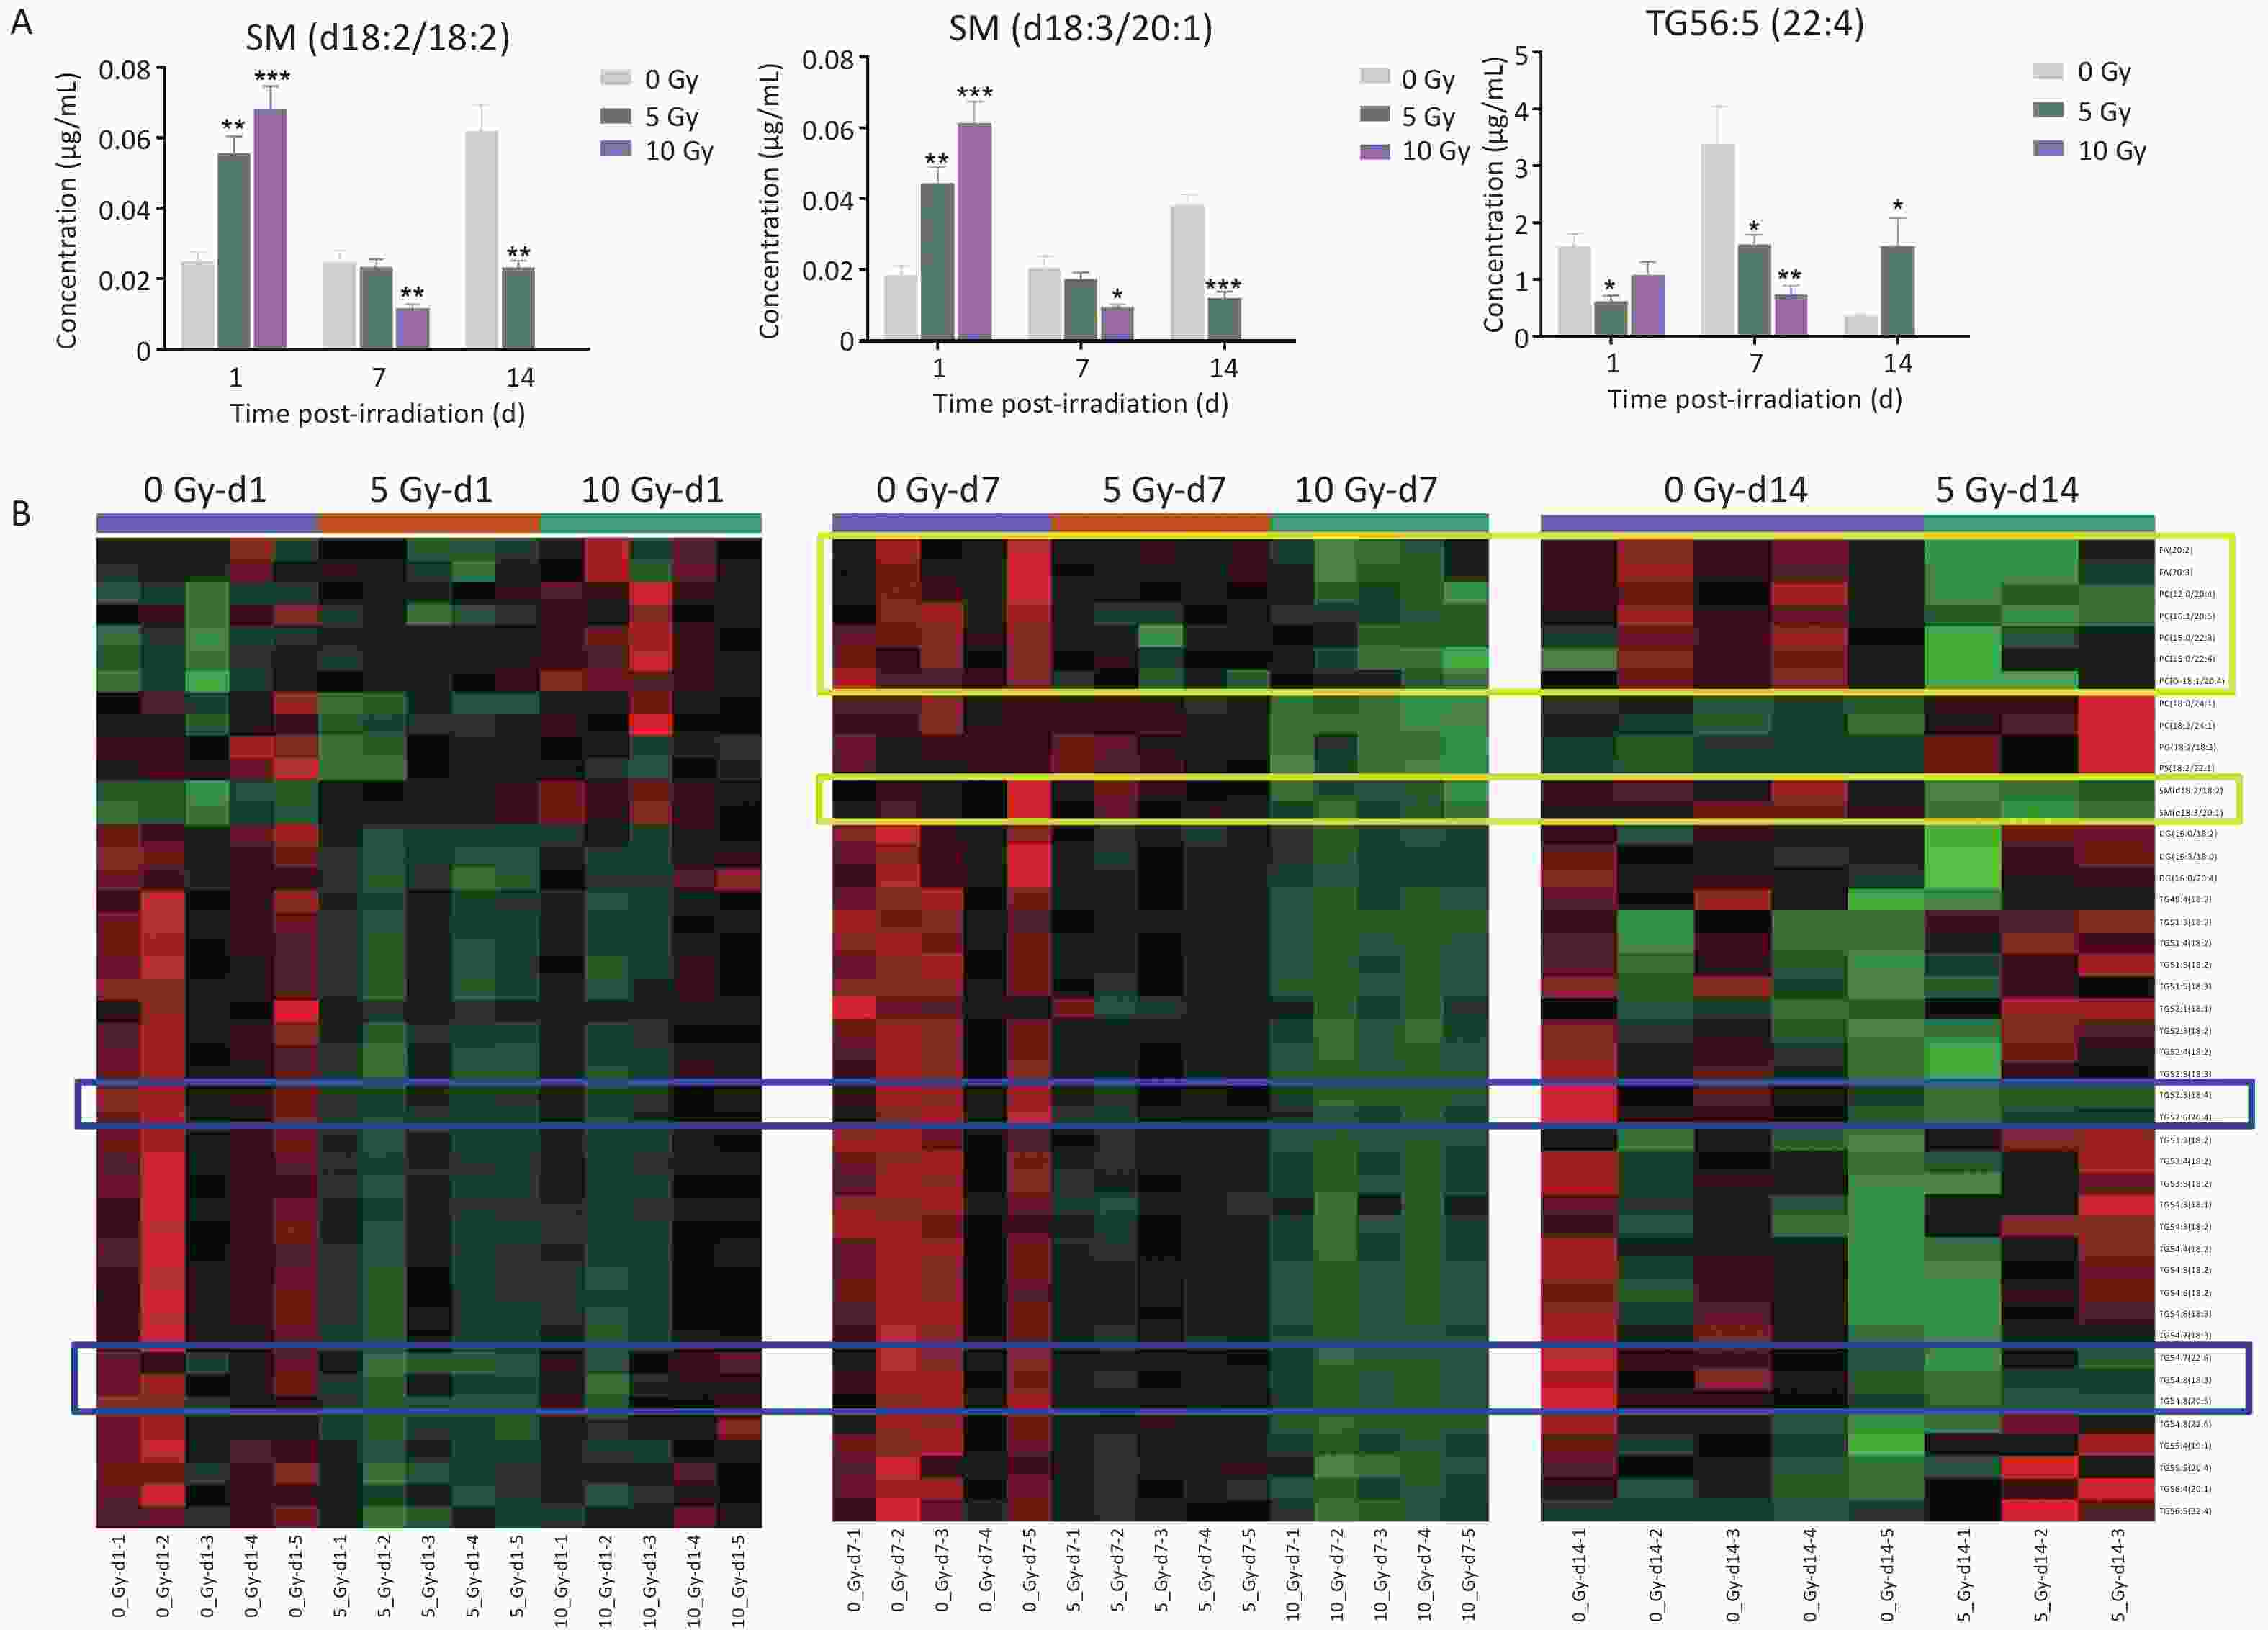
Figure 2. (A) The concentration changes of SM(d18:2/18:2), SM(d18:3/20:1) and TG56:5(22:4) in total body-irradiated rat plasma at time points of 1, 7 and 14 d. Data are presented as mean ± SEM. *P < 0.05, **P < 0.01, ***P < 0.001 (compared with 0 Gy group). (B) A heatmap of 45 common significantly dysregulated lipids in rat plasma at least two time points. The metabolites in blue boxes had the same decreased trend at three time points of 1, 7, 14 d whereas the metabolites in yellow boxes had the same depressed trend at two time points of 7 and 14 d. SM, sphingomyelin; TG, triacylglycerol.
Next, 45 common differential lipids that significantly fluctuated at least two time points were examined, consisting of 1 PC-O, 1 PG, 1 PS, 2 FAs, 2SMs, 3 DGs, 6 PCs, and 29 TGs (Figure 2B, Supplementary Table S8). FA(20:2), FA(20:3), PC(12:0/20:4), PC(16:1/20:5), PC(15:0/22:3), PC(15:0/22:4), PC(O-18:1/20:4), SM(d18:2/18:2) and SM(d18:3/20:1) were depressed in both dose-dependent and time-dependent trends at d7 and d14 postirradiation. All three DGs and 29 TGs were reduced in both dose- and time-dependent trends on d1 and d7 postirradiation. In particular, the levels of TG54:6(18:4), TG52:6(20:4), TG54:7(22:6), TG54:8(18:3), and TG54:8(20:5) decreased in a dose- and time-dependent manner at all three time points.
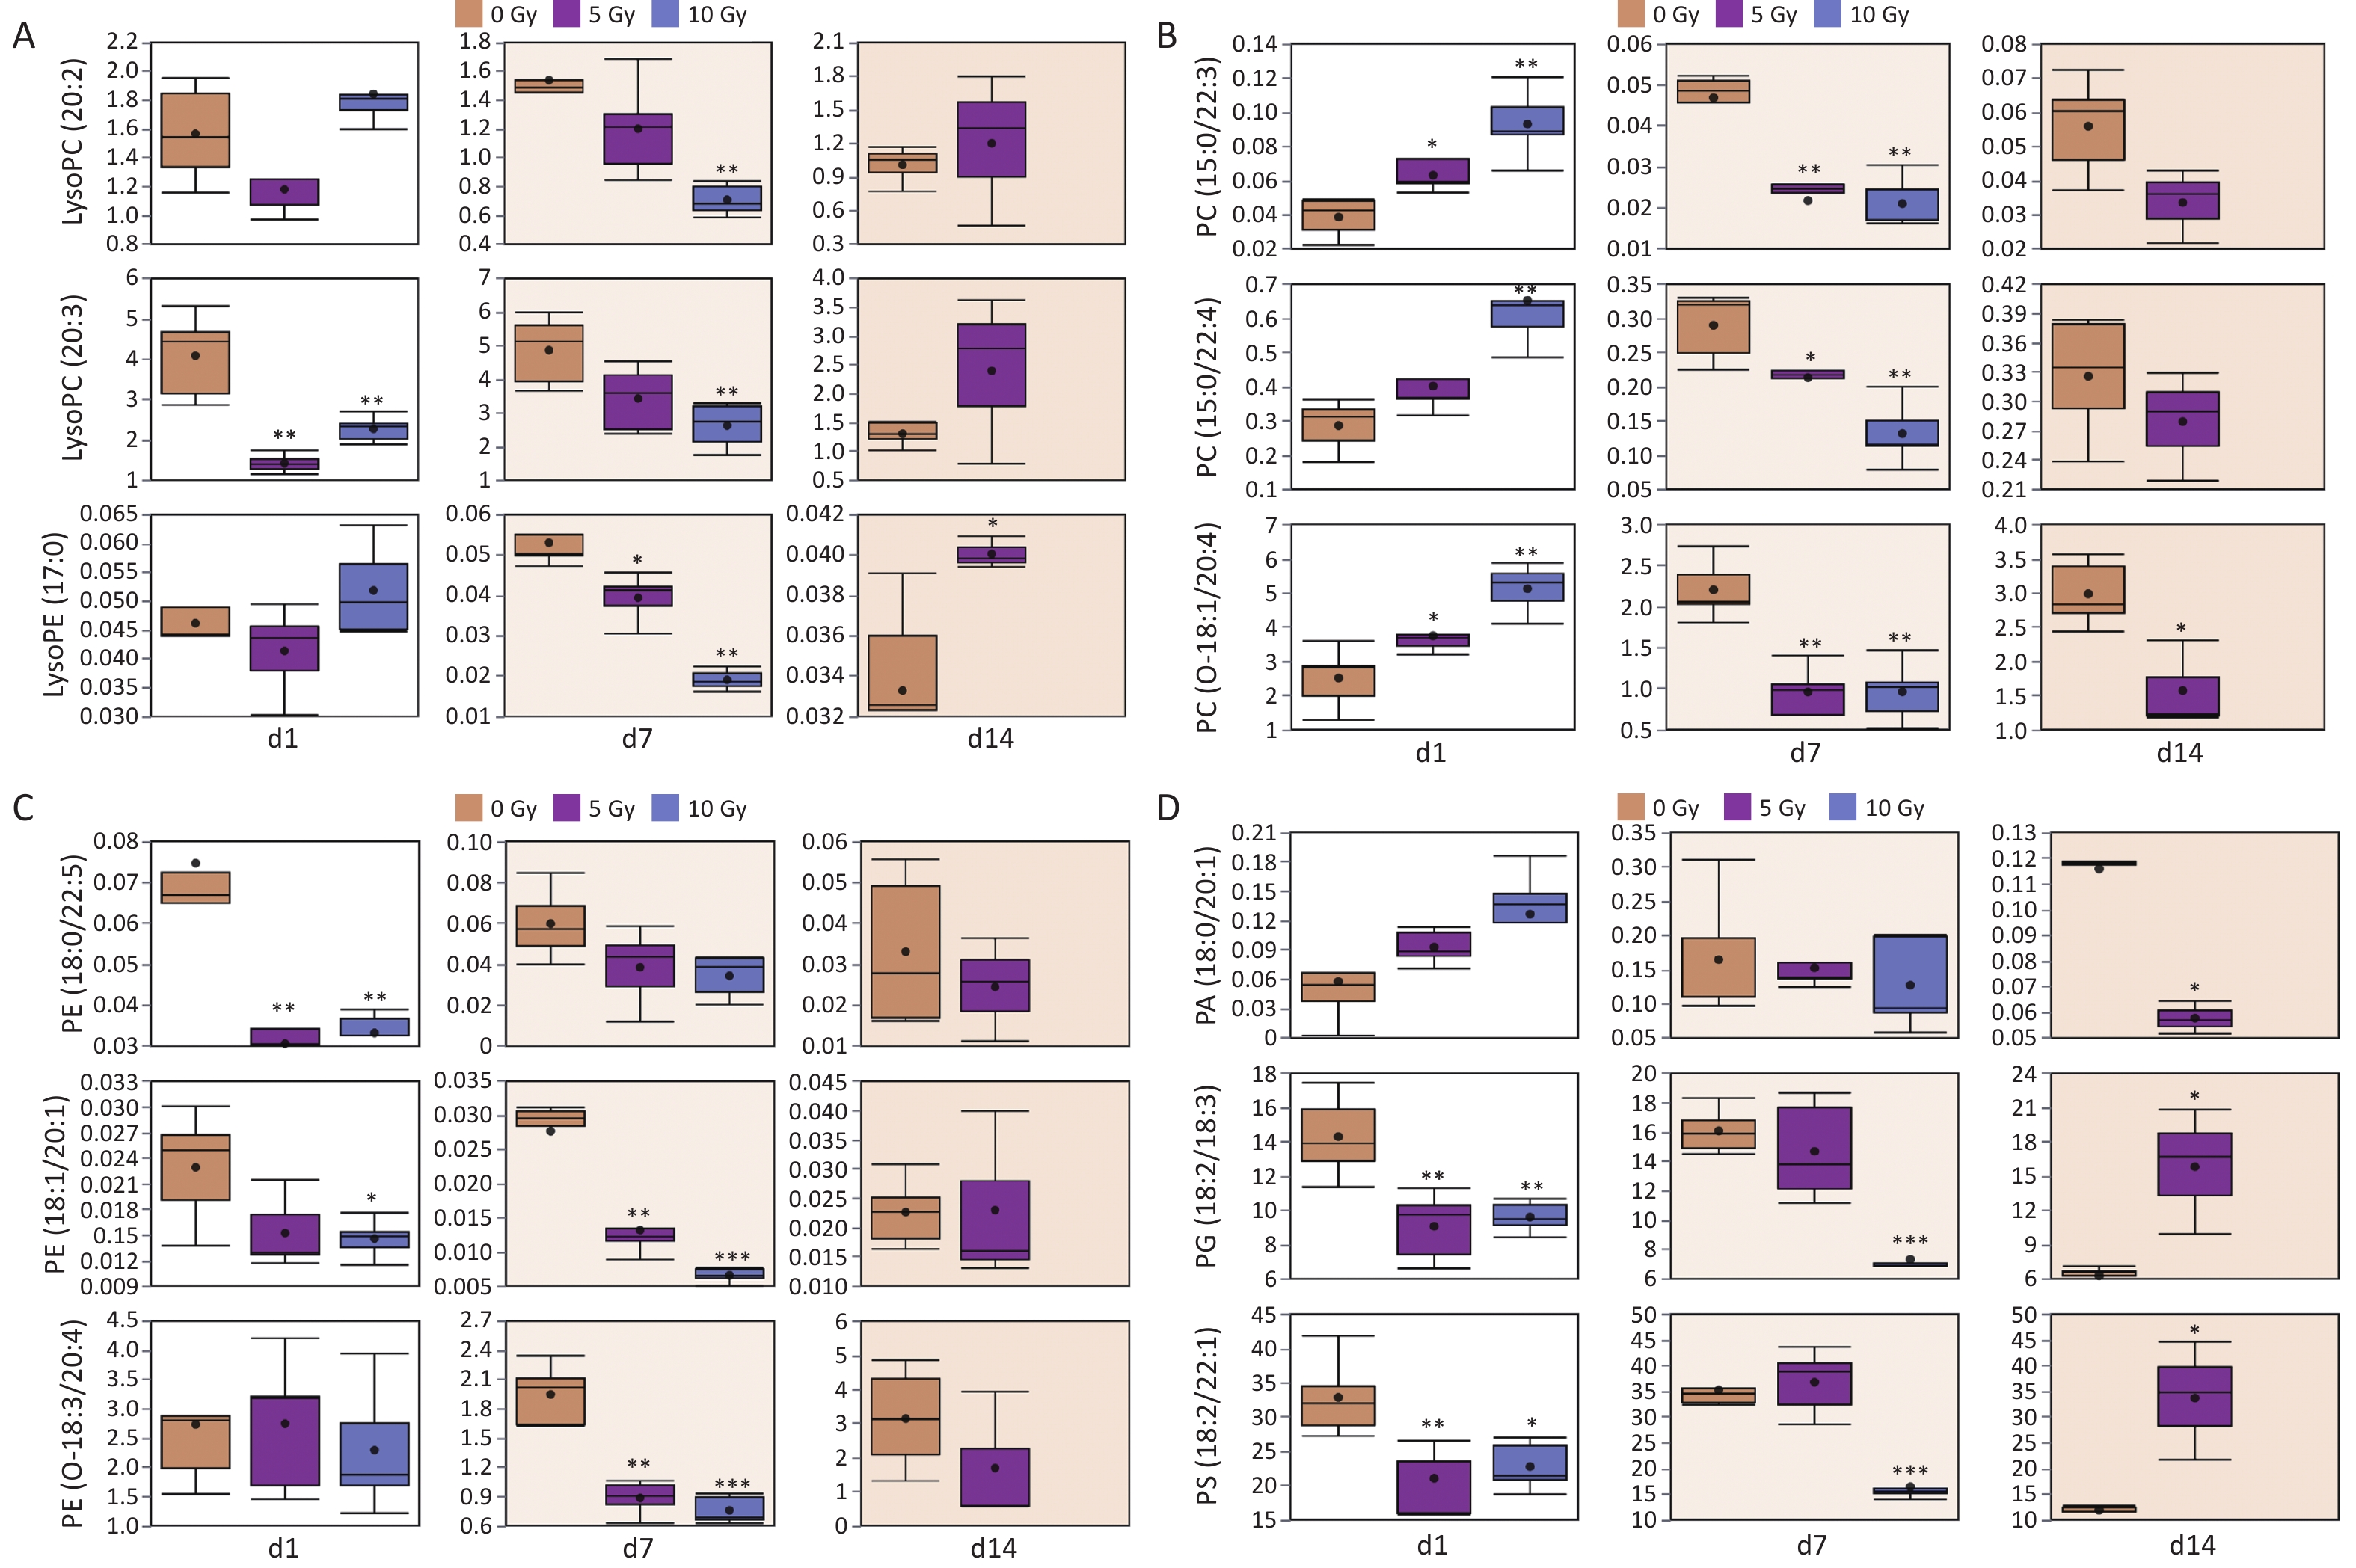
Different lipid species exhibit distinct radiation response signatures. As for the glycerophospholipid class, the differential lipids belonged to the subclasses LPC, LPE, PC, PE, PC-O, PE-O, PA, PG, and PS. Fluctuating individual plasma lipid levels showed more dynamic radiation responses (Figure 3). LPC(20:2), LPC(20:3) and LPE(17:0) were decreased at 1 and 7 d, and increased conversely at 14 d. PC(15:0/22:3), PC(15:0/22:4) and PC(O-18:1/20:4) were increased at 1 d, and decreased conversely at 7 and 14 d. PE(18:0/22:5), PE(18:1/20:1) and PE(O-18:3/20:4) exhibited a dampened trend within 14 days postirradiation. PG(18:2/18:3) and PS(18:2/22:1) were depressed at 1 and 7 d, but elevated at 14 d, whereas PA(18:0/22:0) showed the opposite trend.
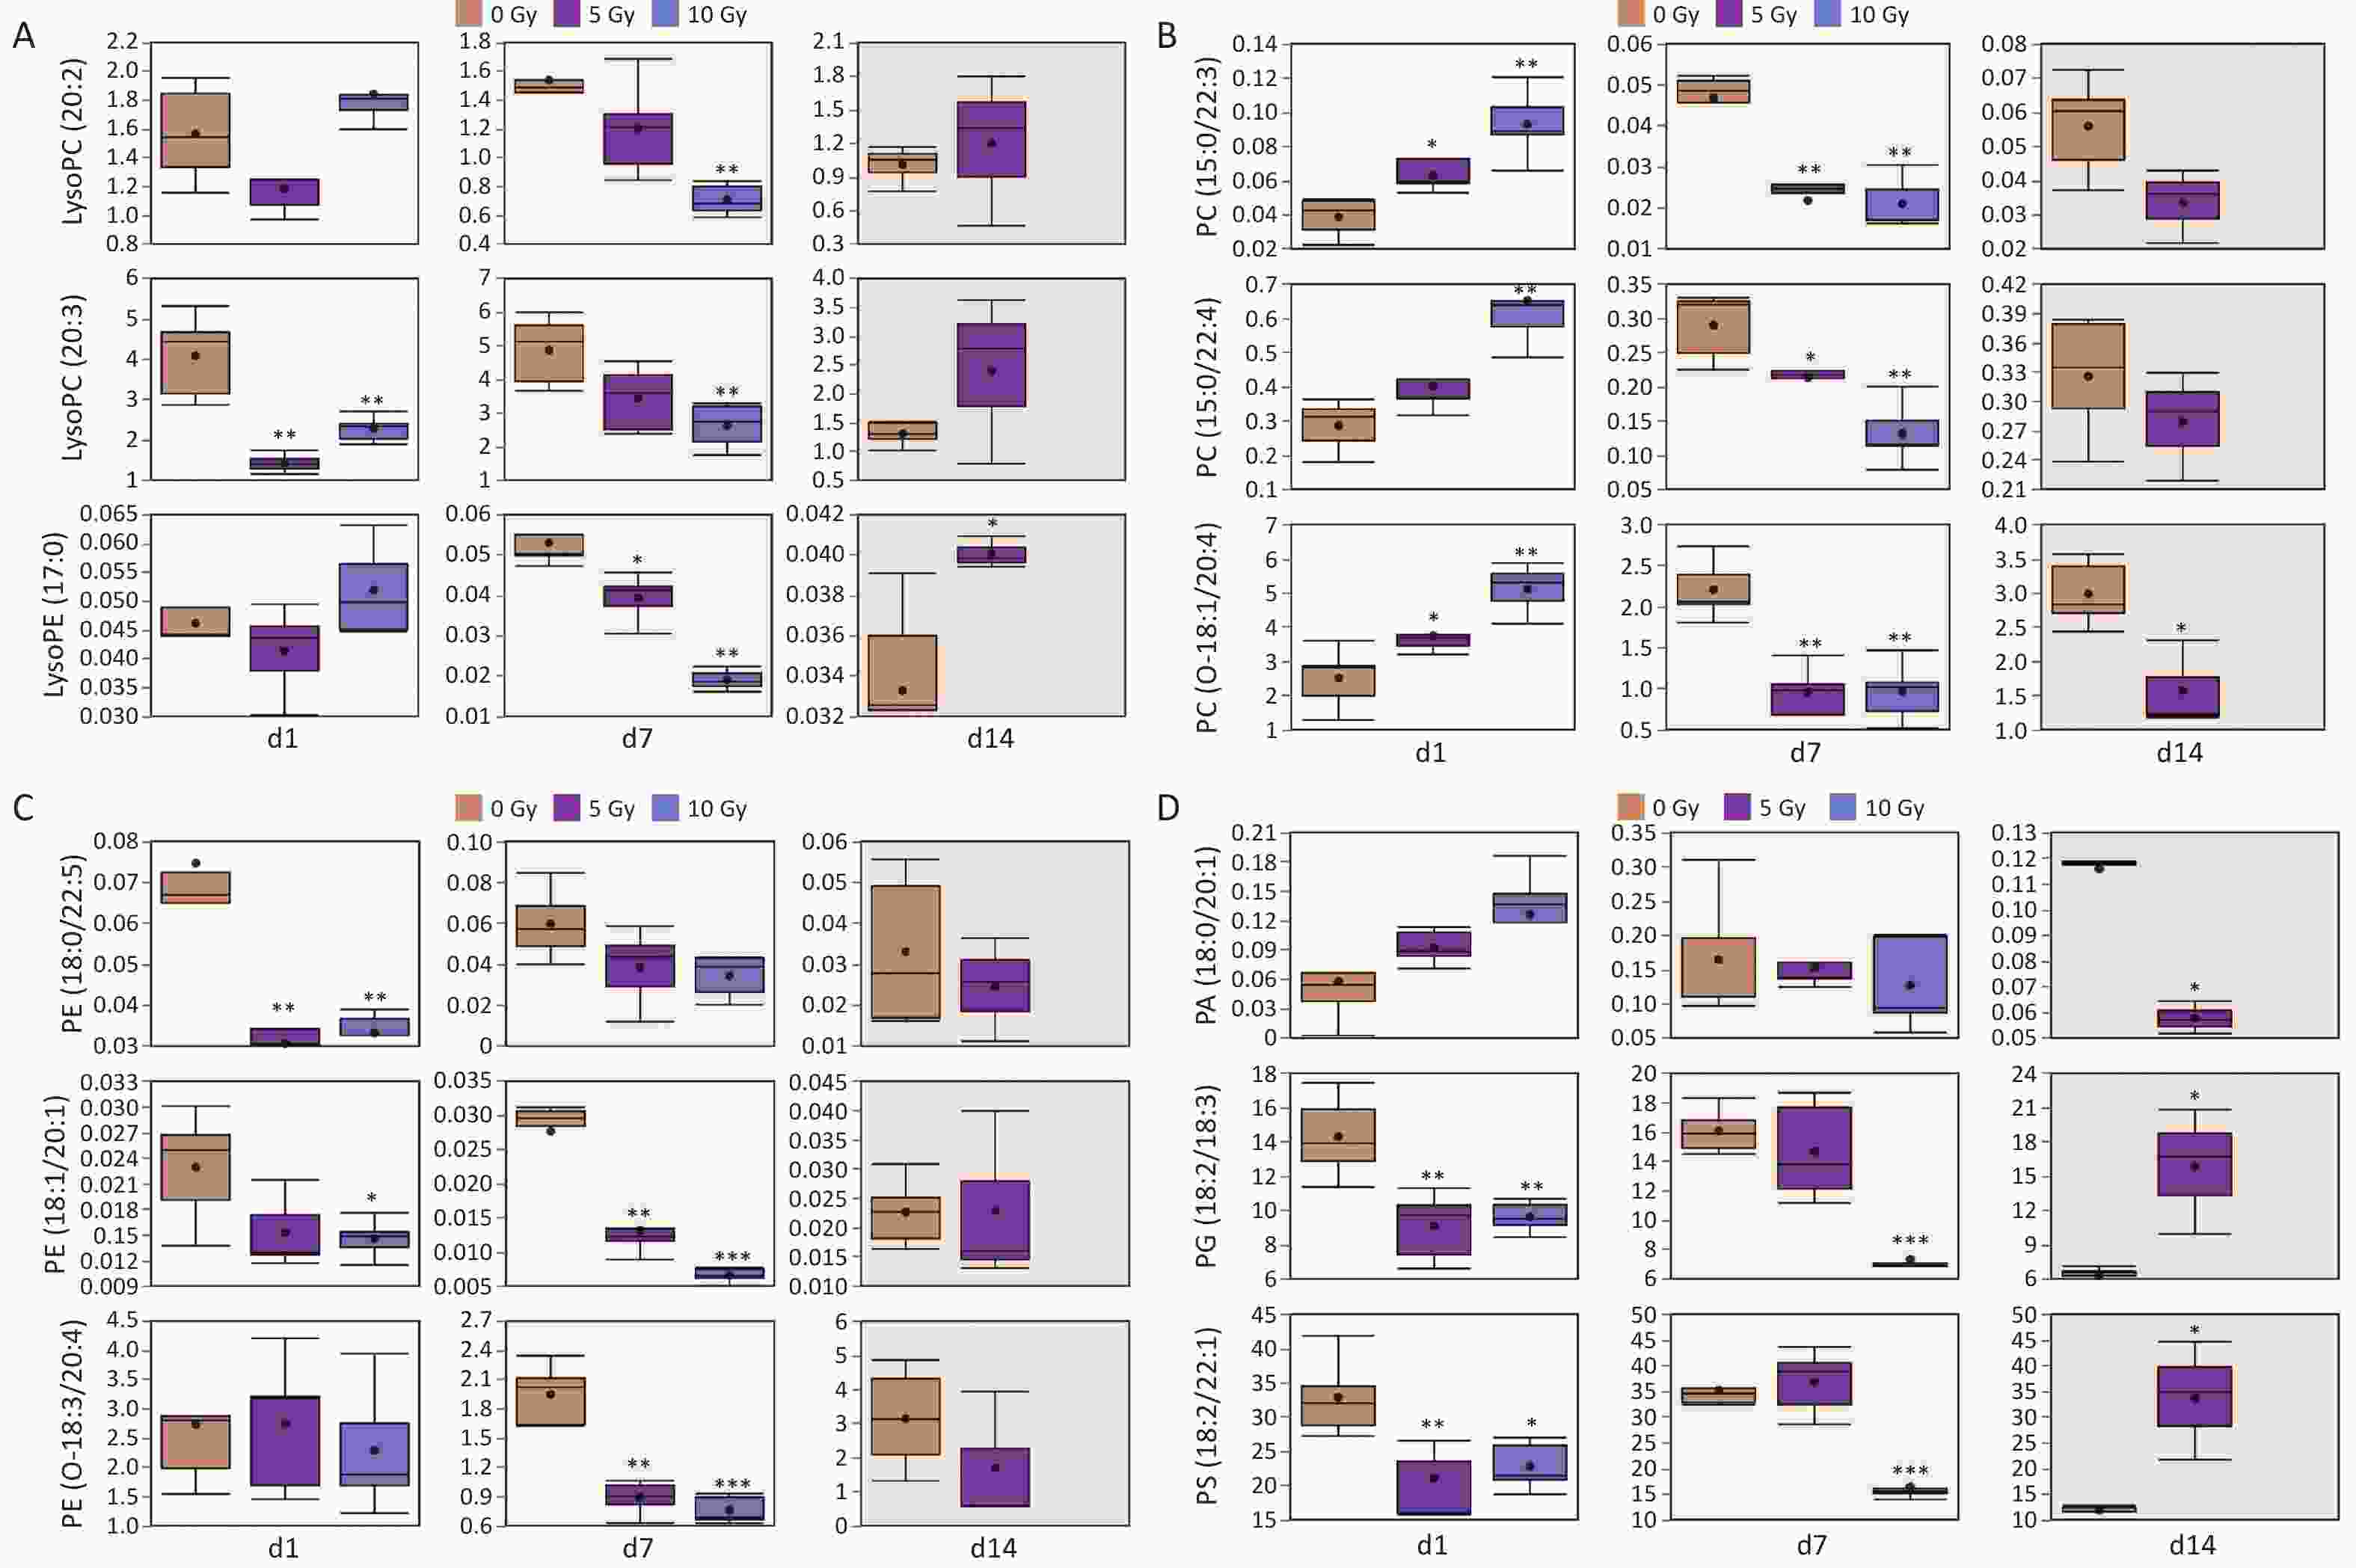
Figure 3. Radiation responses of representative lipids from glycerophospholipid class after exposed to gamma radiation. (A) Lysophospholipids; (B) PC and ether-linked PC; (C) PE and ether-linked PE; (D) PA, PG and PS. In each differential box diagram, the middle point represents the average, the box represents Q3 and Q1 of the data and the horizontal line indicates the median. *P < 0.05, **P < 0.01, ***P < 0.001 (compared with 0 Gy group). PC, phosphatidylcholine; PE, phosphatidylethanolamine; PA, phosphatidic acid; PG, phosphatidylglycerol; PS, phosphatidylserine.
In summary, 11 radiosensitive lipids with good temporal responses were identified as potential biomarkers. Six lipids, LPC(18:2), DG(16:0/18:2), DG(16:0/20:4), DG(18:3/18:0), TG53:3(18:2), and TG56:4(20:1), decreased persistently within 7 days after irradiation. FA(16:1) and FA(22:4) increased, whereas PG(18:2/18:3) decreased consistently within 3 days postirradiation. PC(15:0/18:0) and PC(15:0/22:3) decreased steadily from 3 to 14 d postirradiation. Additionally, some lipids have the potential to determine the delayed effects of acute radiation exposure (DEARE)[8]. Further targeted lipidomic studies with longer durations are important to verify the long-term temporal responses of possible DEARE radiation biomarkers.
To explore plasma lipid biomarkers for biodosimetry in an ML context, triage models were established based on rat plasma after 0, 1, 2, 3, 5, and 8 Gy TBI on day 1, as previously described. Rat plasma samples after 0, 5, and 10 Gy of TBI on day 1 in the present study were used for external validation.
The LASSO model performed well in the radiation classification of the 0 Gy vs.>0 Gy group, with F1 value of 0.93 in the training set, F1 value of 0.82 in the test set and F1 value of 1.00 in the independent verification sets, respectively (AUC values of 0.99, 0.95, and 1.00, respectively). This demonstrates its excellent performance in dealing with complex high-dimensional data. The LASSO model showed significant advantages in each model evaluation index and became a potential dose-response classification model (Supplementary Table S9). For triaging ≤ 2 Gy vs. > 2 Gy, the DT, NN and LASSO model had good performance in internal training and test. Furthermore, the DT and LASSO models maintained good classification efficiency in the external validation, demonstrating their excellent performance in dealing with complex high-dimensional data (Supplementary Table S10). For triaging≤5 Gy vs.>5 Gy, the DT and LASSO model had good results in internal training, test and external verification (Supplementary Table S11). The LASSO model showed good classification efficiency in distinguishing between the 0 Gy vs. > 0 Gy, ≤ 2 Gy vs. >2 Gy and ≤ 5 Gy vs. > 5 Gy groups. The rapid development of ML technology has promoted metabolomic and lipidomics studies[9,10]. The modeling process and model selection in this study may be significant for biodose estimation studies.
Overall, the present study is the first to employ plasma lipid biomarkers for biodosimetry in an ML context, and supports the potential usefulness of the proposed approach for biodosimetry in practical mass-exposure situations for time points soon after an event (e.g., 24 h). The development of an ML-based triage model to estimate the absorbed radiation dose in potentially exposed individuals shortly after radiation exposure would allow rapid classification and treatment decisions before blood samples are sent for more accurate cytogenetic testing. Differential lipids from species of FAs, SMs, glycerolipids, and glycerophospholipids demonstrated different doses and temporal features. In addition, the ML algorithm of LASSO has been proposed as a high-throughput radiation approach to establish an early triage model. Our study suggests that targeted lipidomics coupled with ML facilitates the identification of potential dose-responsive biomarkers with a wide detection window and aids in the development of biodosimetry, which is important for practical applications in emergency response to mass radiation events.
Targeted Lipidomic Signatures of Rat Plasma and Machine Learning-based Triage Models after Total-body Gamma Irradiation
doi: 10.3967/bes2025.157
- Received Date: 2025-04-29
- Accepted Date: 2025-11-10
The authors declare no conflicts of interest.
All animal experiments were performed in accordance with the National Institute of Health Guide for the Care and Use of Laboratory Animals and approved by the Experimental Animal Welfare Committee of National Institute for Radiological Protection. This study did not involve human participants.
| Citation: | Cong Xi, Tianjing Cai, Xue Lu, Xuelei Tian, Yizhe Gao, Qi Chen, Qingjie Liu. Targeted Lipidomic Signatures of Rat Plasma and Machine Learning-based Triage Models after Total-body Gamma Irradiation[J]. Biomedical and Environmental Sciences. doi: 10.3967/bes2025.157

|

 Quick Links
 DownLoad: