-
Aonalcoholic fatty liver disease (NAFLD), a hepatic manifestation of metabolic syndrome[1], is among the most prevalent chronic liver conditions globally. Its pathogenesis is linked to insulin resistance (IR) and disordered lipid metabolism[2,3]. A recent nosological shift redefined NAFLD as a metabolic dysfunction-associated steatotic liver disease (MASLD)[4], underscoring the central role of metabolic dysregulation in its development[5]. IR serves as the core pathological mechanism bridging metabolic abnormalities (MA) with hepatic lipid accumulation, with significant IR being present in the majority of patients with MASLD[6]. Traditional IR assessment methods, notably the hyperinsulinemic-euglycemic clamp (HEC), face limited clinical adoption owing to its operational complexity[7]. Consequently, the development of noninvasive, cost-effective, and reliable surrogate markers is a major focus of contemporary research.
The conventional assessment of IR relies heavily on the homeostasis model assessment of insulin resistance (HOMA-IR). While established as a classic indicator of IR, research has demonstrated a significant positive correlation between HOMA-IR and hepatic fat content in patients[8]. In adolescent populations with obesity, HOMA-IR combined with the triglyceride-glucose (TyG) index supports ultrasound-based NAFLD diagnosis[8]. Although advantageous for direct IR evaluation, the diagnostic utility of HOMA-IR for MASLD is limited by the limited accessibility of standardized insulin assays[8]. In recent years, lipid- and anthropometry-based surrogates such as the TyG index, lipid accumulation product (LAP), and triglyceride to high-density lipoprotein cholesterol ratio (TG/HDL-C) have gained substantial research interest because of their simplicity, low cost, and strong association with metabolic dysfunction[9,10]. The TyG index, which integrates fasting glucose and triglyceride levels, effectively reflects hepatic insulin sensitivity and systemic lipid metabolism. Research has indicated a positive correlation between the TyG index and both the severity of hepatic steatosis/MASLD and the presence of liver fibrosis[11,12], highlighting its significant diagnostic value in predicting MASLD[12]. Among individuals with lean MASLD, the TyG index was positively correlated with disease risk, suggesting its potential as an effective early diagnostic marker[13]. Furthermore, combining TyG with anthropometric indices such as body mass index (BMI) enhances the predictive accuracy of MASLD, as evidenced by the superior performance of TyG-BMI[14]. Studies suggested TyG-derived indices (TyG-BMI, TyG-WC) might predict survival in MASLD populations and serve as surrogate biomarkers for follow-up in patients without advanced fibrosis[15]. Collectively, the TyG index and its derivatives function as practical noninvasive screening tools, offering alternatives to complex investigations. Their ease of acquisition and low cost make TyG-related parameters particularly suitable for large-scale screening and early intervention strategies compared to that with traditional markers.
LAP, calculated from waist circumference and fasting triglyceride levels, reflects visceral adiposity and lipotoxicity. One study suggested that while LAP, visceral adiposity index (VAI), waist circumference-triglyceride index (WTI), TyG, HOMA-IR, and metabolic score for IR (METS-IR) all demonstrate utility in MASLD screening, LAP and HOMA-IR potentially represent optimal choices[9]. LAP exhibits a particularly robust predictive capability for MASLD[16,17], characterized by high specificity. Compared with the TyG index, LAP is a superior biomarker for diagnosing MASLD and hepatic steatosis, demonstrating better diagnostic performance and greater stability, and its efficacy has been confirmed by ultrasound-based diagnosis[17]. This evidence supports LAP as a reliable and effective clinical diagnostic tool, particularly for assessing liver injury severity. Its primary advantages include computational simplicity, low cost, and ease of implementation (requiring only waist circumference and triglyceride data), rendering it suitable for large-scale epidemiological studies and high-risk population monitoring. TG/HDL-C ratio is an indicator of IR, hepatic steatosis, and metabolic syndrome. The TG/HDL-C ratio has been identified as an independent risk factor for MASLD, with higher ratios indicating greater disease risk[18]. A previous study confirmed a positive correlation between TG/HDL-C ratio and NAFLD in healthy cohorts[19]. Importantly, even among Chinese individuals without obesity without dyslipidemia, an independent association exists between the TG/HDL-C ratio and NAFLD, suggesting its utility as a superior predictive marker in this demographic[20].
Critically, the performance of these surrogate markers varies considerably across populations. Multiple studies have suggested that combining indicators (e.g., TyG index with alanine aminotransferase (ALT) or HOMA-IR) improves the diagnostic accuracy for MASLD[21,22]. However, the current absence of standardized cutoff values, alongside the need to validate optimal diagnostic thresholds across diverse ethnicities, sexes, and metabolic states, remains a significant limitation. Therefore, to elucidate the synergistic potential of these markers for MASLD screening and metabolic risk stratification, we evaluated their diagnostic efficacy in patients with MASLD and MA. These findings aim to inform the development of noninvasive, cost-effective, and standardized testing protocols and optimized data-driven marker combinations, thereby enhancing clinical decision-making and facilitating early interventions.
-
A retrospective cohort study was conducted. All patients were treated at Beijing Ditan Hospital between October 2012 and December 2022, including patients with NAFLD with MA (NAFLD-MA group), non-NAFLD patients with MA (Non-NAFLD-MA group), and patients with NAFLD without MA (NAFLD-non MA group) who underwent liver biopsy. Inclusion criteria: All patients with NAFLD were diagnosed by liver biopsy and their ages ranged from to 18–65 years old. The exclusion criteria were as follows: 1) liver diseases caused by alcoholic or autoimmune hepatitis, 2) liver tumors, 3) mental diseases, and 4) liver diseases caused by viral infections such as hepatitis A/B/C/D/E virus, Human Immunodeficiency Virus (HIV), EB virus ( EBV), and cytomegalovirus (CMV). All patients signed an informed consent form upon enrolment in the study. The study protocol was approved ethically (approval no. DTEC-KY2024-013-01) from the Institutional Review Board of Beijing Ditan Hospital, Capital Medical University.
-
Platelet count, liver function (Wako Pure Chemical Industries, Ltd., JAPAN), and blood lipid levels were measured using a fully automated biochemical analyzer (Hitachi Ltd.). The upper limit of the detection value for gamma-glutamyl transferase (GGT) was 60U/L and the upper limit of the detection value for ALT and aspartate transaminase (AST) was 40U/L.
-
The score of HOMA-IR was $\dfrac{[\text{Glycemia (mg/dL)} \times \text{Insulin (mU/L)}] }{ 405} $
The score of LAP was as follows:
For men: (Waist circumference [cm] − 65) × (Triglycerides[mmol/L]);
For women: (Waist circumference [cm] − 58) × (Triglycerides[mmol/L]).
The score of VAI was as follows:
For men:
$$ \begin{split} & \left[\dfrac{Waist\;circumference\left(cm\right)}{\left\{39.68+\left(1.88\times BMI\left(\dfrac{kg}{m^2}\right)\right)\right\}}\right]\times \left[\dfrac{TG\left(\dfrac{mmol}{L}\right)}{1.03}\right]\times \\ & \left[\dfrac{1.31}{HDL\left(\dfrac{mmol}{L}\right)}\right] \end{split} $$ For women:
$$\begin{aligned} & \left[\dfrac{Waistcircumference\left(cm\right)}{\left\{36.58+\left(1.89\times BMI\left(\dfrac{kg}{{m}^{2}}\right)\right)\right\}}\right]\times \left[\dfrac{TG\left(\dfrac{mmol}{L}\right)}{0.81}\right]\times\\ & \left[\dfrac{1.52}{HDL\left(\dfrac{mmol}{L}\right)}\right] \end{aligned} $$ The score of FIB-4 was
$$ \frac{Age\left(year\right)*AST(IU/L)}{Platelets(\times {10}^{9}/L)*\sqrt{ALT(IU/L)}} $$ The score of TyG Index was
$$ \text{ln}\left[\frac{Triglycerides(mg/dL)*Glycaemia(mg/dL)}{2}\right] $$ The score of TG/HDL-C was
$$ \frac{{\text{Triglecerides(mg/dL)}}}{\text{High Density Lipoprotein Cholesterol(mg/dL)}} $$ -
Statistical Package for the Social Sciences (SPSS 26.0; Chicago, IL, USA) was used to analyze all data. All data for the normality test were analyzed using the Kolmogorov–Smirnov method before data analysis. Continuous variables following a normal distribution were summarized as mean ± standard deviation (SD) and analyzed using the independent sample t-test. In contrast, non-normally distributed continuous variables were reported as median with interquartile range (IQR; Q1, Q3) and were compared using the nonparametric Mann–Whitney U test. Categorical variables were expressed as frequencies and percentages, and between-group differences were assessed using Fisher’s exact test or Pearson’s chi-square test. Univariate and multivariate logistic regression analyses were used to analyze risk factors for NAFLD with or without MA. The diagnostic capabilities of these indicators for NAFLD were evaluated using the area under the curve (AUC) of receiver-operating characteristic (ROC) curve. A comparison of the AUCs between the TyG index and BMI was performed using intersection point analysis. A two-sided approach was adopted for all statistical tests, with the significance threshold set at P <0.05.
-
All patients were recruited from the Hepatology Outpatient Clinic of Beijing Ditan Hospital and underwent a liver biopsy. As shown in Figure 1, 680 patients with NAFLD and 122 non-NAFLD patients were initially screened. Among these, 28 NAFLD cases were excluded owing to missing data, resulting in 652 patients with NAFLD being enrolled and categorized into NAFLD-MA group (n =384) and NAFLD-non MA group (n =268). Similarly, 21 non-NAFLD patients were excluded because of incomplete data, and 101 non-NAFLD-MA patients were ultimately included in the data analysis.
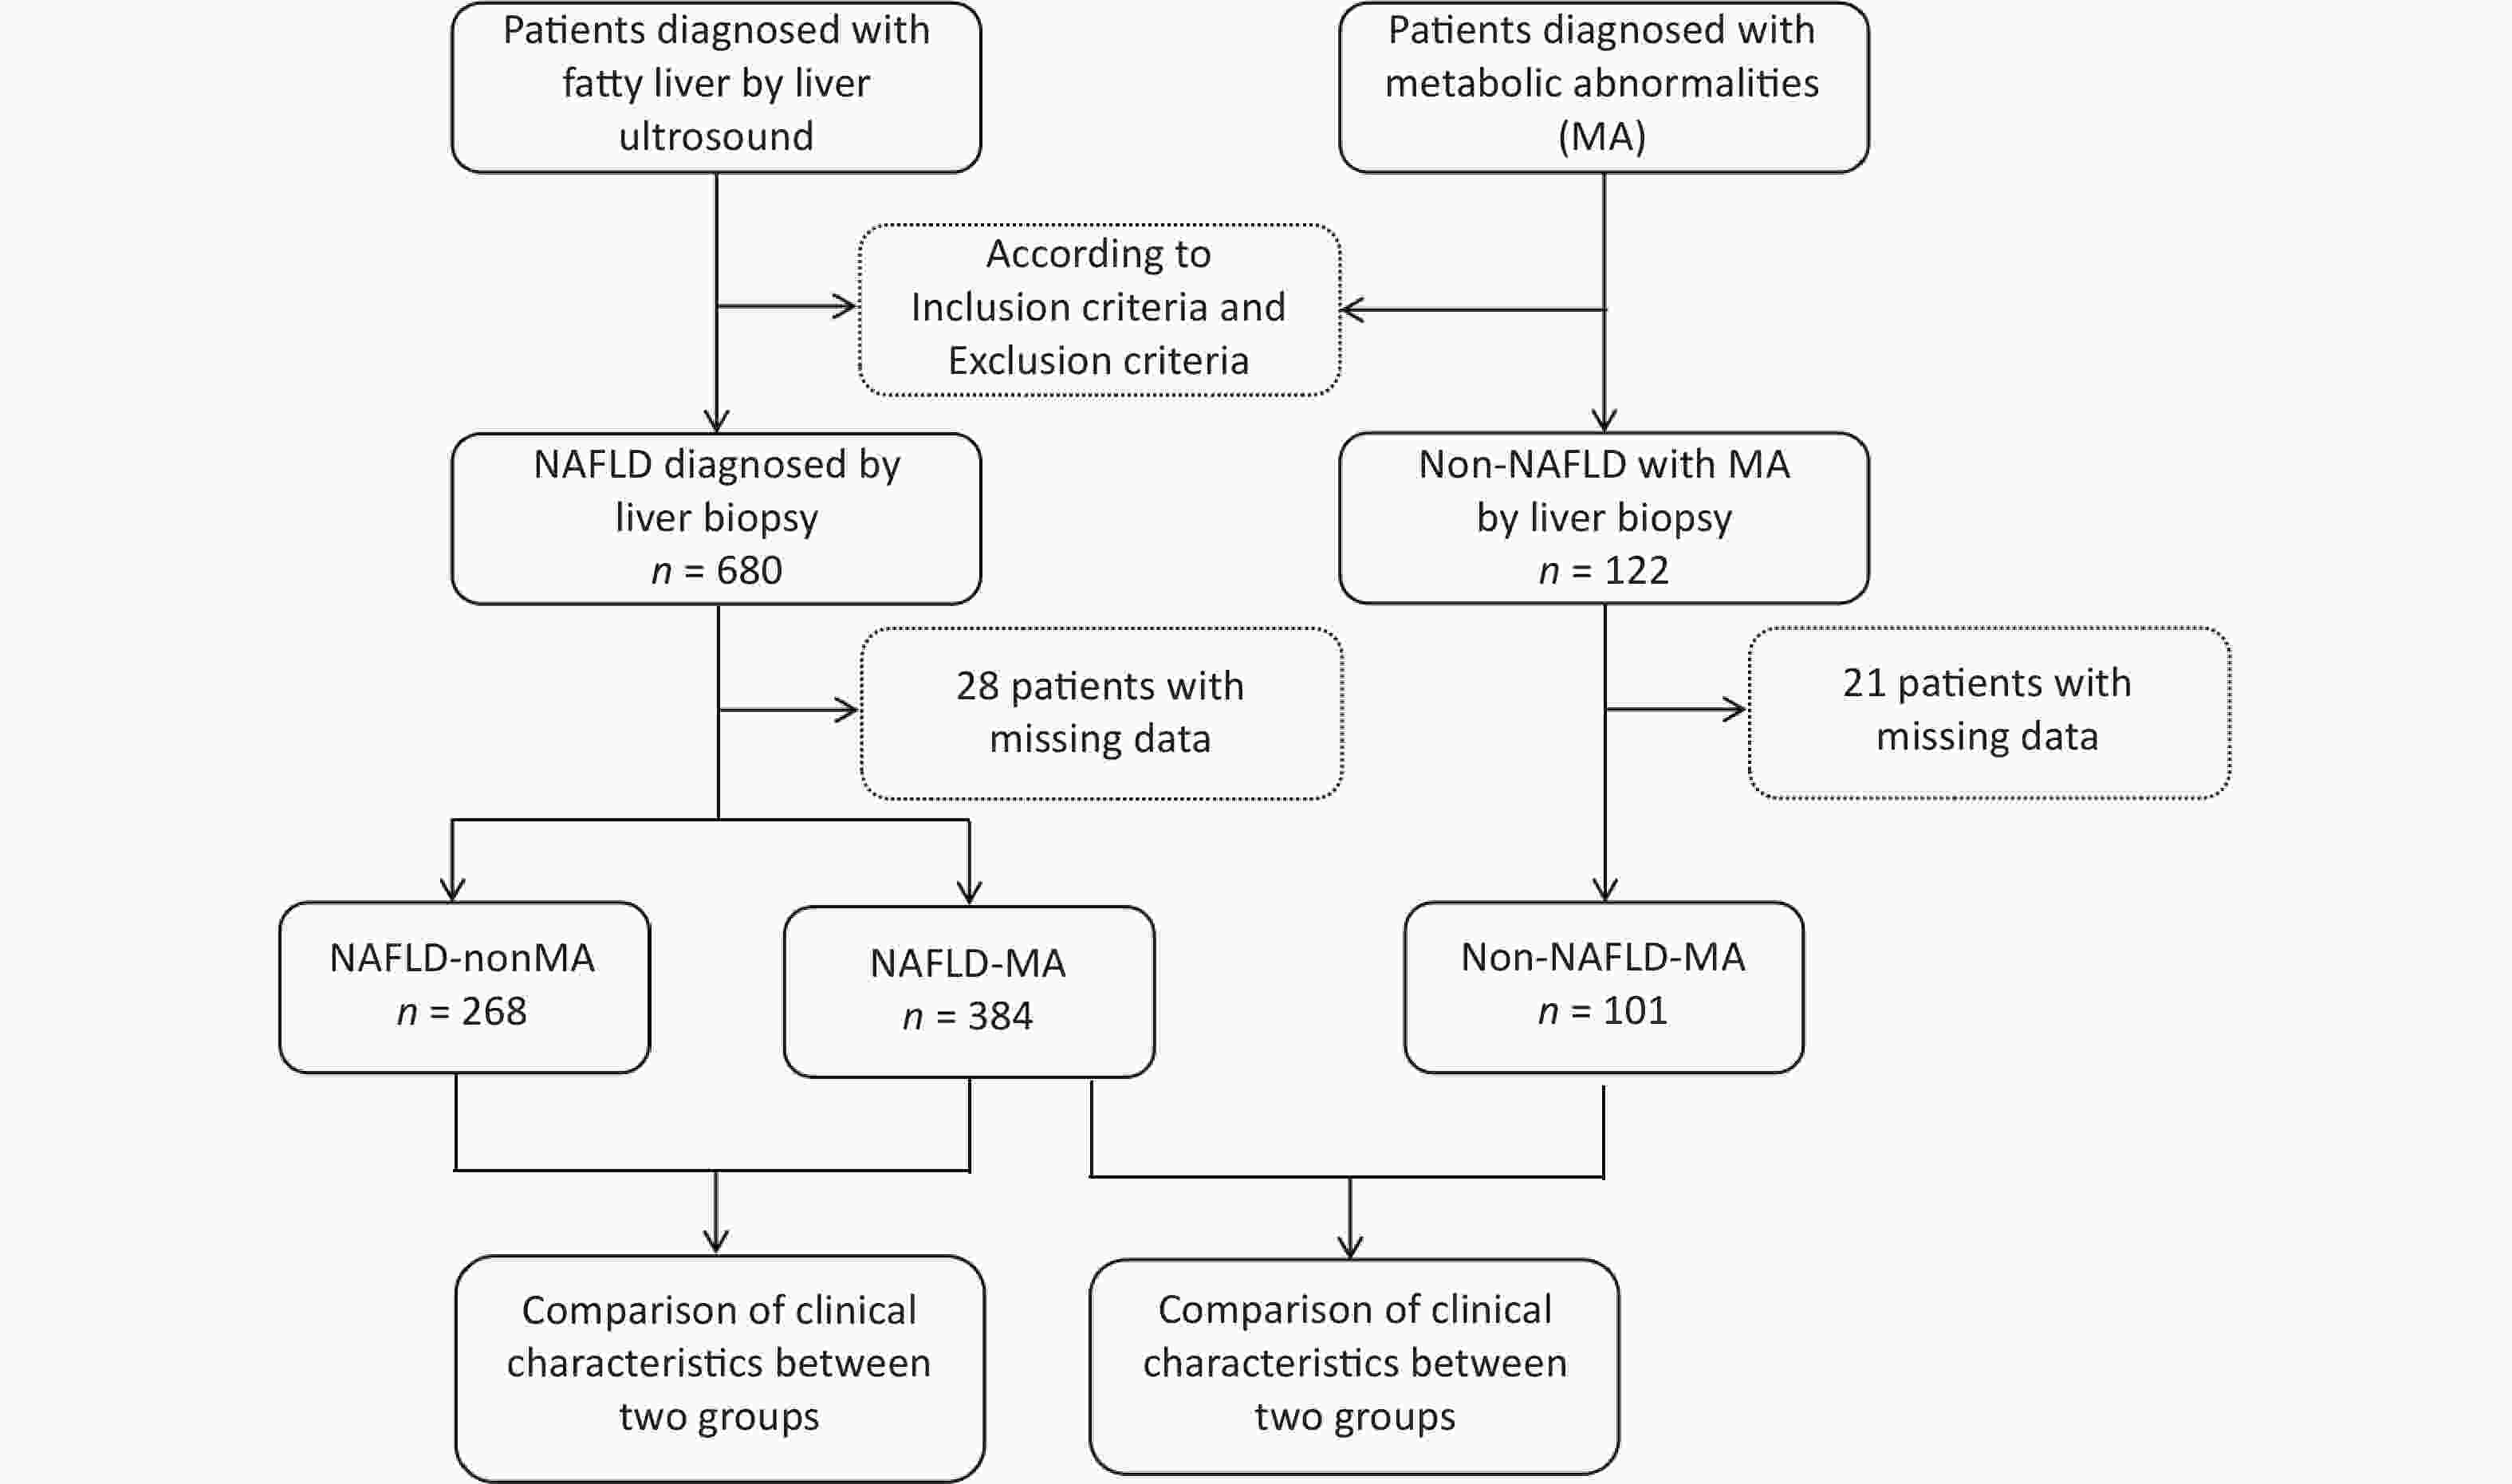
Figure 1. Patient enrollment flowchart. NAFLD, nonalcoholic fatty liver disease; MA, metabolic abnormalities.
The mean age of patients with NAFLD-MA was 43.33 ±12.34 years, which was significantly lower than that of non-NAFLD-MA patients (46.76 ±9.81 years; P =0.010). Compared with that of the non-NAFLD-MA group, the NAFLD-MA group exhibited significantly higher BMI, obesity rate, metabolic syndrome prevalence, glycemia, triglycerides, ALT, AST, GGT, HOMA-IR, LAP, VAI, TyG index, and TG/HDL-C ratio. Conversely, the HDL-C levels were lower in the NAFLD-MA group (Table 1).
Item NAFLD-MA group n =384 Non-NAFLD-MA group n =101 t/χ2 P value Age, mean ± SD (years) 43.33 ±12.34 46.76 ±9.81 –2.591 0.010 Women, n (%) 145 (37.76%) 32 (31.68%) 1.170 0.279 BMI, mean ± SD (kg/m2) 27.65 ±2.66 25.08 ±1.84 9.167 0.000 Obesity (BMI ≥ 30kg/m2 ), n (%) 193 (50.26%) 6 (5.94%) 64.919 0.000 Metabolic Syndrome, n (%) 86.89% 20.79% 178.554 0.000 Waist circumference, Mean ± SD (cm) 72.46 ±5.21 73.05 ±5.01 –1.019 0.308 Glycemia (mg/dL), Mean ± SD 6.85 ±2.25 5.78 ±0.97 4.659 0.000 Triglycerides, median [Q1, Q3] (mg/dL) 1.85 (1.33, 2.67) 1.14 (0.84, 1.63) 7.988 0.000 HDL-C, mean ± SD (mg/dL) 1.03 ±0.26 1.10 ±0.24 2.488 0.013 ALT, median [Q1, Q3] (U/L) 72.00 (41.00, 127.75) 34.50 (22.90, 56.00) 7.182 0.000 AST, median [Q1, Q3] (U/L) 44.00 (29.60, 71.75) 28.60 (21.30, 40.45) 6.222 0.000 GGT, median [Q1, Q3] (U/L) 62.55 (34.13, 108.00) 26.20 (18.25, 41.15) 8.418 0.000 PLT, mean ± SD (x109 /L) 211.01 ±64.63 200.02 ±56.93 1.558 0.120 FIB-4, median [Q1, Q3] 1.07 (0.66, 1.90) 1.20 (0.77, 1.57) 0.792 0.429 HOMA-IR, median [Q1, Q3] 2.50 (1.7, 3.1) 2.10 (1.2, 2.9) –2.620 0.009 LAP, median [Q1, Q3] 18.48 (12.53, 26.68) 11.80 (8.17, 18.04) 6.528 0.000 VAI, median [Q1, Q3] 2.12 (1.44, 3.27) 1.15 (0.85, 2.05) 7.382 0.000 TyG index, median [Q1, Q3] 1.78 (1.47, 2.14) 1.20 (0.75, 1.60) 9.001 0.000 TG/HDL-C, median [Q1, Q3] 1.82 (1.20, 2.76) 1.34 (0.71, 1.62) 7.744 0.000 Note. NAFLD, nonalcoholic fatty liver disease; MA, metabolic abnormality; ALT, Alanine aminotransferase; HDL-C, high-density lipoprotein cholesterol; AST, aspartate aminotransferase; PLT, platelets; TG, triglycerides; GGT, glutamyl transferase; LDL, low-density lipoprotein; HOMA-IR, homeostasis model assessment of insulin resistance; LAP, lipid accumulation product;, TyG, triglyceride glucose; VAI, visceral obesity index; TG/HDL-C triglyceride/high-density lipoprotein cholesterol; SD, standard deviation; BMI, body mass index. Table 1. Comparison of clinical characteristics between patients with and without NAFLD with metabolic abnormalities
-
Univariate logistic regression analysis identified the following risk factors for NAFLD: age, BMI, glycemia, triglycerides, HDL-C, ALT, AST, GGT, LAP, VAI, TyG index, and TG/HDL-C ratio. Multivariate logistic regression further revealed that BMI (odds ratio [OR] =1.720, 95% confidence interval [CI]: 1.634–1.819; P =0.010) and TyG index (OR =1.089, 95% CI: 1.037–1.212; P <0.001) were independent risk factors for NAFLD-MA (Table 2).
Item Univariate logistic regression Multivariate logistic regression OR 95% CI P value OR 95% CI P value Age, Mean ± SD (years) 1.025 1.006–1.045 0.010 1.023 1.005–1.041 0.052 Women, n (%) 0.773 0.484–1.233 0.280 0.780 0.490–1.240 0.300 BMI, mean ± SD (kg/m2) 1.650 01583–1.725 0.000 1.720 1.634–1.819 0.000 Waist circumference, Mean ± SD (cm) 1.023 0.979–1.068 0.308 1.030 0.980–1.072 0.355 Glycemia (mg/dL), Mean ± SD 1.559 1.436–1.716 0.000 1.602 1.447–1.768 0.350 Triglycerides, median [Q1, Q3] (mg/dL) 1.269 1.181–1.399 0.000 1.301 1.190–1.420 0.240 HDL-C, mean ± SD (mg/dL) 0.792 0.230–0.993 0.014 0.799 0.241–0.998 0.065 ALT, median [Q1, Q3] (U/L) 0.984 0.978–0.990 0.000 0.986 0.981–0.996 0.058 AST, median [Q1, Q3] (U/L) 0.984 0.976–0.993 0.000 0.988 0.980–0.999 0.120 GGT, median [Q1, Q3] (U/L) 0.981 0.973–0.988 0.000 0.990 0.981–0.999 0.063 Platelets, mean ± SD (x109 /L) 0.997 0.994–1.001 0.120 0.998 0.996–1.005 0.201 Fib-4, median [Q1, Q3] 0.939 0.811–1.088 0.401 0.942 0.815–1.091 0.510 HOMA-IR, median [Q1, Q3] 1.876 1.638–2.167 0.603 1.881 1.641–2.170 0.621 LAP, median [Q1, Q3] 1.918 1.891–1.947 0.000 1.925 1.895–1.952 0.061 VAI, median [Q1, Q3] 1.524 1.407–1.675 0.000 1.530 1.410–1.682 0.054 TyG index, median [Q1, Q3] 1.107 1.063–1.180 0.000 1.089 1.037–1.212 0.000 TG/HDL-C, median [Q1, Q3] 1.457 1.339–1.616 0.000 1.462 1.340–1.620 0.051 Note. NAFLD, nonalcoholic fatty liver disease; MA, metabolic abnormality; ALT, Alanine aminotransferase; HDL-C, high-density lipoprotein cholesterol; AST, aspartate aminotransferase; PLT, platelets; TG, triglycerides; GGT, glutamyl transferase; LDL, low-density lipoprotein; HOMA-IR, homeostasis model assessment of insulin resistance; LAP, lipid accumulation product;, TyG, triglyceride glucose; VAI, visceral obesity index; TG/HDL-C triglyceride/high-density lipoprotein cholesterol; OR, odds ratio; CI, confidence interval. Table 2. Analysis of risk factors for patients with NAFLD
We estimated age and BMI (obese/overweight and normal-weight groups) for NAFLD incidence using adjusted Poisson regression models. The results showed that after adjusting for age, the risk of NAFLD in individuals who were overweight/had obesity was 1.48 times higher than that in normal-weight individuals (i.e., a 48% increase in risk), showing a statistically significant difference (P <0.001) in supplementary Table 1.
-
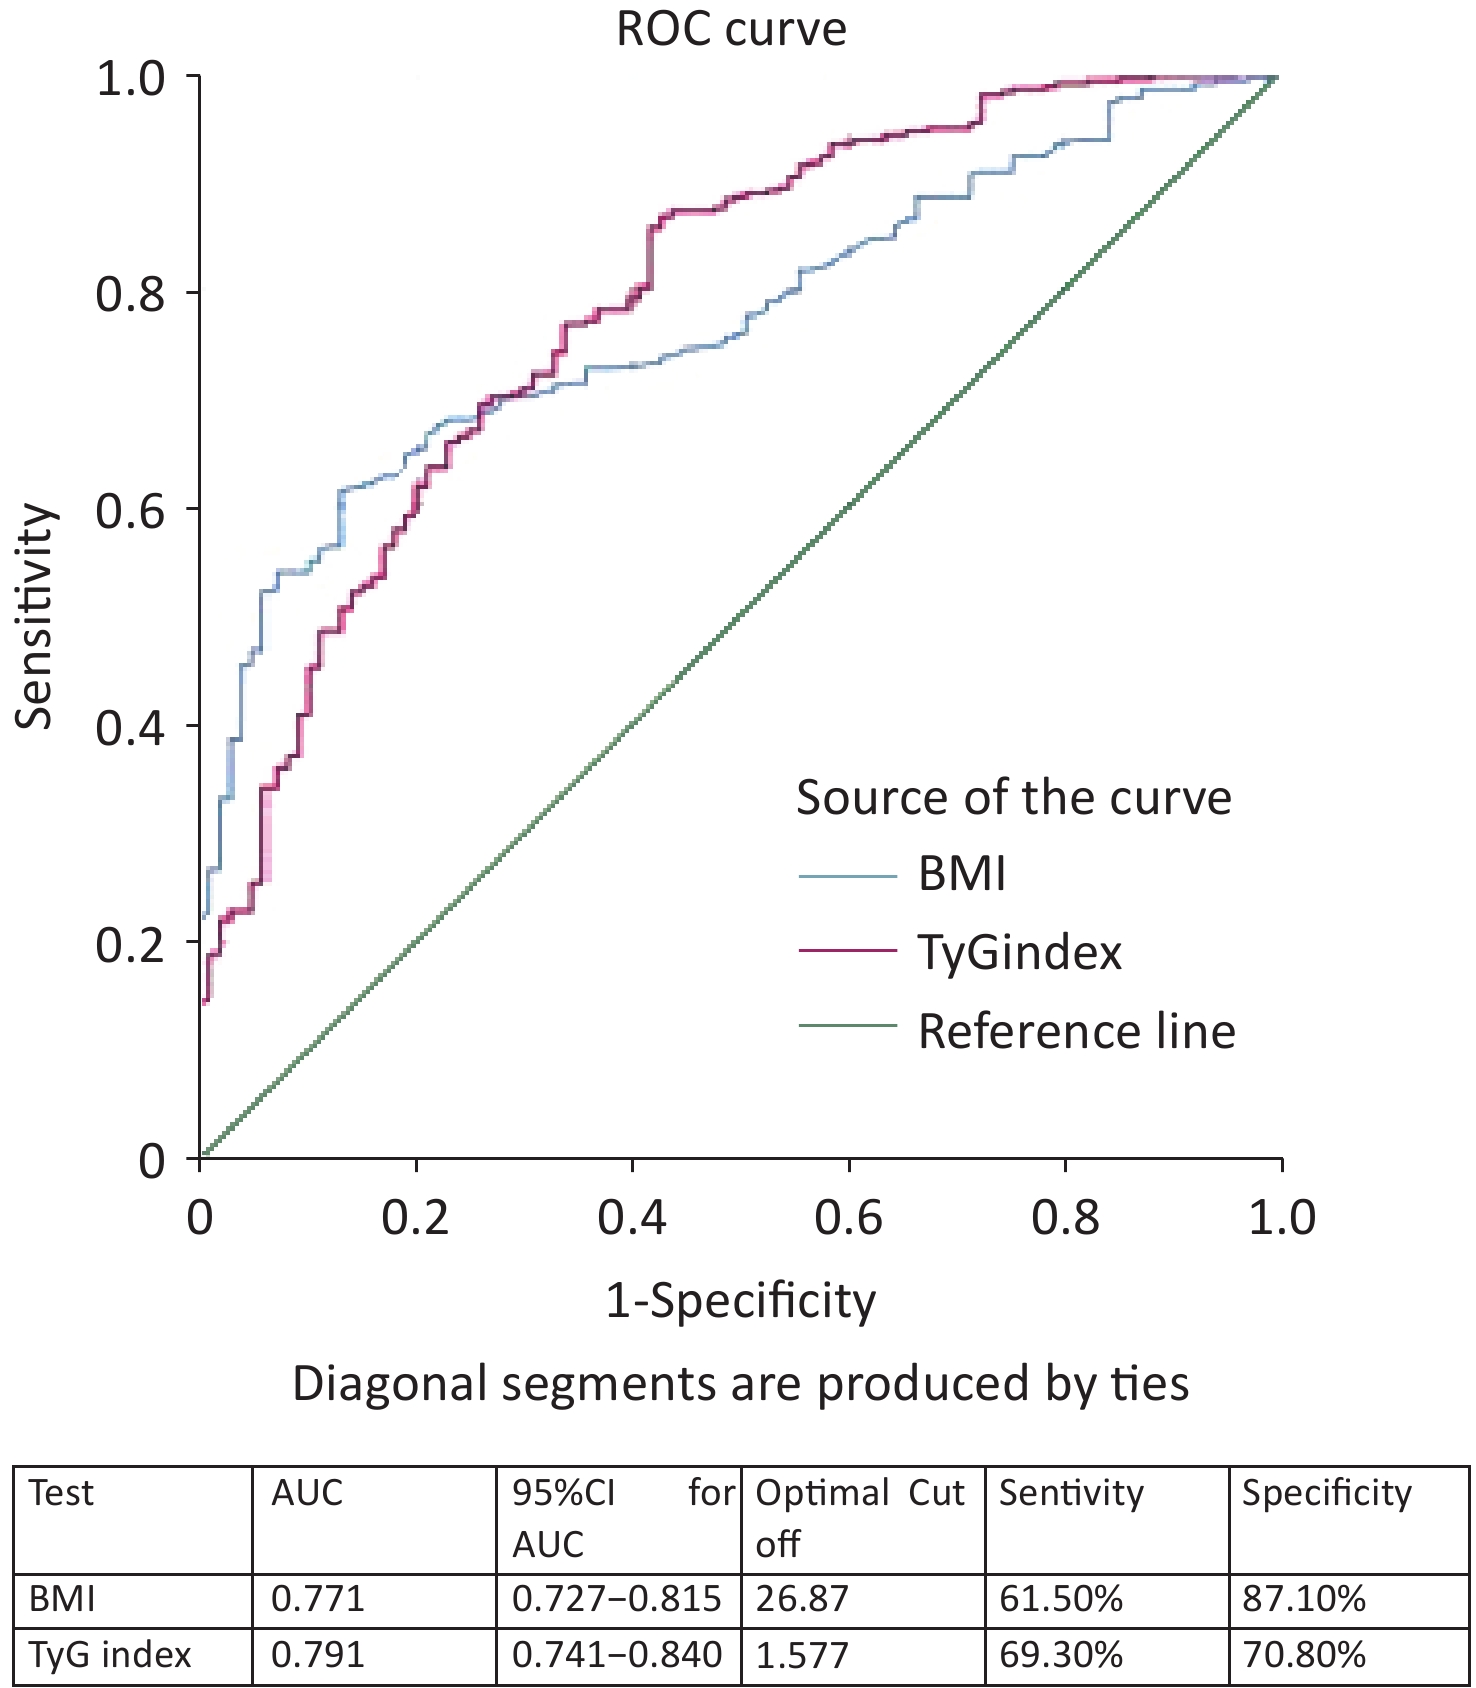
ROC curve analysis results showed that the AUC was calculated for the TyG index as 0.791 (95% CI 0.741–0.840) and BMI as 0.771 (95% CI 0.727–0.815) (Figure 2). When comparing the AUCs, the predictive value of the TyG index was significantly higher than that of the BMI (P =0.045). The optimal cutoff points for NAFLD screening were as follows: BMI 26.87 (sensitivity, 61.50%; specificity, 87.10%) and TyG index, 1.577 (sensitivity, 69.30%; specificity, 70.80%), as shown in Figure 2. Upon comparison of AUCs between the TyG index and BMI with intersection point analysis, the result showed a net reclassification improvement (NRI) =0.18, 95% CI: 0.08-0.28, which suggested that TyG index provided higher net benefits.
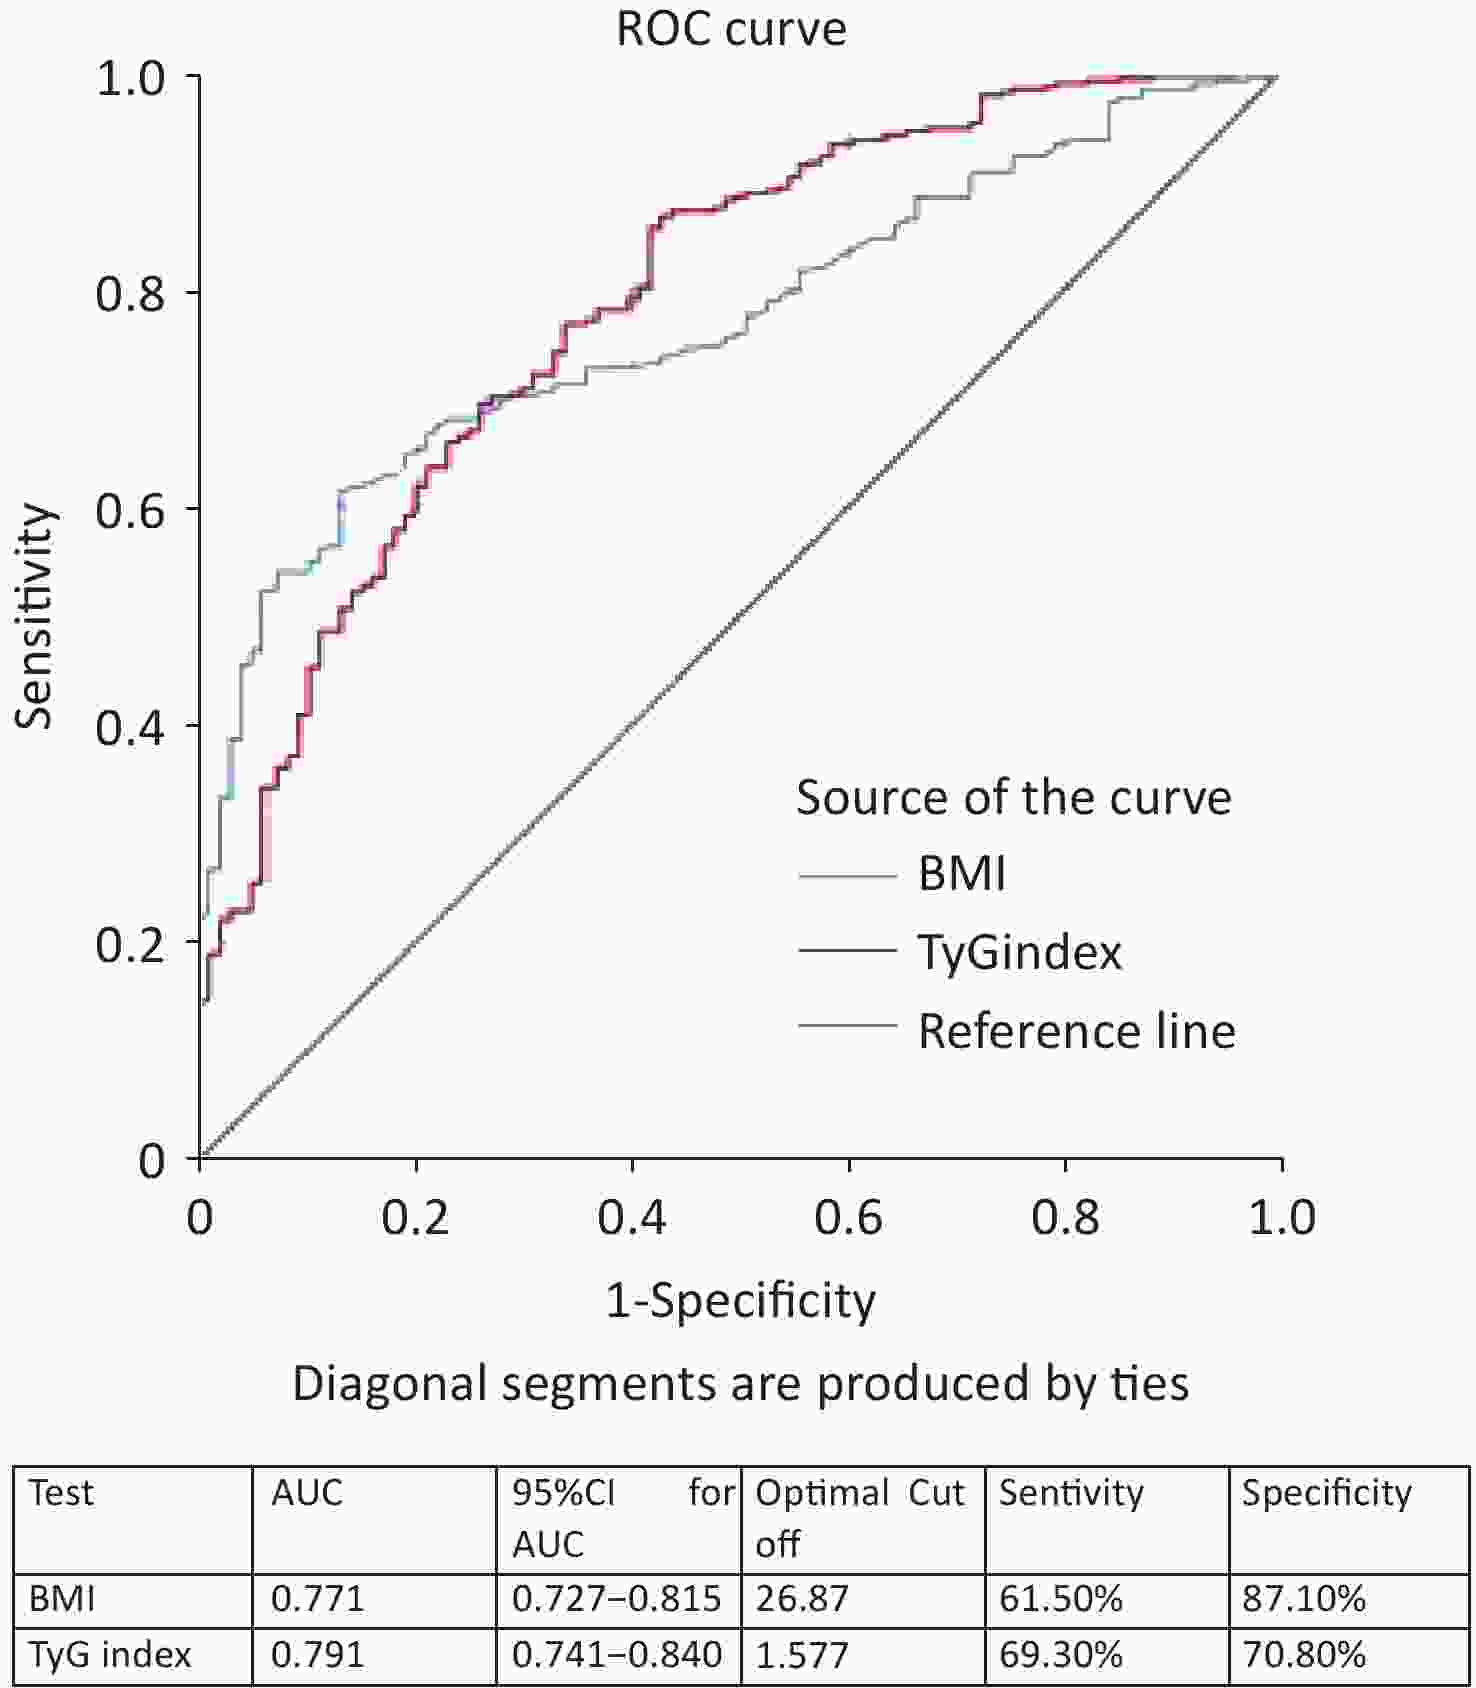
Figure 2. ROC curves of different markers in the screening of NAFLD with metabolic abnormality. ROC, receiver-operating characteristic; AUC, area under the curve; NAFLD, nonalcoholic fatty liver disease.
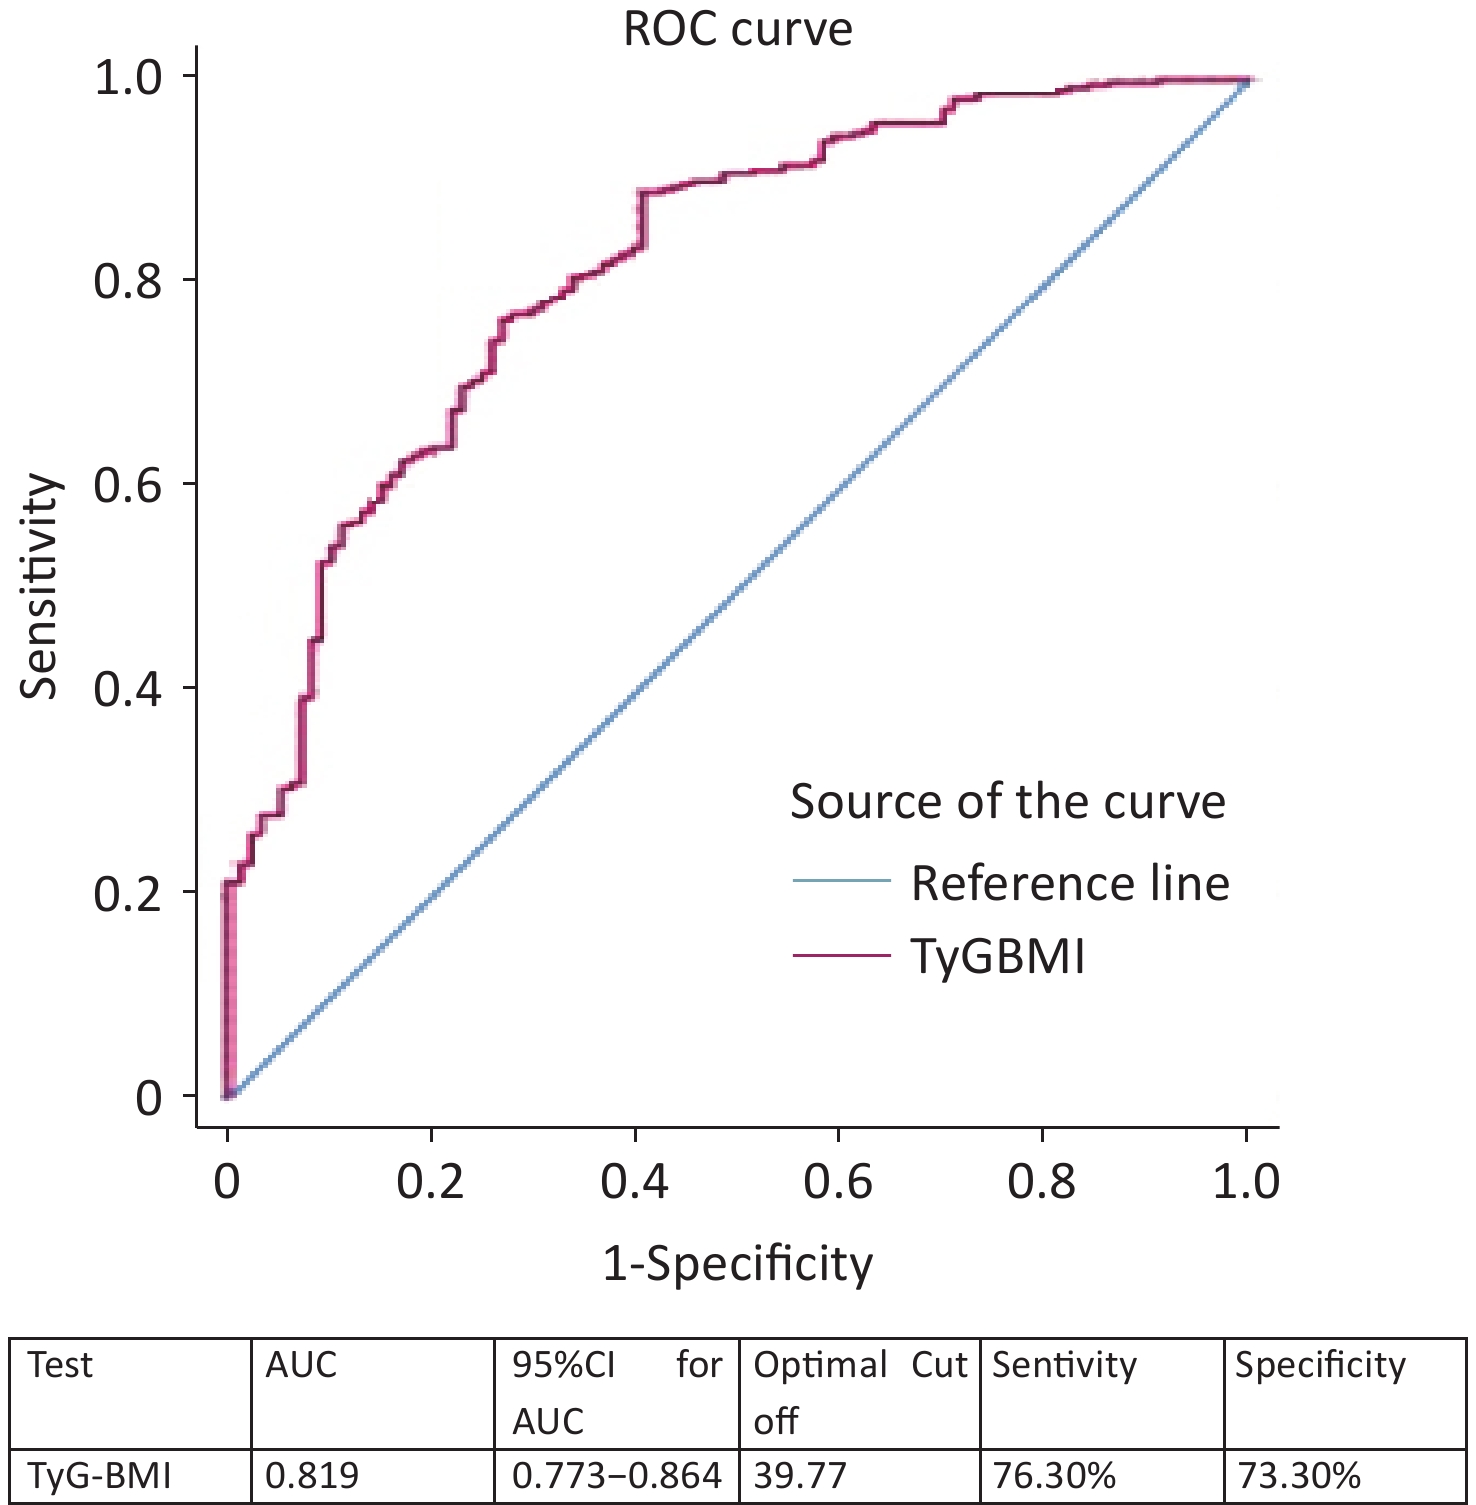
We combined BMI with the TyG index and used TyG-BMI as a marker for screening NAFLD with MA. ROC curve analysis showed that the AUC was 0.819 (95% CI, 0.773–0.864) (Figure 3). The optimal cutoff for NAFLD detection was a TyG-BMI of 39.77 (sensitivity, 76.30%; specificity, 73.30%), as shown in Figure 3.
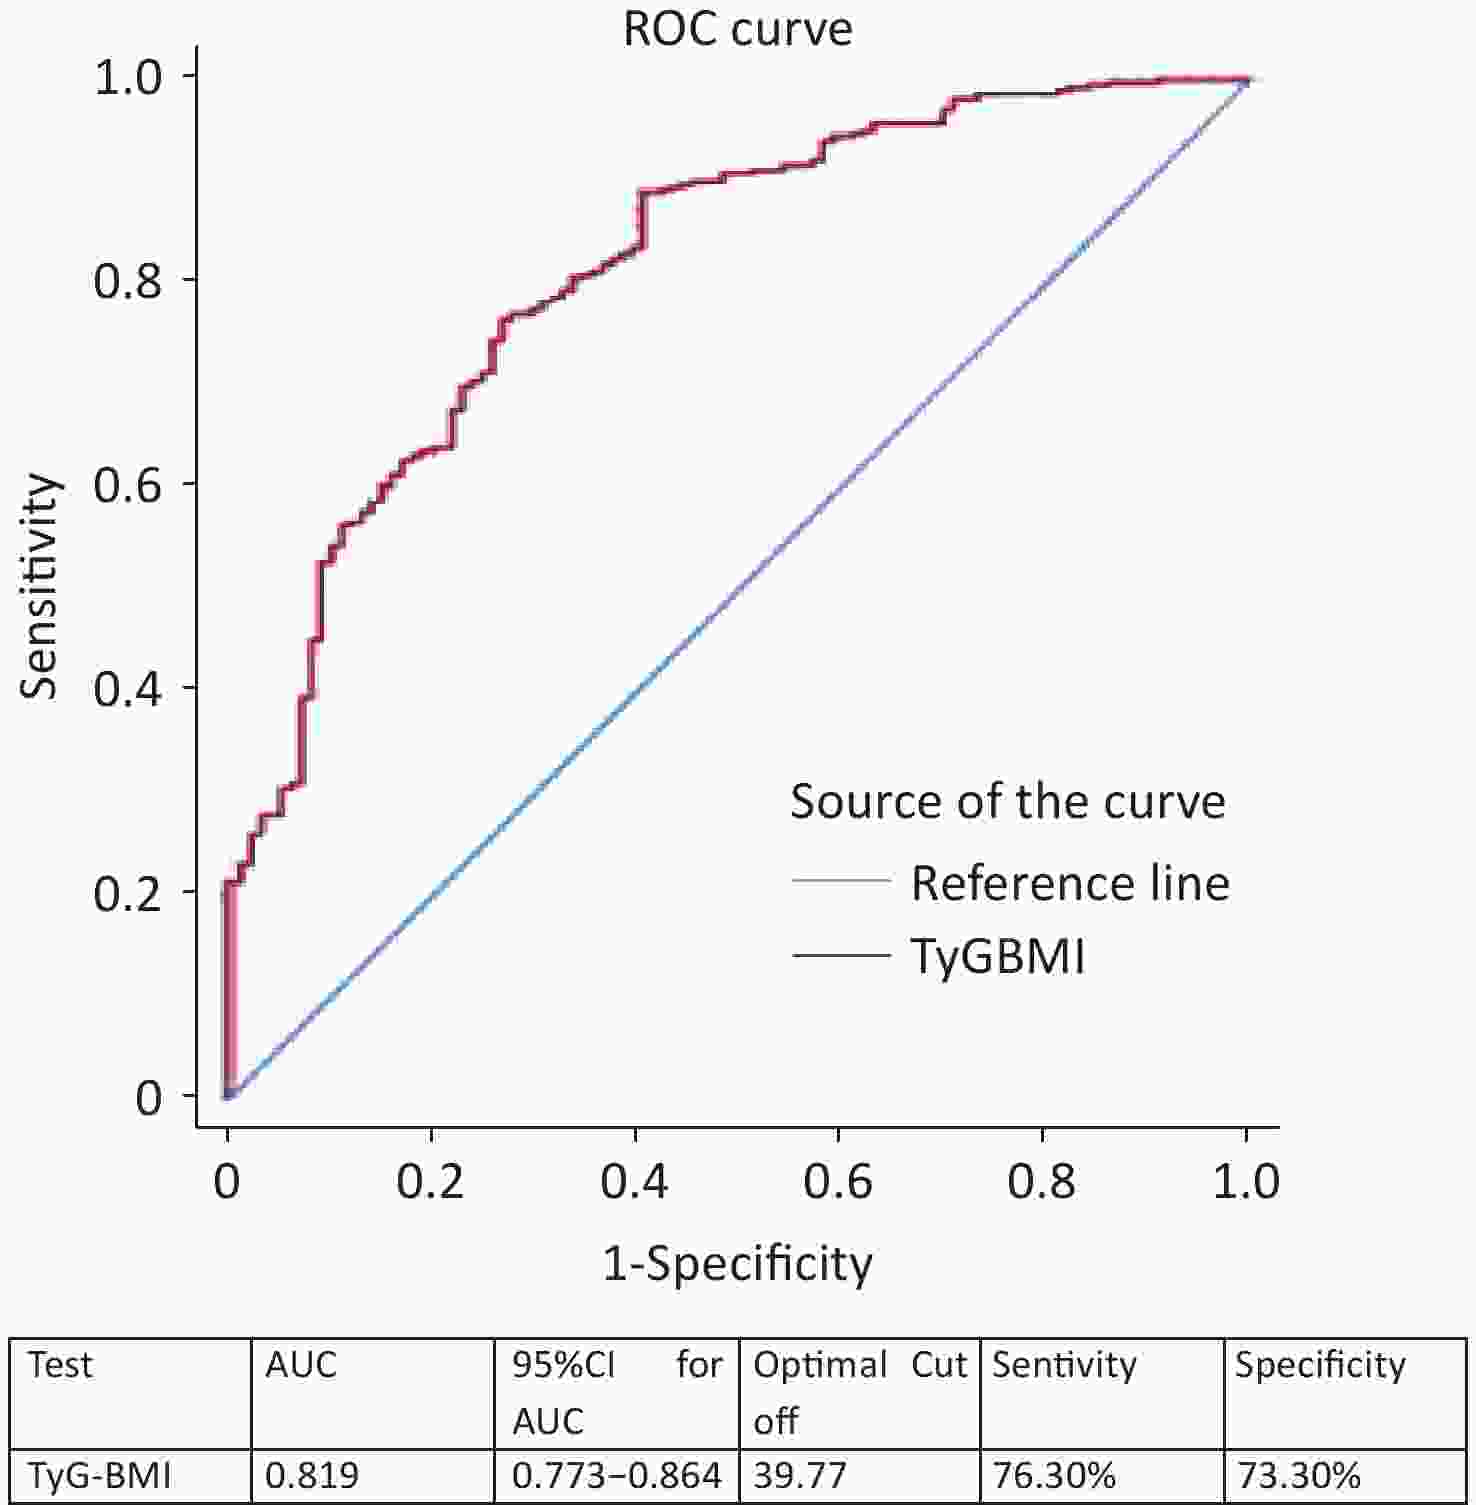
Figure 3. ROC curves of TyG-BMI in the screening of NAFLD. TyG; visceral obesity index; ROC, receiver-operating characteristic; NAFLD, nonalcoholic fatty liver disease.
-
A total of 384 patients with NAFLD with MA and 268 patients with NAFLD without MA were definitively diagnosed using liver biopsy. The mean age of the patients with NAFLD with MA was significantly higher than that of the NAFLD-non MA patients (43.33 ± 12.34 vs. 36.96 ± 12.51, P = 0.000). Triglycerides levels in the NAFLD group with MA was significantly higher than in the NAFLD group without MA (1.85 (1.33, 2.67) vs. 1.42 (1.06, 1.91), P = 0.000). HDL-C level in the NAFLD group with MA was significantly lower than that in the NAFLD group without MA (1.03 ± 0.26 vs. 1.11 ± 0.33, P = 0.000). The FIB-4 index, HOMA-IR, LAP, TyG index, VAI, and TG/HDL-C ratio in patients with NAFLD with MA were significantly higher than those in patients with NAFLD without MA (Table 3).
Item NAFLD-MA n =384 NAFLD-non MA n =268 t/χ2 P Age, mean ±SD (years) 43.33 ±12.34 36.96 ±12.51 6.441 0.000 Women, n (%) 145 (37.76%) 88 (32.84%) 1.667 0.197 BMI, mean ±SD (kg/m2) 27.65 ±2.66 27.22 ±2.81 1.994 0.047 Obesity (BMI ≥ 30kg/m2 ), n (%) 193 (50.26%) 118 (44.03%) 1.679 0.002 Metabolic Syndrome, n (%) 86.89% 0 4.568 0.000 Waist circumference, Mean ±SD (cm) 72.46 ±5.21 72.74 ±5.43 –0.640 0.522 Glycaemia (mg/dL), Mean ±SD 6.85 ±2.25 7.66 ±3.62 –0.438 0.661 Triglycerides, median [Q1, Q3] (mg/dL) 1.85 (1.33, 2.67) 1.42 (1.06, 1.91) 6.233 0.000 HDL-C, mean ± SD (mg/dL) 1.03 ±0.26 1.11 ±0.33 –3.298 0.001 ALT, median [Q1, Q3] (U/L) 72.00 (41.00, 127.75) 75.00 (41.25, 136.50) –0.531 0.596 AST, median [Q1, Q3] (U/L) 44.00 (29.60, 71.75) 40.00 (27.00, 65.75) 1.896 0.058 GGT, median [Q1, Q3] (U/L) 62.55 (34.13, 108.00) 55.00 (30.38, 97.75) 1.692 0.091 Platelets, mean ±SD (x109 /L) 211.01 ±64.63 214.90 ±62.94 –0.765 0.445 FIB-4, median [Q1, Q3] 1.07 (0.66, 1.90) 0.78 (0.51, 1.30) 5.363 0.000 HOMA-IR, median [Q1, Q3] 0.21 (0.12, 0.29) 0.17 (0.09, 0.23) 4.872 0.000 LAP, median [Q1, Q3] 18.48 (12.53, 26.68) 14.35 (9.36, 21.22) 5.239 0.000 VAI, median [Q1, Q3] 2.12 (1.44, 3.27) 1.47 (1.09, 2.30) 6.598 0.000 TyG index, median [Q1, Q3] 1.78 (1.47, 2.14) 1.35 (1.07, 1.65) 9.748 0.000 TG/HDL-C, median [Q1, Q3] 1.82 (1.20, 2.76) 1.37 (0.96, 1.90) 6.197 0.000 Note. NAFLD, nonalcoholic fatty liver disease; MA, metabolic abnormality; ALT, Alanine aminotransferase; HDL-C, high-density lipoprotein cholesterol; AST, aspartate aminotransferase; PLT, platelets; TG, triglycerides; GGT, glutamyl transferase; LDL, low-density lipoprotein; HOMA-IR, homeostasis model assessment of insulin resistance; LAP, lipid accumulation product;, TyG, triglyceride glucose; VAI, visceral obesity index; TG/HDL-C triglyceride/high-density lipoprotein cholesterol; SD, standard deviation; BMI, body mass index. Table 3. Comparison of clinical characteristics between patients with NAFLD with metabolic abnormalities and NAFLD without metabolic abnormalities
-
Univariate logistic regression analysis revealed that age, BMI, triglycerides, HDL-C, FIB-4, LAP, VAI, TyG index, and TG/HDL-C ratio were risk factors for NAFLD. However, multivariate logistic regression analysis indicated that age, triglyceride level, and TyG index were independent risk factors for NAFLD with MA (Table 4).
Item Univariate logistic regression Multivariate logistic regression OR 95% CI P value OR 95% CI P value Age, mean±SD (years) 1.960 1.948–1.973 0.000 1.952 1.935–1.970 0.000 Women, n (%) 1.227 0.884–1.704 0.221 1.231 0.889–1.716 0.310 BMI, mean ±SD (kg/m2) 1.943 1.891–1.999 0.047 1.945 1.893–1.999 0.057 Waist circumference, Mean ±SD (cm) 1.010 0.980–1.040 0.522 1.012 0.982–1.047 0.700 Glycaemia (mg/dL), Mean ±SD 1.001 0.995–1.008 0.671 1.002 0.996–1.010 0.720 Triglycerides, median [Q1, Q3] (mg/dL) 1.778 1.677–1.894 0.000 1.759 1.142–2.708 0.010 HDL-C, mean ±SD (mg/dL) 0.530 0.428–0.984 0.001 0.547 0.430–0.988 0.061 ALT, median [Q1, Q3] (U/L) 0.999 0.998–1.001 0.351 0.998 0.996–1.001 0.400 AST, median [Q1, Q3] (U/L) 0.996 0.993–0.999 0.110 0.997 0.995–1.001 0.130 GGT, median [Q1, Q3] (U/L) 0.999 0.998–1.000 0.144 1.001 1.000–1.018 0.230 Platelets, mean ±SD (x109 /L) 1.001 0.999–1.003 0.444 1.015 1.000–1.004 0.480 FIB-4, median [Q1, Q3] 1.723 1.618–1.846 0.000 1.728 1.628–1.849 0.201 HOMA-IR, median [Q1, Q3] 1.009 0.875–1.164 0.900 1.012 0.882–1.172 0.930 LAP, median [Q1, Q3] 1.983 1.971–1.994 0.003 1.985 1.982–1.998 0.067 VAI, median [Q1, Q3] 1.905 1.839–1.975 0.009 1.920 1.842–1.985 0.340 TyG index, median [Q1, Q3] 1.250 1.178–1.350 0.000 1.088 1.046–1.167 0.000 TG/HDL-C, median [Q1, Q3] 1.877 1.801–1.961 0.005 1.880 1.810–1.978 0.058 Note. NAFLD, nonalcoholic fatty liver disease; MA, metabolic abnormality; ALT, Alanine aminotransferase; HDL-C, high-density lipoprotein cholesterol; AST, aspartate aminotransferase; PLT, platelets; TG, triglycerides; GGT, glutamyl transferase; LDL, low-density lipoprotein; HOMA-IR, homeostasis model assessment of insulin resistance; LAP, lipid accumulation product;, TyG, triglyceride glucose; VAI, visceral obesity index; TG/HDL-C triglyceride/high-density lipoprotein cholesterol; SD, standard deviation; BMI, body mass index; OR, odds ratio; CI, confidence interval. Table 4. Analysis of risk factors for Patients with NAFLD whether with abnormal metabolism
-
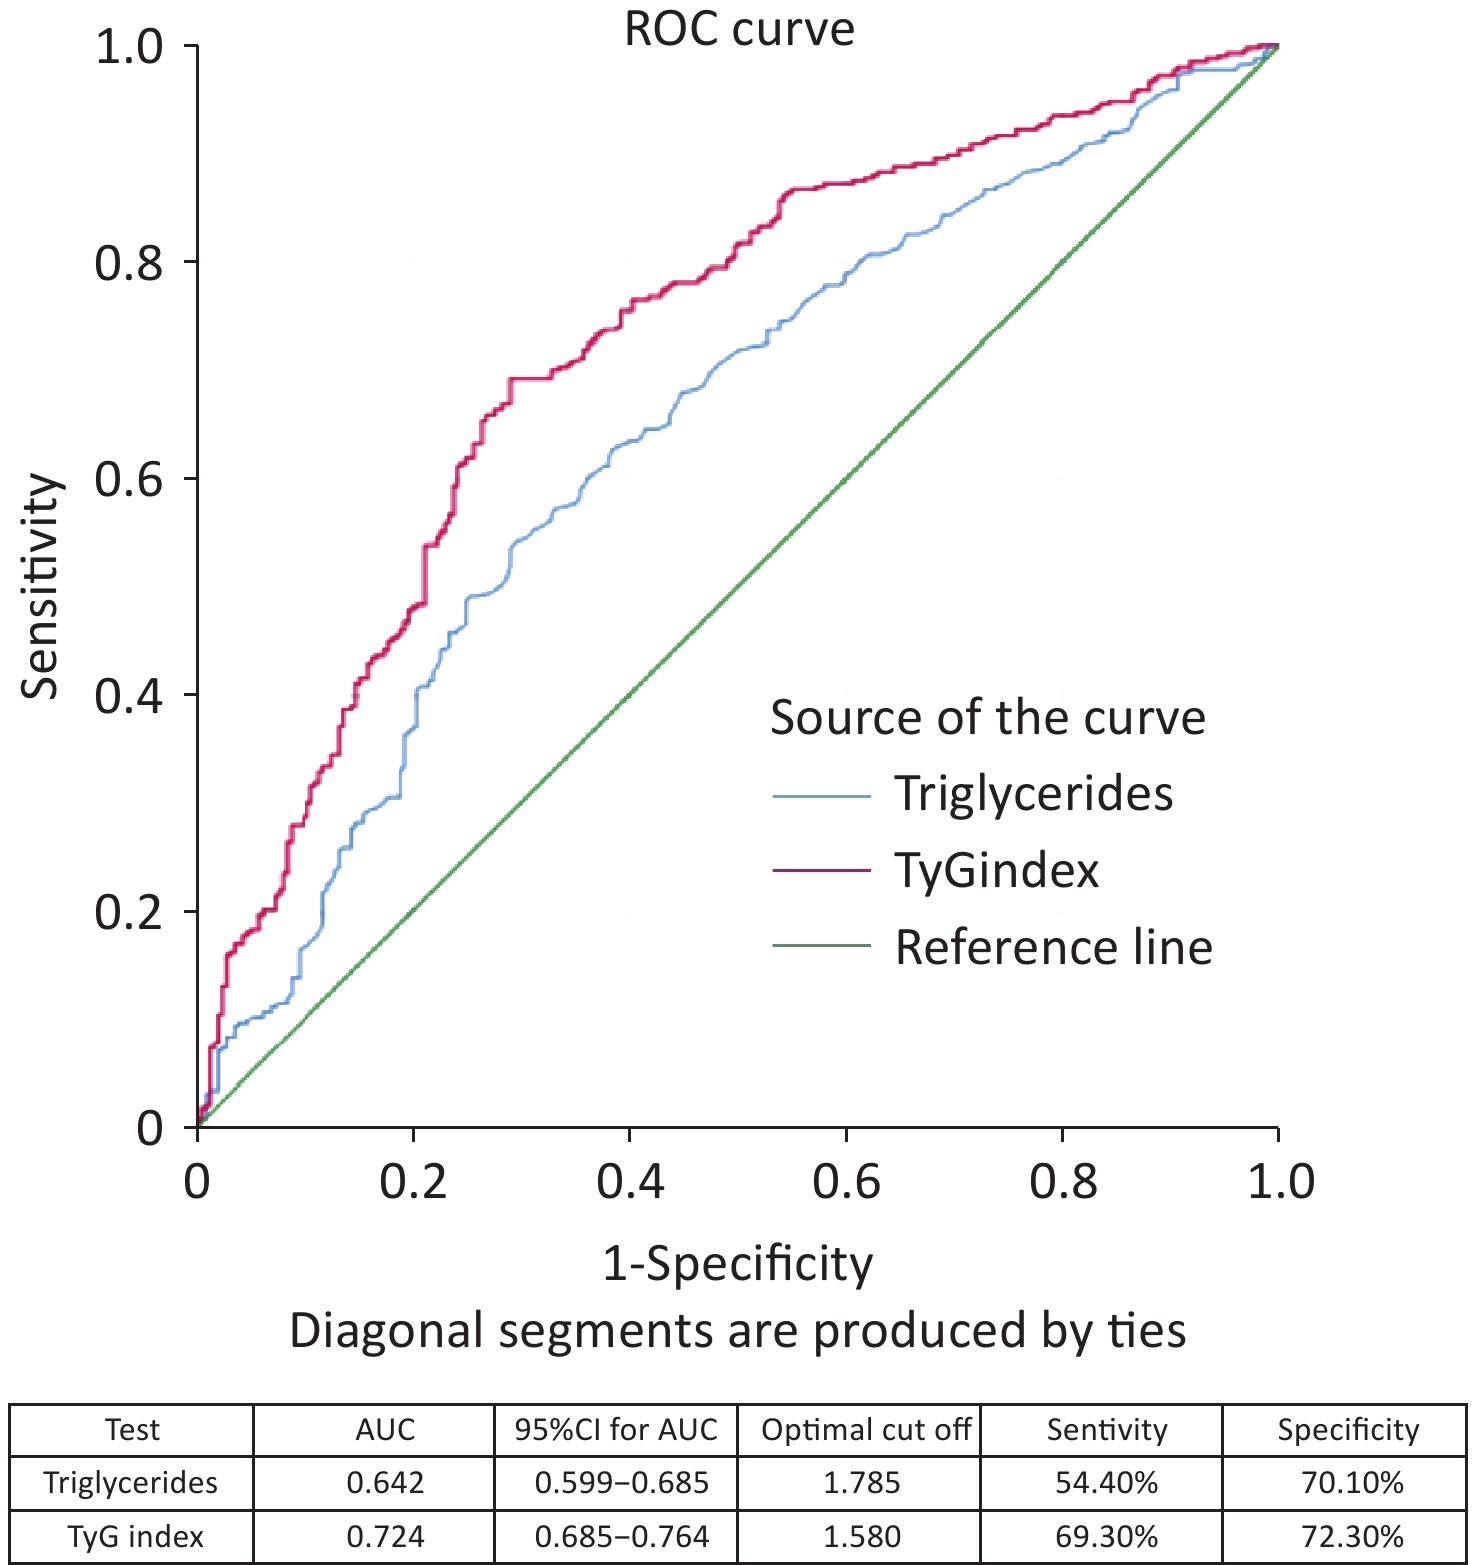
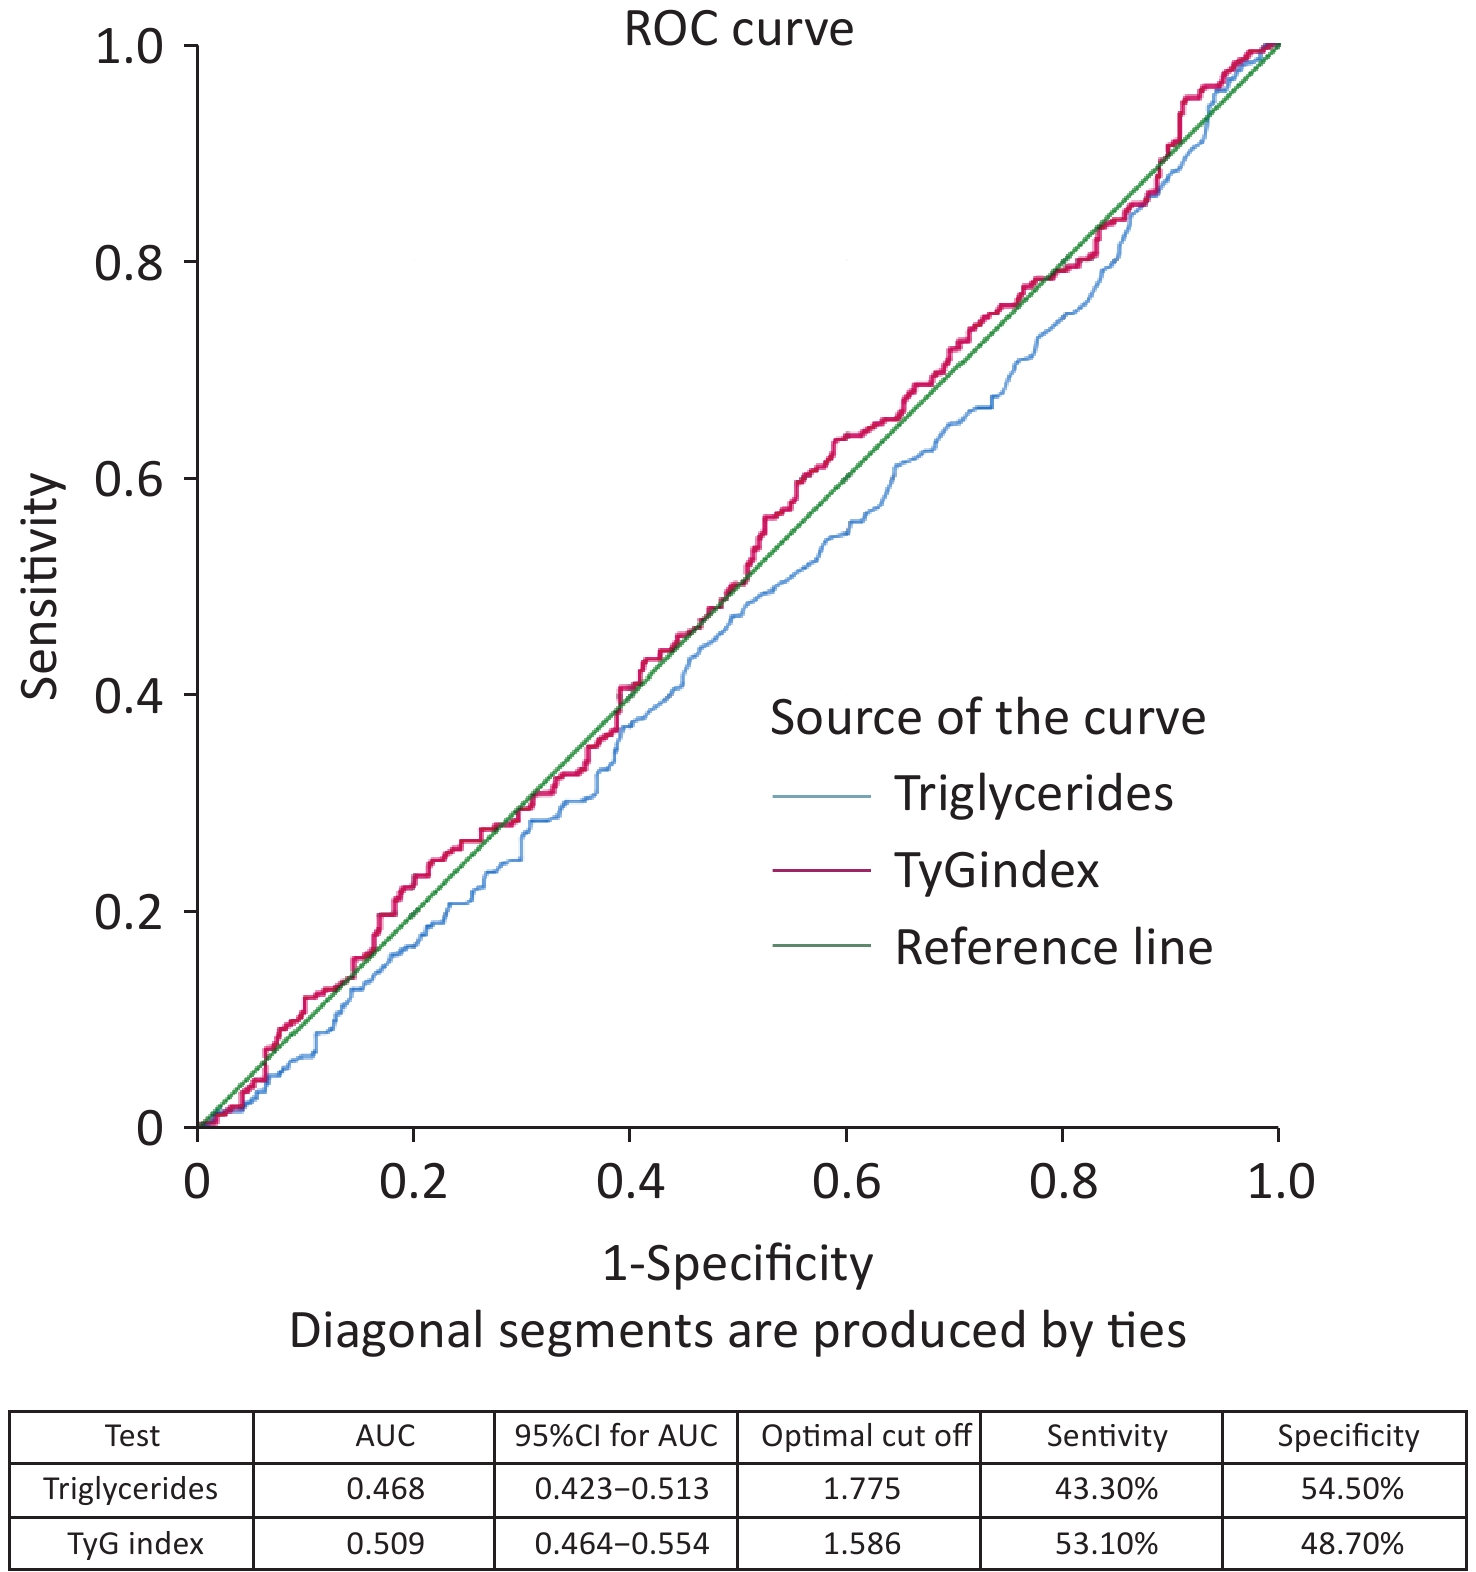
The ROC curve analysis results showed that the AUC was 0.644 (95% CI 0.601–0.687) for age, 0.642 (95% CI 0.599–0.685) for triglycerides, and 0.724 (95% CI 0.685–0.764) for TyG index (Figure 3). When comparing the AUCs, the predictive value of the TyG index was significantly higher than that of age and triglyceride levels (P = 0.000). The optimal cutoff points for NAFLD screening were as follows: age 39.50 (sensitivity, 60.90%; specificity, 61.60%); triglycerides, 1.785 (sensitivity, 54.40%; specificity, 70.10%); and TyG index, 1.580 (sensitivity, 69.30%; specificity, 72.30%), as shown in Figure 4. The results of the age group showed that the AUCs of the TyG index and triglycerides were low; therefore, we did not find significant differences in the indicators among the age subgroups (Figure 5).
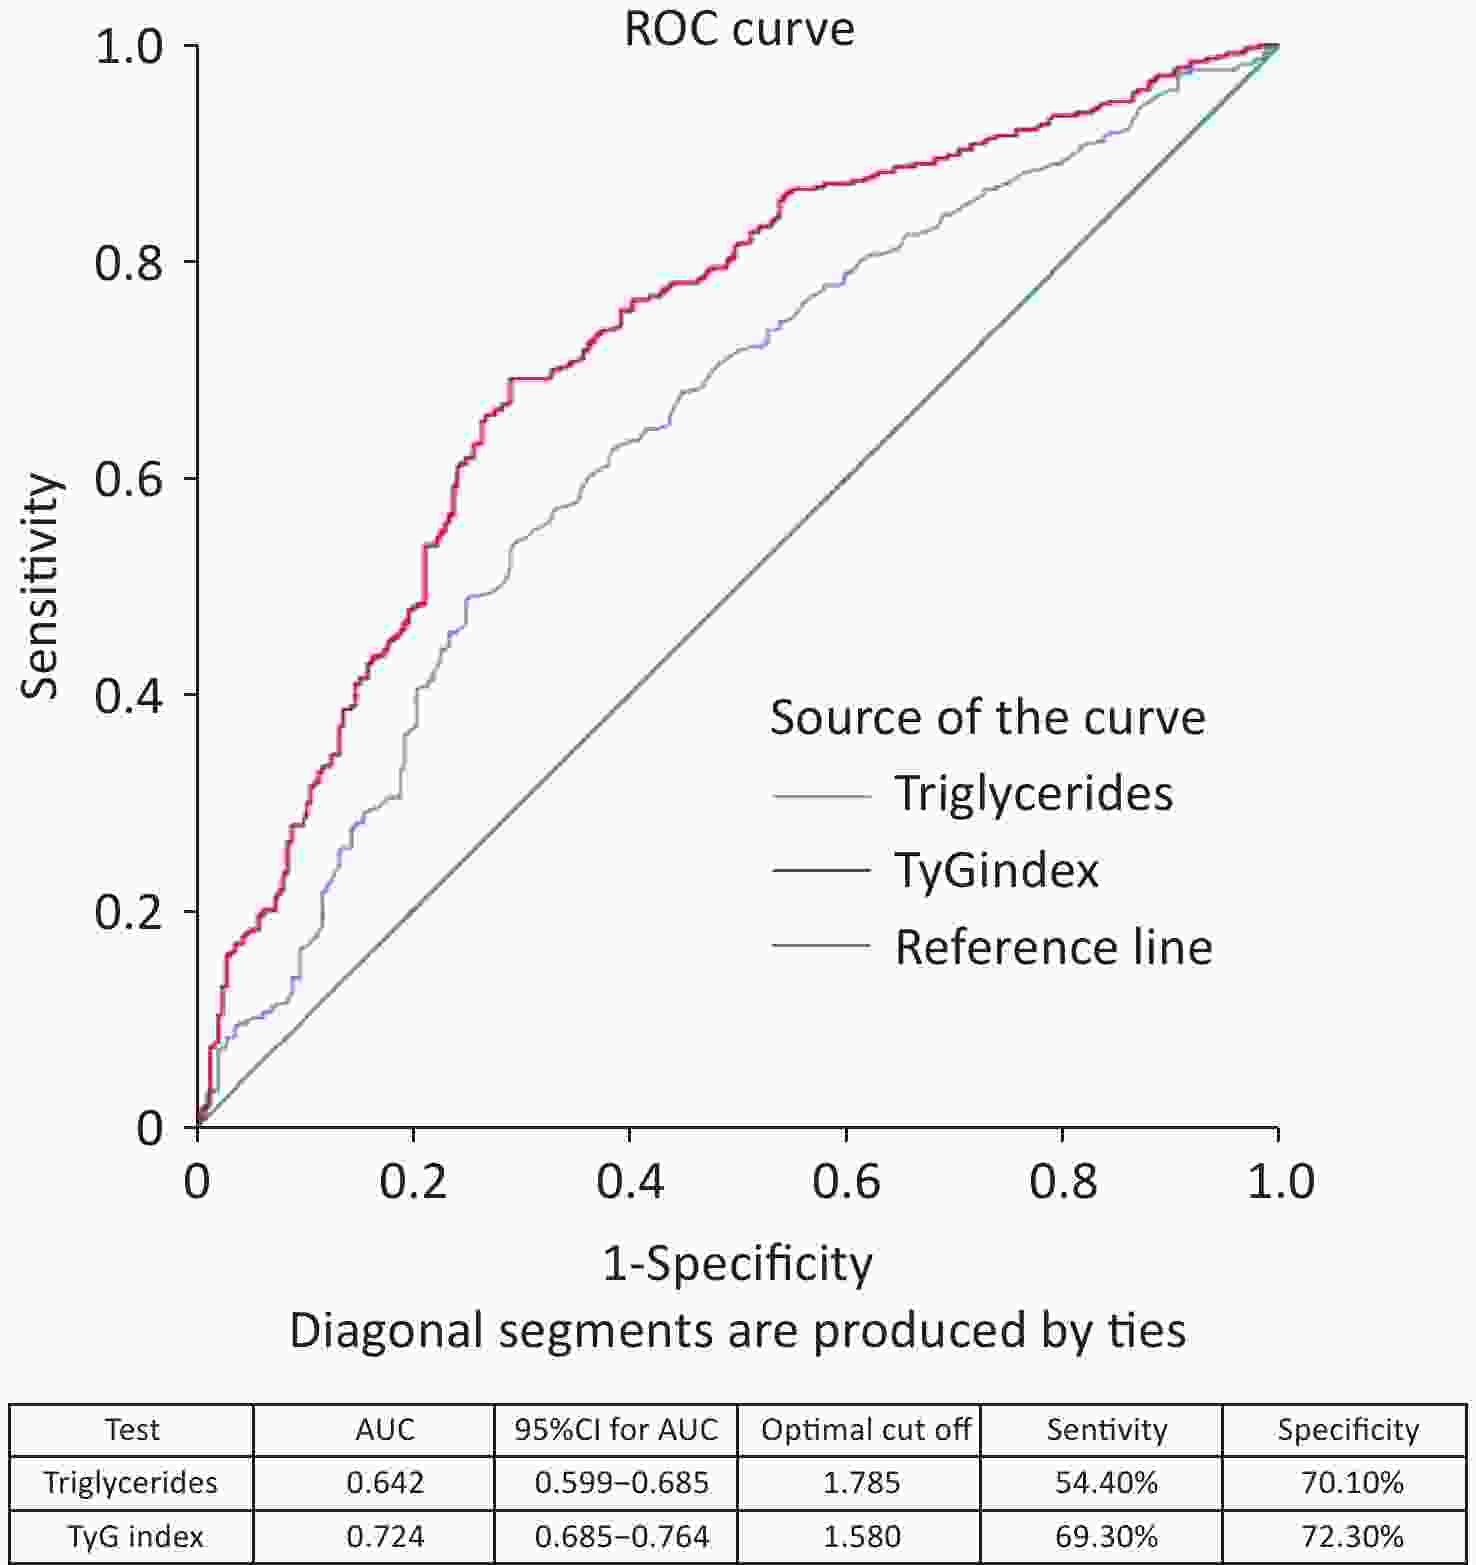
Figure 4. ROC curves of different markers in the screening of patients with NAFLD with or without metabolic abnormality. ROC, receiver-operating characteristic; NAFLD, nonalcoholic fatty liver disease.
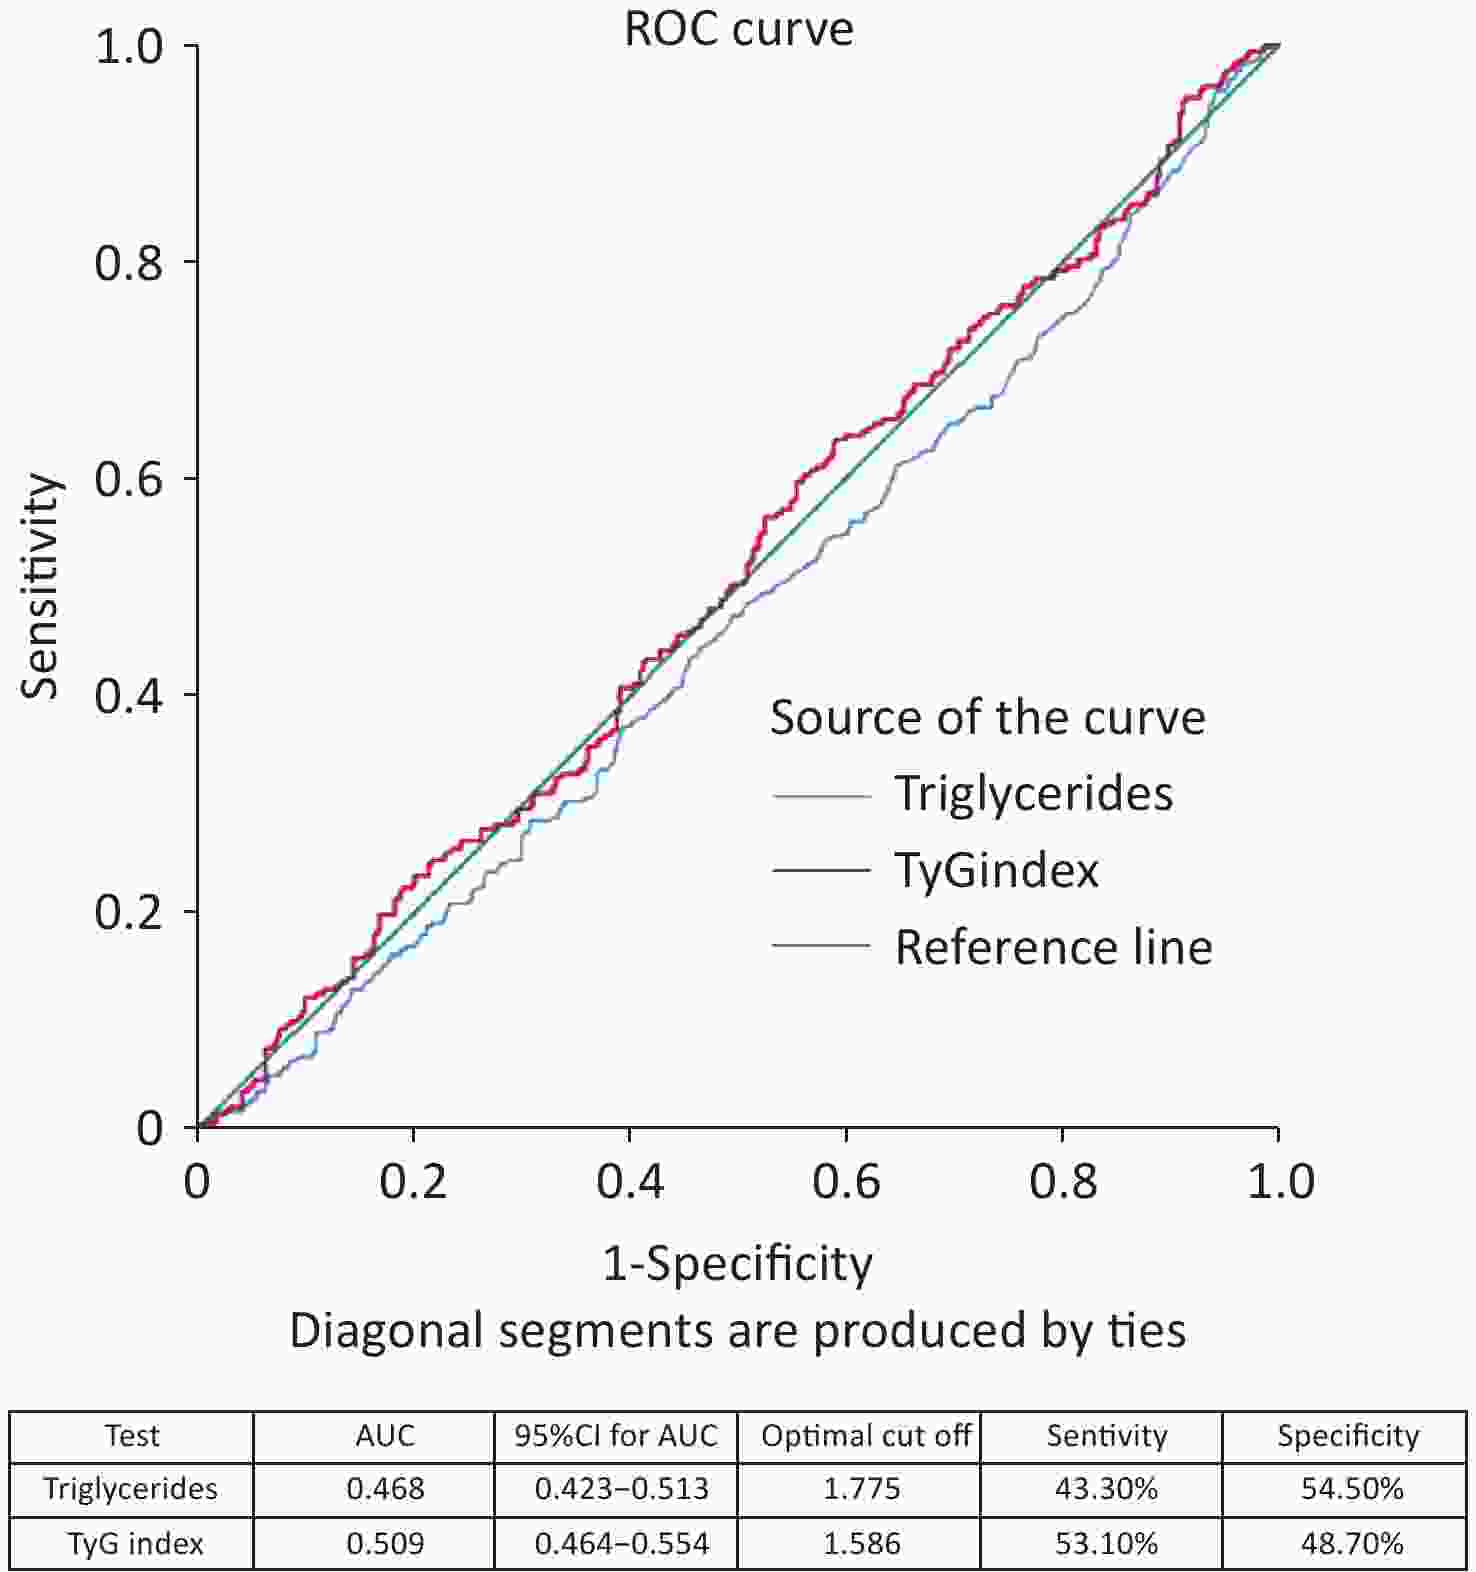
Figure 5. ROC analyses of indicators among the age group. ROC, receiver-operating characteristic; TyG; visceral obesity index.
-
NAFLD is currently recognized as the hepatic manifestation of metabolic syndrome[1], with central adiposity present in 90.9% of affected individuals[23,24]. Genetic variants are associated with NAFLD[25]. Evidence has consistently indicated a substantially elevated prevalence of metabolic syndrome among patients with NAFLD[26]. Our investigation revealed that patients with NAFLD were younger than their non-NAFLD counterparts. Supporting this paradoxical age distribution, Navarroza et al. observed that non-lean patients with NAFLD (typically associated with metabolic syndrome) were younger than lean patients, suggesting a heightened vulnerability to NAFLD and metabolic dysregulation in younger patients[27]. Our findings further confirmed that patients with NAFLD and MA demonstrated significantly higher BMI values, increased prevalence of obesity, and elevated rates of metabolic syndrome.
NAFLD is frequently accompanied by IR and hyperglycemia. Our analysis demonstrated markedly elevated HOMA-IR and fasting glucose levels in the NAFLD cohort compared to those in controls. Additionally, our data revealed increased TG concentrations, reduced HDL-C levels, and elevated TG/HDL-C ratios in patients with NAFLD. This altered lipid profile stems from augmented hepatic lipid synthesis coupled with impaired lipid clearance, leading to hypertriglyceridemia. The TG/HDL-C ratio, a sensitive marker of IR[28], is significantly elevated in NAFLD[19], which is consistent with our observations. Elevated ALT and AST levels reflect hepatocellular injury and inflammation, and studies have indirectly linked increased liver enzyme levels in NAFLD to steatosis and hepatocyte ballooning[29]. Elevated GGT levels correlate with metabolic dysfunction and an increased risk of fibrosis in NAFLD[30,31]. Previous studies have indicated a positive association between LAP, VAI, and NAFLD severity[16,17]. Furthermore, the TyG index positively correlated with both cirrhosis severity and the presence of liver fibrosis in NAFLD[11]. These distinct metabolic marker profiles reflect a more profound metabolic dysregulation in patients with NAFLD, in which interrelated factors synergistically drive disease progression. Consequently, the comprehensive management of MA, including weight control, enhancement of insulin sensitivity, and lipid regulation, is essential for mitigating disease progression in patients with NAFLD.
Evidence has consistently indicated a positive correlation between the TyG index and NAFLD[11,12], and our results corroborate its superior sensitivity. This heightened sensitivity likely arises from the capacity of the TyG index to effectively capture the underlying IR and metabolic dysregulation. The TyG index demonstrated a standalone predictive value for NAFLD, particularly in high-risk populations[32,33]. Notably, it remains effective in identifying NAFLD risk, even in individuals without obesity[13], underscoring its broad applicability across metabolic phenotypes. As a surrogate marker, the high sensitivity of the TyG index facilitated the effective identification of potential cases, thereby reducing diagnostic oversight. BMI, a direct measure of adiposity, is strongly correlated with hepatic lipid deposition. Sheng et al. found that BMI demonstrated robust NAFLD predictive performance across most demographic subgroups[33]. TyG-BMI has emerged as a significant predictor of NAFLD in patients with type 2 diabetes mellitus (T2DM), outperforming BMI alone and suggesting its utility for early screening[34]. In US cohorts without obesity, positive associations were observed between TyG, TyG-BMI, and NAFLD[35]. TyG-BMI has proven effective in detecting NAFLD in patients without obesity[36]. By integrating the strengths of both components, TyG-BMI achieved superior overall predictive performance, exhibiting higher accuracy than TyG alone in predicting NAFLD and demonstrating a stronger association with hepatic steatosis severity[37,38]. As a noninvasive, cost-effective, and readily accessible metric, TyG-BMI is highly suitable for large-scale screening and primary care implementation.
Our study identified a significantly higher mean age among patients with NAFLD and concomitant metabolic dysfunction, which is potentially attributable to the cumulative impact of metabolic syndrome-associated risks over time. Advancing age exacerbates pathological processes such as IR, dyslipidemia, and oxidative stress, thereby promoting MA. An investigation of the roles of obesity and metabolic dysfunction in NAFLD among older Chinese residents revealed a higher prevalence of MA in this older group[39], indirectly supporting our observation of an increased prevalence of metabolic dysregulation in older patients with NAFLD. Our data show that patients with NAFLD and MA exhibited hypertriglyceridemia and reduced HDL-C levels. This likely reflects intensified hepatic lipid metabolism dysregulation; decreased lipoprotein lipase activity in metabolically abnormal individuals impairs TG clearance and elevates serum levels. Reduced HDL-C levels are a hallmark of metabolic syndrome driven by IR, which suppresses lipoprotein lipase activity and accelerates HDL particle catabolism. Furthermore, we observed elevated FIB-4 index, HOMA-IR, LAP, VAI, TyG index, and TG/HDL-C ratio in patients with metabolically abnormal NAFLD. Increased FIB-4 signals heightened the risk of liver fibrosis[40], whereas elevated HOMA-IR indicated worsening of IR, further aggravating hepatic steatosis and systemic metabolic derangement. Both LAP and VAI reflect abnormal visceral adipose tissue distribution and function, which exacerbate lipid deposition and IR. The VAI serves as a predictor of metabolic syndrome[41], whereas LAP exhibits a particularly strong predictive capability for NAFLD[16,17]. The TyG index correlates significantly with metabolic derangements in patients with NAFLD, demonstrating a higher predictive value, particularly in younger individuals[42]. Elevated TyG levels were positively associated with worsening NAFLD fibrosis scores and FIB-4 indices[43]. The TG/HDL-C ratio serves as a marker of metabolic dysregulation severity[44] and can enhance predictive models for MASLD[45].
Our findings suggest that age, triglyceride levels, and TyG index are independent risk factors for NAFLD in patients with MA. ROC curve analysis revealed good sensitivity and specificity for age, triglycerides, and TyG; however, the TyG index demonstrated superior performance for both parameters in the NAFLD cohort. Reportedly, lean patients with NAFLD exhibit significantly higher TyG indices than that of healthy controls, with TyG alone showing favorable sensitivity and specificity for diagnosing lean NAFLD and potentially outperforming traditional metabolic markers[13]. In patients with NAFLD and MA, the standalone diagnostic efficacy of the TyG index was lower than that of its derivatives (e.g., TyG-BMI), suggesting a potential need for higher TyG thresholds or a combination with other indices (e.g., BMI and waist circumference) to improve accuracy. Modified TyG indices (e.g., TyG-BMI and TyG-WC) likely offer enhanced specificity and greater predictive value than do TyG alone[14,46].
Therefore, while the TyG index has diagnostic utility across NAFLD subtypes, its application in patients with MA may require a combination of anthropometric measures (e.g., BMI and waist circumference) for optimal accuracy. In contrast, TyG alone may be an effective screening tool for NAFLD in patients without overt metabolic dysfunction. Patients with MA may exhibit higher absolute triglyceride levels and require elevated TyG diagnostic thresholds. However, further research is necessary to precisely define these population-specific differences.
However, we acknowledge a limitation of our study. The lack of data on the full spectrum of metabolic markers identified in prior literature precluded a comprehensive comparative analysis. To address this, we intend to conduct a large-scale study designed to systematically evaluate an expanded set of promising biomarkers with the goal of defining a superior diagnostic panel.
Lipid-related Insulin Resistance Indices for the Diagnosis of Non-alcoholic Fatty Liver Disease in Chinese Adults
doi: 10.3967/bes2025.161
- Received Date: 2025-06-22
- Accepted Date: 2025-10-22
-
Key words:
- Lipid-related insulin resistance marker /
- Nonalcoholic fatty liver disease /
- Triglyceride glucose index /
- Metabolic abnormalities
Abstract:
The authors declare no competing financial or nonfinancial interests relevant to this study.
The study protocol was approved ethically (approval no. DTEC-KY2024-013-01) by the Institutional Review Board of Beijing Ditan Hospital Capital Medical University in compliance with the principles of the Declaration of Helsinki.
&These authors contributed equally to this work.
| Citation: | Weihua Cao, Yaqin Zhang, Ziyu Zhang, Xinxin Li, Wen Deng, Shiyu Wang, Xin Wei, Linmei Yao, Zixuan Gao, Shuojie Wang, Lu Zhang, Yao Lu, Ruyu Liu, Shuling Wu, Yuanjiao Gao, Hongxiao Hao, Yao Xie, Minghui Li. Lipid-related Insulin Resistance Indices for the Diagnosis of Non-alcoholic Fatty Liver Disease in Chinese Adults[J]. Biomedical and Environmental Sciences. doi: 10.3967/bes2025.161

|

 Quick Links
 DownLoad: