
-
Asthma is one of the most common chronic noncommunicable diseases[1], affecting over 260 million individuals annually and causing over 450,000 deaths worldwide[2,3]. In addition to genetic predispositions, environmental factors have contributed significantly to the increasing incidence of asthma over the past few decades[4].
Emerging evidence supports a possible link between increased exposure to environmental endocrine-disrupting chemicals (EDCs) and rising incidence of asthma[5-7]. These chemicals are widely used in personal-care products, food packaging, and other consumer products[8,9]. Bisphenol compounds (bisphenol A [BPA], bisphenol F [BPF], and bisphenol S [BPS]) are common components of polycarbonate plastics. Epoxy resins[10,11], triclosan (TCS), 2,5-dichlorophenol (2,4-DCP), and 2,5-dichlorophenol (2,5-DCP) are used in antimicrobials and insecticides[12-14]. Methylparaben (MeP), ethylparaben (EtP), and propylparaben (PrP) are preservatives used in cosmetics and pharmaceuticals[15].
Phenols and parabens are readily absorbed by the human body[16,17] and have been detected in breast milk and urine[18,19]. Emerging evidence suggests that EDC exposure may increase asthma risk in children[20,21]. However, studies on the relationship between phenol or paraben exposure and asthma in adult populations are scarce. Only one study based on the 2005–2006 National Health and Nutrition Examination Survey (NHANES) data reported a significant association between urinary BPA levels and allergic asthma in adult females[22]. Moreover, most studies have primarily focused on single exposures[23,24]. Recent studies have confirmed the additive effects of low-dose chemical mixtures. Using simulated complex mixtures, Braun et al. experimentally demonstrated that additive mixture effects occurred at concentrations below the effect threshold of the individual constituent chemicals[25]. This highlights the urgent need to evaluate the combined effects of multiple pollutants, considering the complexity of exposure patterns and intricate interactions among environmental chemicals[26]. To the best of our knowledge, no study has investigated the association between phenol and paraben exposure and asthma. Studies have also indicated that mixtures of phenols and parabens are significantly associated with obesity[27], which in turn increases the risk of asthma in a dose-dependent manner[28]. Clarifying whether body mass index (BMI) is an intermediate factor in the relationship between EDC exposure and asthma can shed light on the mechanisms underlying the adverse effects of chemical exposure.
Therefore, in this study, using NHANES data from participants aged ≥ 18 years, we aimed to i) analyze the individual effects of phenol and paraben exposure on asthma, ii) analyze the joint effects of phenol and paraben exposure on asthma, and iii) investigate the mediating role of BMIs on the relationship between phenol and paraben exposure and asthma.
-
The NHANES is a comprehensive survey conducted by the National Center for Health Statistics (NCHS) to evaluate health and nutritional status. Participants completed extensive questionnaires and underwent physical examinations and laboratory tests. Ethical approval was obtained from the NCHS, and all participants provided informed consent. Compared to other periods, the 2013–2014 and 2015–2016 NHANES cycles provided enhanced phenol biomonitoring data, particularly through the inclusion of BPS and BPF measurements. Therefore, this study integrated four consecutive NHANES cycles (2013–2016), comprising an initial cohort of 20,146 participants.
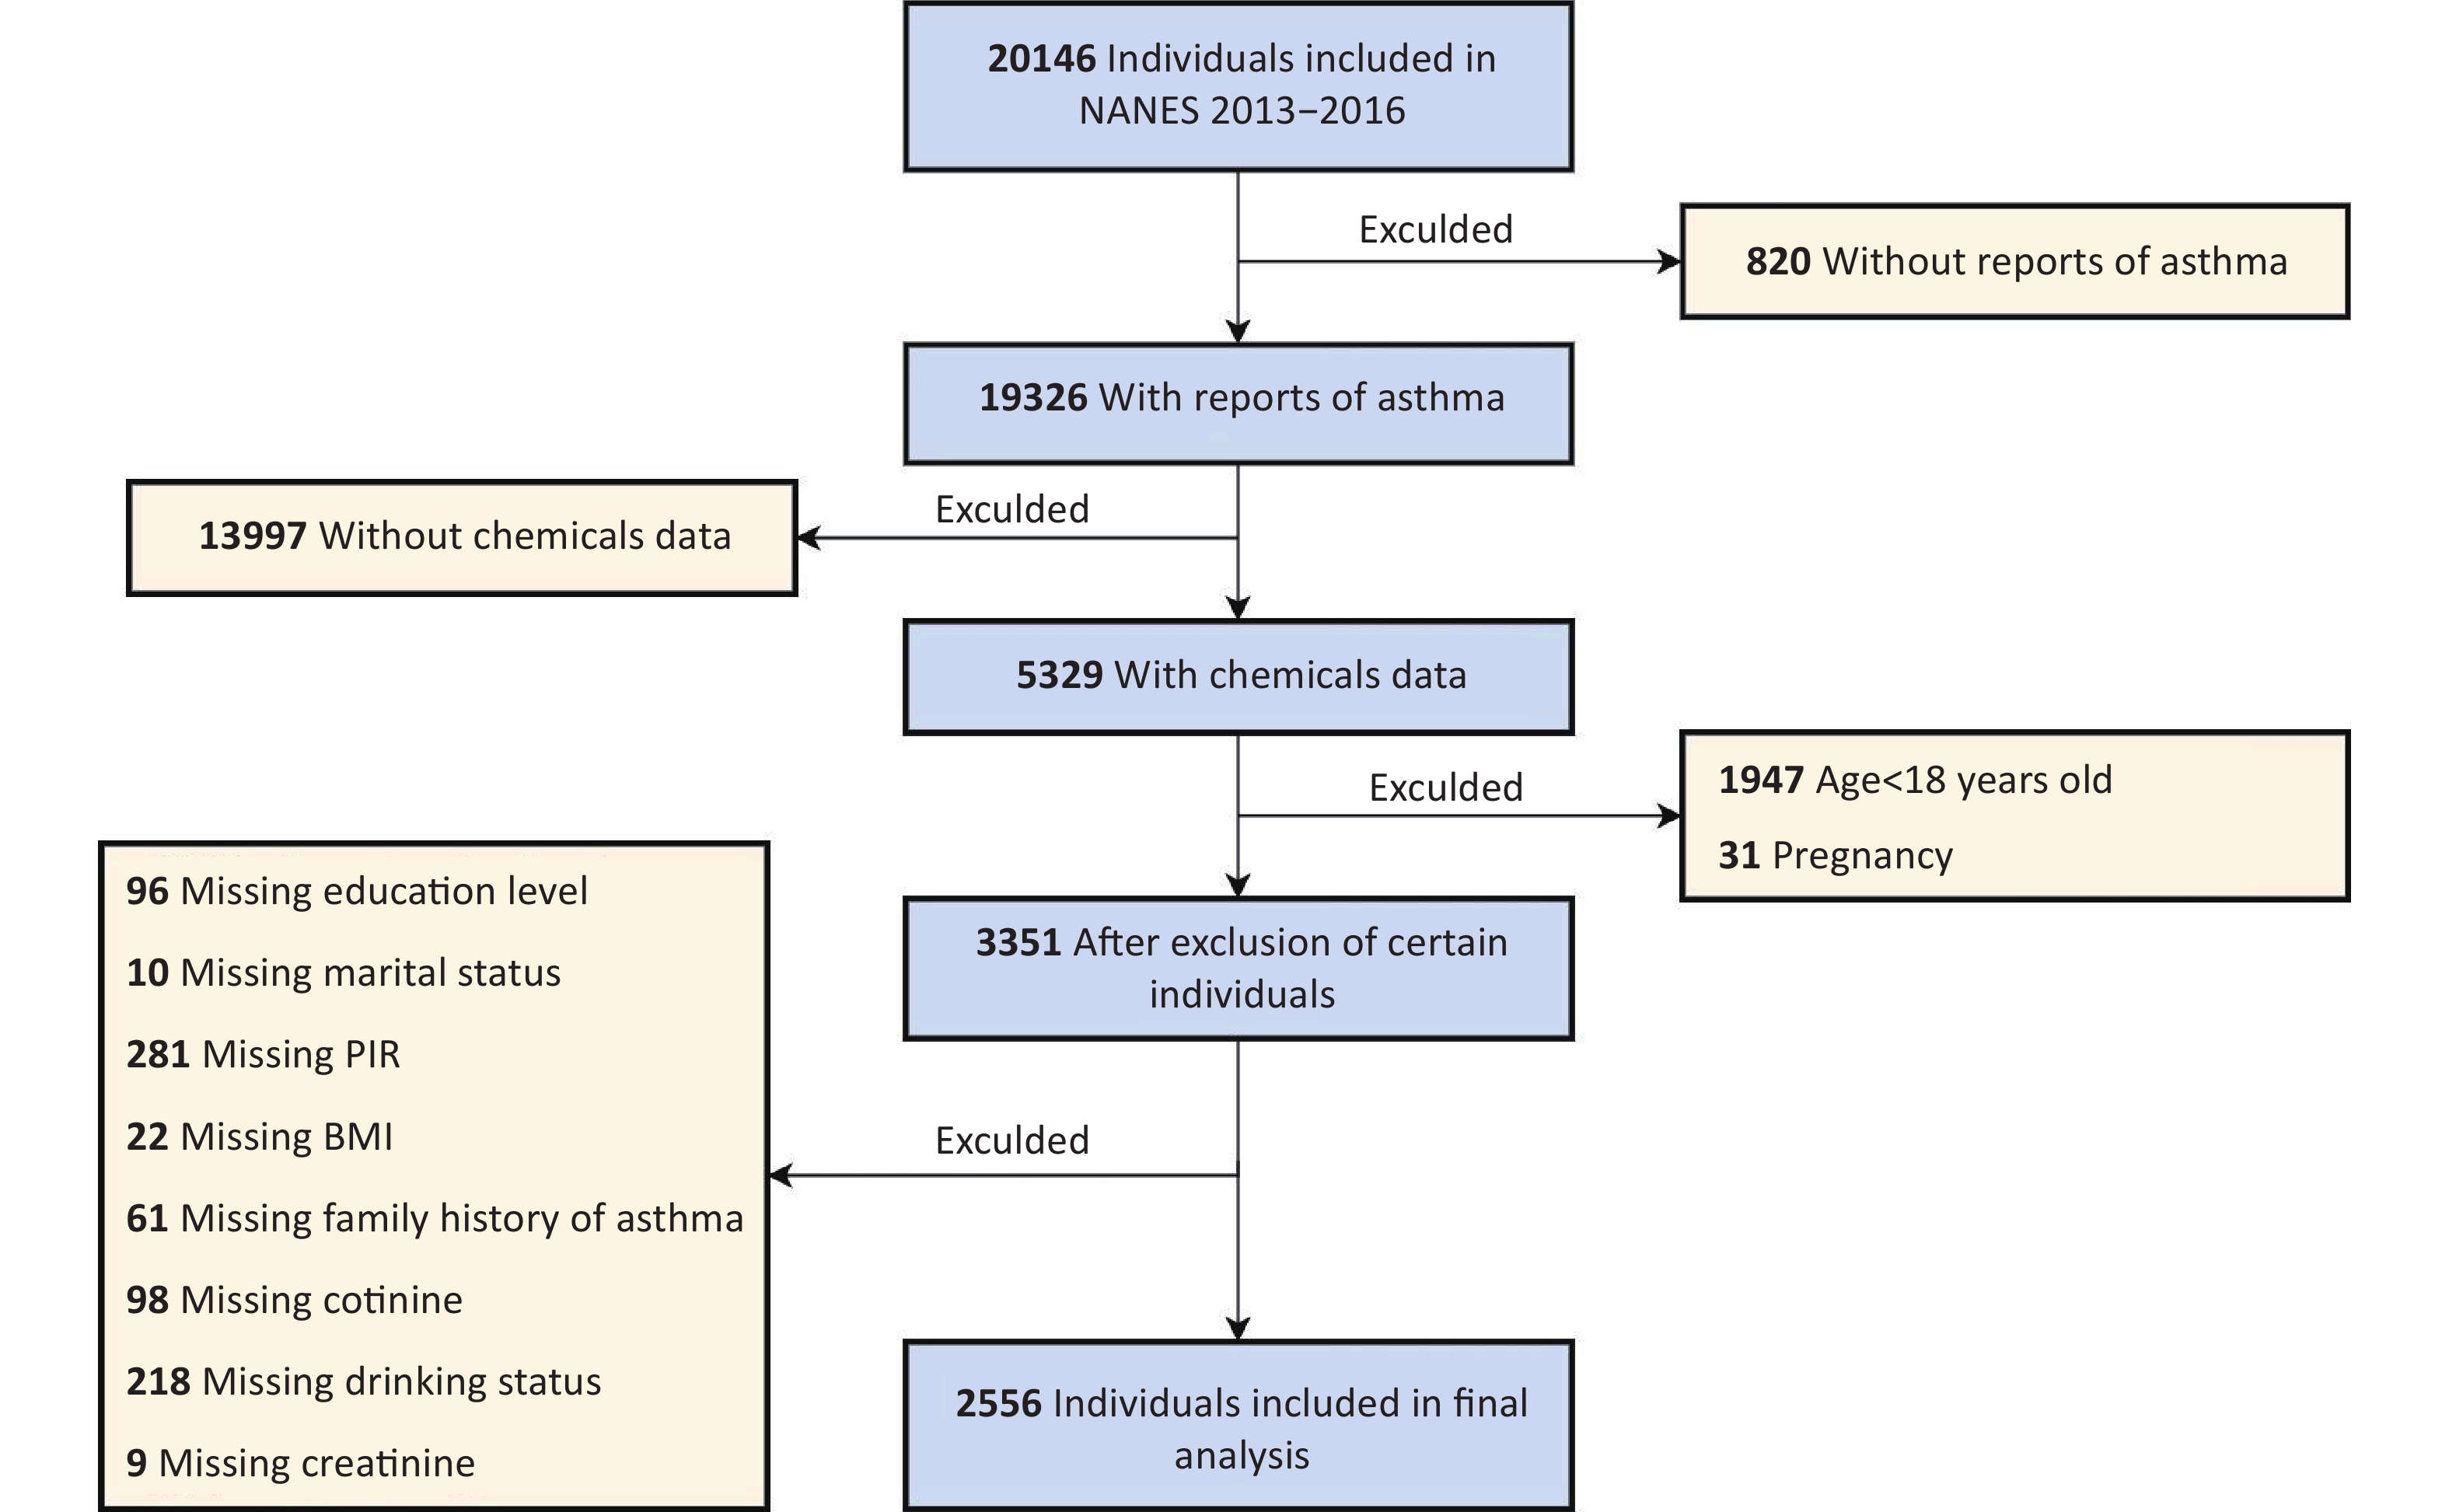
Asthma outcomes were evaluated using a questionnaire administered to participants aged ≥ 18 years. Asthma was defined as a positive response to the question (Question-MCQ010), “Has a doctor or any other health professional ever told you that you have asthma?” Participants who answered the questions negatively were classified as not having asthma. Individuals with missing data on asthma status (n = 820) or urinary phenols or parabens (n = 13,997), those younger than 18 years (n = 1,947), and pregnant women (n = 31) were excluded.
Additionally, 3,351 participants were excluded because of incomplete data on key covariates, including educational level, marital status, household poverty-to-income ratio (PIR), BMI, family history of asthma, serum cotinine levels, alcohol consumption status, or creatinine levels. Following these exclusions, the analysis included 2,556 participants with complete data. Figure 1 shows the participant selection process.
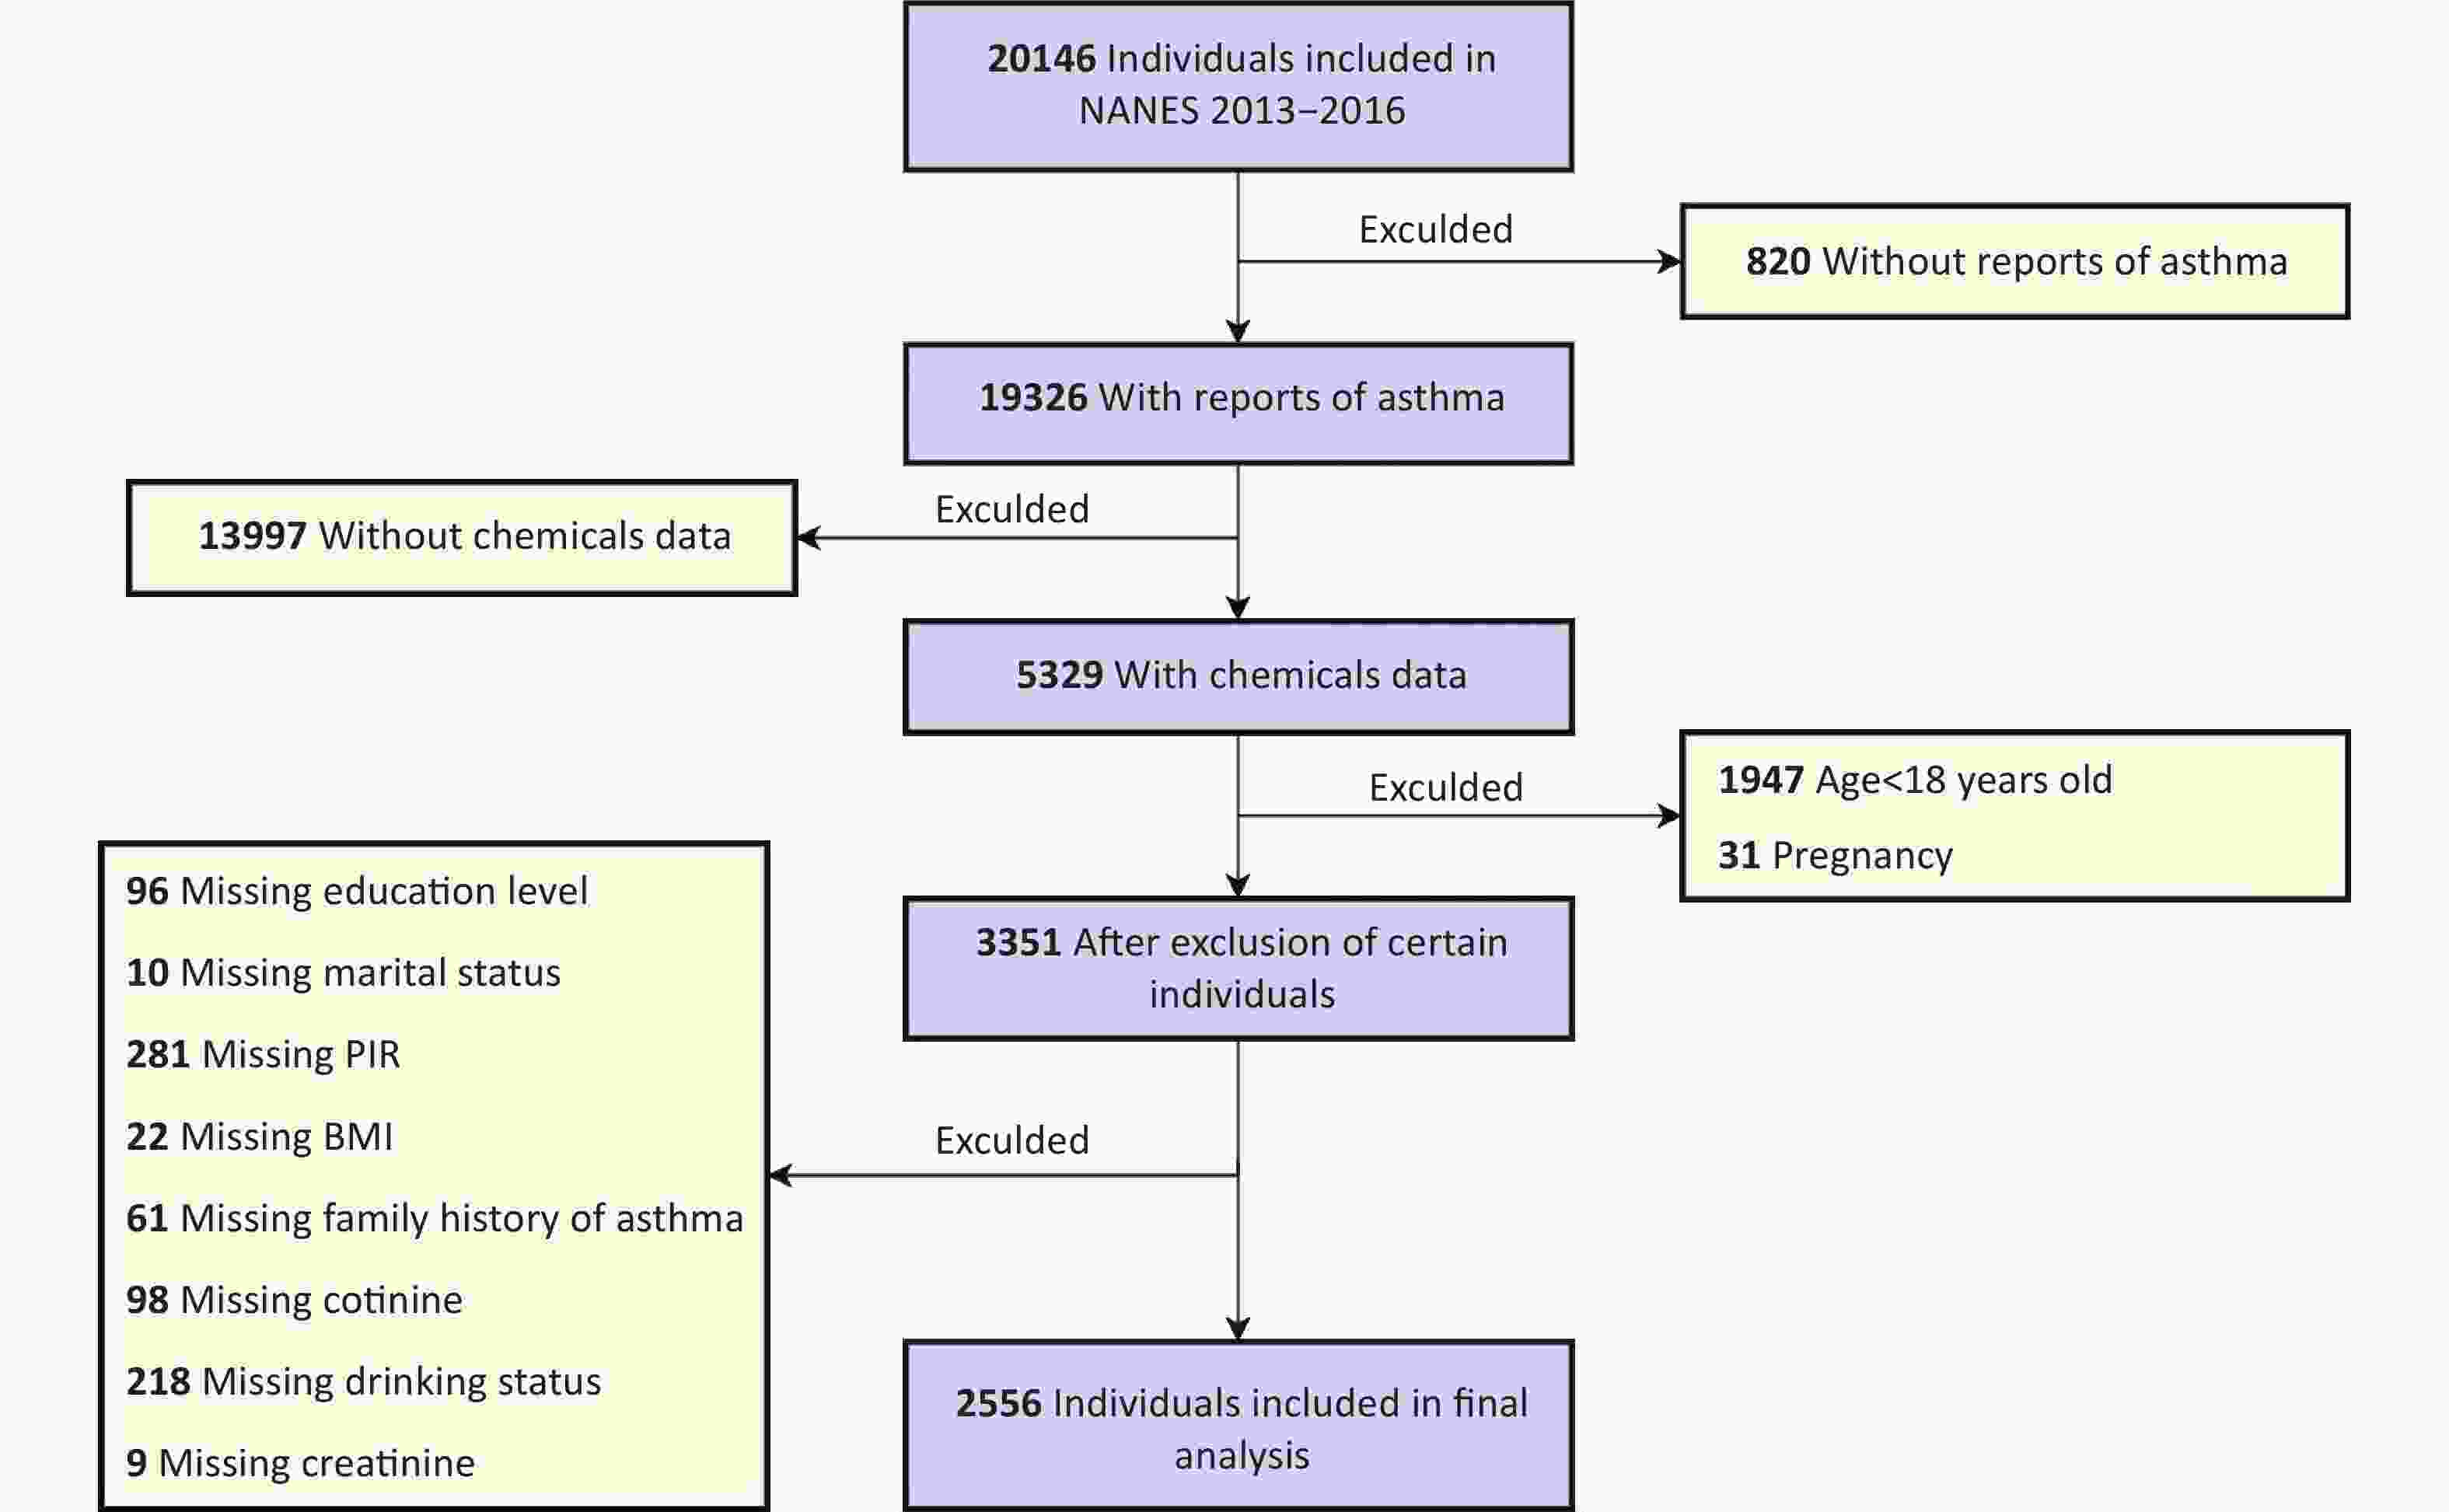
Figure 1. Flowchart of the participant selection. NHANES, National Health and Nutrition Examination Survey; PIR, poverty-to-income ratio; BMI, body mass index.
-
Urine samples were processed and stored at -20 °C before being shipped to the Centers for Disease Control and Prevention’s National Center for Environmental Health for testing. Stringent quality control procedures were used during sample collection and processing to guarantee data accuracy. Urine samples were hydrolyzed by β-glucuronidase/arylsulfatase, acidified with 0.1 M formic acid, and then quantitatively analyzed for phenols and parabens using online solid-phase extraction combined with high-performance liquid chromatography-tandem mass spectrometry (online SPE-HPLC-MS/MS)[24]. Values below the limit of detection (LOD) were imputed by dividing the LOD by the square root of 2 (LOD/sqrt (2)). The NHANES laboratory procedures provide detailed information on the methods for measuring chemical substances and experimental quality control. Initially, seven phenols and four parabens were detected. Triclocarban (TCC), butylparaben (BuP), and EtP were excluded because their detection rates were less than 50%. Ultimately, eight compounds with detection rates exceeding 50% were included in the analysis. These included six phenols (BPA, BPF, BPS, TCS, 2,5-DCP, and 2,4-DCP) and two parabens (MeP and PrP).
-
The selection of covariates was guided by previous research on environmental EDC exposure and its impact on asthma[29-33]. We identified possible confounders and added them to the directed acyclic graph (DAG), as shown in Supplementary Figure S1. In the present study, creatinine adjustment was performed by including urinary creatinine as a covariate[34]. The covariates in this study included age, sex, race, educational level, marital status, PIR, BMI, alcohol consumption status, family history of asthma, urinary creatinine level, and serum cotinine level (as an index of exposure to environmental tobacco and secondhand smoke). According to the classification of marital status in the NHANES database, we classified marital status into “married,” “never married,” and “other.” “Other” included “widowed,” “divorced,” “separated,” and “living with a partner.” Age, PIR, BMI (kg/m2), urinary creatinine level, and serum cotinine level were treated as continuous variables. Participants who consumed at least 12 alcoholic drinks in any year were classified as alcohol drinkers.
-
Owing to the non-normal distribution of urinary phenol and paraben levels, they were log-transformed. Continuous data are expressed as means with standard deviations, while categorical variables are reported as instances (n) and percentages (%). Group comparisons were performed using the Student's t-test, Mann–Whitney U test (continuous variables), or chi-squared test (categorical variables). Correlations between the log-transformed phenol and paraben levels were assessed using Pearson’s coefficients.
A multivariate generalized linear regression model was used to evaluate the association between chemical exposure and asthma. Three models were constructed to account for the effects of potential covariates: 1) a crude model without covariate adjustment; 2) Model I adjusted for age and sex; and 3) Model II adjusted for age, sex, race, educational level, marital status, PIR, BMI, alcohol consumption status, family history of asthma, urinary creatinine level, and serum cotinine level. Additionally, because the associations between phenol and paraben exposure and asthma may vary with age and BMI, the associations were further analyzed by stratification by age and BMI. A new continuous variable derived from the natural log-transformed median concentrations across quartiles (Q1-Q4) was used for trend testing.
Given the simultaneous analysis of eight chemicals, particular attention was paid to their potential multicollinearity. Traditional multivariate logistic regression models have limitations when handling highly correlated exposure variables, including unstable coefficient estimates and inflated standard errors, which increase uncertainty. We employed a weighted quantile sum (WQS) regression model to address this. This approach treats chemical mixtures as an integrated exposure index, circumventing the need for simultaneous testing of eight independent hypotheses and thereby inherently avoiding traditional multiple comparison correction requirements[27,35,36]. This model calculates a weighted linear index by grouping chemicals into quartiles. The weights reflect the contribution of each chemical to the WQS index. Two WQS regression models were further tested: one assuming that all components positively influenced asthma and another assuming negative associations. The WQS model was adjusted for various covariates. The chemical concentrations were analyzed after logarithmic transformation owing to their skewed distributions. Statistical significance was defined as P < 0.05. To test the credibility of the results, we further excluded patients with chronic bronchitis and chronic obstructive lung disease (COPD) for validation. In addition, sensitivity analysis was performed by adjusting the number of bootstrap iterations to verify the stability of the WQS model.
To investigate the potential mediating effect of BMI in the connection between phenol and paraben exposure and asthma, mediation analysis was performed with the R package "mediation.” Two linear regression models were fitted to assess the relationships between EDCs and outcomes and between BMI and EDCs. Subsequently, indirect and direct effects were obtained using the mediate command in the package, with nonparametric bootstrapping (n = 1,000) applied to evaluate the mediation effects. All covariates were included in the analysis. Statistical analysis was performed using R software version 4.2.0. Differences in two-sided analyses were considered statistically significant at P < 0.05.
-
Table 1 presents the demographic characteristics of the study participants. Among the 2,556 participants enrolled in the NHANES from 2013 to 2016, 48.74% (n = 1,226) were male, and 51.26% (n = 1,330) were female. A total of 400 participants (15.65%) of the entire sample were diagnosed with asthma. Compared with individuals without asthma, those with asthma were younger (P = 0.031), had a higher BMI (P = 0.004), and exhibited elevated serum cotinine levels (P = 0.033). Additionally, significant variations in sex (P = 0.020), race (P = 0.043), and a family history of asthma (P < 0.001) were observed. No significant differences were found in the educational level, marital status, PIR, or alcohol consumption status (P > 0.05). In addition, we performed a differential analysis of the baseline characteristics of the population before and after excluding missing covariates (Supplementary Table S1), and no significant differences were noted in the baseline characteristics.
Characteristic Total (n = 2,556) Non-asthmatic (n = 2,156) Asthmatic (n = 400) P-value Age (years) 46.77 ± 16.03 47.17 ± 15.95 44.65 ± 16.29 0.031 Sex 0.020 Male 1,226 (48.74%) 1,073 (50.47%) 153 (39.66%) Female 1,330 (51.26%) 1,083 (49.53%) 247 (60.34%) Race 0.043 Mexican American 391 (8.41%) 355 (9.12%) 36 (4.66%) Other Hispanic 287 (5.73%) 246 (5.97%) 41 (4.47%) Non-Hispanic White 947 (65.66%) 774 (64.89%) 173 (69.68%) Non-Hispanic Black 575 (11.89%) 478 (11.73%) 97 (12.69%) Other race 356 (8.31%) 303 (8.29%) 53 (8.50%) Educational level 0.857 High School or lower 525 (13.43%) 449 (13.50%) 76 (13.06%) Above high school 2,031 (86.57%) 1,707 (86.50%) 324 (86.94%) Marital status 0.423 Married 1,360 (58.34%) 1,162 (59.00%) 198 (54.90%) Never married 488 (17.27%) 396 (16.81%) 92 (19.70%) Other 708 (24.39%) 598 (24.19%) 110 (25.40%) PIR 3.03 ± 1.66 3.06 ± 1.65 2.91 ± 1.74 0.282 BMI (kg/m2) 29.42 ± 7.12 29.13 ± 6.78 30.95 ± 8.56 0.004 Cotinine (ng/mL) 58.52 ± 126.59 55.79 ± 124.88 72.82 ± 134.44 0.033 Alcohol consumption 0.582 No 703 (20.77%) 591 (20.62%) 112 (21.56%) Yes 1,853 (79.23%) 1,565 (79.38%) 288 (78.44%) Family history of asthma <0.001 No 2,015 (78.53%) 1,775 (81.86%) 240 (61.14%) Yes 541 (21.47%) 381 (18.14%) 160 (38.86%) Note. Continuous variables are expressed as means with standard deviations (Means ± SDs), whereas categorical variables are presented as cases (n) and percentages (%). Student's t-test or the Mann–Whitney U-test was used for continuous variables, while the chi-squared test was used for categorical variables. Abbreviations: BMI, body mass index; PIR, poverty-to-income ratio. “Other Race” means “including multi-racial.” “Other” marital status includes “widowed,” “divorced,” “separated,” and “living with partner.” Table 1. Characteristics of the study population, NHANES, 2013–2016
-
Eight phenols and parabens with detection rates exceeding 50% in the urine samples were included in the analysis. The detection frequencies and median concentrations of these compounds are shown in Supplementary Table S2. MeP and PrP showed high detection frequencies in participants, with both exceeding 98%. BPA and its substitute, BPS, were detected in 95.39% and 90.12% of the participants, respectively, with BPA concentrations being approximately two times higher than those of BPS. The detection frequency of BPF was lower than that of BPS, and its median concentration was comparable to that of BPS. The detection frequency and median concentration of 2,5-DCP were higher than those of 2,4-DCP. Pearson’s correlation analysis of the log-transformed concentrations revealed moderate-to-strong associations among the eight chemicals, with correlation coefficients ranging from 0.07 to 0.82 (P < 0.05; Supplementary Figure S2). Notably, strong positive correlations were identified between MeP and PrP (r = 0.82) and between 2,5-DCP and 2,4-DCP (r = 0.78).
-
Multivariate logistic regression models were used to assess the association between individual urine phenol and paraben levels and asthma, as shown in Table 2. Three models were constructed: a crude model (unadjusted), adjusted Model I (demographic and socioeconomic covariates), and adjusted Model II (additional lifestyle and clinical covariates). Log-transformed BPF (log-BPF) exposure demonstrated a consistent positive association with asthma in all three models. The odds ratio (OR) per unit increase in log-BPF was 1.11 (95% confidence interval [CI], 1.03–1.20; P = 0.006) in the crude model. In Model I, the OR was 1.12 (95% CI, 1.04–1.20; P = 0.004), while in Model II, it was 1.09 (95% CI, 1.00–1.18; P = 0.040). In addition, a marginal association was observed between log-transformed PrP (log-PrP) concentrations and asthma in the crude model with an OR of 1.09 (95% CI, 1.00–1.19; P = 0.043). However, after controlling for variables in Models I (OR: 1.05; 95% CI, 0.96–1.14; P = 0.297) and II (OR: 1.06; 95% CI, 0.97–1.16; P = 0.199), this connection weakened and became nonsignificant.
Crude model Model I Model II OR (95% CI) P-Value OR (95% CI) P-Value OR (95% CI) P-Value Log BPA 1.06 (0.96–1.18) 0.254 1.09 (0.97–1.21) 0.136 1.04 (0.92–1.16) 0.551 Log BPF 1.11 (1.03–1.20) 0.006 1.12 (1.04–1.20) 0.004 1.09 (1.00–1.18) 0.040 Log BPS 1.00 (0.91–1.09) 0.975 1.00 (0.91–1.10) 0.990 1.01 (0.91–1.11) 0.912 Log TCS 0.95 (0.89–1.02) 0.160 0.95 (0.89–1.02) 0.177 0.96 (0.89–1.04) 0.314 Log MeP 0.93 (0.84–1.04) 0.221 0.94 (0.84–1.04) 0.231 0.96 (0.85–1.07) 0.459 Log PrP 1.09 (1.00–1.19) 0.043 1.05 (0.96–1.14) 0.297 1.06 (0.97–1.16) 0.199 Log 2,5-DCP 0.96 (0.88–1.05) 0.368 0.96 (0.88–1.05) 0.394 0.98 (0.89–1.08) 0.688 Log 2,4-DCP 1.00 (0.87–1.16) 0.988 1.00 (0.87–1.16) 0.968 0.98 (0.84–1.14) 0.754 Note. The crude model was not adjusted for covariates. Model I was adjusted for age and sex. Model II was adjusted for all covariates. Abbreviations: OR, odds ratio; CI, confidence interval; BPA, bisphenol A; BPF, bisphenol F; BPS, bisphenol S; TCS, triclosan; MeP, methylparaben; PrP, propylparaben; 2,5- DCP, 2,5-dichlorophenol; 2,4- DCP, 2,4-dichlorophenol. Table 2. Multivariate logistic regression model between phenol and paraben exposure and asthma
-
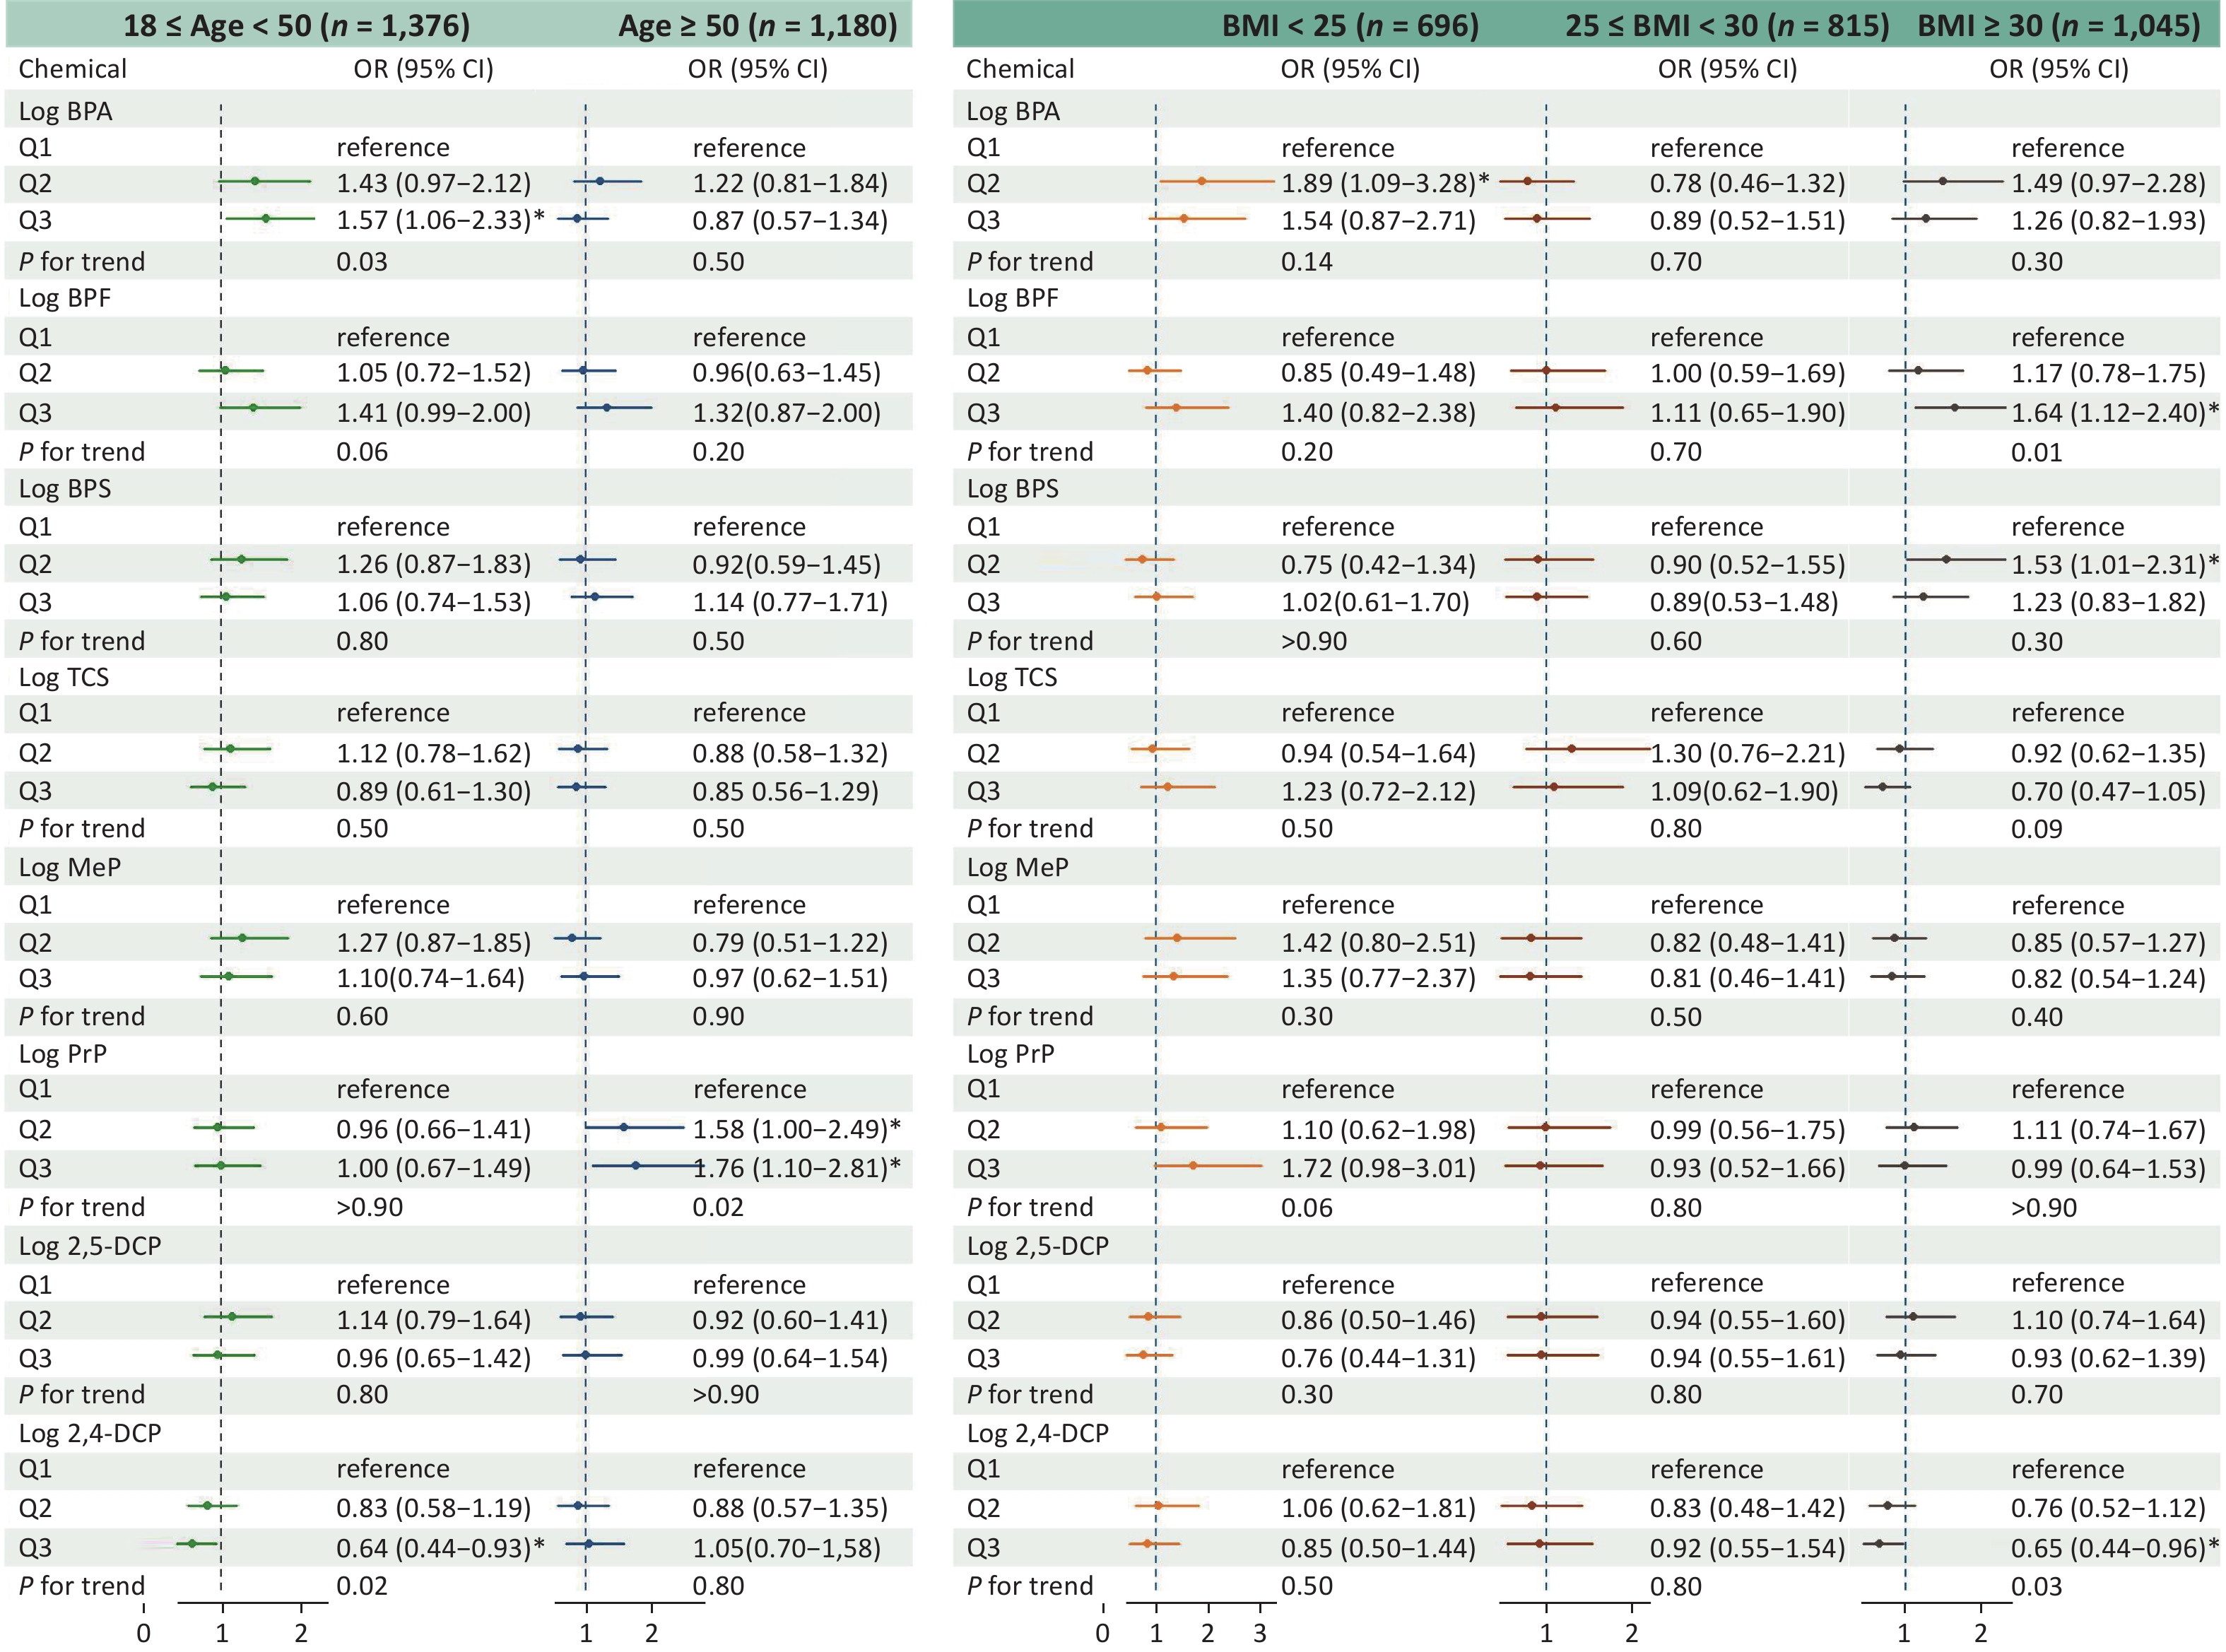
Figure 2 shows the findings of the stratification analysis that examined the association between phenol and paraben exposure and asthma risk based on age and BMI. Stratification by age resulted in 1,376 participants with age ≥ 18 years and < 50 years and 1,180 participants with age ≥ 50 years. Stratification by BMI led to 696 participants with BMI < 25 kg/m2, 815 participants with BMI ≥ 25 and < 30 kg/m2, and 1,045 participants with BMI ≥ 30 kg/m2. In the age-based stratification, participants in Q3 of BPA exposure (OR, 1.57; 95% CI, 1.06–2.33) had a significantly higher asthma risk than those in Q1 in the younger group (aged ≥ 18 and < 50 years; trend P < 0.05). In the older age group (aged > 50 years), both the Q2 (OR, 1.58; 95% CI, 1.00–2.49) and Q3 (OR, 1.76; 95% CI, 1.10–2.81) values of PrP exposure were associated with an elevated asthma risk compared to the Q1 value (trend P < 0.05). Moreover, according to international standards, participants with BMIs between 25 and 30 kg/m2 were categorized as overweight, while a BMI of ≥ 30 kg/m2 defined obesity. In the obesity group, a significant association was observed between BPF exposure and asthma risk in Q3 (OR, 1.64; 95% CI, 1.12–2.40) compared with Q1 (trend P < 0.05).
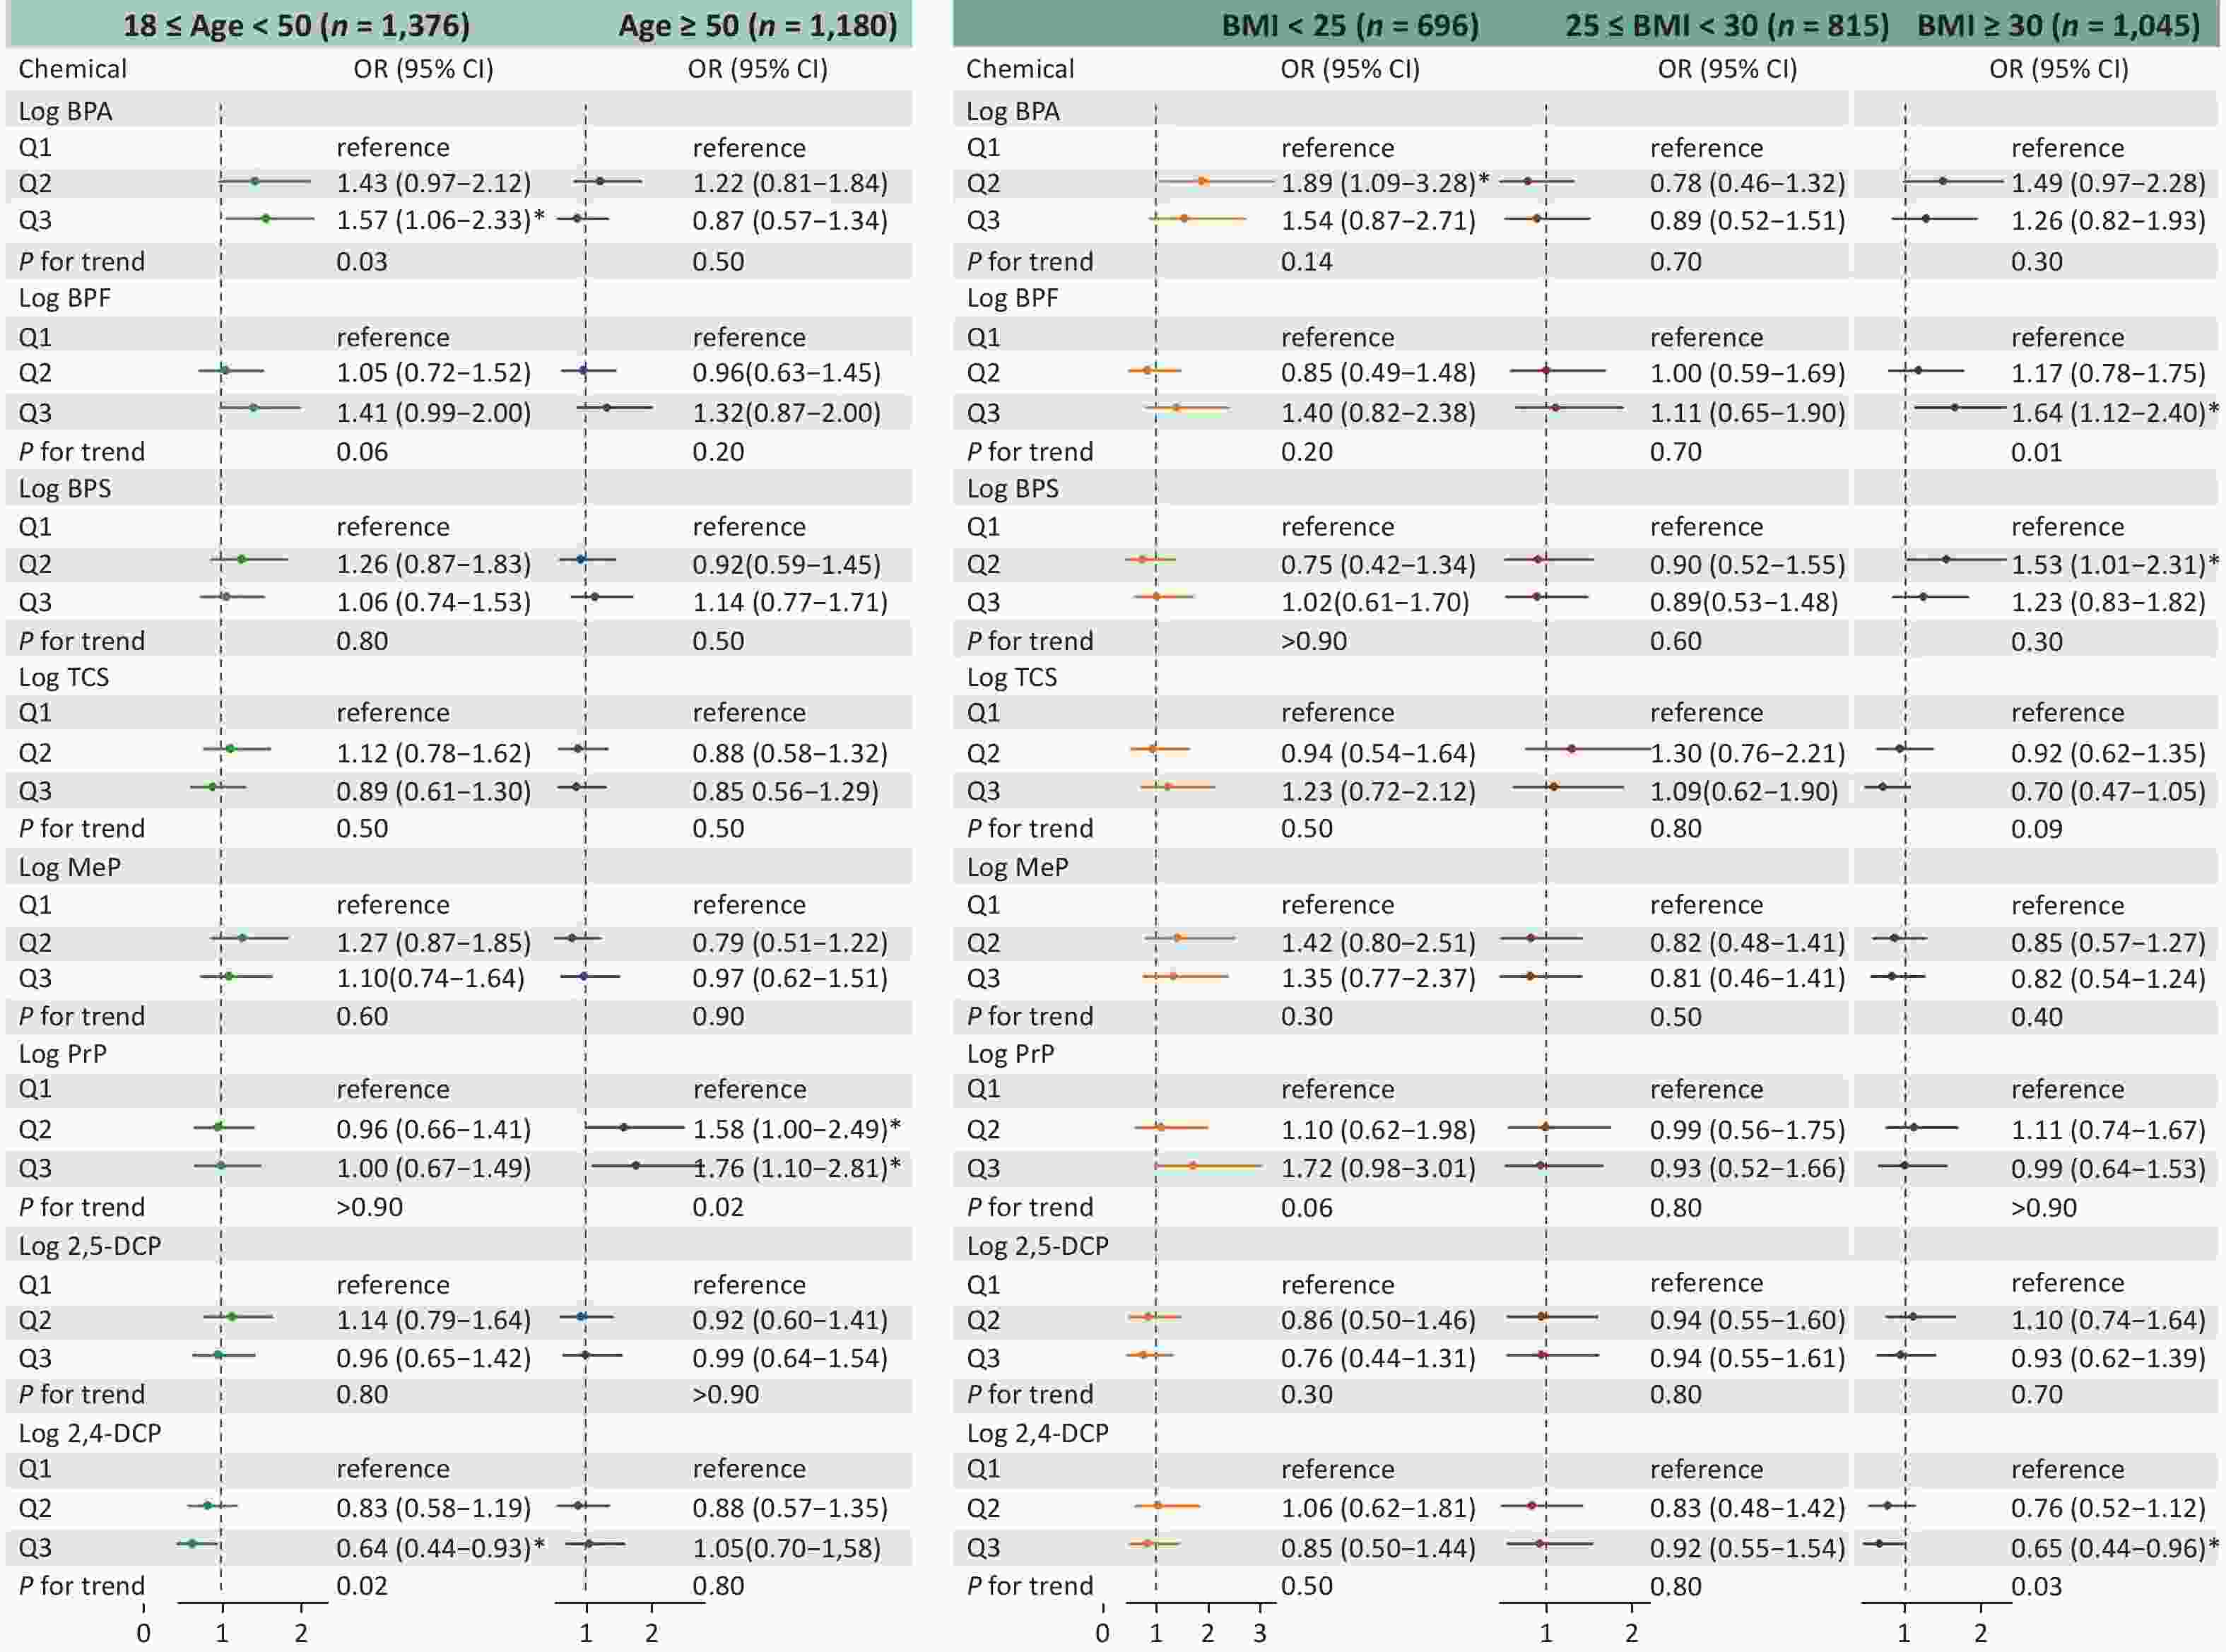
Figure 2. Adjusted OR (95 % CI) between phenol and paraben exposure and asthma stratified by age and BMI. BMI, body mass index; OR, odds ratio; CI, confidence interval; BPA, bisphenol A; BPF, bisphenol F; BPS, bisphenol S; TCS, triclosan; MeP, methylparaben; PrP, propylparaben; 2,5-DCP, 2,5-dichlorophenol; 2,4-DCP, 2,4-dichlorophenol.
-
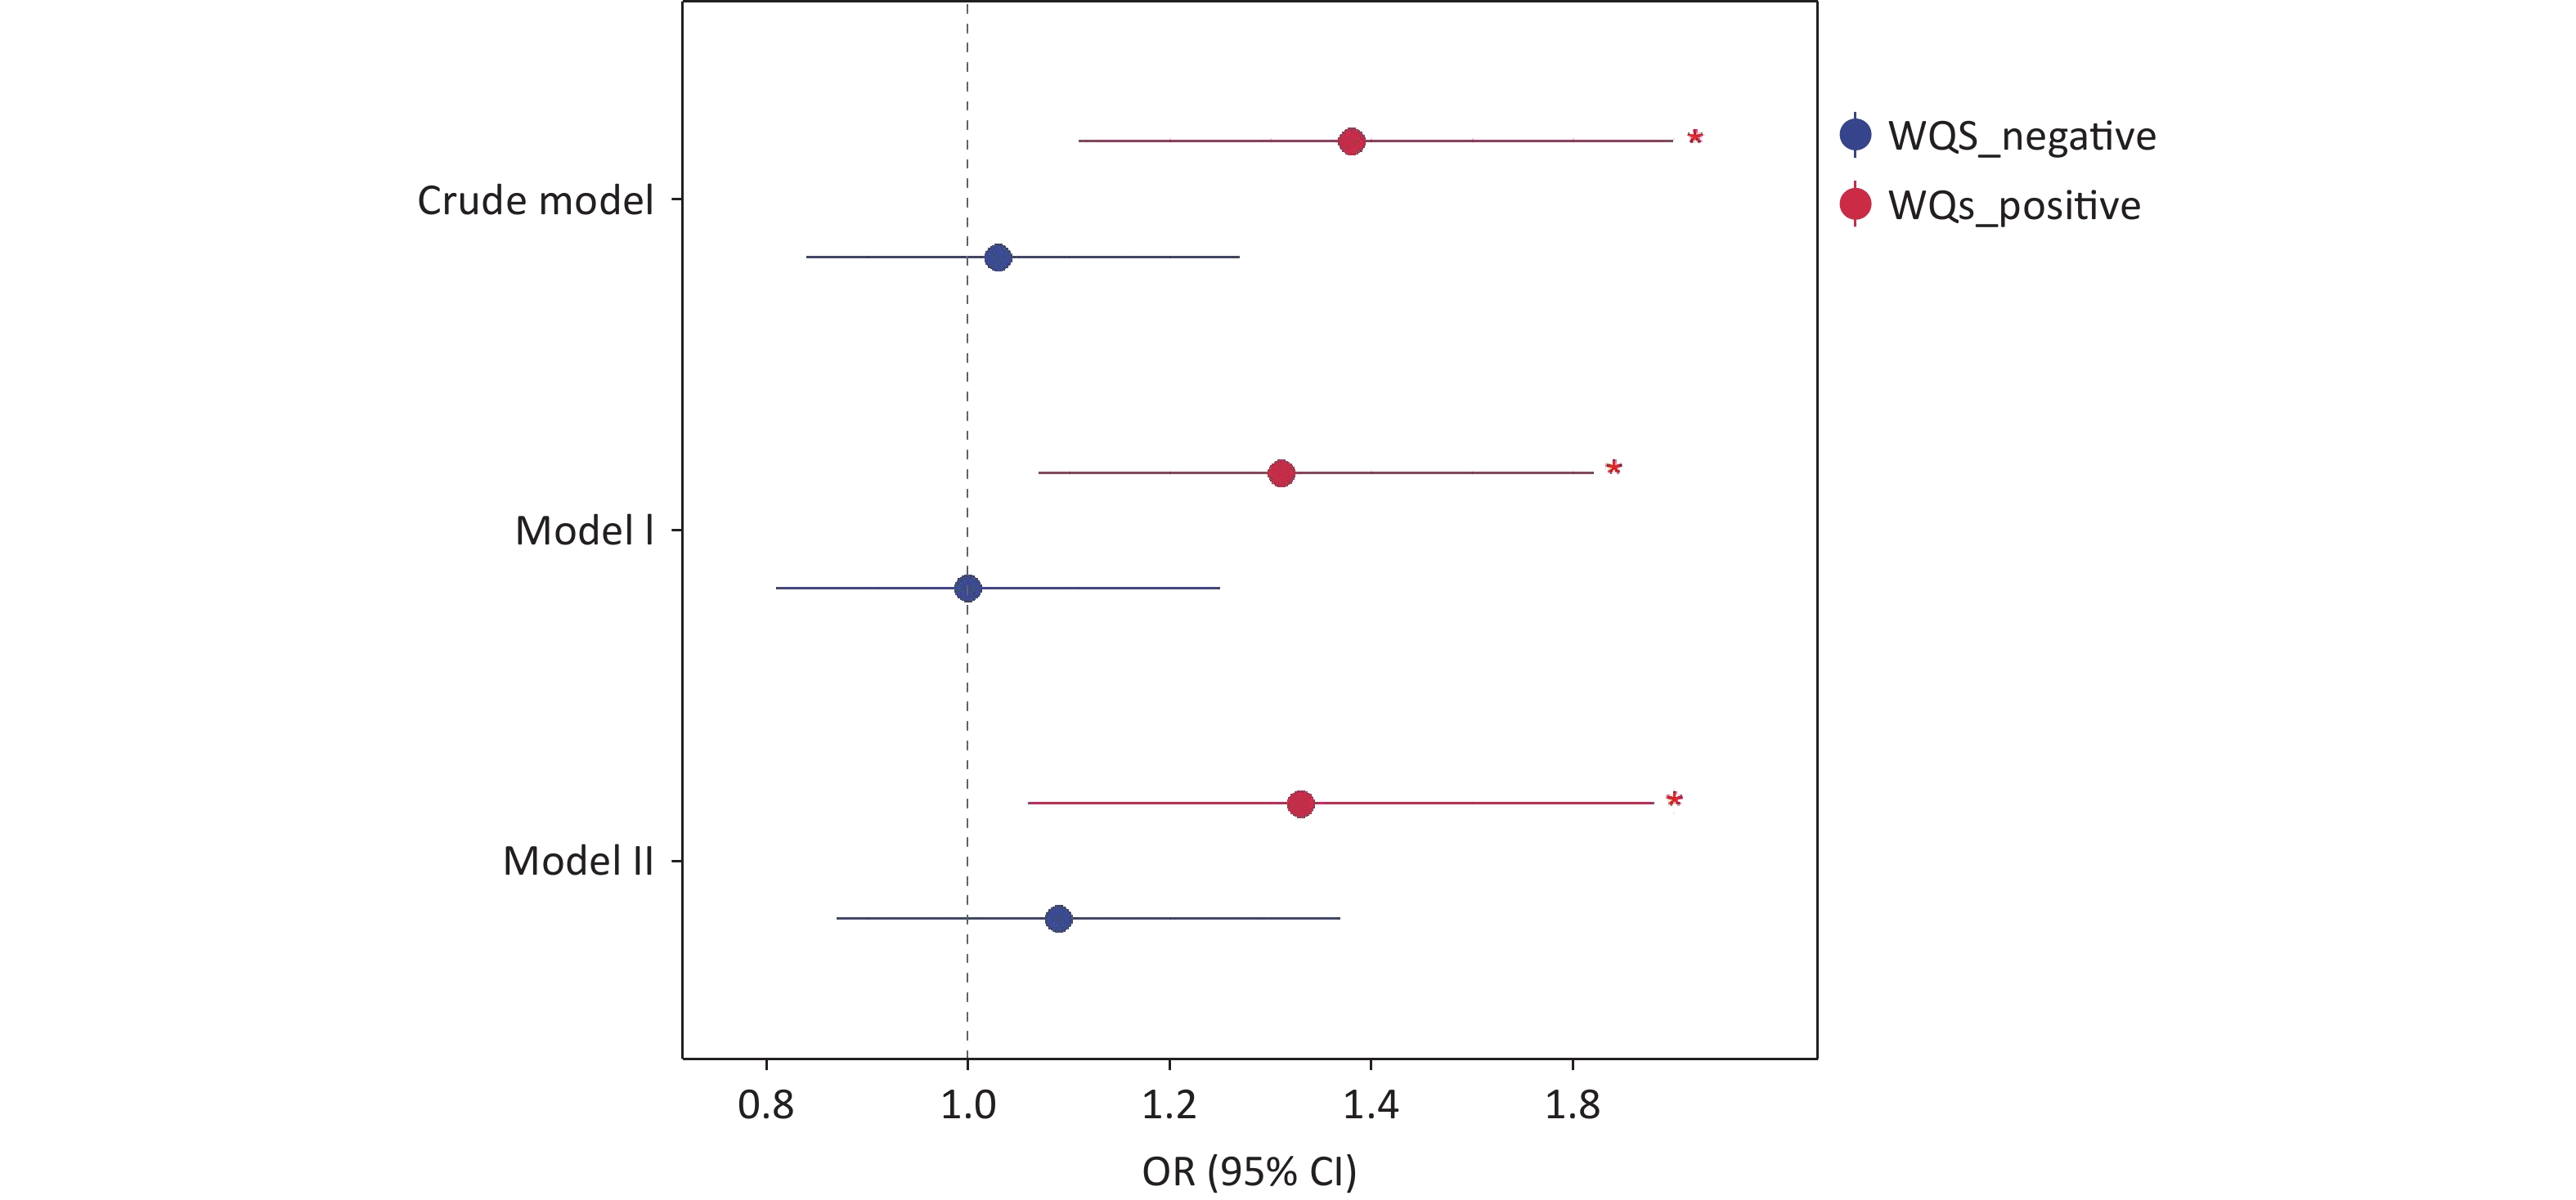
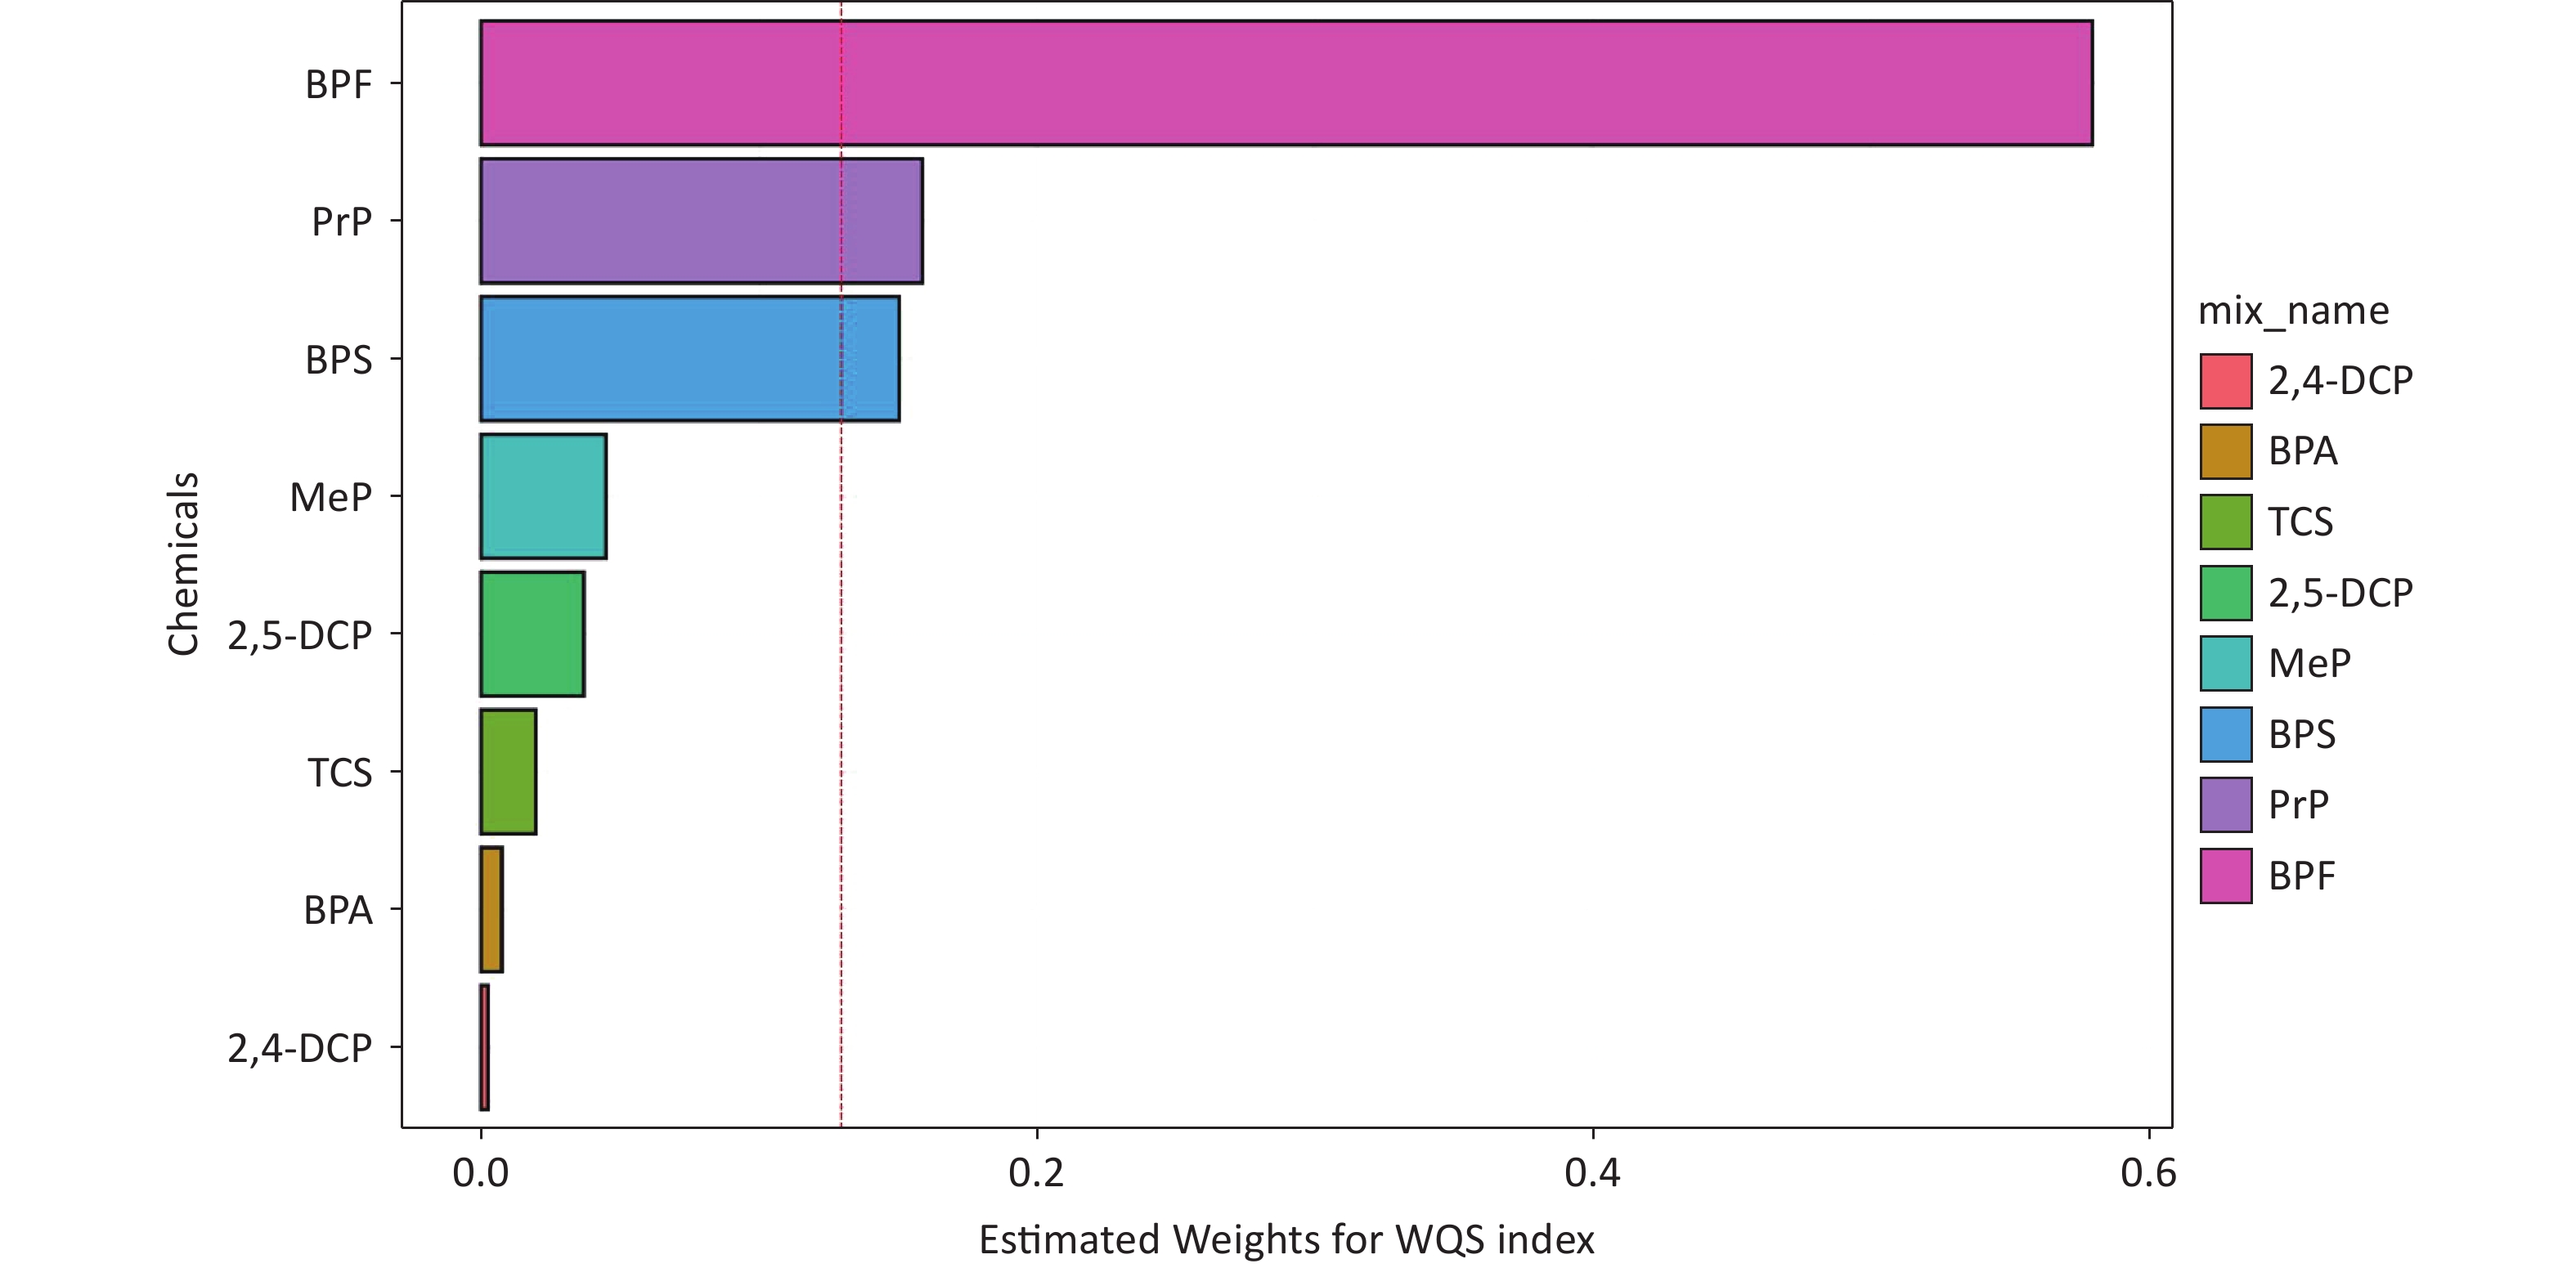
WQS regression was used to evaluate the cumulative effects of eight phenols and parabens on asthma risk. As shown in Figure 3, the WQS index revealed a consistent positive association between chemical mixtures and asthma across all models. The OR was 1.38 (95% CI, 1.11–1.70; P = 0.003) in the crude model, 1.31 (95% CI, 1.07–1.62; P = 0.010) in adjusted Model I (demographic covariates: age and sex) and 1.33 (95% CI, 1.06–1.68; P = 0.015) in adjusted Model II (all covariates). No statistically significant negative association was observed between exposure to phenols/parabens and asthma outcomes. Among the eight phenols and parabens, BPF exhibited the highest contribution to asthma risk, accounting for 56.6%, 61.1%, and 58.0% of the weighted effects in the crude model, Model I, and Model II, respectively (Supplementary Figure S3 and Figure 4). Following BPF, PrP and BPS were also significant contributors with weights of 15.9% and 15.1%, respectively, in Model II. In contrast, 2,4-DCP had the lowest weight among all models.
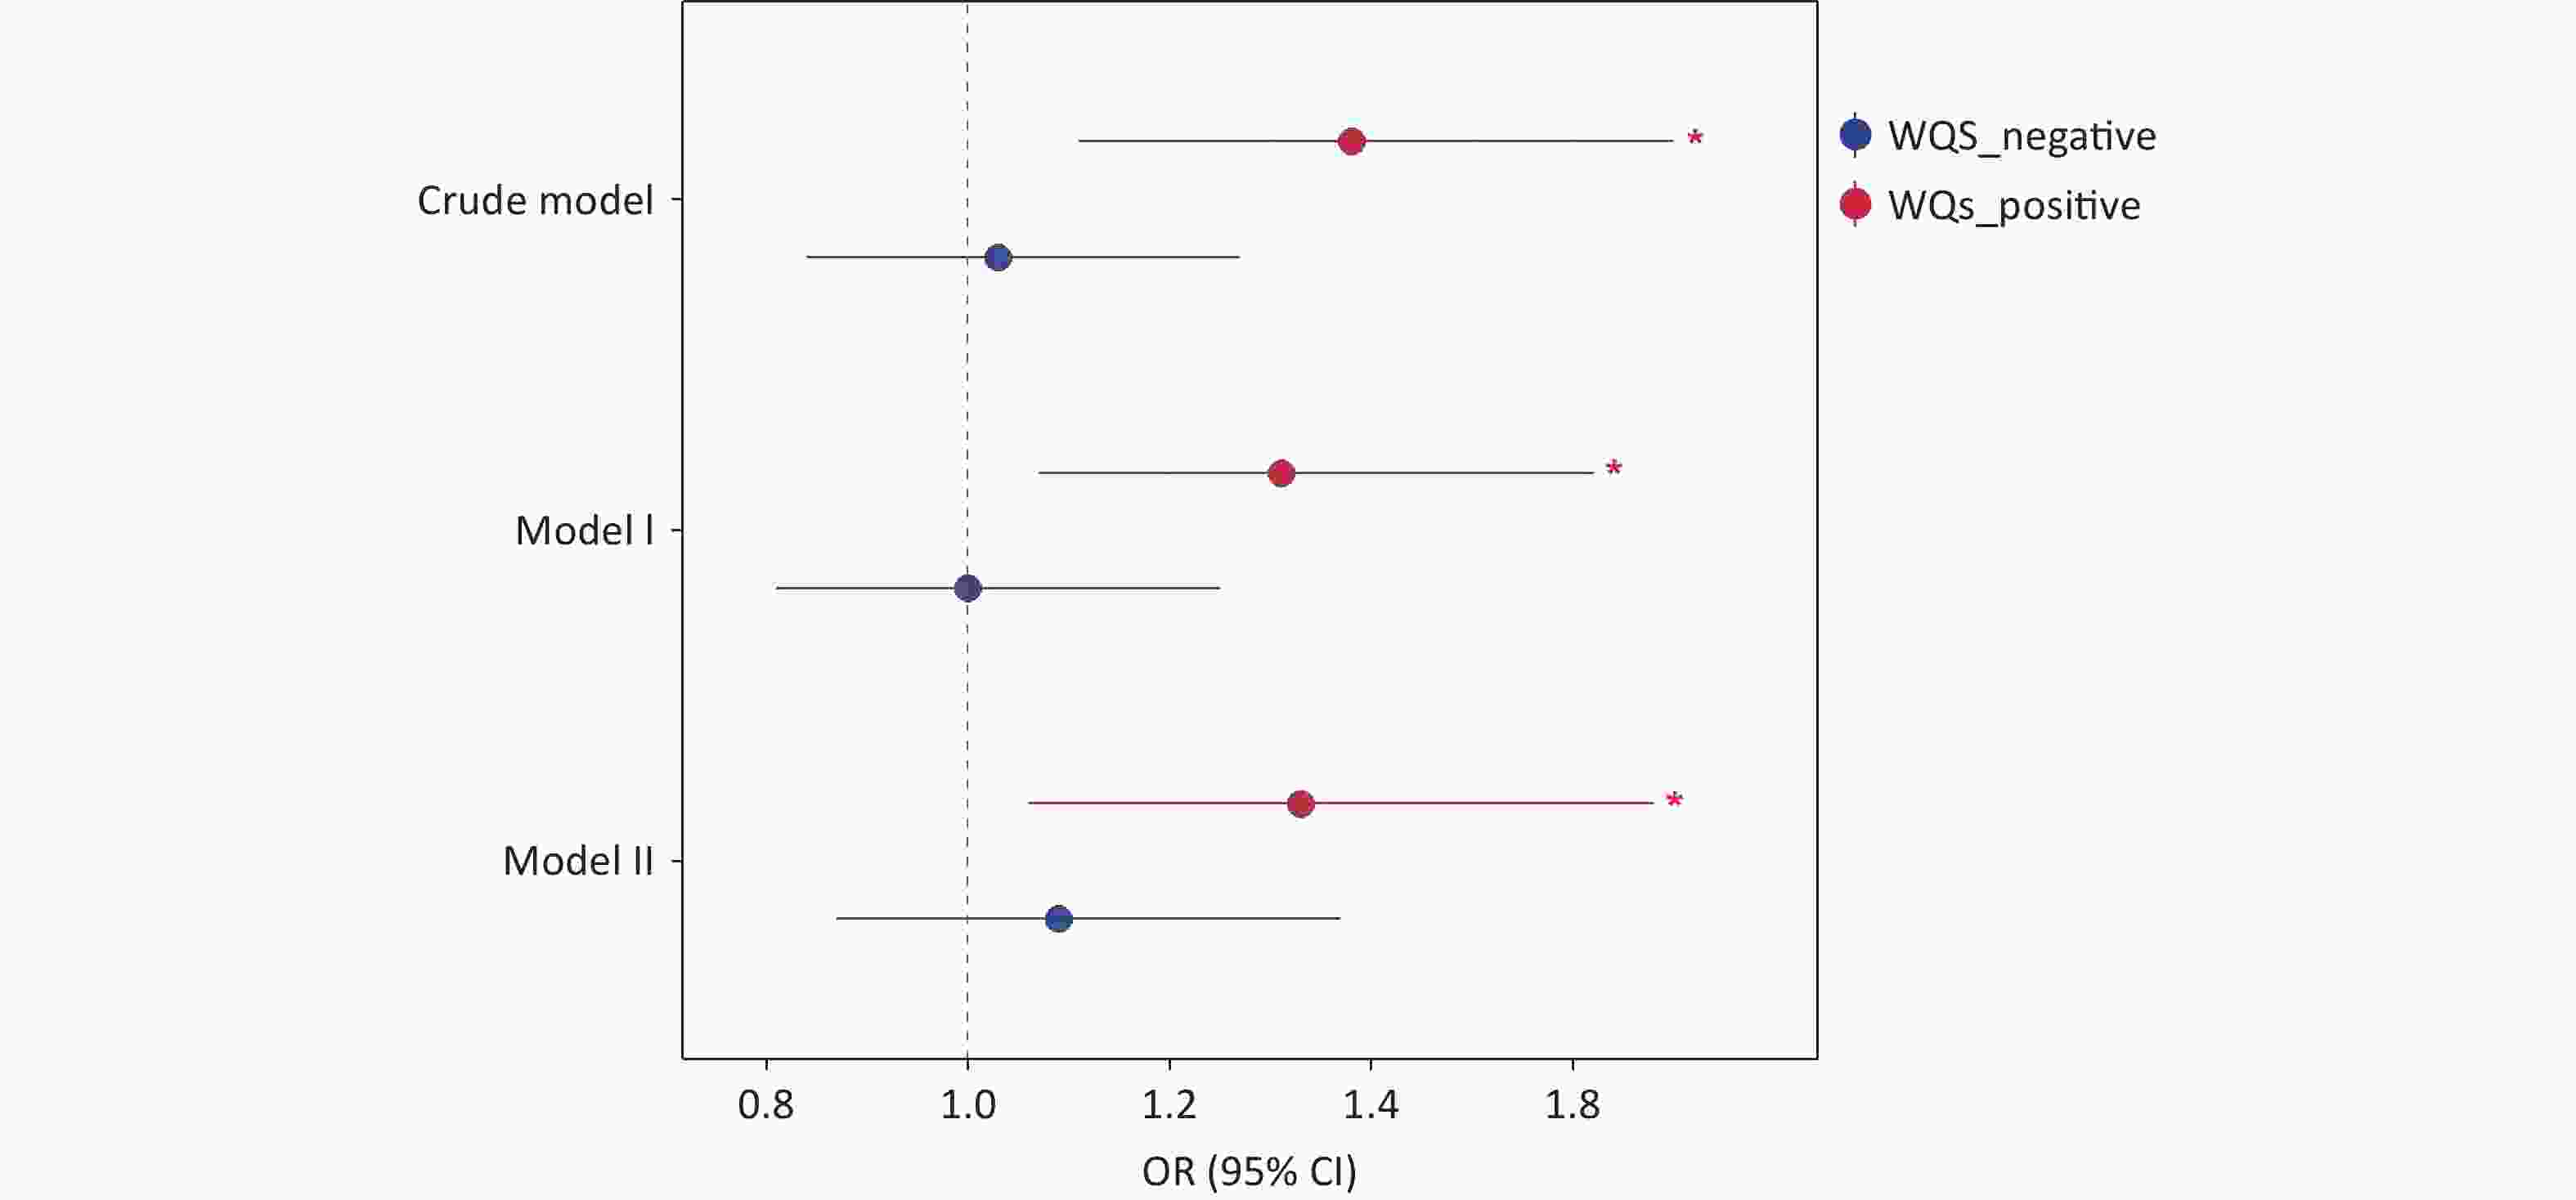
Figure 3. Results of WQS analysis on the association between phenol and paraben exposure and asthma. WQS, weighted quantile sum; OR, odds ratio; CI, confidence interval.
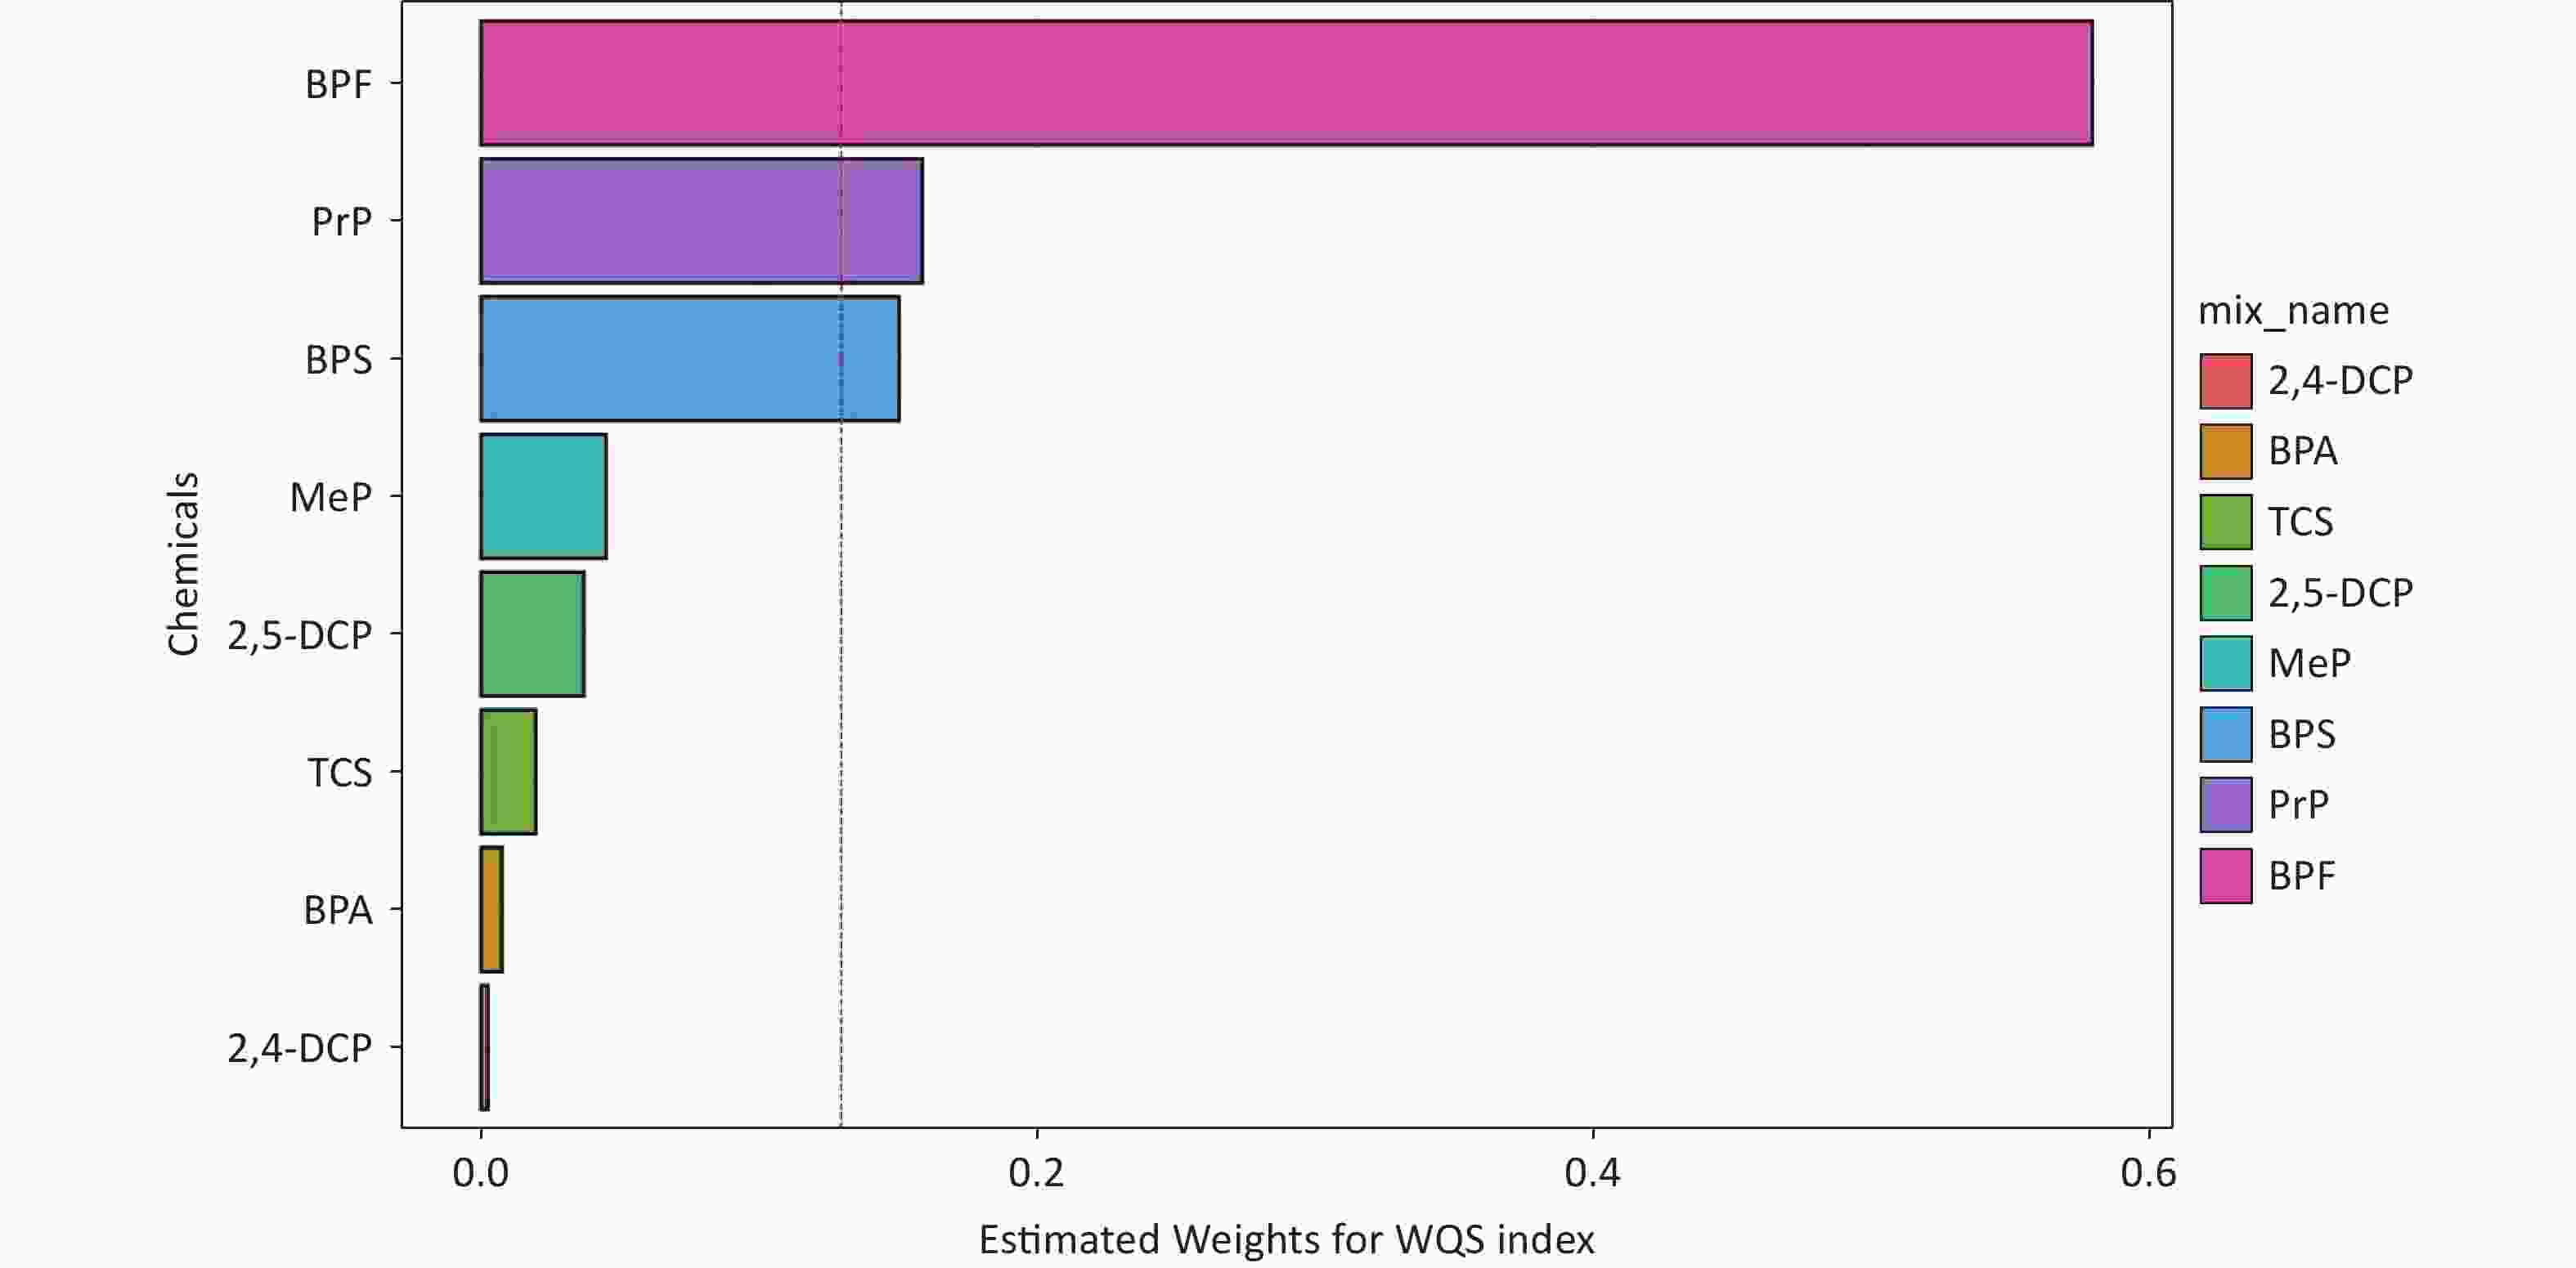
Figure 4. The weights of each phenol and paraben associated with asthma were calculated using the WQS model in Model II. Models II were adjusted for all covariates.WQS, weighted quantile sum; 2,4-DCP, 2,4-dichlorophenol; BPA, bisphenol A; TCS, triclosan; 2,5-dichlorophenol; MeP, methylparaben; BPS, bisphenol S; PrP, propylparaben; BPF, bisphenol F.
-
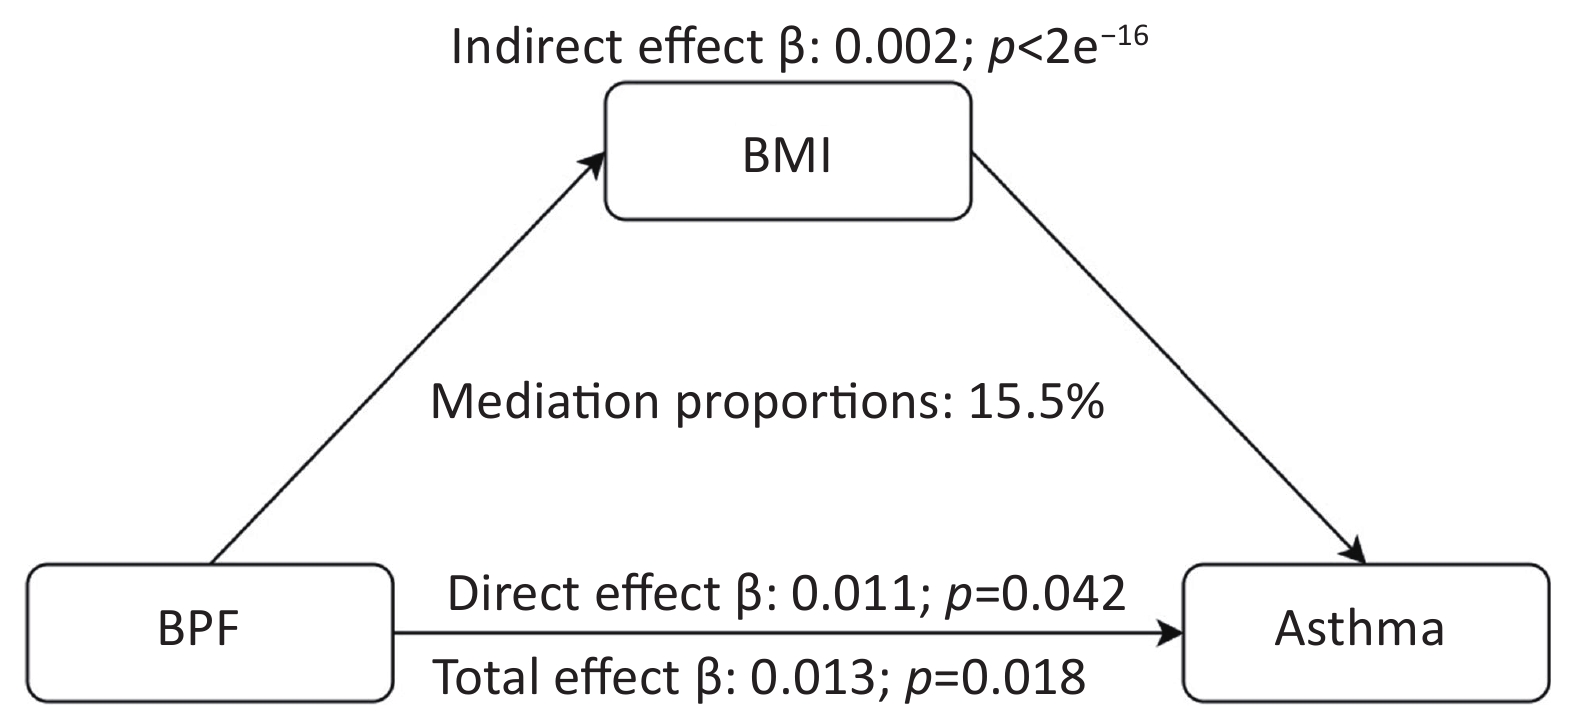
To establish the credibility of our findings, we conducted sensitivity analyses that excluded individuals with chronic bronchitis and COPD. The results are shown in Supplementary Table S3. The analysis confirmed that BPF exposure remained significantly and positively associated with asthma outcomes (P < 0.05), indicating the stability of the association. Moreover, the WQS model demonstrated high stability in sensitivity analyses by adjusting the number of bootstrap iterations. Mediation analysis was performed to explore the potential role of BMI in the relationship between exposure to the eight phenols, parabens, and asthma. First, we assessed the association between chemical mixtures and BMI. After adjusting for all covariates, BPF concentration showed a significant positive correlation with BMI (P < 0.001). Additionally, higher BMIs were significantly associated with an increased risk of asthma outcomes (P < 0.001). According to the mediation analysis presented in Figure 5, BMI was identified as a mediator of the positive relationship between BPF exposure and asthma risk. The mediation analysis revealed that BMI accounted for 15.5% of the total effect, indicating a partial mediating role in this association.
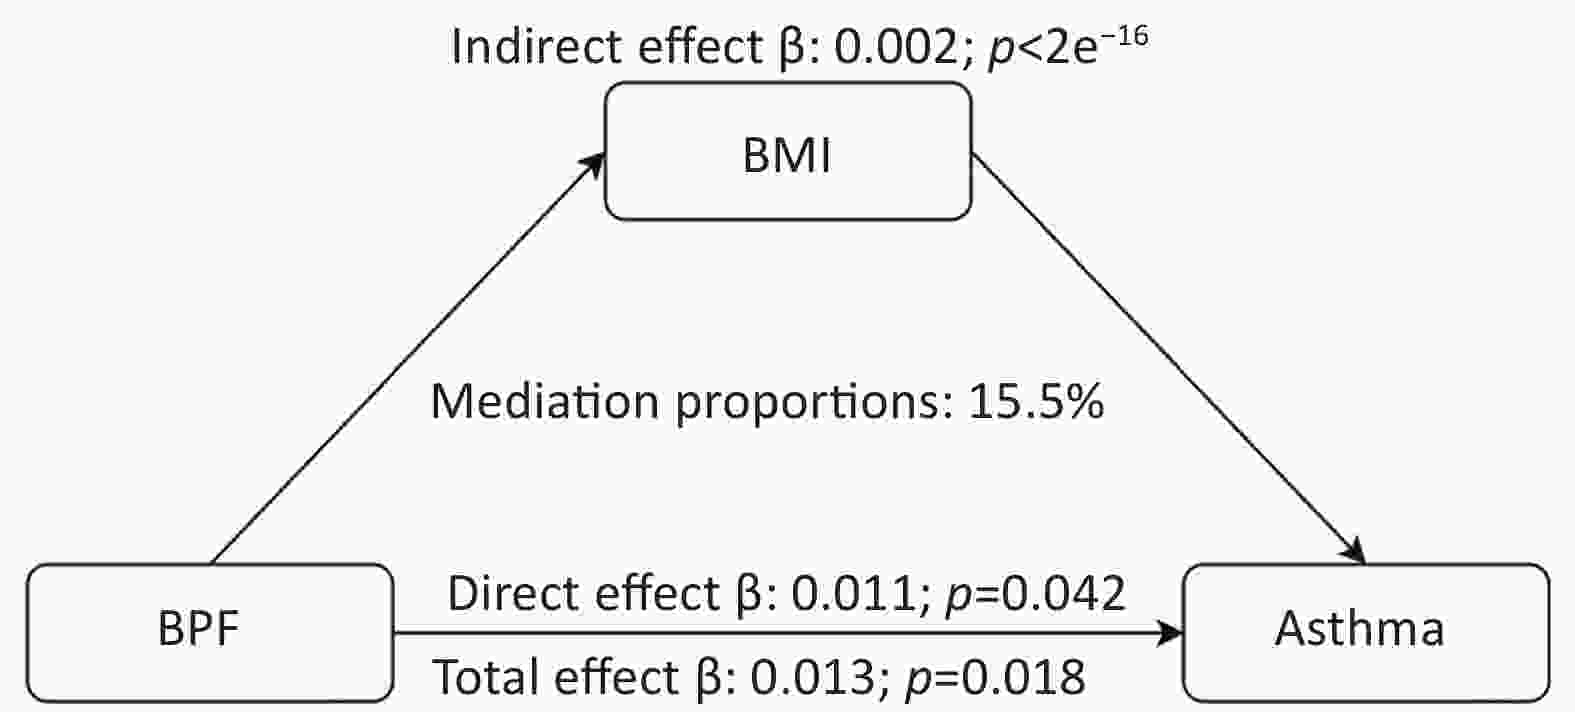
Figure 5. Estimated proportion of the association between BPF exposure and asthma by BMI. BMI, body mass index; BPF, bisphenol F.
-
This study investigated the effects of phenol and paraben exposure on asthma based on NHANES data, focusing on both individual and mixed chemical exposures. We found that the combined effect of phenol and paraben mixtures was positively associated with asthma, with BPF, PrP, and BPS exhibiting the highest contribution to asthma risk. In addition, BMI was identified as a potential mediator of the positive relationship between BPF exposure and asthma.
Regarding phenol exposure, many studies have confirmed a positive association between BPA exposure, lung function, and asthma risk[20,37,38]. Similarly, BPA substitutes such as BPF and BPS have been linked to impaired lung function and increased asthma risk[39]. A recent cross-sectional study in Korea found that urinary BPS levels were strongly associated with an asthma diagnosis in adolescent girls, especially after 60 months of exposure[40]. Our study provides evidence that associations between BPS, BPF, and asthma are also present in adults, in addition to children. However, the reported results are inconsistent with those of other studies. An inverse correlation was found between exposure to environmental chemicals and asthma symptoms among children in the urban areas of the United States[41]. In studies of low-income children in the United States, findings on BPS and BPF have not consistently shown an association with asthma symptoms[42]. Another study of European birth cohorts found conflicting relationships between BPF and BPS and evaluated respiratory outcomes[21]. These discrepancies could be related to differences in sample size, population age, and methods employed to analyze single versus combined exposures. In contrast, animal studies have provided mechanistic insights in support of these findings. Parental exposure to BPF during pregnancy and lactation has been shown to induce pulmonary toxicity in offspring mice[43], while BPS exposure exacerbates allergic asthma responses by enhancing the Th2 polarization response[44]. These experimental findings are consistent with our epidemiological results, suggesting the potential biological plausibility of the observed associations.
Regarding parabens, epidemiologic evidence suggests that exposure to parabens increases the risk of not only allergic sensitization[5,45] but also respiratory disease[46,47]. An NHANES study (2005–2014) of 450 children with asthma found that higher levels of PrP and MeP in urine were related to an increased number of emergency department visits among boys[48]. Furthermore, a strong correlation between PrP and asthma prevalence was observed in adults in our study. However, research from the European Human Early-Life Exposome (HELIX) cohort discovered no link between PrP and a decrease in the percent anticipated value of 1-s percent predicted values (FEV1%)[49]. Animal studies have also highlighted the potential differential effects of single and mixed paraben exposures on lung health[46], underscoring the complexity of these relationships.
Our study demonstrates that the association between phenol and paraben exposure and asthma is significantly modulated by age and BMI. Stratified analysis indicated a significant association between BPF exposure and asthma in individuals with obesity (BMI ≥ 30 kg/m2). Additionally, age-stratified analysis revealed differential effects of exposure: an association between BPA exposure and asthma was observed in the younger participants (age ≥ 18 and < 50 years), whereas a correlation between PrP and asthma was identified in the older individuals (age ≥ 50 years). This age-related disparity may be attributed to the evolving pathophysiological characteristics of asthma with age. Allergic asthma is more prevalent in younger individuals; however, its incidence gradually declines with age, leading to a higher proportion of non-allergic asthma in older adults[50]. Furthermore, aging is accompanied by structural changes in lung function, including reduced lung elastic recoil, increased chest wall stiffness, and respiratory muscle weakness, which may contribute to severe asthma symptoms in older adult patients[51].
BMI is a crucial indicator of body fat content and serves as a significant risk factor and modifier of asthma. Around 250,000 new asthma cases in the United States are linked to obesity each year[28]. One study indicated that the asthma prevalence in lean adults was 7.1%, while it was 11.1% in adults with obesity (BMI ≥ 30 kg/m2)[52]. Furthermore, a meta-analysis involving over 300,000 adults revealed a dose–response relationship between BMI and asthma[28]. Regarding the clinical presentation, asthma tends to be more severe in adults with obesity than in lean adults, with worse asthma control and a lower quality of life[53,54]. Numerous epidemiological and experimental animal studies have demonstrated an association between environmental EDCs and obesity[55,56]. In the present study, exposure to high BPF levels was significantly associated with asthma risk in the obese group, suggesting that BPF may be a potential risk factor for asthma in obese individuals. Notably, we found that the association between BPF and asthma was partially mediated by BMI. This further emphasizes the importance of interventions targeting overweight and obese individuals to reduce the incidence of asthma. In addition to BMI, other factors may mediate the development of asthma. Exposure to EDC mixtures induces oxidative stress pathways and promotes asthma development through airway tissue damage[57]. EDC exposure further disrupts the immune function by altering key biomarkers. Critically, immune mediators, particularly IgE, have been identified as significant pathways through which EDCs influence the development of asthma[58]. Certain EDCs directly impair thyroid hormone homeostasis. Such dysregulation may adversely affect lung development and immune responses, establishing thyroid function as a potential mediator of asthma pathogenesis. Importantly, thyroid autoantibody status and iodine nutrition may potentiate this pathway[59].
This study exclusively enrolled adults aged 18 years and older because of the significant differences in inflammatory phenotypes and pathological mechanisms between childhood and adult asthma. Childhood asthma is predominantly characterized by a T2-high inflammatory phenotype, featuring elevated blood eosinophil levels, increased fractional exhaled nitric oxide (FeNO) levels, and heightened allergy-related biomarkers such as IgE[60]. This phenotype typically originates from early life pathological processes involving genetic mechanisms such as specific gene variants and molecular alterations during immune development[61]. In contrast, adult asthma frequently presents with a T2-low inflammatory phenotype (non-eosinophilic or non-allergic inflammation) alongside the T2-high phenotype[62]. Its molecular mechanisms may involve later-life exposure (such as environmental exposure) and cumulative risk factors (such as chronic respiratory diseases and obesity), resulting in a more complex pathophysiology[63]. Adult diseases encompass broader immune and non-immune pathways such as neutrophil involvement, hormonal modulation, and structural remodeling. Consequently, our findings apply solely to adults and cannot be extrapolated to children.
This study had limitations regarding the inclusion of potential confounding covariates. Although factors such as occupation, dietary habits, and PM2.5 exposure were initially identified as putative confounders during the study design phase, they were not included in the analytical models. The reasons are as follows: Firstly, evidence suggests an association between PM2.5 levels exceeding 12 μg/m3 and an increased risk of asthma[64,65]. However, during the study period (2013–2016), recorded PM2.5 levels across all US states were consistently below 10 μg/m3[66], well under this potential risk threshold. Furthermore, the lack of granular geographic location data for participants within the NHANES database precluded the assignment of specific local PM2.5 exposure levels. Consequently, PM2.5 was not included as a covariate in the final analysis. Second, occupational factors could not be incorporated as covariates because of the incompatibility between survey cycles. The OCD241 occupational classification standard employed in the 2013–2014 NHANES data lacked corresponding assessment items in the 2015–2016 cycle, thereby preventing a unified classification scale across the study period. Finally, dietary habits were excluded as covariates after reviewing the relevant NHANES questionnaires. Key items, such as “DBD900 - Number of meals from fast food or pizza places,” utilized overly broad response categories (e.g., “1 to 21 meals per week,” “None,” or “More than 21 meals per week”). This level of granularity was deemed insufficient to comprehensively characterize the participants' overall dietary patterns.
Our study had several strengths. To the best of our knowledge, this is the first study to report an association between mixed phenol and paraben exposure and asthma in adults. Second, this study simultaneously evaluated a relatively large number of exposures (n = 8), for which traditional statistical methods are less applicable. To address this issue, we constructed multivariate logistic regression and multi-pollutant models. This approach helped overcome several limitations, including model misspecification, violations of linearity, and issues related to multiple comparisons. Third, we used BMI as an important physical indicator, which, in combination with mediation analyses, allowed us to study the mechanisms involved in greater depth and to provide insights for future research directions.
However, the interpretation of the results of this study has the following limitations. First, the generalizability of the findings may have been restricted to a specific study population. This limitation arises from the cross-sectional study design, which cannot help establish the temporal sequence between exposure, mediators, and outcomes, nor can causal inferences be made. Second, the study used randomized urine samples from a single time point rather than using 24-h urine, which may introduce measurement errors due to individual variability in metabolite excretion throughout the day. Third, the WQS model does not account for complex survey sampling weights, which may introduce bias into the estimates. Finally, asthma outcomes were defined using a self-reported questionnaire, making them susceptible to recall bias.
-
In conclusion, using NHANES 2013–2016 data from the U.S. adult population, we provide new epidemiological evidence that mixed exposure to phenols and parabens in individual urine samples is significantly associated with asthma outcomes. Specifically, BPF, PrP, and BPS were identified as major contributing factors. Furthermore, BMI may also play an important role in this association. These results demonstrate an association between environmental mixtures and asthma outcome and highlight the need for further research to confirm their relationships and underlying mechanisms.
Individual and Joint Association of Phenol and Paraben Exposure with Asthma Outcomes among US Adults: A Nationally Representative Cross-sectional Study
doi: 10.3967/bes2025.163
- Received Date: 2025-04-17
- Accepted Date: 2025-08-11
-
Key words:
- Phenol /
- Paraben /
- Asthma /
- Chemical mixtures /
- NHANES
Abstract:
The authors declare that there are no conflicts of interest.
Ethical review and approval are not applicable to our study because the data of all participants used in this study are publicly available.
| Citation: | Yuehan Liu, Jing Du, Lan Zhang, Jiale Ren, Yuzhu Zhao, Yushen Jin, Yumin Niu, Bing Shao. Individual and Joint Association of Phenol and Paraben Exposure with Asthma Outcomes among US Adults: A Nationally Representative Cross-sectional Study[J]. Biomedical and Environmental Sciences. doi: 10.3967/bes2025.163

|

 Quick Links
 DownLoad: