
-
Depressive disorders are a major cause of disability[1] and have become more prevalent, affecting an estimated 264 million people affected worldwide[2]. Almost one in five people experiences one episode at some point in their lifetime[3], creating a substantial burden on health systems[4]. Depression is a common comorbidity of many chronic illnesses[5], longitudinal cohort studies have shown that elevated depressive symptoms are related to a higher risk of mortality risk[6], dementia[7], cardiovascular incidence[8], and stroke[9]. Mechanisms may involve the long-term accumulation of biological damage, such as hypertension and atherosclerosis[10,11]. However, depressive symptoms tend to fluctuate over time[4], with the onset of depression being primarily gradual, but sometimes abrupt. These studies did not fully capture the persistent effects of these symptoms on cardiovascular outcomes, as a single-point measurement of depression is insufficient for representing the potentially, individualistic fluctuations in depressive symptoms.
Limited studies have conducted repeated assessments of depressive symptoms. An English longitudinal study found that memory, executive function, and orientation declined with the increasing duration of depressive symptoms[12]. Another study suggested that long-term cumulative depressive symptoms were associated with dementia and all-cause mortality[13]. Evidence from the China Health and Retirement Longitudinal Study (CHARLS) showed that individuals with increasing and persistent depressive symptoms had an elevated risk of incident cardiovascular disease (CVD)[14]. In a similar study, stable high and newly started depressive symptoms were associated with increased stroke risk[15]. Nevertheless, whether the cumulative progressive burden of depressive symptoms is associated with a risk of cardiovascular outcomes, such as CVD, remains a major knowledge gap in our understanding.
Therefore, we examined the association between cumulative depressive symptoms and incident CVD among middle-aged and older adults, hypothesizing that an association does exist.
-
Data were analyzed from two sources: first, CHARLS, a prospective and nationally representative cohort of community-dwelling adults in China. Overall, 17,708 participants aged ≥ 45 years were recruited using a multistage probability sampling procedure from 450 communities. Second, the Health and Retirement Study (HRS), a longitudinal panel study that surveyed a nationwide representative sample of approximately 20,000 middle-aged and older adults in the United States. Since 1992, HRS participants have been re-examined biennially to collect their health and economic information. Details of these two cohorts can be found elsewhere[16-18]. Ethical approval for all CHARLS waves was granted by the Institutional Review Board of Peking University (IRB00001052-11015), and the HRS was approved by the Institutional Review Board of the University of Michigan and National Institute on Aging (HUM00061128). Written informed consent was obtained from all participants. This study was conducted in accordance with the Strengthening the Reporting of Observational Studies in Epidemiology reporting guidelines.
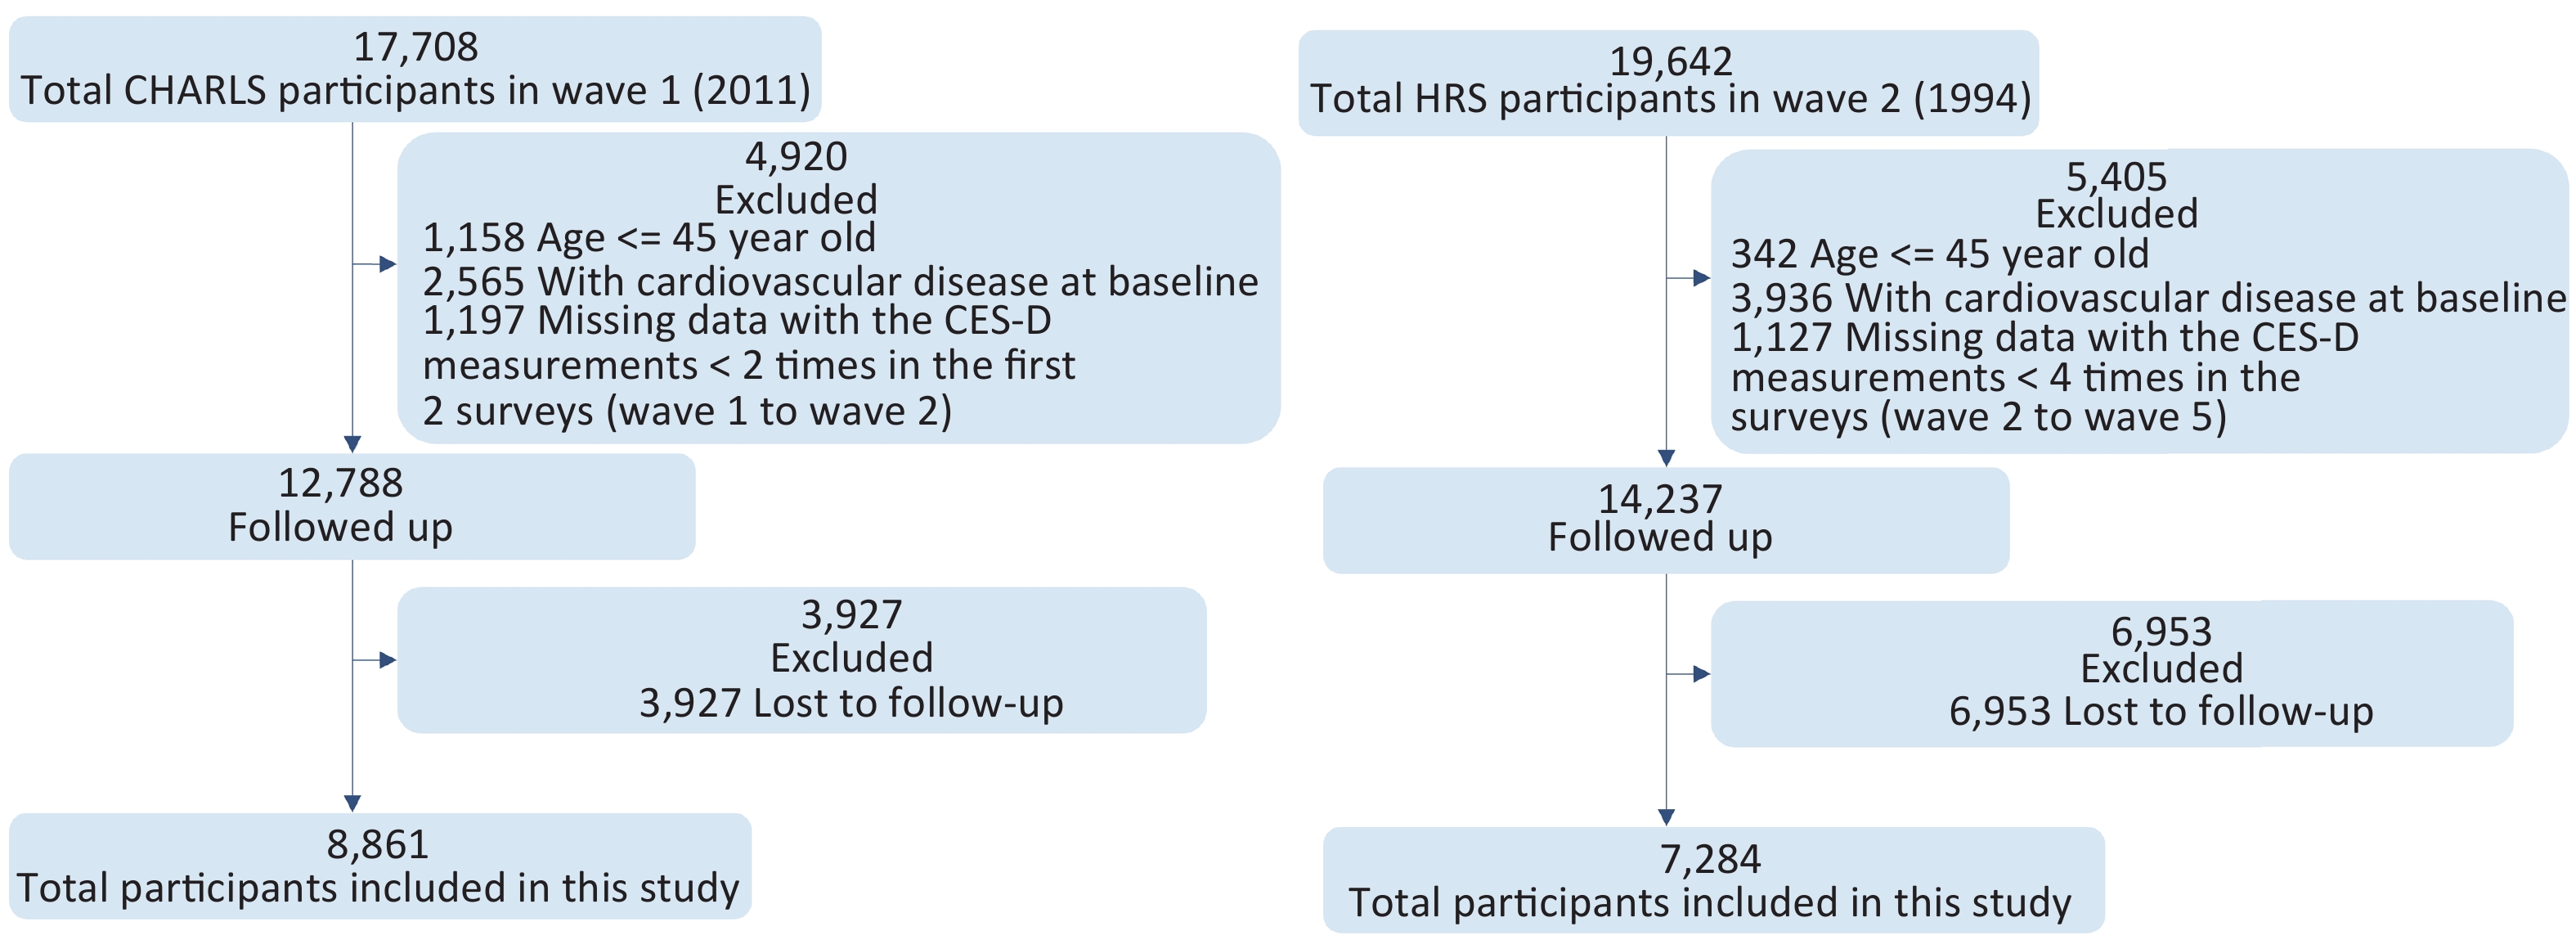
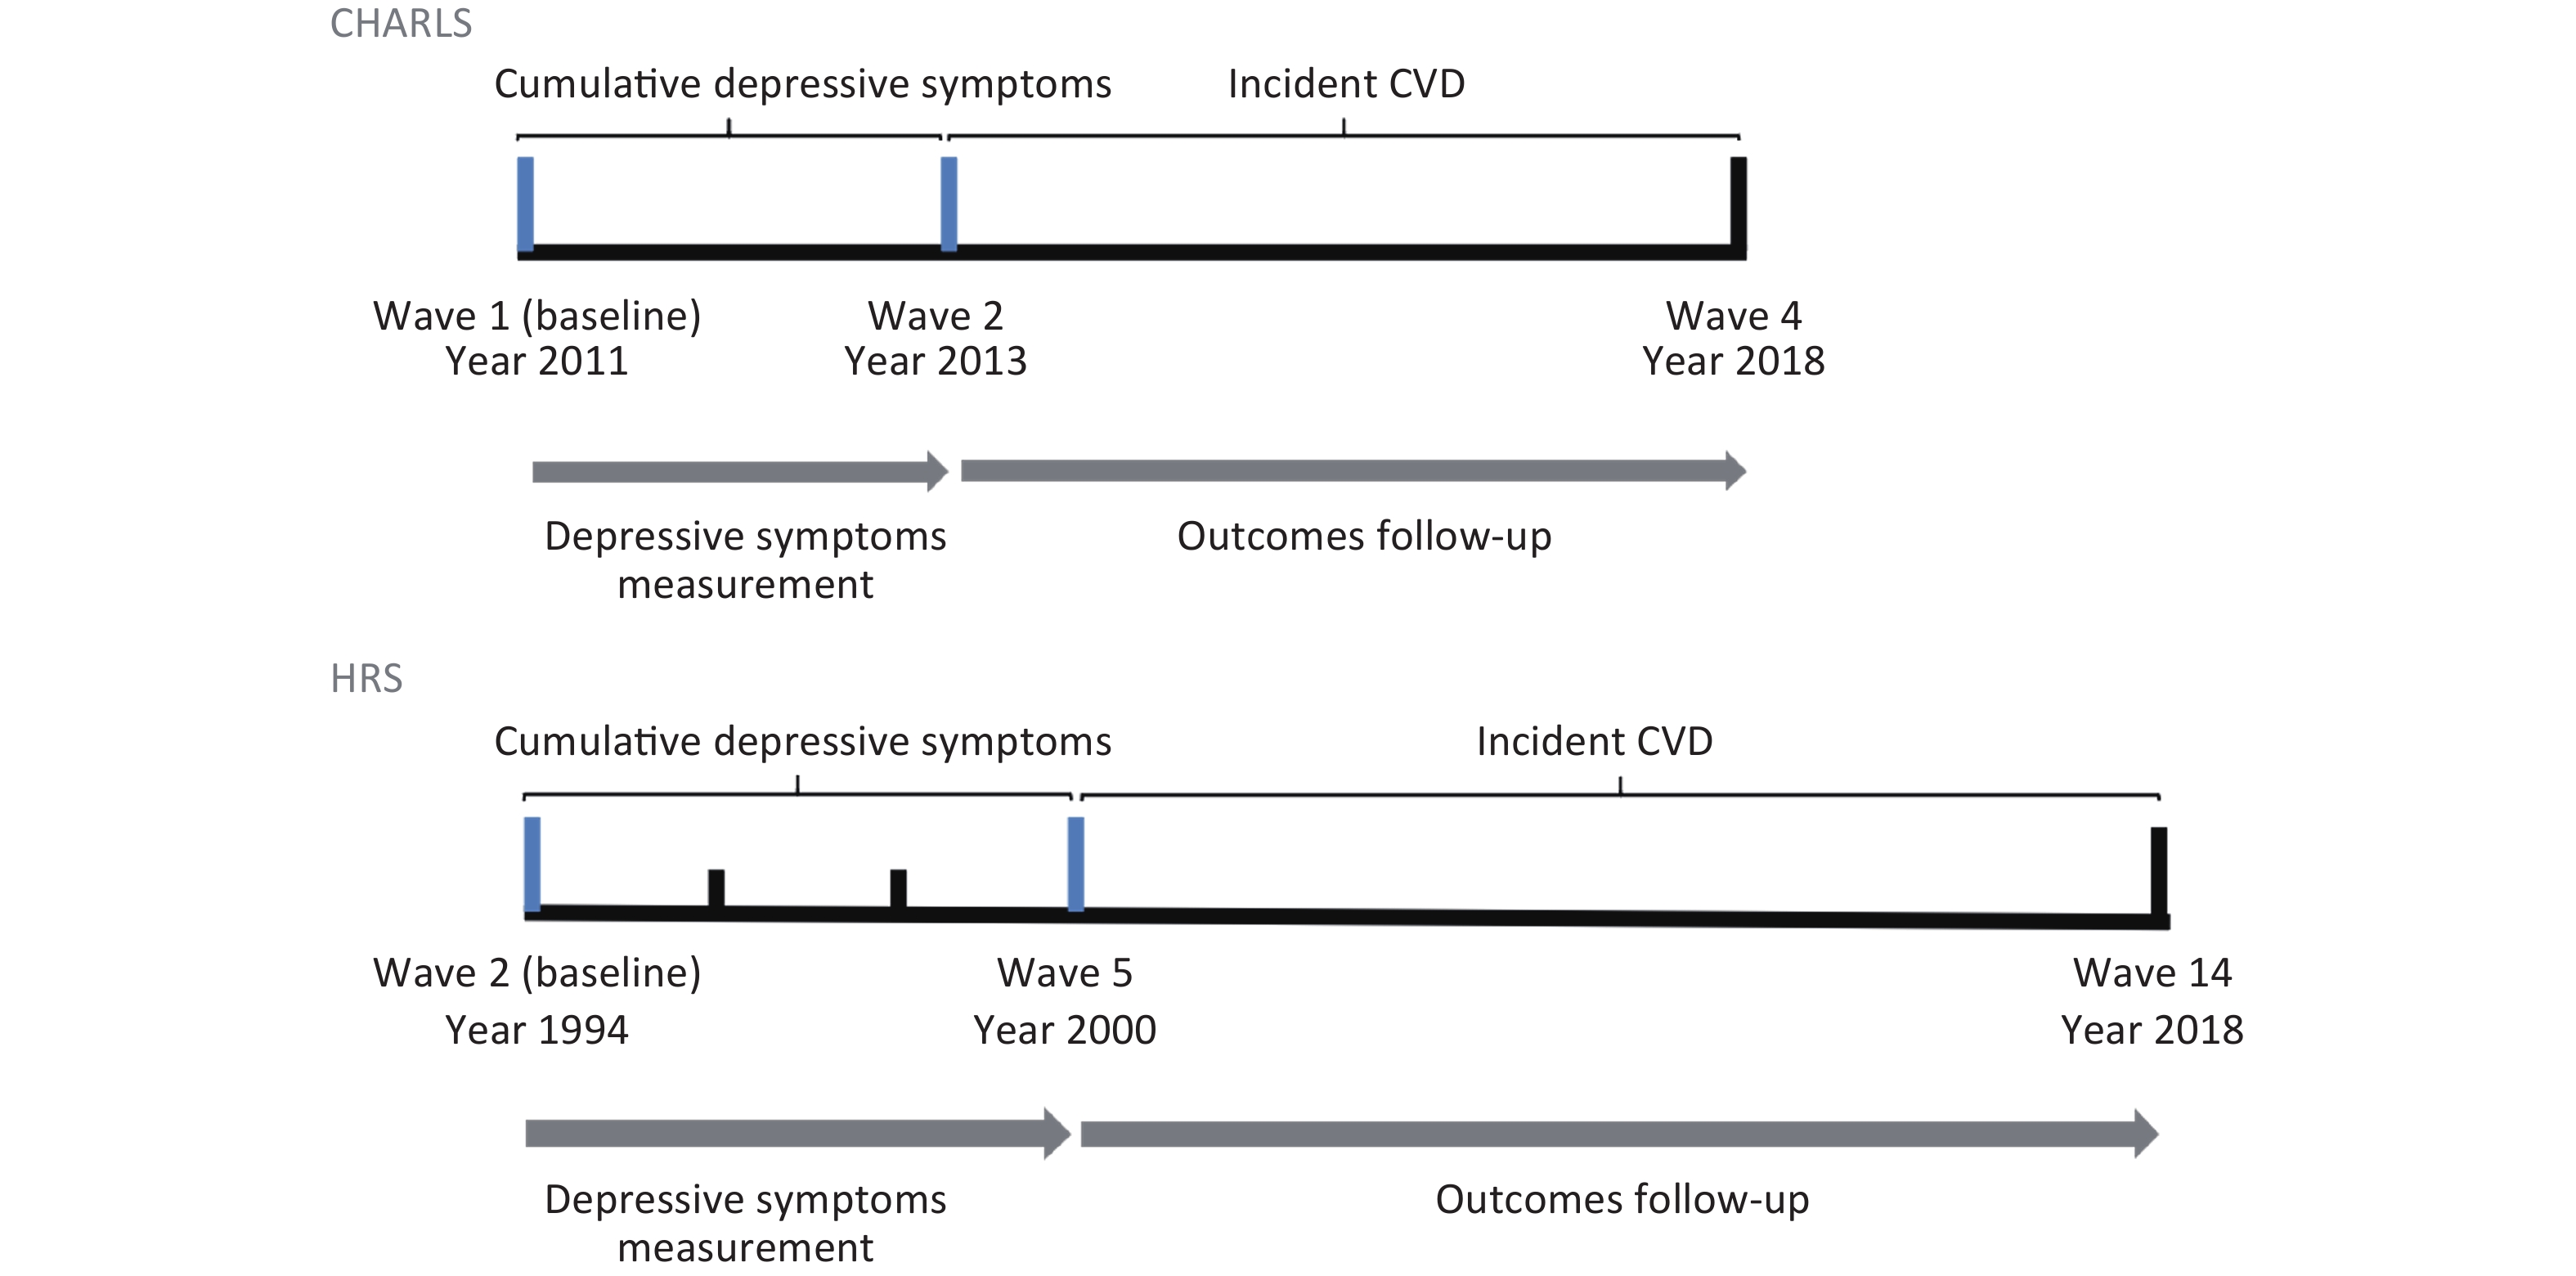
The baseline of the current analysis was set as Wave 1 (2011) for CHARLS and Wave 2 (1994) for HRS. For CHARLS and the HRS, we used data from 2 years post-baseline and 6 years, respectively, to evaluate cumulative depressive symptoms. Then, participants were followed-up, with outcomes assessed from Wave 2 (2013) in the CHARLS and Wave 5 (2000) in the HRS until 2018. Figure 1 displays the timeline of this study. The exclusion criteria included: 1) missing measurements of depressive symptoms in two assessments over 2 years (CHARLS) and four assessments during the first 6 years (HRS); 2) patients with a prior history of CVD; and 3) patients lost to follow-up. Overall, 16,145 participants enrolled in this study, including 8,861 CHARLS participants and 7,284 HRS participants. Figure 2A and 2B presents a flowchart showing the inclusion process of the study population in both cohorts.
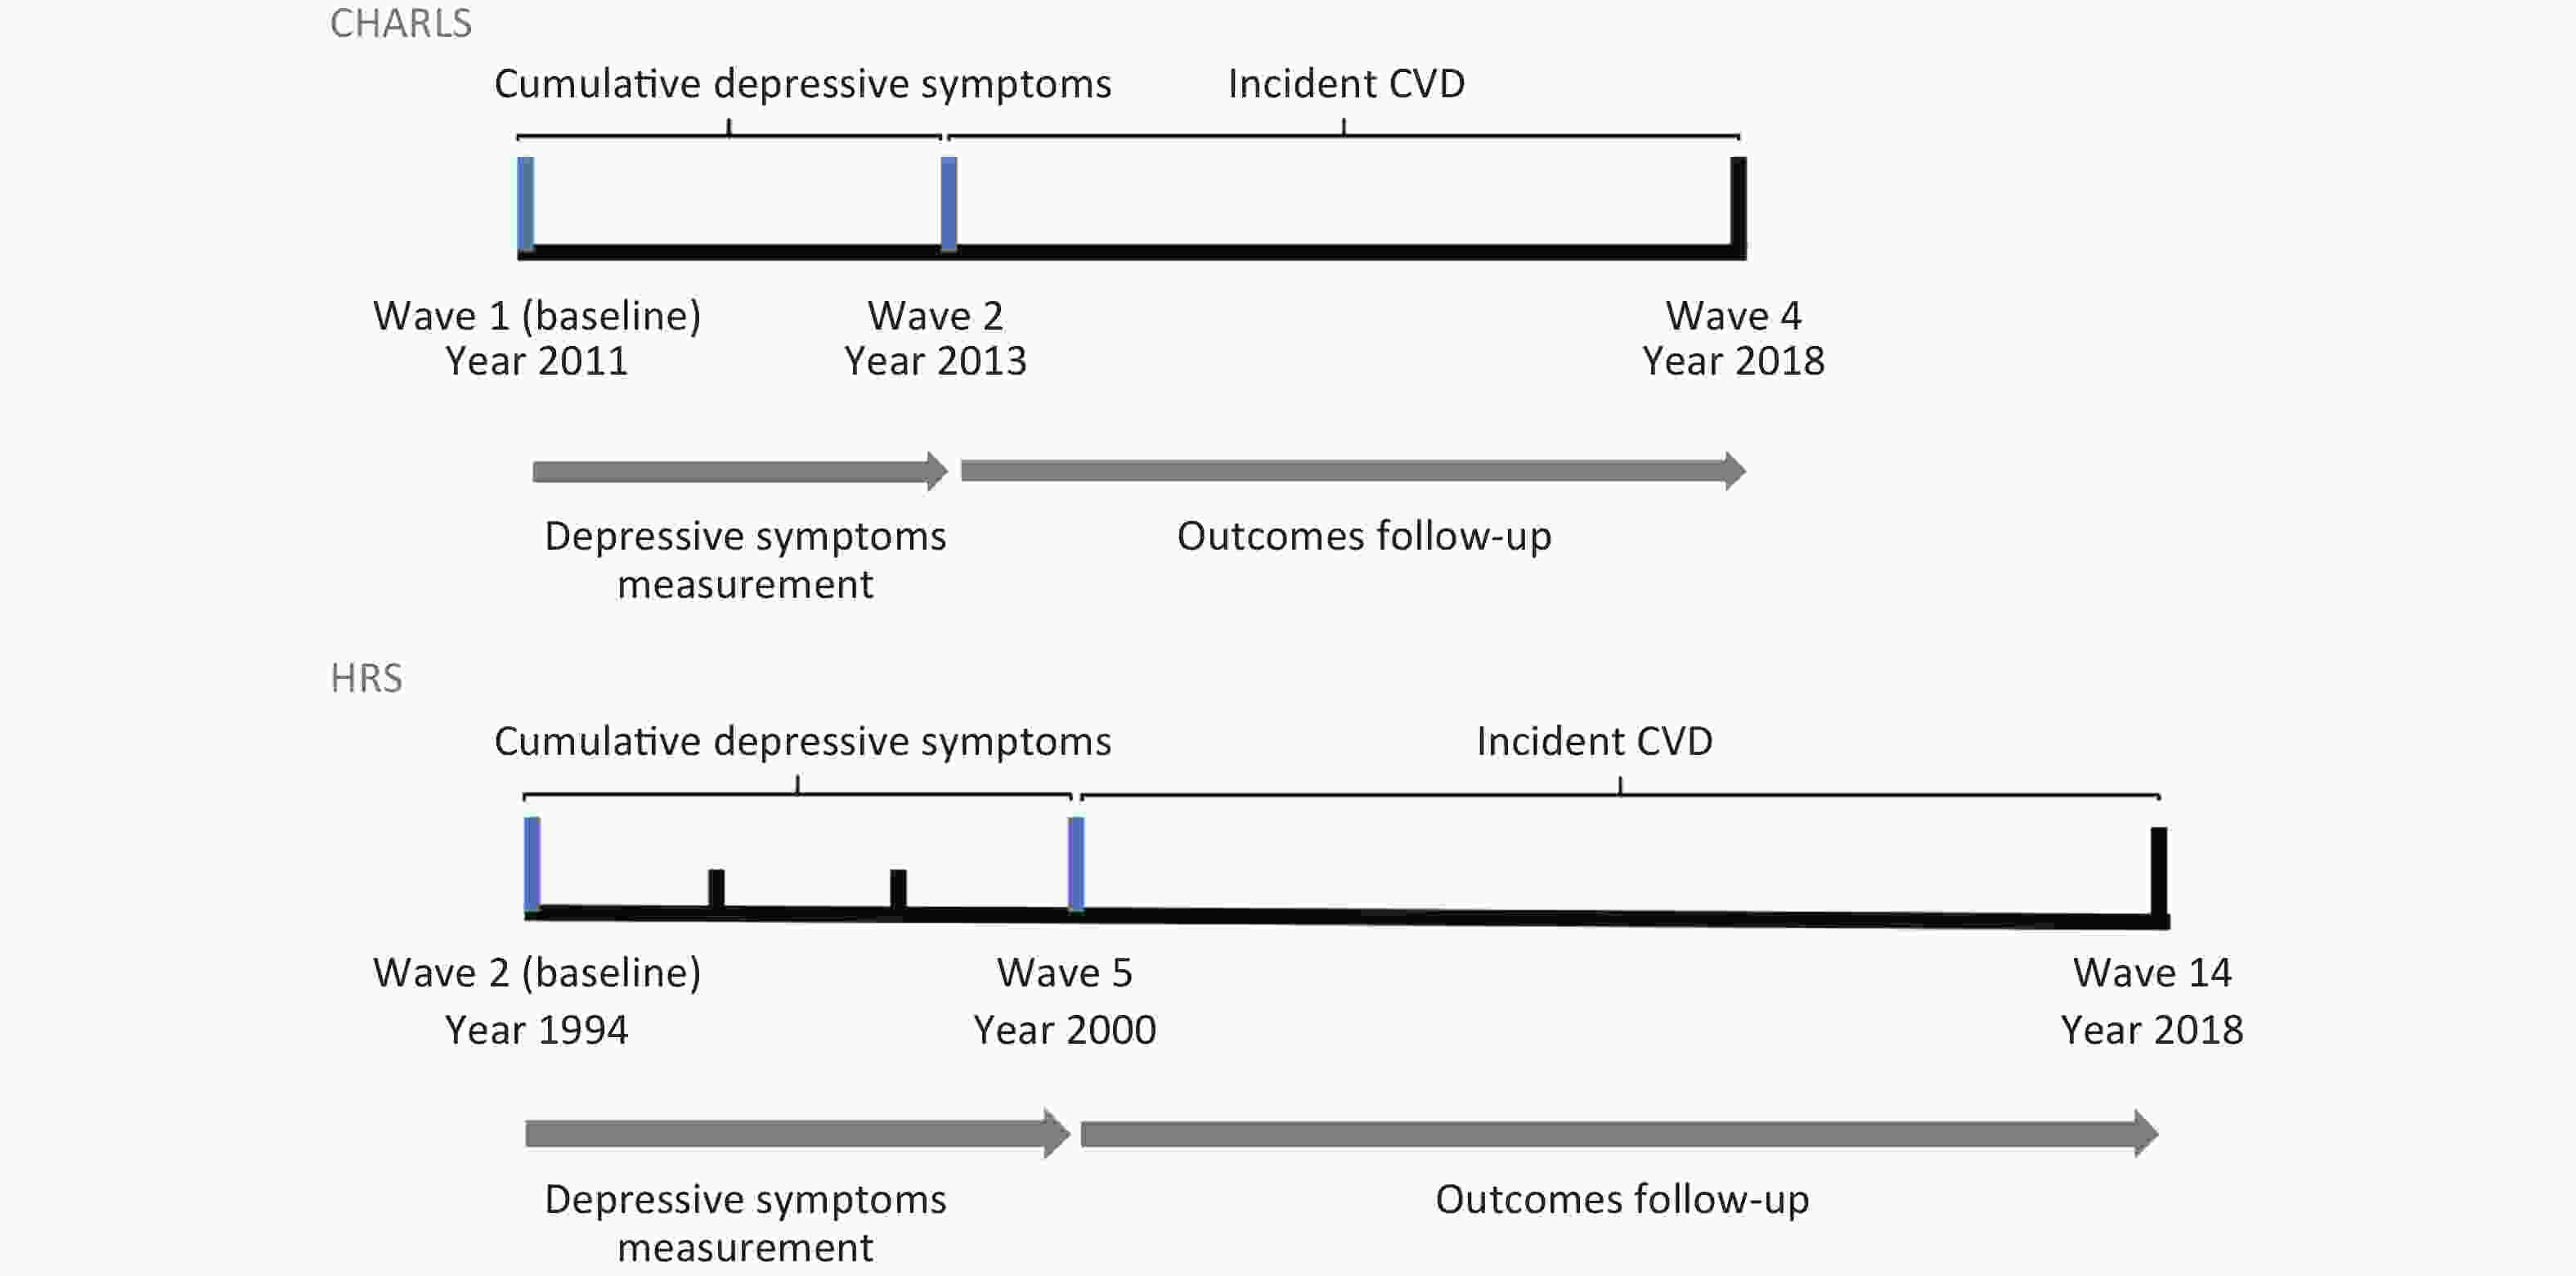
Figure 1. Timeline of the study.
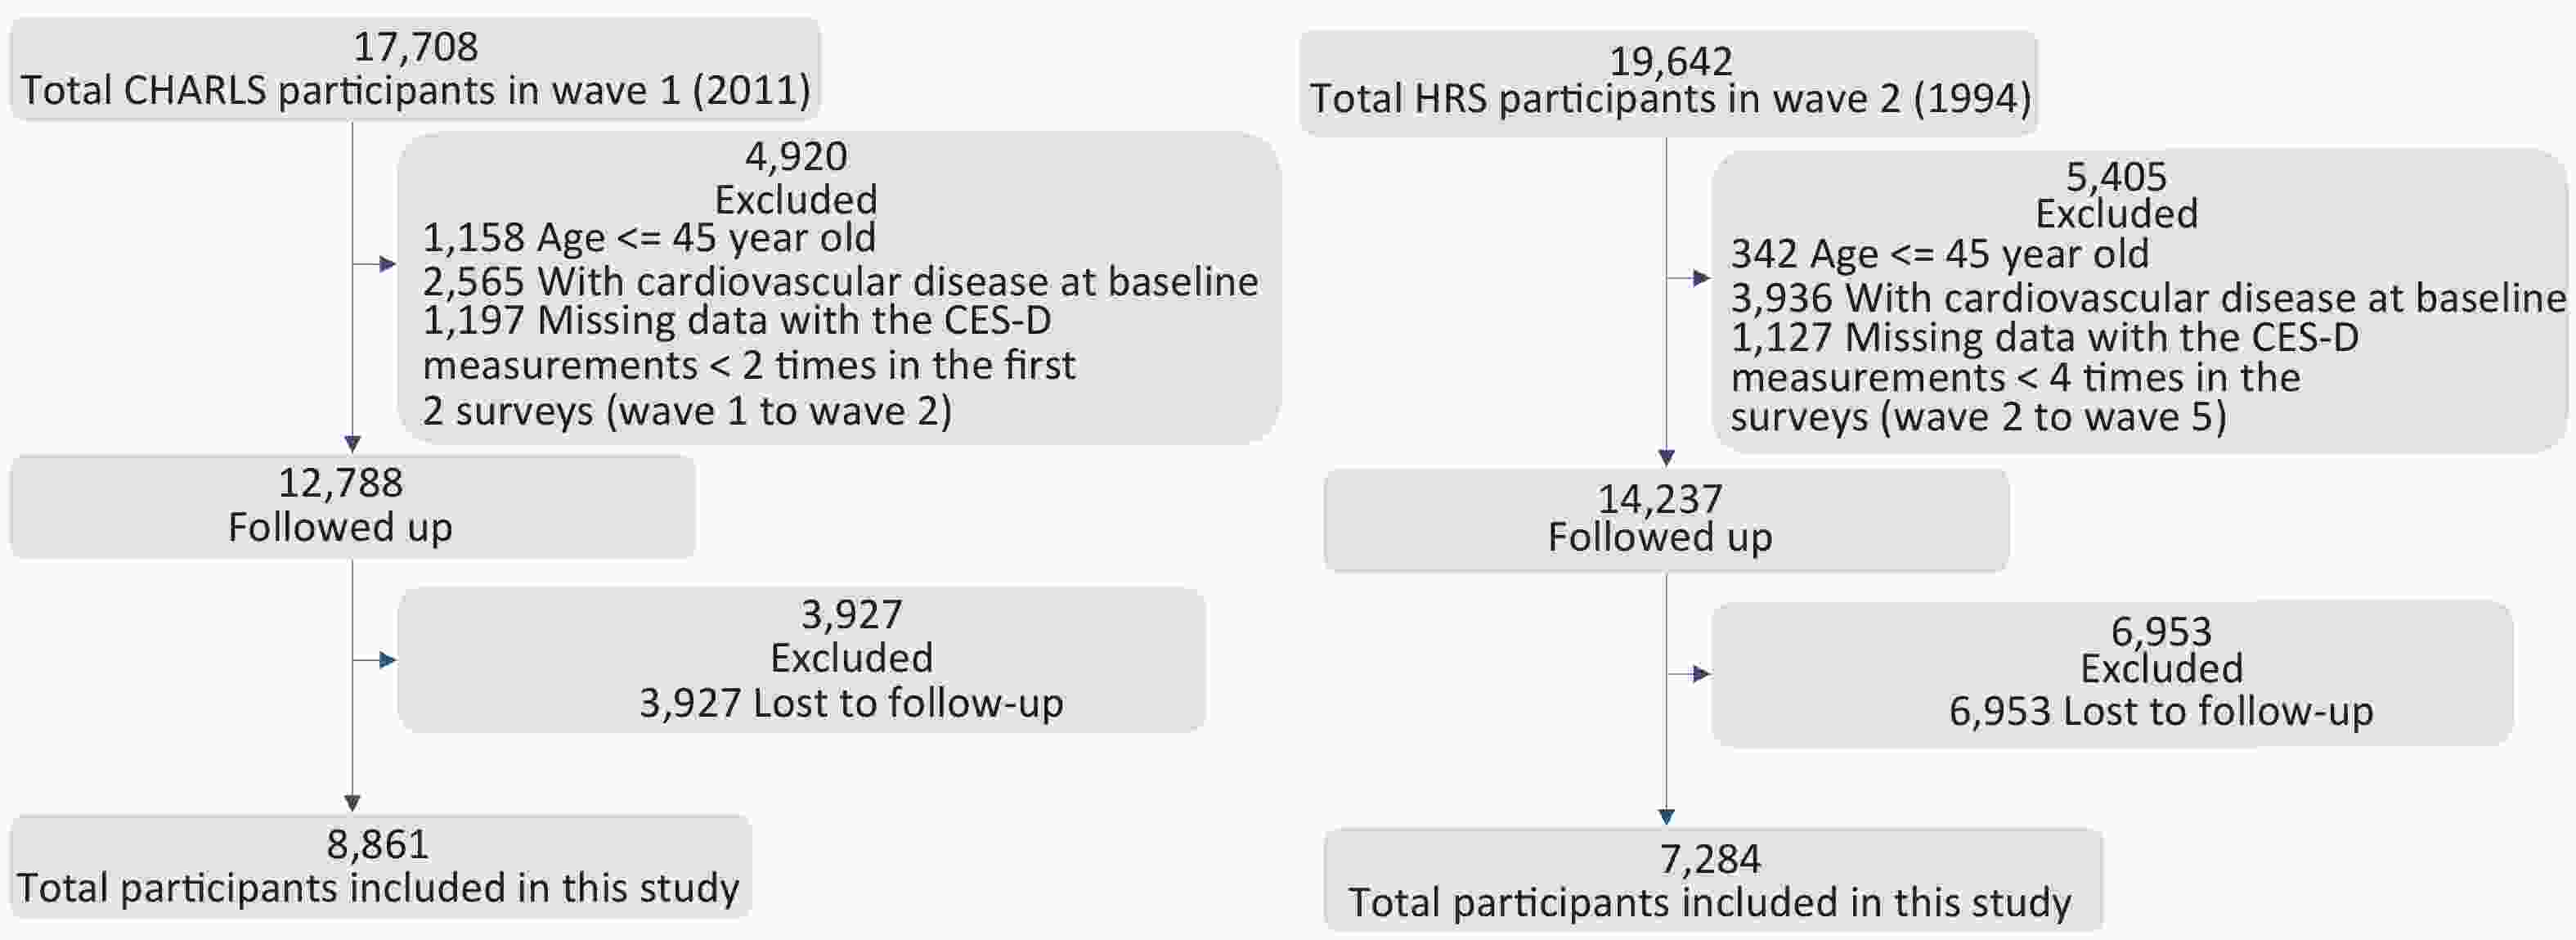
Figure 2. Flowchart of participant enrolment in the CHARLS and HRS study. (A) Flowchart of participant enrolment in the CHARLS study (B) Flowchart of participant enrolment in the HRS study.
-
In the baseline survey, depressive symptoms were measured using the Center for Epidemiological Studies Depression (CES-D)short form, a widely used self-report measure of depressive symptoms in population-based analysis.
In CHARLS, depressive symptoms were measured using the CES-D short form comprising 10 items: (1) bothered by little things, (2) trouble concentrating, (3) felt depressed, (4) everything was an effort, (5) felt hopeful, (6) felt fearful, (7) sleep was restless, (8) felt happy, (9) felt lonely, and (10) could not get going. Items 5 and 8 must be reverse-scored before the item scores are summarized. The total CES-D score ranged from 0 to 30, with higher scores indicating more severe depressive symptoms. The CES-D has good metrological properties among older Chinese adults[19].
In the HRS, depressive symptoms were measured using the CES-D short form comprising eight items: (1) felt depressed; (2) everything was an effort; (3) sleep was restless; (4) I was happy; (5) felt lonely; (6) I enjoyed life; (7) felt sad; and (8) could not get going. The scores ranged from 0 to 8, with higher scores reflecting greater depressive symptoms[20]. The eight-item CES-D had comparable reliability and validity to the eight-item CES-D[21].
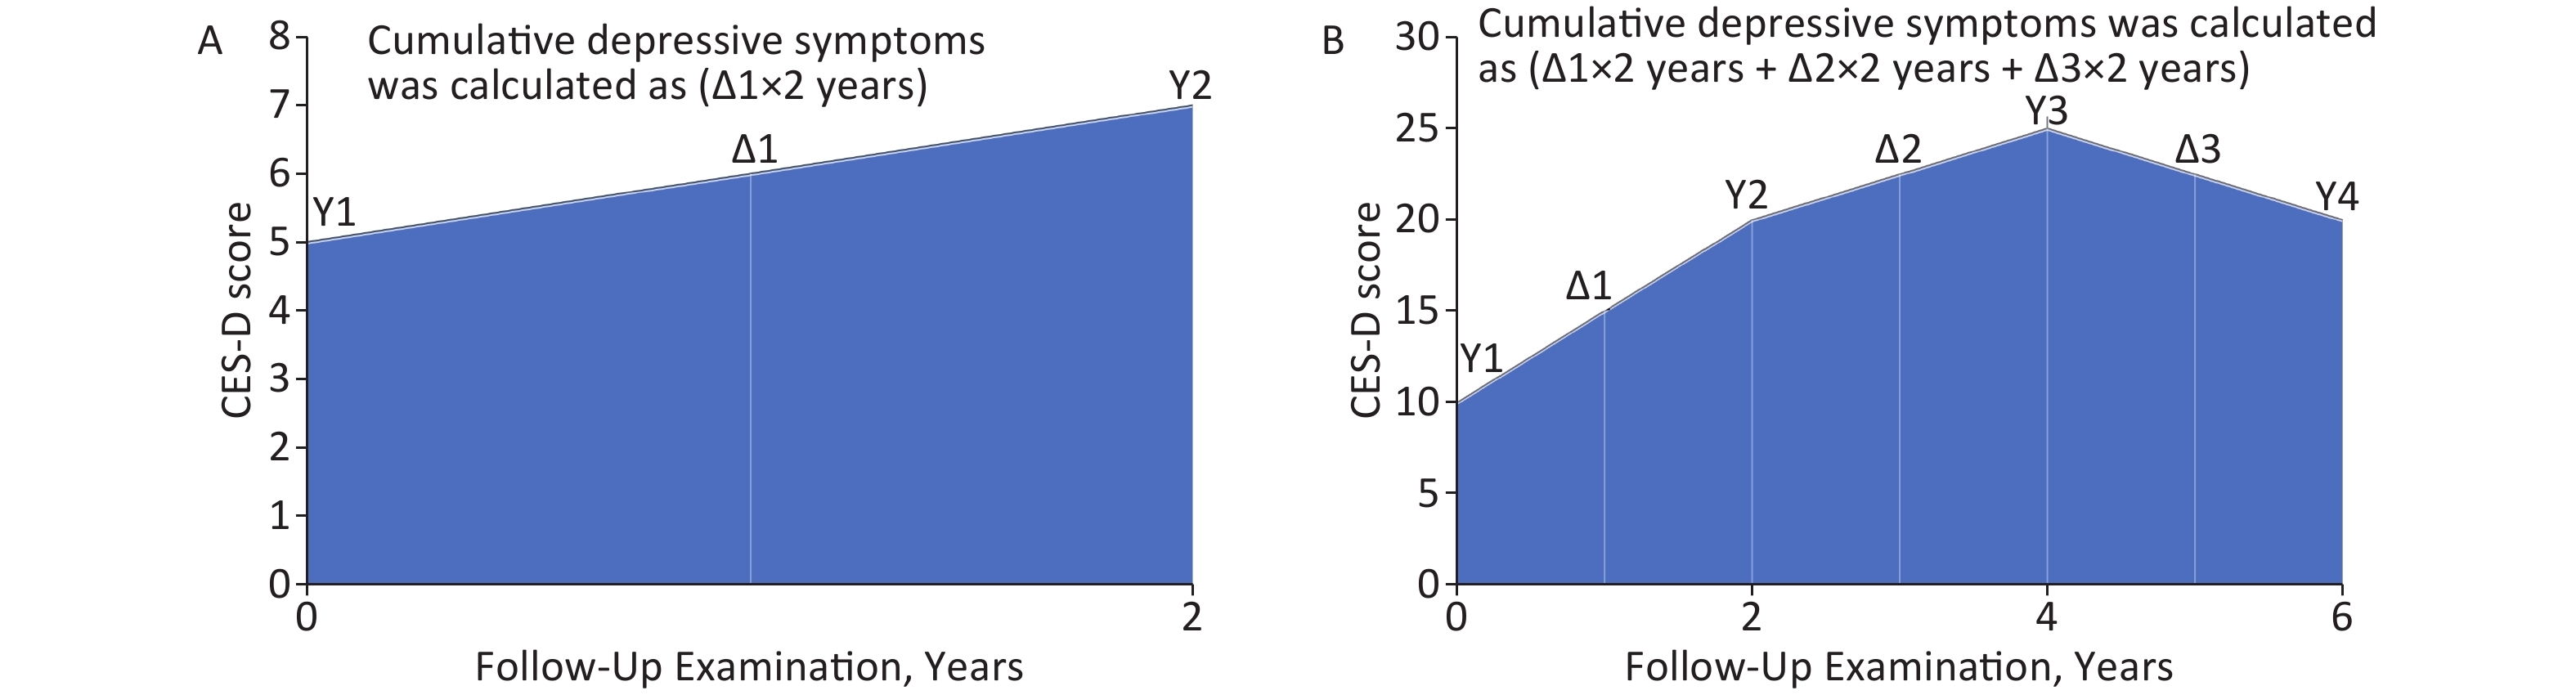
Two CES-D measurements over 2-years from baseline were used to assess cumulative depressive symptoms in the CHARLS and four in the HRS over the first 6 years. For each participant, cumulative depressive symptoms were calculated using the area under the curve (AUCs) as the sum of two (i.e., years between two measurements) times the mean CES-D score between the two consecutive waves. The same approach is used under multiple conditions previously[22,23], with a detailed description of this process being shown in Figure 3.

Figure 3. Calculation of cumulative depressive symptoms in CHARLS and HRS study. (A) Calculation of cumulative depressive symptoms in CHARLS. (B) Calculation of cumulative depressive symptoms in HRS. The mean CES-D score for each two successive waves is displayed as Δn. Cumulative depressive symptoms (score × year) is the sum of each Δn multiplied by the time (years) between the corresponding two measurement.
-
The primary outcome of this study was CVD incidence. In accordance with previous studies[18,24,25], incident CVD events were assessed using the following standardized question: “Have you been told by a doctor that you have been diagnosed with a heart attack, coronary heart disease, angina, congestive heart failure, or other heart problems?” and “Have you been told by a doctor that you have been diagnosed with a stroke?” Participants who reported heart disease or stroke during the follow-up period were considered to have incident CVD. All-cause mortality was ascertained through exit interviews or spousal reports in both cohorts. Patients who did not experience any relevant events were right-censored at the last follow-up.
-
Sociodemographic characteristics included age (< 65 or ≥ 65 years years), sex (males/females), marital status (married or not), place of residence (urban or rural, only in the CHARLS), education (received education or not), and household income. Health behaviors included smoking (nonsmoker, former smoker, and current smoker), leisure physical activity (vigorous or not), and alcohol consumption (has drunk alcohol before or not). Other potential confounders were body mass index (BMI [kg/m2]; as a continuous variable) and self-reported or regular use of any related medications was defined as hypertension, cancer, and diabetes (no/yes). Further covariate details are summarized in the Supplementary Method.
-
Continuous variables are presented as the mean ± standard deviations (SD) or the median, while categorical variables are presented as frequencies (%). Differences in characteristics between the groups were tested using analysis of variance, Wilcoxon rank, or chi-square tests. We used the AUC to estimate cumulative depressive symptom exposure based on the approach adopted in previous studies[22,26]. To evaluate the relationship between cumulative depressive symptoms and risk of cardiovascular outcomes, a multivariable Cox regression analysis was performed. The proportional hazard assumption was evaluated using weighted Schoenfeld residuals. We used a restricted cubic spline to explore the potential dose-response pattern, selecting four knots (5th, 35th, 65th, and 95th percentiles of cumulative depressive symptoms) to smooth the curve. To minimize the potential for inferential bias and maximize statistical power, we used multiple imputations with chained equations to assign any missing covariate values. Detailed information on the number of missing covariates is presented in Supplementary Tables S1 and S2.
We performed stratified analysis to estimate the potential modification effects by modeling the cross-product term of the stratifying variable with cumulative depressive symptoms, according to sex, age, overweight, marital status, living place, education, household income, smoking, leisure physical activity, alcohol consumption, hypertension, cancer, and diabetes.
Several sensitivity analyses were conducted to minimize the influence of reverse causation by excluding participants who developed CVD events during the first 2 years of follow-up. The corresponding time-averaged cumulative depressive symptoms were calculated by dividing these symptoms by the total exposure time. Finally, we excluded individuals with severe baseline depressive symptoms to assess whether the results were skewed.
All statistical analyses were conducted using R version 4.2.0, with a two-tailed significant alpha value of 0.05. As we tested multiple interactions, we conservatively corrected for multiple comparisons using Bonferroni correction and set a significance level of 0.05/36 = 0.0014.
-
Of the 8,861 participants (mean baseline age, 58.58 years [SD, 8.66 years]) from CHARLS, 4,554 (51.4%) were women. Most participants were married (84.7%), had received education (72.0%), and had household income (73.8%). Of the 7,284 participants in HRS (mean baseline age, 60.94 years [SD, 8.70 years]), 4,732 participants (65.0%) were women. Significant differences were observed in the baseline characteristics of the two cohorts (Table 1).
CHARLS (n = 8,861) HRS (n = 7,284) P Value Age (mean [SD]), year 58.58 (8.66) 60.94 (8.70) < 0.001 Sex (%) Male 4,307 (48.6) 2,552 (35.0) < 0.001 Female 4,554 (51.4) 4,732 (65.0) Married (%) 7,506 (84.7) 5,345 (73.4) < 0.001 Received education (%) 6,378 (72.0) 7,253 (99.6) < 0.001 Living place (%) Rural 5,789 (65.3) − − Urban 3,072 (34.7) Having household income (%) 6,541 (73.8) 7,205 (98.9) < 0.001 Smoke (%) Current 2,862 (32.3) 1,310 (18.0) < 0.001 Former 673 (7.6) 2,784 (38.2) Never 5,326 (60.1) 3,190 (43.8) Ever drink (%), kg/m2 3,557 (40.1) 4,210 (57.8) < 0.001 BMI (mean (SD)) 23.58 (4.25) 26.72 (4.86) < 0.001 Vigorous exercise (%) 6,586 (74.3) 5,125 (70.4) < 0.001 Cancer (%) 82 (0.9) 273 (3.7) < 0.001 Diabetes (%) 462 (5.2) 247 (3.4) < 0.001 Hypertension(%) 1,970 (22.2) 1,200 (16.5) < 0.001 Cumulative CES-D scores (mean (SD)) 15.59 (10.05) 4.59 (5.70) − Note. Definitions of cancer and other diseases were based on records of self-reported physician diagnosis or any medication used. P values are reported for differences between 2 cohorts using Student’s t-test, chi-square test, or Wilcoxon rank test. No statistical test was conducted for cumulative CES-D scores, because of heterogeneous definition or measurement.BMI: body mass index; CHARLS: China Health and Retirement Longitudinal Study; HRS: Health and Retirement Study. Table 1. Baseline characteristics of participants from 2 independent cohorts
-
Table 2 lists the association between cumulative depressive symptoms and risk of cardiovascular outcomes in the CHARLS and HRS. After adjusting for sociodemographic characteristics and health behaviors using the Cox proportional hazard regression models, significant associations were noted between cumulative depressive symptom scores and incidence of CVD, heart disease, or stroke.
Outcomes CHARLS (n = 8,861) HRS (n = 7,284) Events/Total HR (95% CI)a P Value Events/Total HR (95% CI) P Value Cardiovascular disease Quartile 1 264/2,034 reference 655/1,937 reference Quartile 2 344/2,319 1.14 (0.97, 1.34) 0.142 569/1,643 1.08 (0.96, 1.21) 0.192 Quartile 3 350/2,130 1.31 (1.12, 1.54) 0.002 576/1,588 1.16 (1.04, 1.30) 0.009 Quartile 4 513/2,378 1.73 (1.48, 2.02) < 0.001 836/2,116 1.41 (1.27, 1.57) < 0.001 Per quartile increaseb − 1.20 (1.15, 1.26) < 0.001 − 1.12 (1.08, 1.16) < 0.001 Per SD increasec − 1.24 (1.18, 1.31) < 0.001 − 1.14 (1.09, 1.18) < 0.001 Heart disease Quartile 1 187/2,034 reference 566/1,937 reference Quartile 2 259/2,319 1.20 (0.99, 1.45) 0.061 505/1,643 1.09 (0.97, 1.23) 0.143 Quartile 3 250/2,130 1.29 (1.07, 1.57) 0.009 497/1,588 1.16 (1.03, 1.31) 0.018 Quartile 4 397/2,378 1.83 (1.52, 2.19) < 0.001 724/2,116 1.42 (1.26, 1.59) < 0.001 Per quartile increase − 1.22 (1.15, 1.29) < 0.001 − 1.12 (1.08, 1.16) < 0.001 Per SD increase − 1.25 (1.18, 1.33) < 0.001 − 1.14 (1.10, 1.19) < 0.001 Stroke Quartile 1 94/2,034 reference 193/1,937 reference Quartile 2 105/2,319 0.98 (0.74, 1.30) 0.904 160/1,643 1.01 (0.82, 1.25) 0.922 Quartile 3 126/2,130 1.36 (1.03, 1.78) 0.027 154/1,588 0.97 (0.78, 1.21) 0.799 Quartile 4 161/2,378 1.53 (1.17, 1.99) 0.002 245/2,116 1.30 (1.06, 1.58) 0.010 Per quartile increase − 1.18 (1.08, 1.28) < 0.001 − 1.08 (1.02, 1.16) 0.015 Per SD increase − 1.23 (1.13, 1.34) < 0.001 − 1.09 (1.01, 1.17) 0.022 Note. aCox proportional hazards models were applied with adjustment for age (years), sex, marital status, living place (only in CHARLS), education, household income, BMI, smoking status, alcohol consumption, self-reported(both CHARLS and HRS) or regular use of any related medications (only in CHARLS) were defined as hypertension, cancer and diabetes. b Performed by treating cumulative CES-D score quantiles as a numeric variable. c Estimated as the beta coefficient for standardized cumulative CES-D score using the z-score. CI, confidence interval; HR, hazard ratios. Table 2. Associations of cumulative depressive symptoms with cardiovascular outcomes
For CHARLS, compared to participants in the first quartile of cumulative CES-D scores, those in the third quartile have higher risk of CVD events, the hazard ratios (HRs; 95% confidence intervals [CI]) were 1.31 (1.12, 1.54) for predicting CVD, 1.29 (1.07, 1.57) for heart disease, and 1.36 (1.03, 1.78) for stroke. In the fourth quartile, the risks were higher, and the HRs (95% CI) were 1.73 (1.48, 2.02), 1.83 (1.52, 2.19) and 1.53 (1.17, and 1.99) respectively. When the cumulative CES-D score quantiles were used as continuous variables, the per quartile and SD increases were both significantly associated with the outcomes (P < 0.05).
Similar results were found in HRS, by comparing the fourth quartile with the first quartile, the HRs (95% CI) were 1.41 (1.27, 1.57) for CVD events, 1.42 (1.26, 1.59) for heart disease, and 1.30 (1.06, 1.58) for stroke. Adjusted HRs per SD increase were 1.14 (1.09, 1.18) for CVD, 1.14 (1.10, 1.19) for heart disease, and 1.09 (1.01, 1.17) for stroke.
-
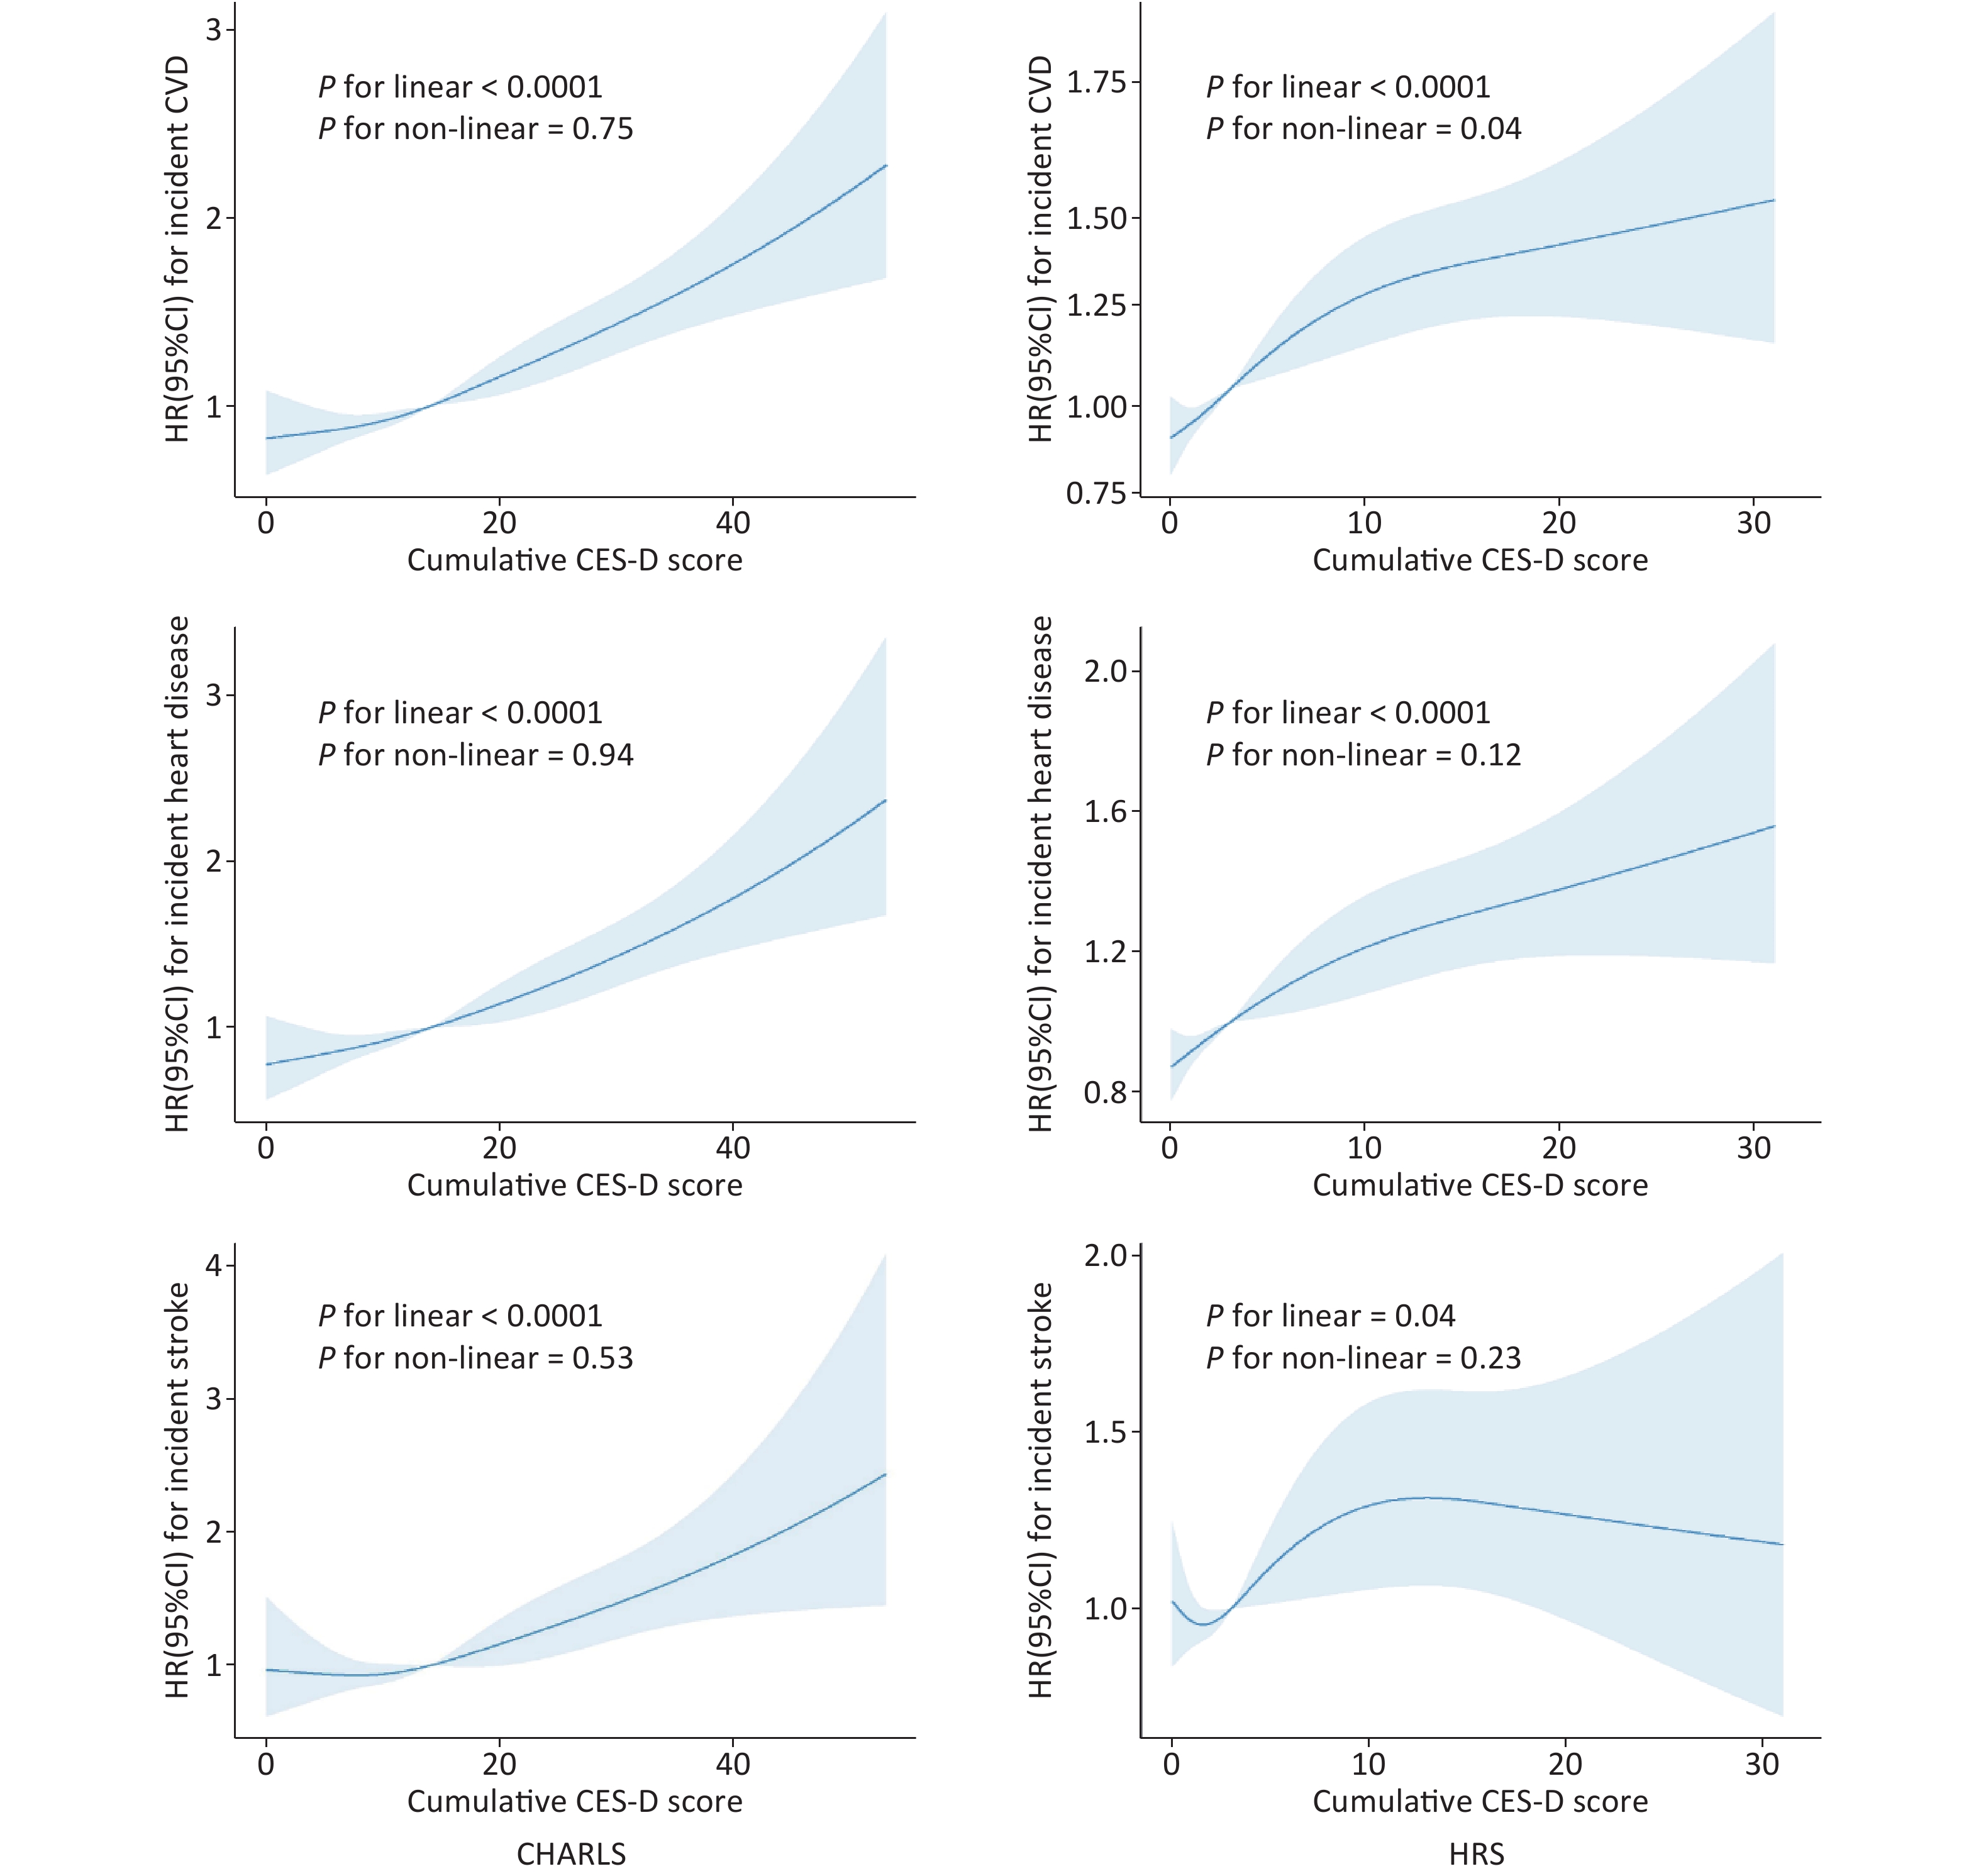
To better explain the observed nonlinear association, we further analyzed the cumulative CES-D score as a continuous variable using cubic spline regression, adjusting for all covariates mentioned. As shown in Figure 4, nonsignificant, nonlinear dose-response pattern was observed between cumulative CES-D scores and CVD, heart disease, or stroke in the CHARLS group (P for non-linear > 0.05). Cumulative CES-D scores showed a linear relationship with the risk of CVD, heart disease, and stroke in these two cohorts, that is, as cumulative CES-D scores increased, the risk of CVD, heart disease, and stroke also increased (P < 0.05).
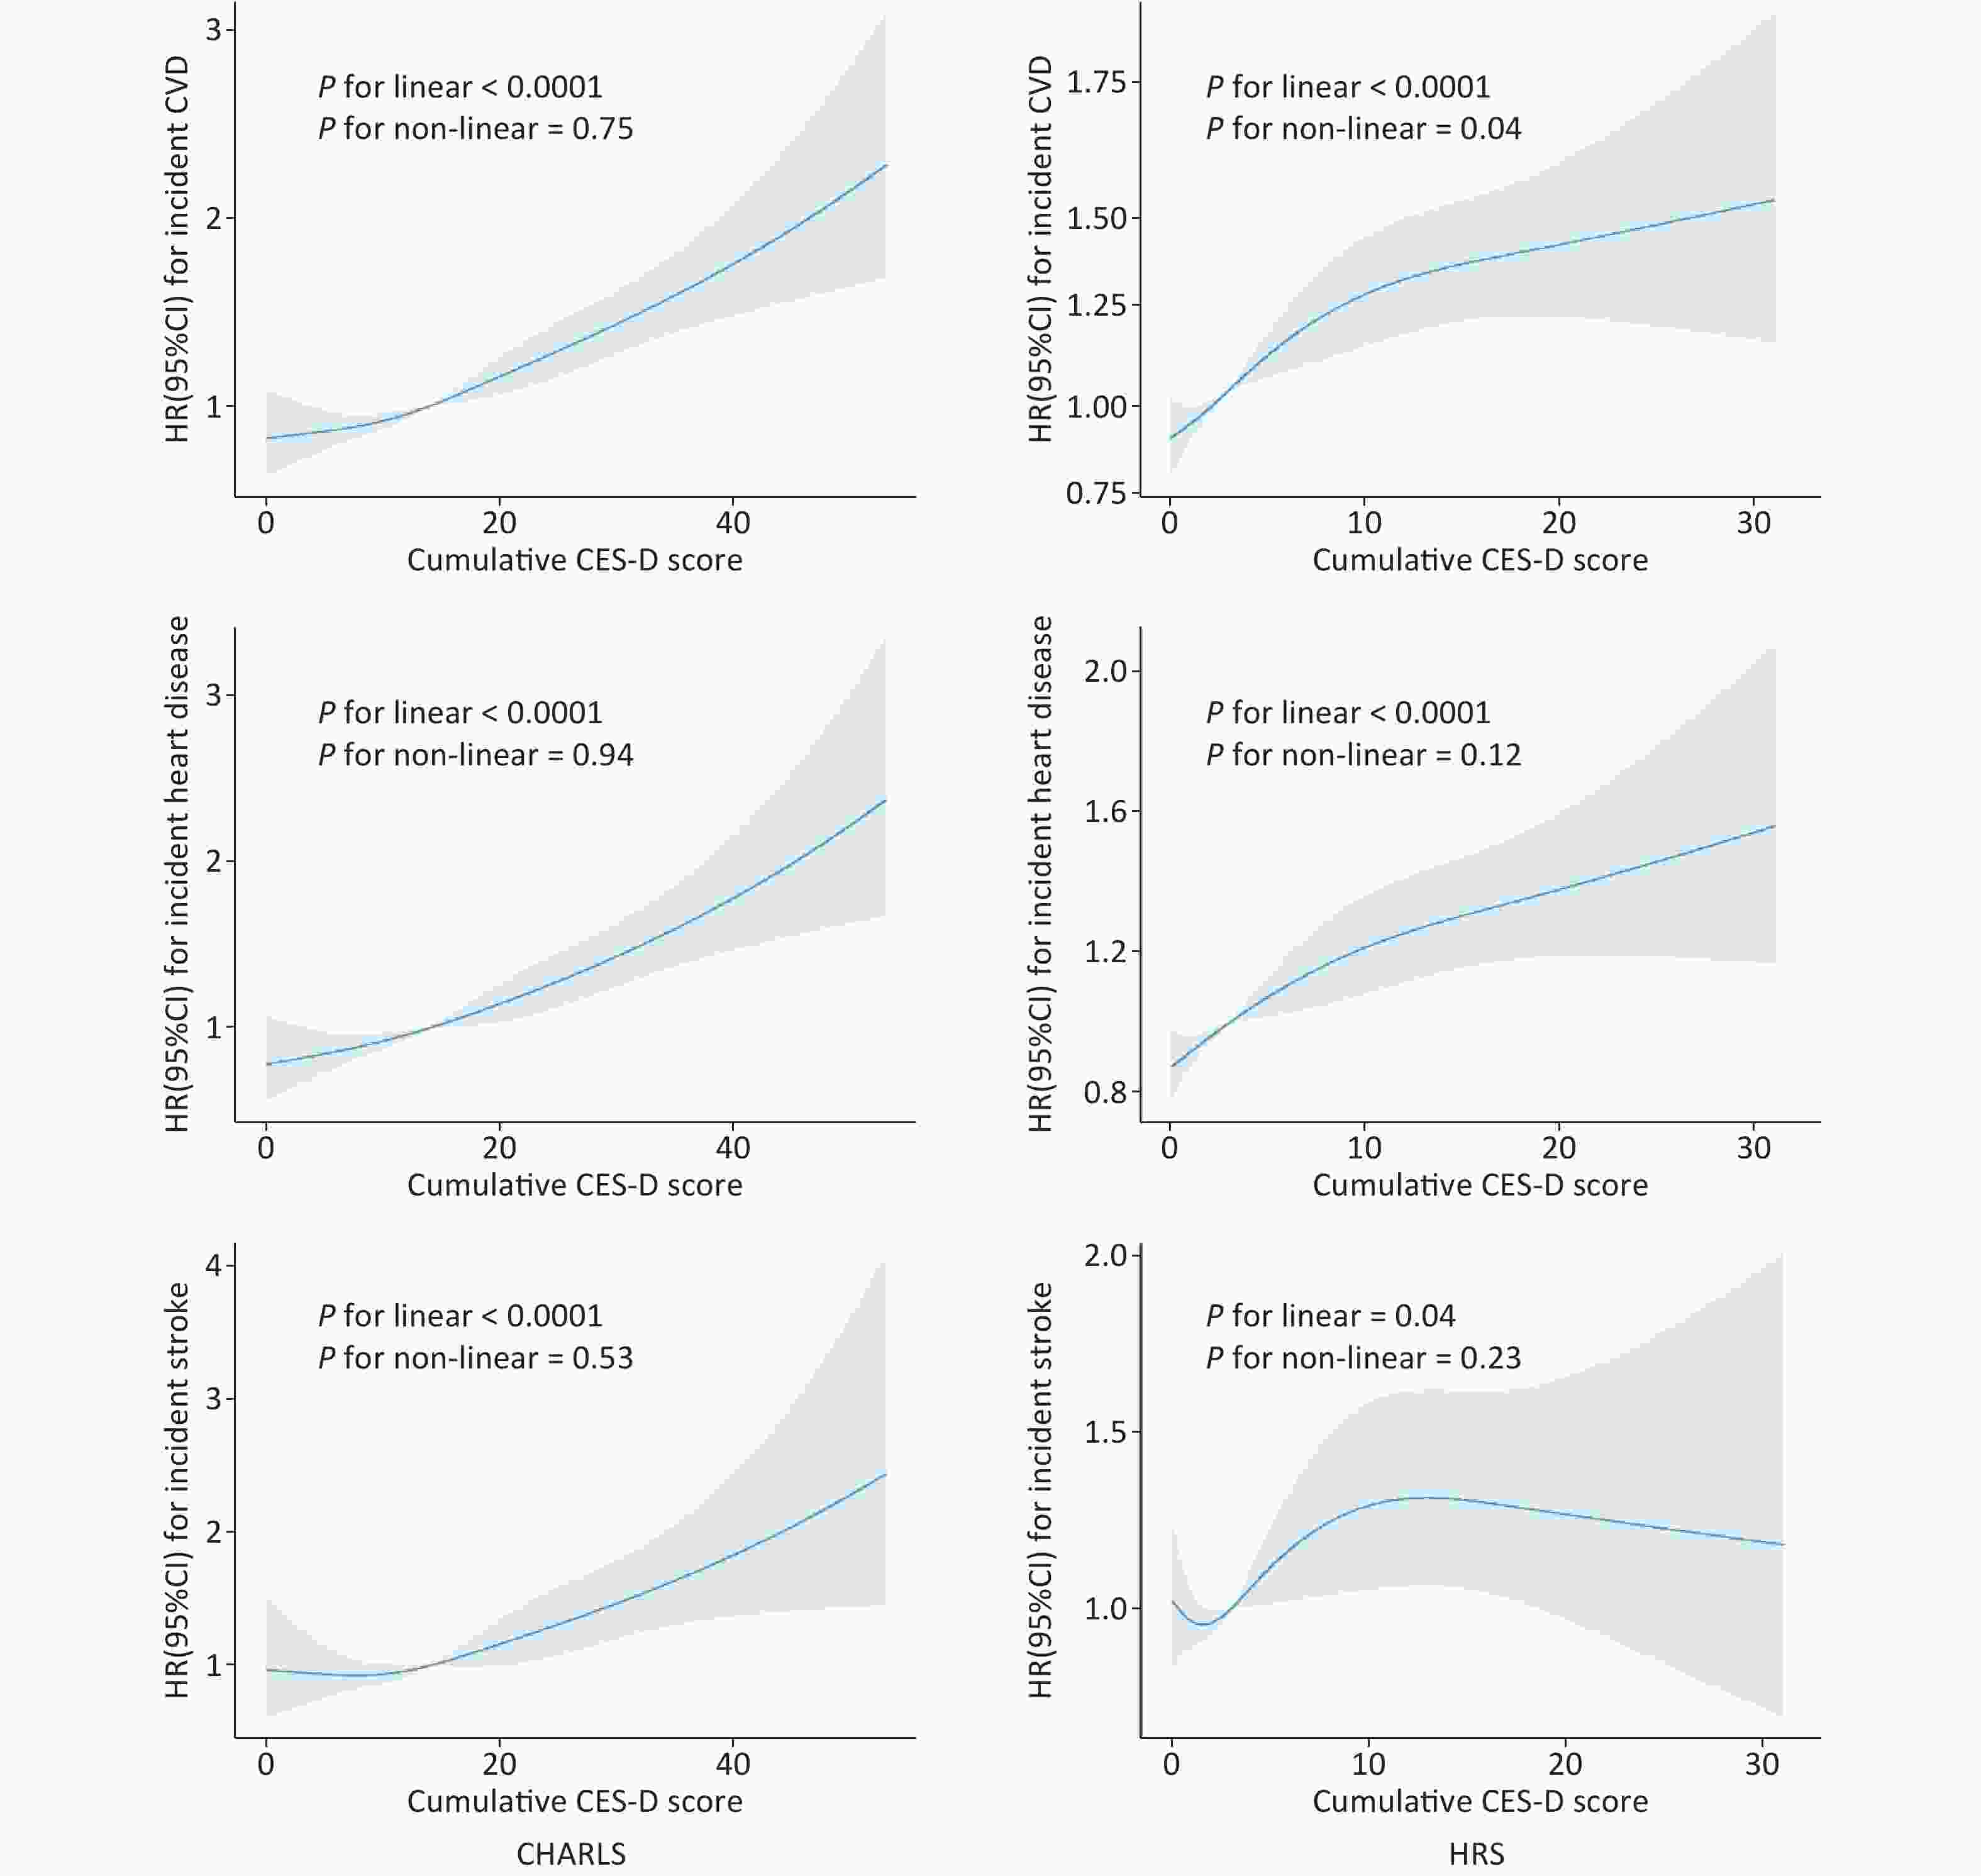
Figure 4. Dose-response curves of cumulative CES-D score and incident CVD (top), heart disease (middle), stroke (bottom) in CHARLS (left) and HRS (right). A restricted cubic spline was fitted to model each curve, with 4 knots fixed at the 5th, 35th, 65th, and 95th percentiles for all smooth curves. Solid lines represent the point estimates of HRs for incident CVD, heart disease, and stroke, while shadows represent corresponding 95% CIs. P values were calculated using the Anova test.
-
Substantial interactions were identified in subgroup analyses (Supplementary Figures S1 and S2). In CHARLS, no significant interactions were found (all P for interactions ≥ 0.05), while in the HRS, vigorous exercise significantly modified the relationship between cumulative depressive symptoms and CVD events. However, when participants who satisfied the exclusion criteria were eliminated, sensitivity analyses showed no substantial change in CHARLS. In HRS, our results were similar to those of the primary results for CVD and heart disease; however, the association was slightly attenuated for stroke (Supplementary Tables S3 and S4). To eliminate differences in the calculated exposure times for cumulative depression between the two cohorts, cumulative depression was standardized, without significant (Supplementary Table S5). Additionally, no significant difference were observed in our results following the exclusion of participants who presented with major depressive symptoms at baseline (Supplementary Table S6).
-
The predictive value of cumulative depressive symptoms were compared with those of baseline depressive symptoms to predict CVD outcomes. When CVD was the outcome of interest, the addition of cumulative depressive symptoms significantly improved the C-statistic in both CHARLS (C-statistics, 0.645; 95% CI, 0.629–0.661) and HRS (C-statistics, 0.645; 95% CI, 0.633–0.0.657; Supplementary Table S7). Compared with baseline depressive symptoms, the addition of cumulative depressive symptoms to the conventional model was associated with the greatest improvement in discriminatory power (IDI, 2.40%; 95% CI, 1.40%–3.90%), and risk reclassification (category-free NRI, 50.7%; 95% CI, 44.4%–57.2%) in CHARLS. Similar patterns were observed for the risk of heart disease and stroke, with cumulative depressive symptoms outperforming baseline depressive symptoms (Supplementary Table S7).
-
In total, 21,206 participants (8,847 from the CHARLS and 12,359 from the HRS) were excluded from the analysis. Compared to the excluded participants, the included participants were generally married, ever drinkers, smokers, had a lower BMI, and had no history of diabetes or hypertension. Furthermore, the excluded participants had higher CES-D scores, which were multiplied by two in the HRS cohort; the detailed results for this comparison are summarized in Supplementary Tables S8 and S9.
-
To the best of our knowledge, this is the first prospective study to investigate the relationship between cumulative depressive symptoms and multiple CVD outcomes in middle-aged and older adults. Our method of estimating cumulative depressive symptoms by calculating the AUC was similar to that used in previous studies[22,27] to characterize the cumulative burden of time-varying continuous indicators such as CES-D scores[13] and blood pressure[26]. In this study, we found that higher cumulative depressive symptoms were associated with an increased risk of CVD, heart disease, and stroke in two large population-based longitudinal cohorts from China and the US. Our sensitivity analyses results were reliable and the replicated results from the two different cohorts reinforced their validity.
In this study, an association between depression and CVD risk in the general population has been established. In a previous, pooled analysis of 563,255 participants in 22 cohorts, baseline depressive symptoms were associated with CVD incidence, even when symptom levels were lower than that of the threshold for depressive disorders[8], consistent with the results of two previous Chinese[28,29] and United states[30] cohorts. In another longitudinal study, improvement (vs. no improvement) in depressive symptoms following psychotherapy was associated with a lower CVD incidence after a median follow-up of 3.1 years[31]. However, certain depressive symptoms are enduring and the levels of depression over a short period reflect poorly on these outcomes. Recent studies examined the cardiovascular effects of time-dependent depressive symptoms. A study based on the Whitehall II cohort found that individuals with higher mean scores for depressive symptoms or fibrinogen levels were more likely to experience a first-time coronary heart disease event[32]. Some studies have used trajectories of depression as exposure to investigate this association. After 5 years of follow-up, Wang et al. found that chronic disease risks were lower with newly developed and relieved depressive symptoms than with persistent depressive symptoms[33]. Wu et al. determined that stable, high, and newly started depressive symptoms were associated with an increased risk of stroke[34]. However, the effects of cumulative depressive symptoms have not yet been explored.
Recently, studies that included an HRS cohort in the US and an ELSA cohort in the United Kingdom showed that cumulative depressive symptoms were associated with the risk of CVD and all-cause mortality[13], consistent with our results. However, evidence of other adverse CVD outcomes, such as heart disease and stroke, is insufficient. In this study, by measuring the cumulative burden of depressive symptoms that reflected dynamic changes, we determined that depressive symptoms are associated with increased CVD, heart disease, and stroke risk during 5 and 10 years of follow-up. After excluding participants with missing covariate data or those who developed CVD in the first 2 years of follow-up, no substantial changes were observed in CHARLS, whereas the association between cumulative depression and stroke was nonsignificant in the HRS, which is inconsistent with previous findings[35,36]; thus, further research is needed.
The underlying mechanisms of the association between cumulative depressive symptoms and CVD are multifactorial and involve autonomic nerve dysfunction[37,38], inflammation[39,40], platelet activation and thrombosis[41], life behavior[42], and cardiac metabolic risk factors[43]. A cumulative meta-analysis confirmed that patients with major depression have higher mean levels of interleukin-6 and C-reactive protein than that of non-depressed controls[44]. A symptom of depression is sleep, which leads to increased levels of sympathetic activation and cortisol secretion along with CVD risk[45,46]. Furthermore, depression in patients with CVD is associated with poor prognosis, with this risk being directly proportional to the severity[47]. In addition, patients with depressive symptoms refractory to antidepressant treatment remain at an elevated risk of subsequent cardiovascular events[48].
In this study, we observed that the more severe the cumulative depressive symptoms, the higher the CVD risk, suggesting that both the CES-D score at a single measurement and duration must be considered. Specifically, when comparing the predictive values of the models with and without cumulative depressive symptoms, as cumulative depressive symptoms outperformed baseline measurements in terms of C-statistics in both cohorts. In CHARLS, compared with the baseline depressive symptoms, the addition of cumulative depressive symptoms was associated with elevated IDI and NRI. Thus, the cumulative depressive symptom load is calculated from a series of measurements at different time points and is considered in future CVD risk projections.
Our findings enhance those of previous studies in this field, as they considered the natural variability of depressive symptoms and found that the long-term cumulative burden of depressive symptoms was associated with a CVD risk. Our findings have important implications for the prevention and reduction of CVD burden, especially in the current era, where an increasing number of people are suffering from depression[49]. CVD can be prevented and controlled by monitoring and maintaining long-term depressive symptoms at low levels.
-
This study had several strengths. First, we used two representative national sister population-based cohorts from China and the US that were nearly identical in design, data collection, and long-term follow-up. Second, we considered cumulative depressive symptoms instead of a single-point measurement of depression and captured the persistent effect of these symptoms on cardiovascular outcomes. Furthermore, we observed a robust association between cumulative depressive symptoms and multiple CVD outcomes. Finally, this study population comprised a large number of community-dwelling individuals .
This study has several limitations. First, the results apply, primarily, to those aged ≥ 45-years-old (middle-aged and older adults), limiting generalizability. Second, some confounding factors in the association between depressive symptoms and CVD, such as social support, isolation, income volatility, healthcare access, and stressful life events, were not adjusted for in this study causing bias. Third, the differences in baseline characteristics between the included and excluded participants may have caused an overestimation or underestimation of the true associations between cumulative depressive symptoms and outcomes. Fourth, the CVD measurement was based on self-reported information, which might not be consistent with clinical interviews and lead to recall bias, influencing the reliability and validity of our results. Finally, we could not account for the competing risk of death, as the participants’ death dates were unavailable, affecting our results.
-
Our study indicated that cumulative depressive symptoms are more effective than baseline depressive symptoms in predicting CVD. Long-term surveillance and management of depressive symptoms may reduce the CVD risk. Thus, this study may provide some insight into prevention strategies.
-
Our findings underscore the importance of maintaining low levels of depressive symptoms, as a potential strategy to prevent CVD in middle-aged and geriatric adults.
Long-Term Cumulative Depressive Symptoms and Incident Cardiovascular Disease in Middle-aged and Older Population: Two Cohort Studies
doi: 10.3967/bes2025.165
- Received Date: 2025-03-03
- Accepted Date: 2025-08-11
-
Key words:
- Cumulative depressive symptom /
- CVD /
- Cohort /
- CHARLS /
- HRS
Abstract:
No financial relationships with any organization that might have an interest in the submitted work in the previous 3 years; no other relationships or activities that could appear to have influenced the submitted work.
Ethical approval for all CHARLS waves was granted by the Institutional Review Board of Peking University (IRB00001052-11015), and the HRS was approved by the Institutional Review Board of the University of Michigan and National Institute on Aging (HUM00061128). Written informed consent was obtained from all the participants.
&These authors contributed equally to this work.
| Citation: | Fangfei You, Yining Gao, Wenfang Zhong, Zhihao Li, Jian Gao, Dong Shen, Xiaomeng Wang, Weiqi Song, Qi Fu, Haoyu Yan, Jiahao Xie, Huan Chen, Hao Yan, Chen Mao. Long-Term Cumulative Depressive Symptoms and Incident Cardiovascular Disease in Middle-aged and Older Population: Two Cohort Studies[J]. Biomedical and Environmental Sciences. doi: 10.3967/bes2025.165

|

 Quick Links
 DownLoad: