
-
Antimicrobial resistance (AMR) poses a major threat to human health globally[1]. AMR killed at least 1.27 million people worldwide in 2019 and may result in 10 million deaths annually by 2050 if the current trend in AMR is not suppressed[2]. Among the resistant pathogens, carbapenem-resistant organisms (CRO) and vancomycin-resistant enterococci (VRE) are of particular concern, especially in healthcare settings, where they can cause severe infections in people with weakened immune systems[3-5].
Global control of these resistant bacteria is challenging. The epidemiology of AMR in China shows both similarities and differences with global patterns. According to nationwide bacterial resistance surveillance data in China, the resistance rates of carbapenem-resistant Klebsiella pneumoniae (CRKP) to meropenem (MEM) and imipenem (IPM) were 2.9% and 3.0% in 2005, respectively, but increased to 26.3% and 25.0%, respectively, by 2020, paralleling global trends[6]. In contrast, vancomycin resistance in Enterococcus faecium (E. faecium) and Enterococcus faecalis (E. faecalis) has remained at relatively low levels in China[7,8]. This differs from the United States and Europe. In a recent report on the threat of antibiotic resistance in the United States 2019, approximately 30% of all healthcare-associated enterococcal infections were resistant to vancomycin. Notably, more than 70% of E. faecium isolates were resistant to vancomycin in solid organ transplant units[9]. VRE resistance rates show a consistently increasing trend across Europe[4,10,11].
Antimicrobial drugs reduce the global burden of common infectious diseases. Globally, an increase in the annual consumption of various types of antibiotics is apparent[12]. However, the widespread and indiscriminate use of antimicrobial drugs is a major driving force of AMR[13]. Several studies have shown that antibiotic drug use is closely associated with antibiotic resistance[14]. Most of these studies provided snapshots of the correlation between antibiotic consumption and AMR. However, the correlation between antibiotic consumption and AMR has not been consistent. Gong et al. reported a strong correlation between the consumption of carbapenems and carbapenem-resistant Klebsiella pneumoniae[15]. Conversely, Pérez-Lazo reported a strong negative correlation between imipenem and imipenem- and meropenem-resistant K. pneumoniae[16]. Additionally, in the context of the global increase in antibiotic consumption, the resistance rates of VRE in China have remained lower than those reported in other countries, whereas the resistance rates of CRO have shown an upward trend, similar to that observed in other countries[17]. Therefore, additional studies are required to provide comprehensive insights into the antimicrobial resistance of CRO and VRE with respect to antibiotic consumption in China.
In this study, we examined the association between resistance to six WHO-designated priority pathogens and the consumption of 15 related classes of antibiotics to provide a clearer understanding of how improved medical practices and informed public health policies can help reduce the spread of resistant bacteria.
-
We conducted an ecological study of data pertaining to January 2016 and December 2022.
-
We collected the drug-resistant proportions of carbapenem-resistant organisms (CRO) and vancomycin-resistant enterococci (VRE) from 31 provinces from the China Antibacterial Resistance Surveillance System (CARSS), and at the national level on the Chinese mainland between 2016–2022. Resistant bacteria included carbapenem-resistant Escherichia coli (CREC), Acinetobacter baumannii (CRAB), Klebsiella pneumoniae (CRKP), Pseudomonas aeruginosa (CRPA), vancomycin-resistant Enterococcus faecium (VRE. faecium) and Enterococcus faecalis (VR E. faecalis)).
The CARSS is a nationwide, voluntary bacterial resistance surveillance network covering secondary and tertiary hospitals that submits standardized laboratory results according to unified operating procedures and quality control requirements[18]. By 2022, 1997, hospitals had submitted drug resistance data to the CARSS, with 29% being secondary hospitals and 71% being tertiary hospitals[19]. Participation in the CARSS is dynamic, but all submitted data follow the same format and laboratory quality standards, which ensure comparability across sites[20]. Hierarchical information on bacterial drug resistance was obtained to understand the epidemic trend and new threats of bacterial drug resistance nationwide[21].
Antibiotic consumption data were drawn from a subset of hospitals reported to the National Hospital Information Network of the Chinese Pharmaceutical Association. We selected 829 hospitals for antibiotic use analyses, choosing sites such that the distribution of hospital levels (secondary vs. tertiary) and provincial coverage broadly matched that of CARSS contributors. Hospitals with continuous reporting from 2016 to 2022 were prioritized to enhance temporal comparability. Consumption data comprised annual hospital-level totals for 161 antibiotics, which were extracted and classified into 15 pharmacological classes, including 1) Aminoglycosides, 2) Amphenicols, 3) Carbapenem, 4) Cephalosporins, 5) Lincomycin and Clindamycin, 6) Macrolides, 7) Oxazolidinones, 8) Penicillin, 9) Polymyxin, 10) Quinolone, 11) Sulfonamides, 12) Teicoplanin, 13) Tetracyclines, 14) Vancomycin and norvancomycin, and 15) β-Amidase inhibitor (including β-Amidase inhibitor, Cephalosporins/β-Amidase inhibitor, and Penicillin/β-Amidase inhibitor)[22] (Supplementary Table S1). The selection of antibiotics was guided by two criteria: their clinical relevance for treating infections caused by the six WHO-designated priority pathogens, and prior evidence of association with antimicrobial resistance in published literature (Supplementary Table S2). Antibiotic consumption was standardized to defined daily doses (DDDs) and reported annually as DDDs per patient-day at both provincial and national levels. We collected data on all antibacterial agents used systemically. Data regarding antifungals or antivirals were not considered.
To ensure comparability between AMR and antibiotic consumption datasets, we harmonized both sources at the provincial–year level. Only hospitals that submitted data within a given year were included without the imputation of missing values. In addition, the population of different provinces was collected as a covariate variable from the China Statistics Yearbook from 2016 to 2022[23].
-
The median and interquartile range (25th and 75th percentiles) were reported for DDDs as continuous variables with a non-normal distribution, and the resistance proportions were summarized for each bacterial species. Temporal trends in nationwide resistance were analyzed using beta regression. The resistance proportion of the six bacteria was considered the dependent variable, whereas antibiotic consumption and provincial population by year were considered independent variables. To account for possible changes in hospital participation and clustering of data within provinces over seven consecutive years, we aggregated data at the provincial-year level and applied hierarchical models with province-level random effects. The association between resistance proportions as dependent and independent variables was examined using hierarchical models with a beta-link function. Before multivariate model fitting, we excluded variables with VIF > 10 to avoid multicollinearity. Continuous independent variables (e.g., year, population, and antibiotic consumption) were mean-centered prior to modeling to improve numerical stability and interpretability of regression coefficients. This approach reduces the bias from uneven hospital counts across provinces and partially mitigates effects of inconsistent hospital-level participation. Statistical significance was set than 0.05. All statistical analyses were performed using the R software (R Core Team 2024).
-
The funder played no role in the study design, data collection, data analysis, data interpretation, or manuscript writing. The corresponding author had full access to all data in the study and had the final responsibility for the decision to submit the manuscript for publication.
-
This study included 1,302 drug-resistant proportions at the provincial level, spanning seven years, across six bacterial strains in 31 provinces of mainland China. After removing the random effects of provinces, there was no statistically significant trend in the population of each province over time (β = 10.577, z = 1.765, P = 0.088).
-
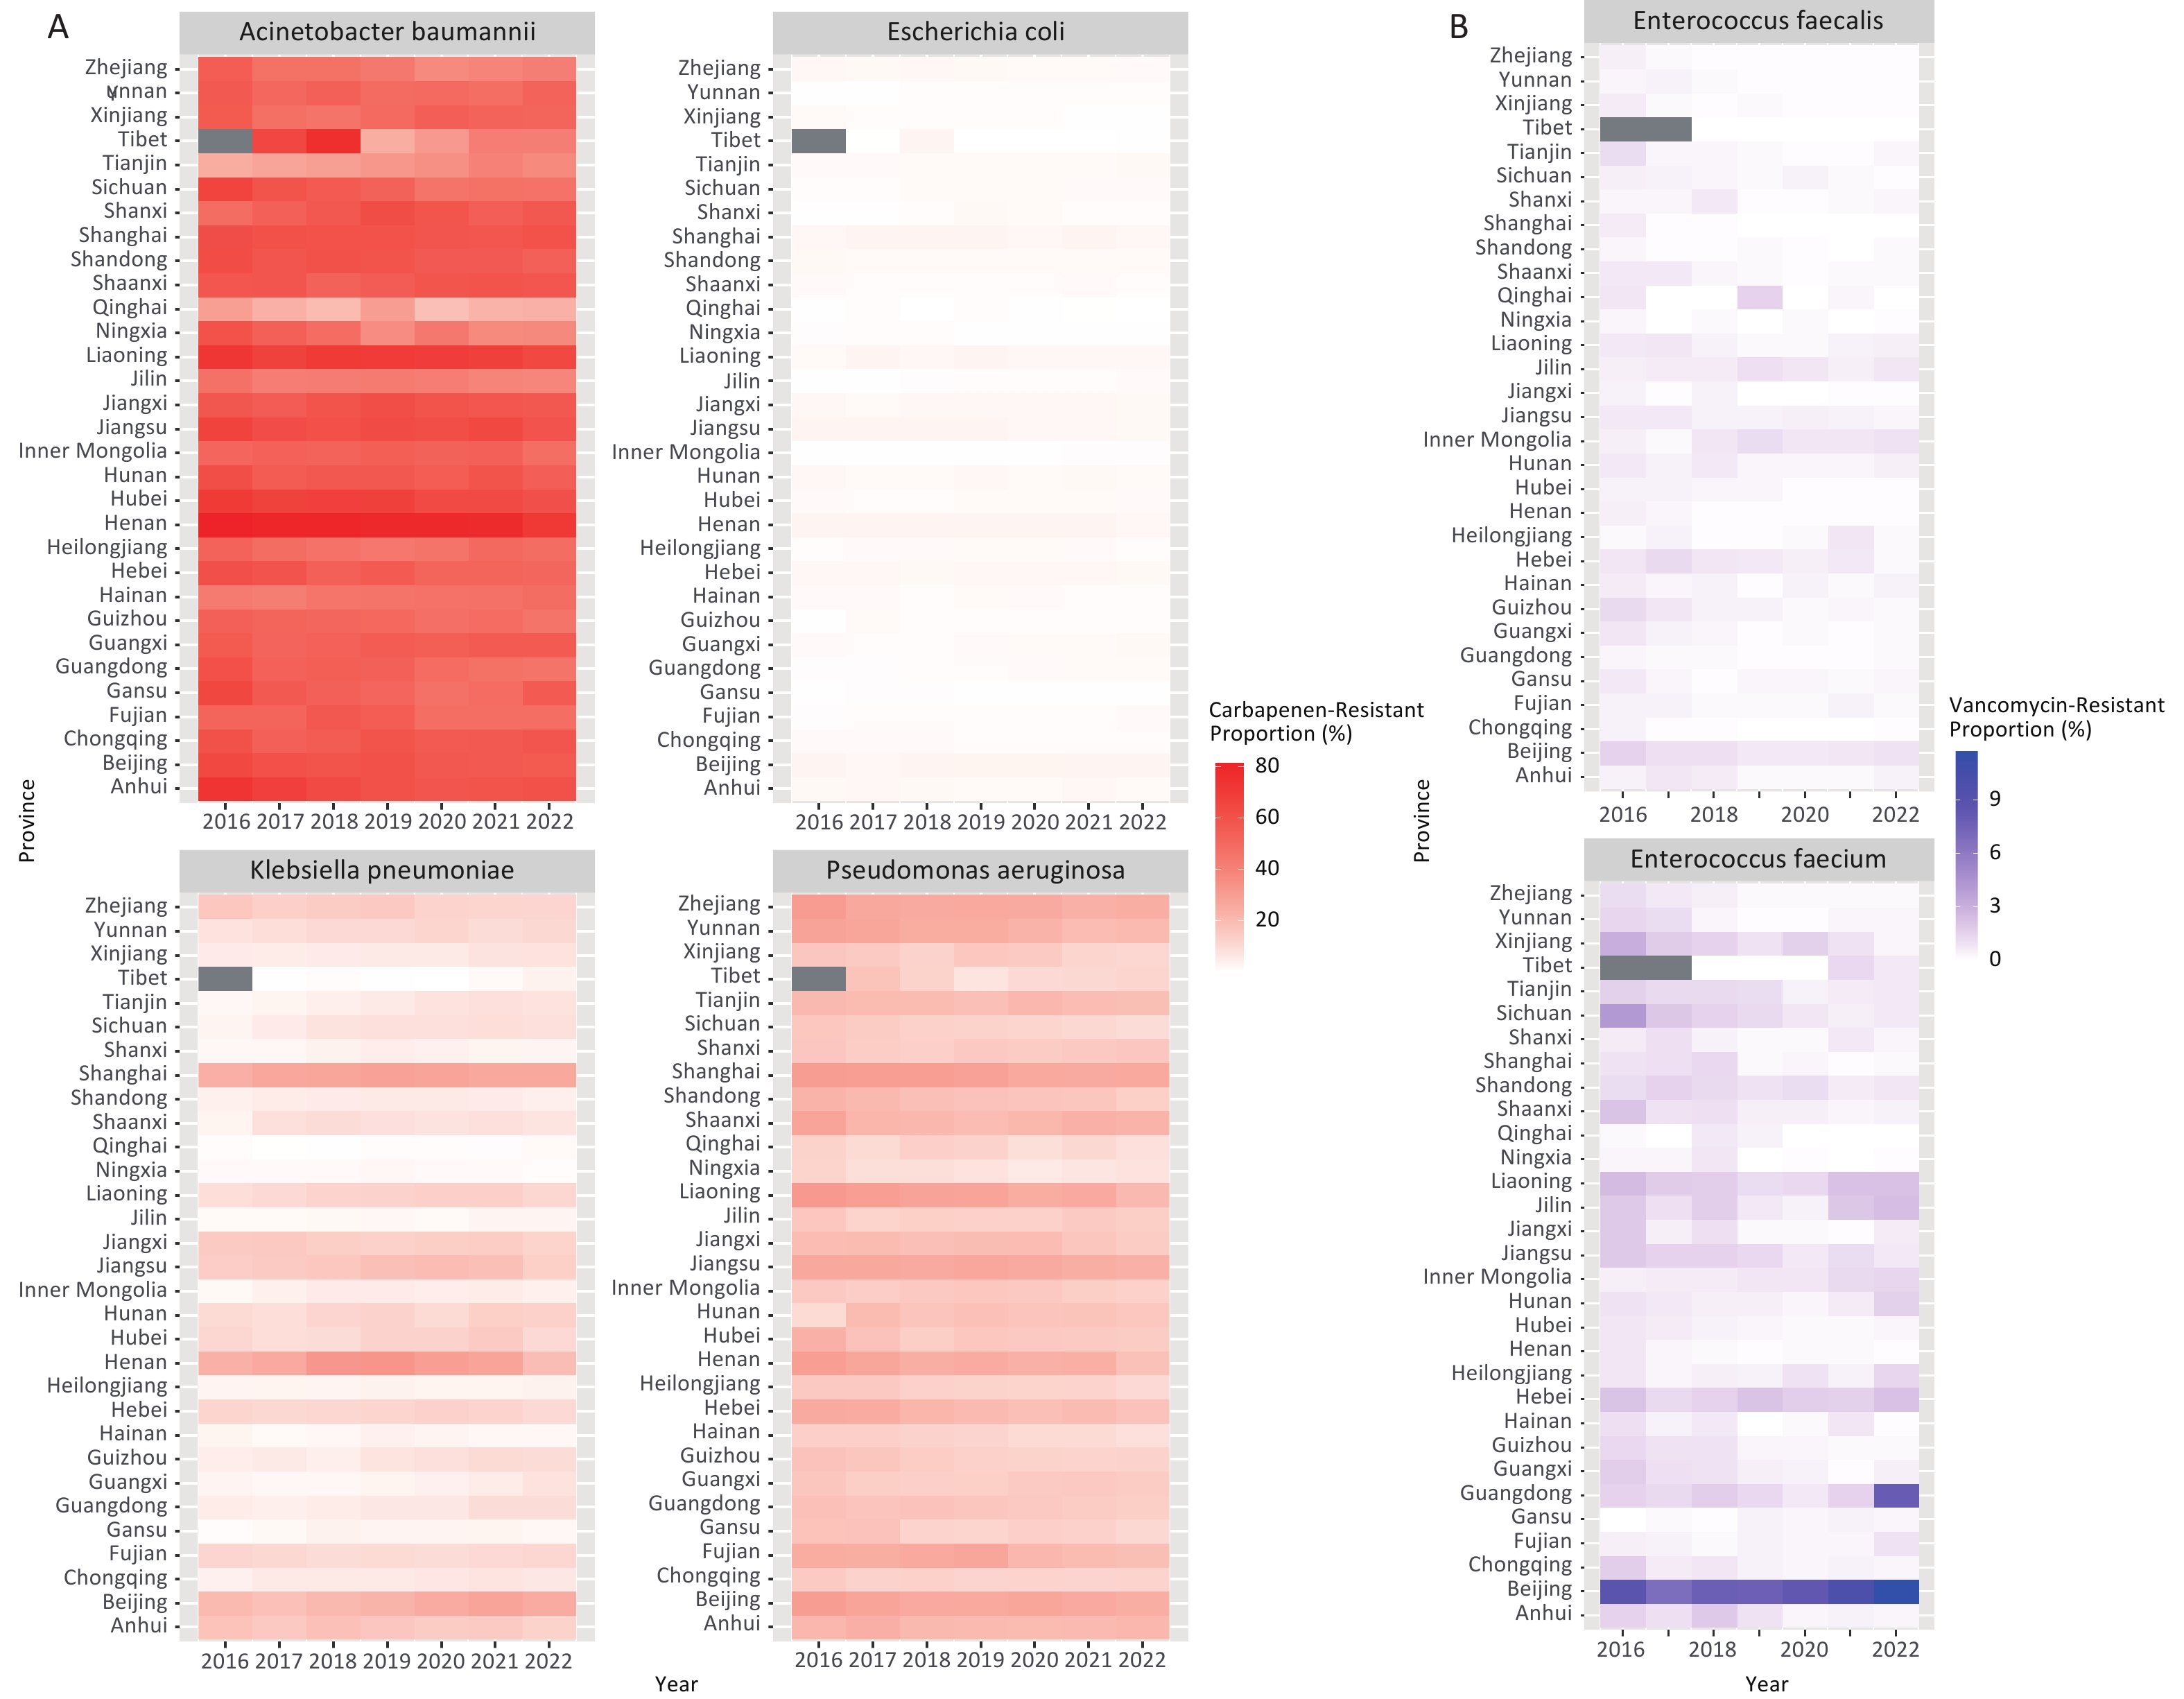
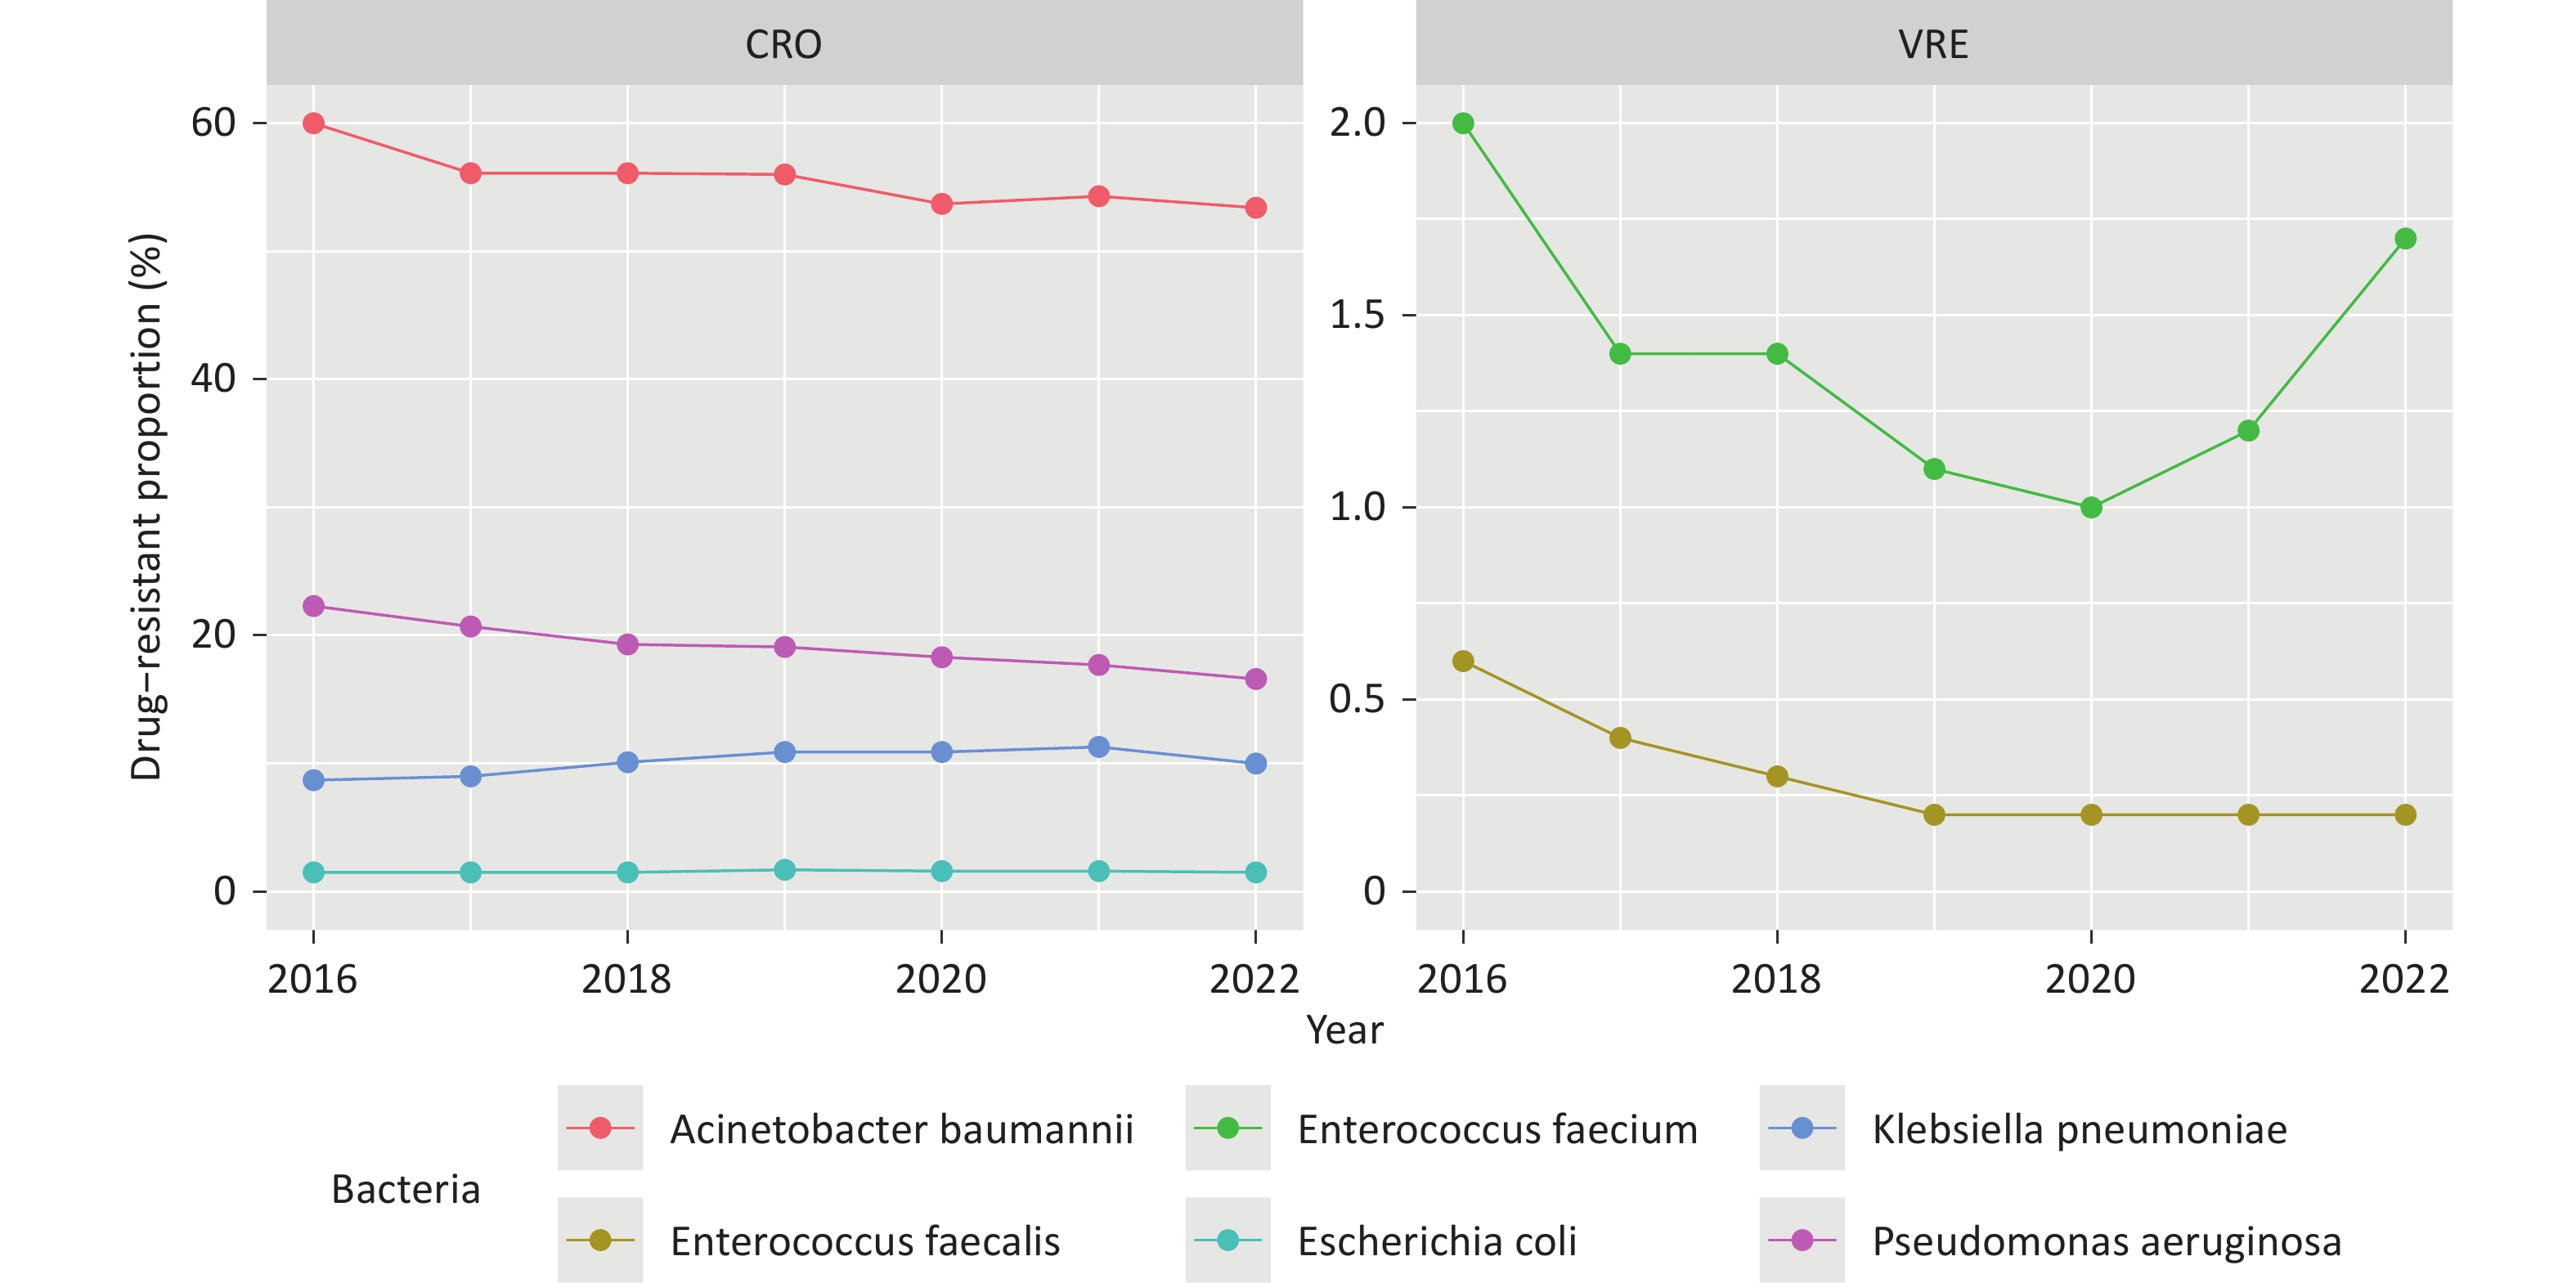
The drug-resistant proportions of CRAB, CRPA, VR E. faecium, and VR E. faecalis at the national level showed a significant decline from 2016 to 2022 (P < 0.01, Figure 1, Supplementary Table S2). However, the drug-resistant proportions of CRKP exhibited a significant increase during the same period (β = 0.061, z = 4.442, P < 0.01, Figure 1). The provincial-level median resistance proportion of CRKP increased from 4.6% in 2016 to 8.2% in 2022, representing a nearly a two-fold increase The drug-resistant proportions of each bacterial strain varied significantly across the provinces in each respective year (P < 0.01, Figure 2).
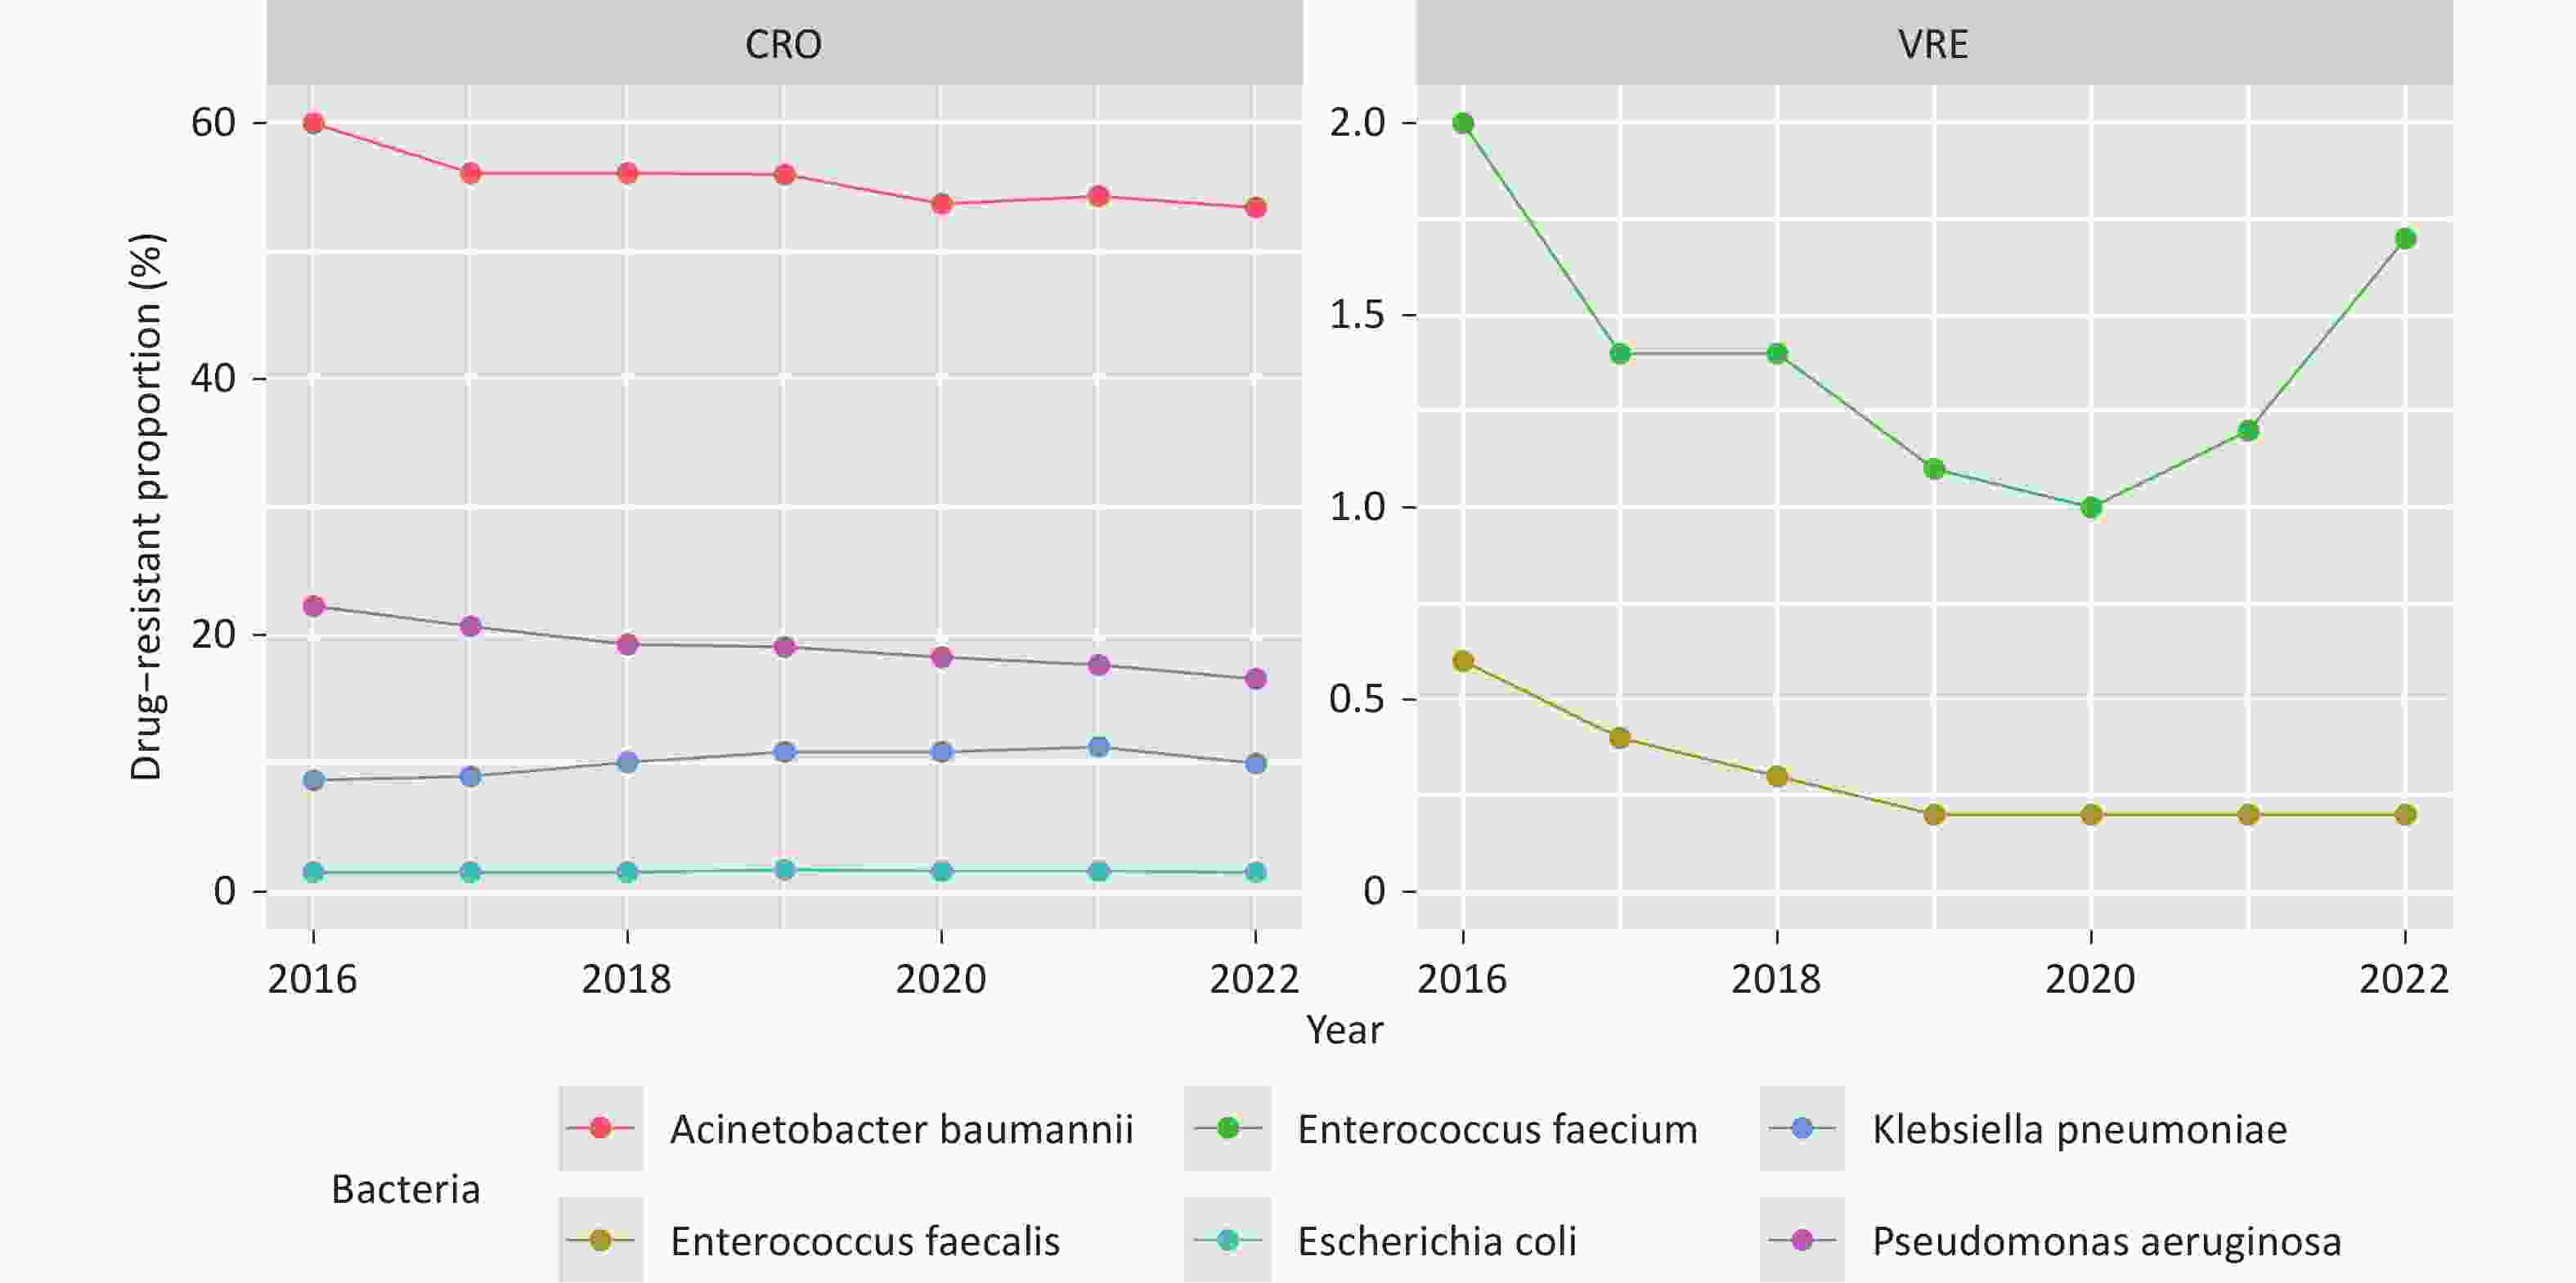
Figure 1. Drug-resistant proportions of CRO and VRE in China from 2016 to 2022. Decreasing (CRAB and CRPA) and increasing (CRKP) trends.
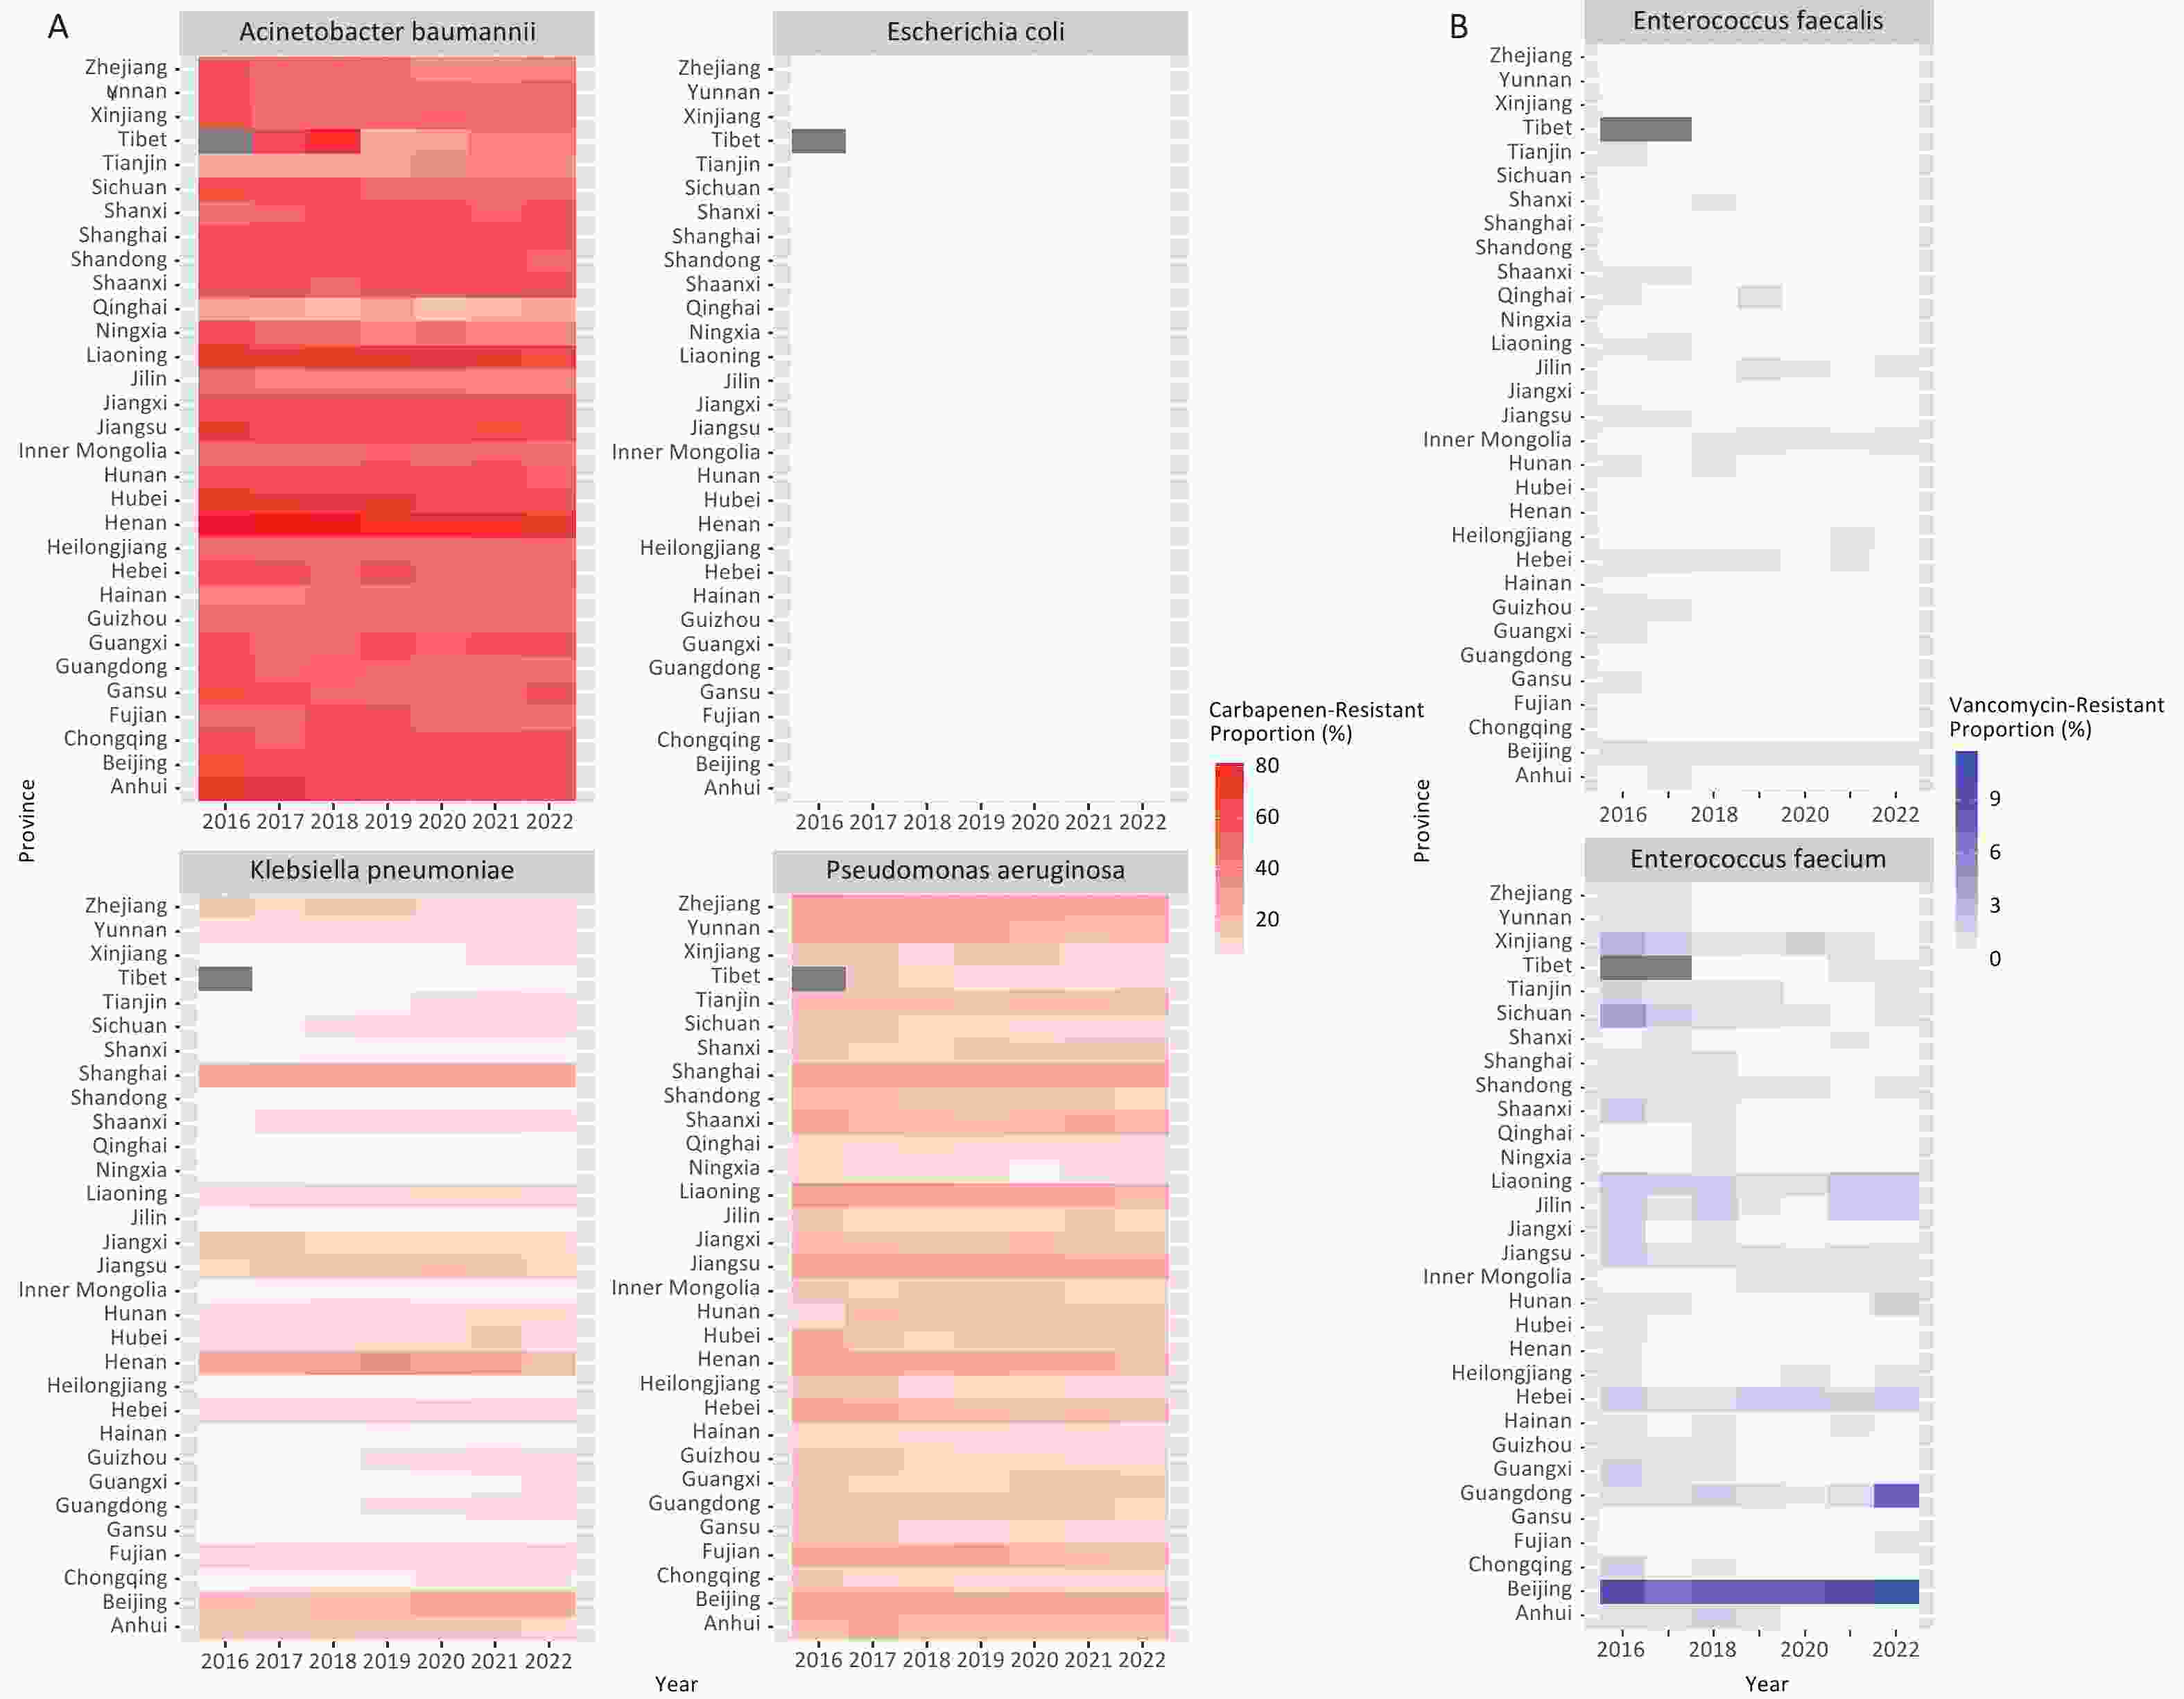
Figure 2. Drug-resistant proportions of CRO and VRE across the provinces in China from 2016 to 2022. A: Drug resistance proportions of CRAB, CRPA, CRKP, and CREC. B: Proportions of drug-resistant VR E. faecium and VR E. faecalis. Interprovincial heterogeneity in the resistance proportions has been observed across China.
-
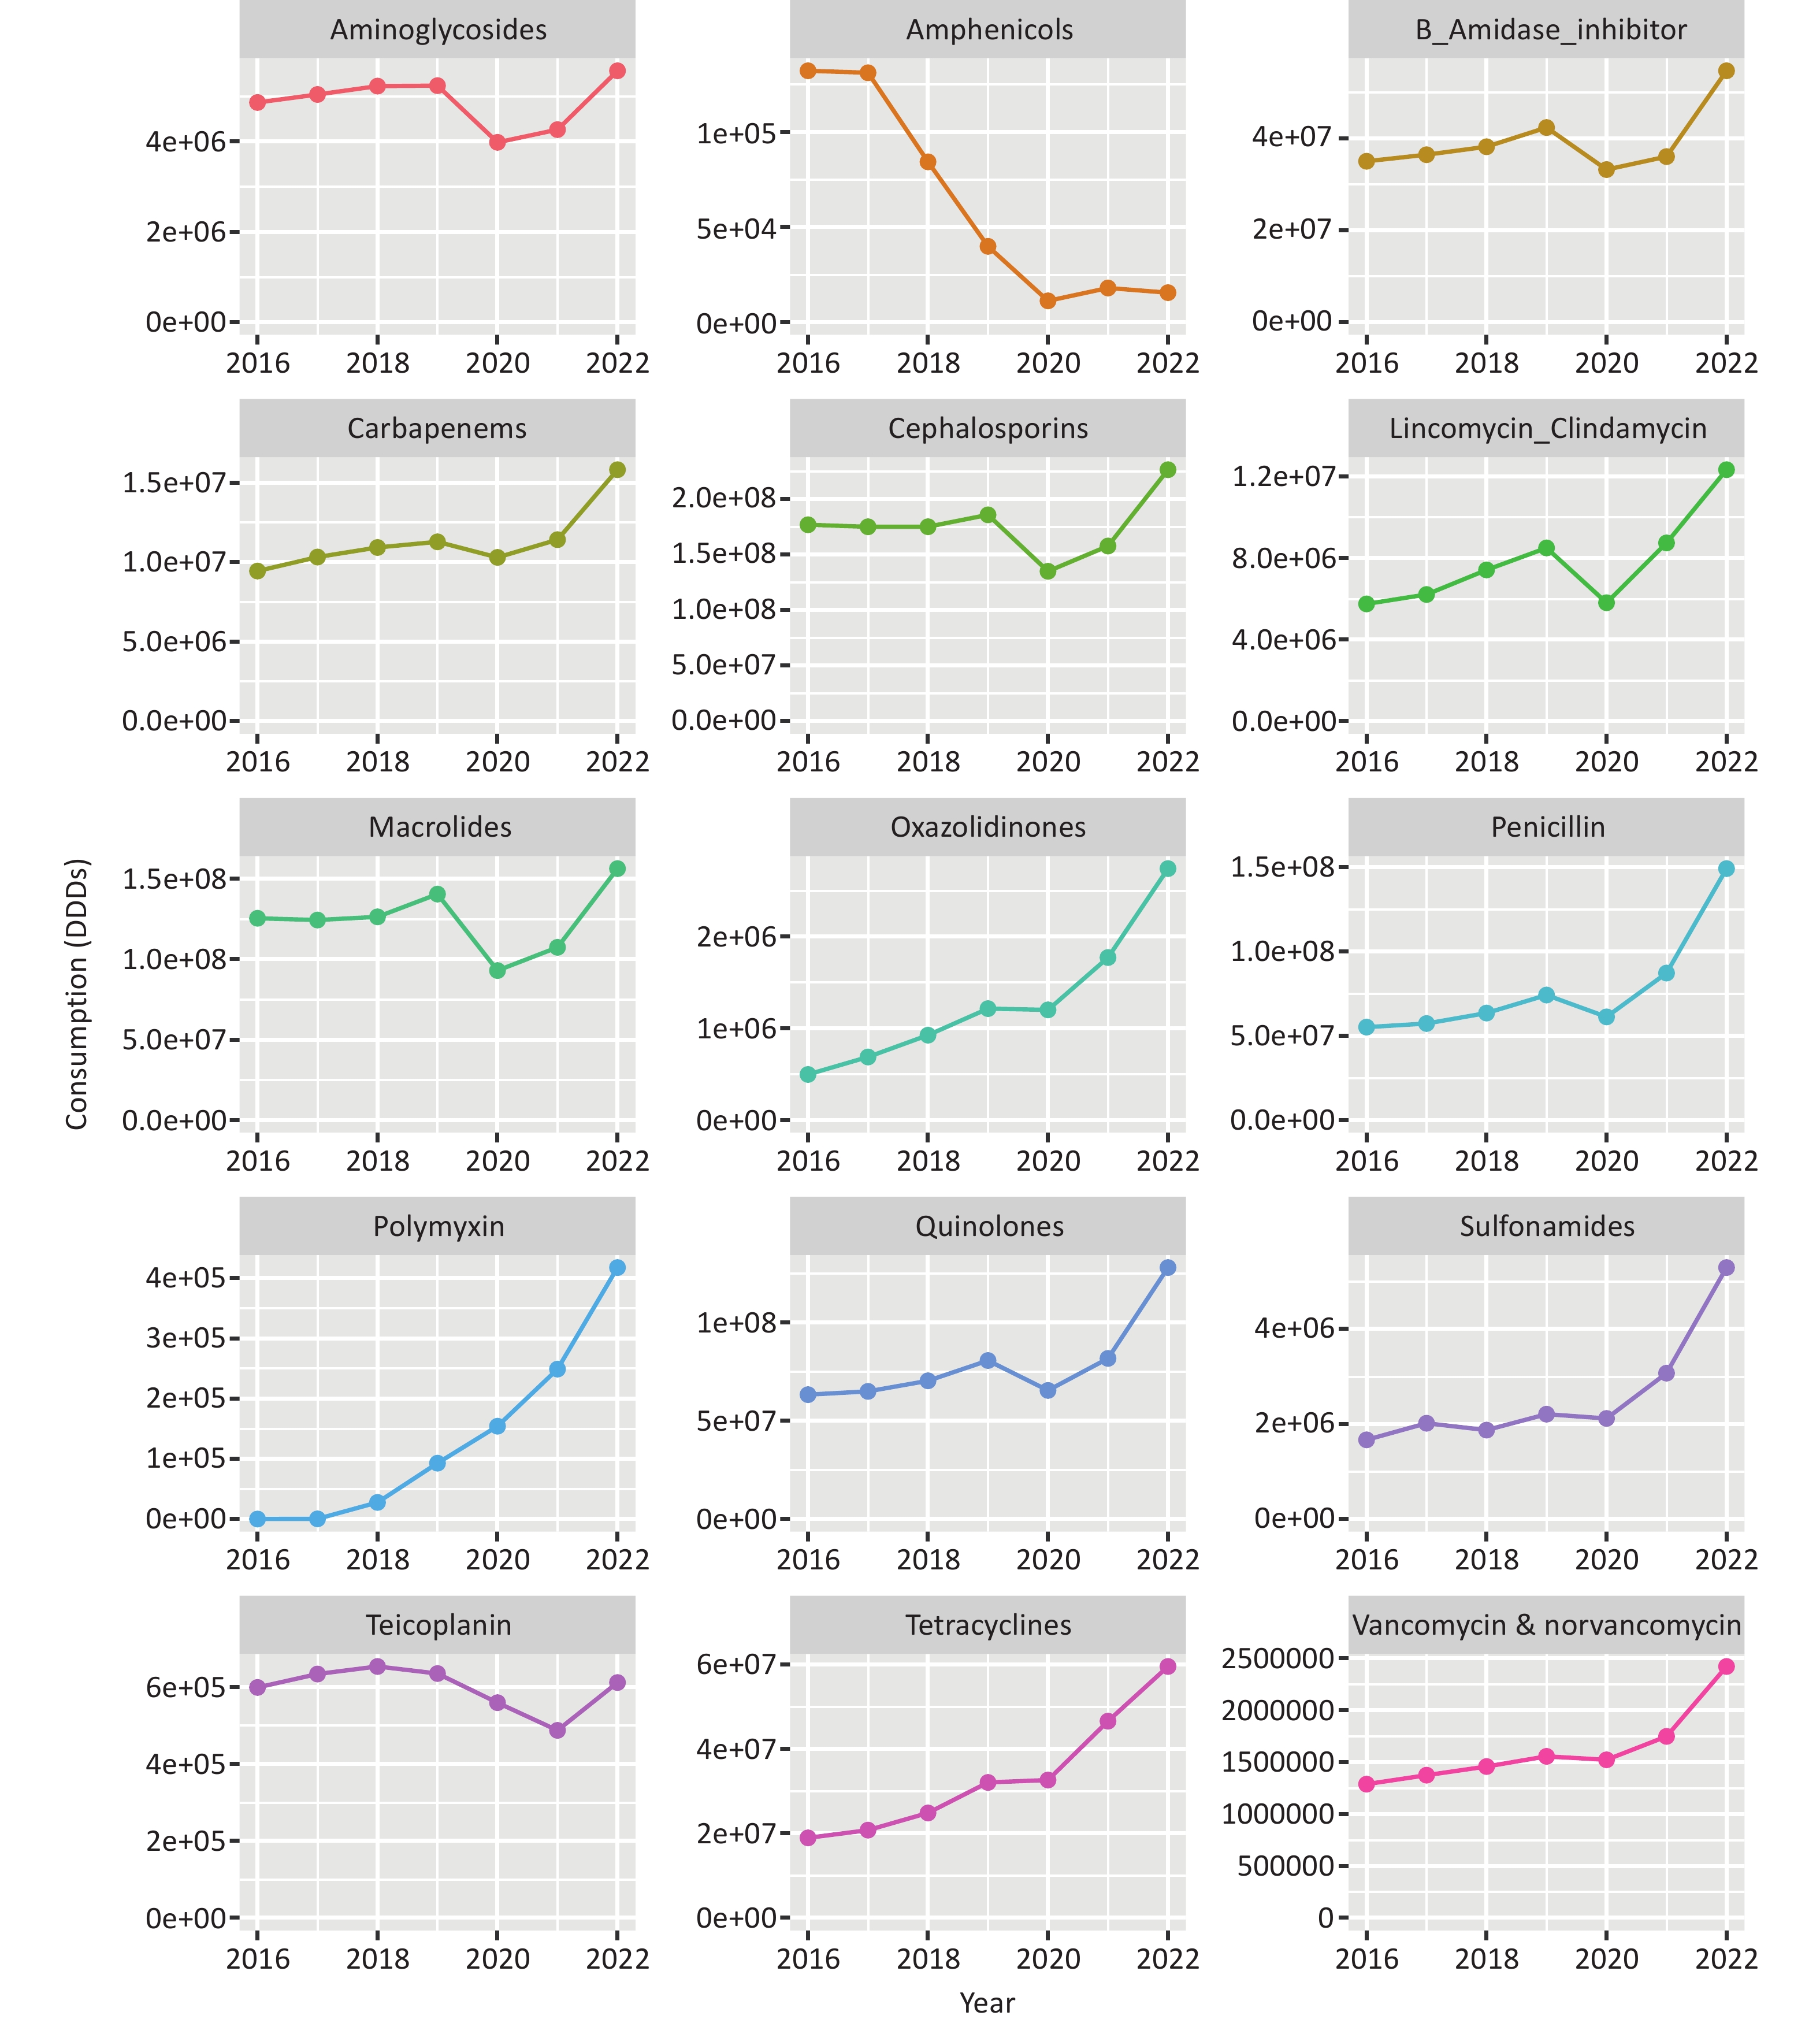
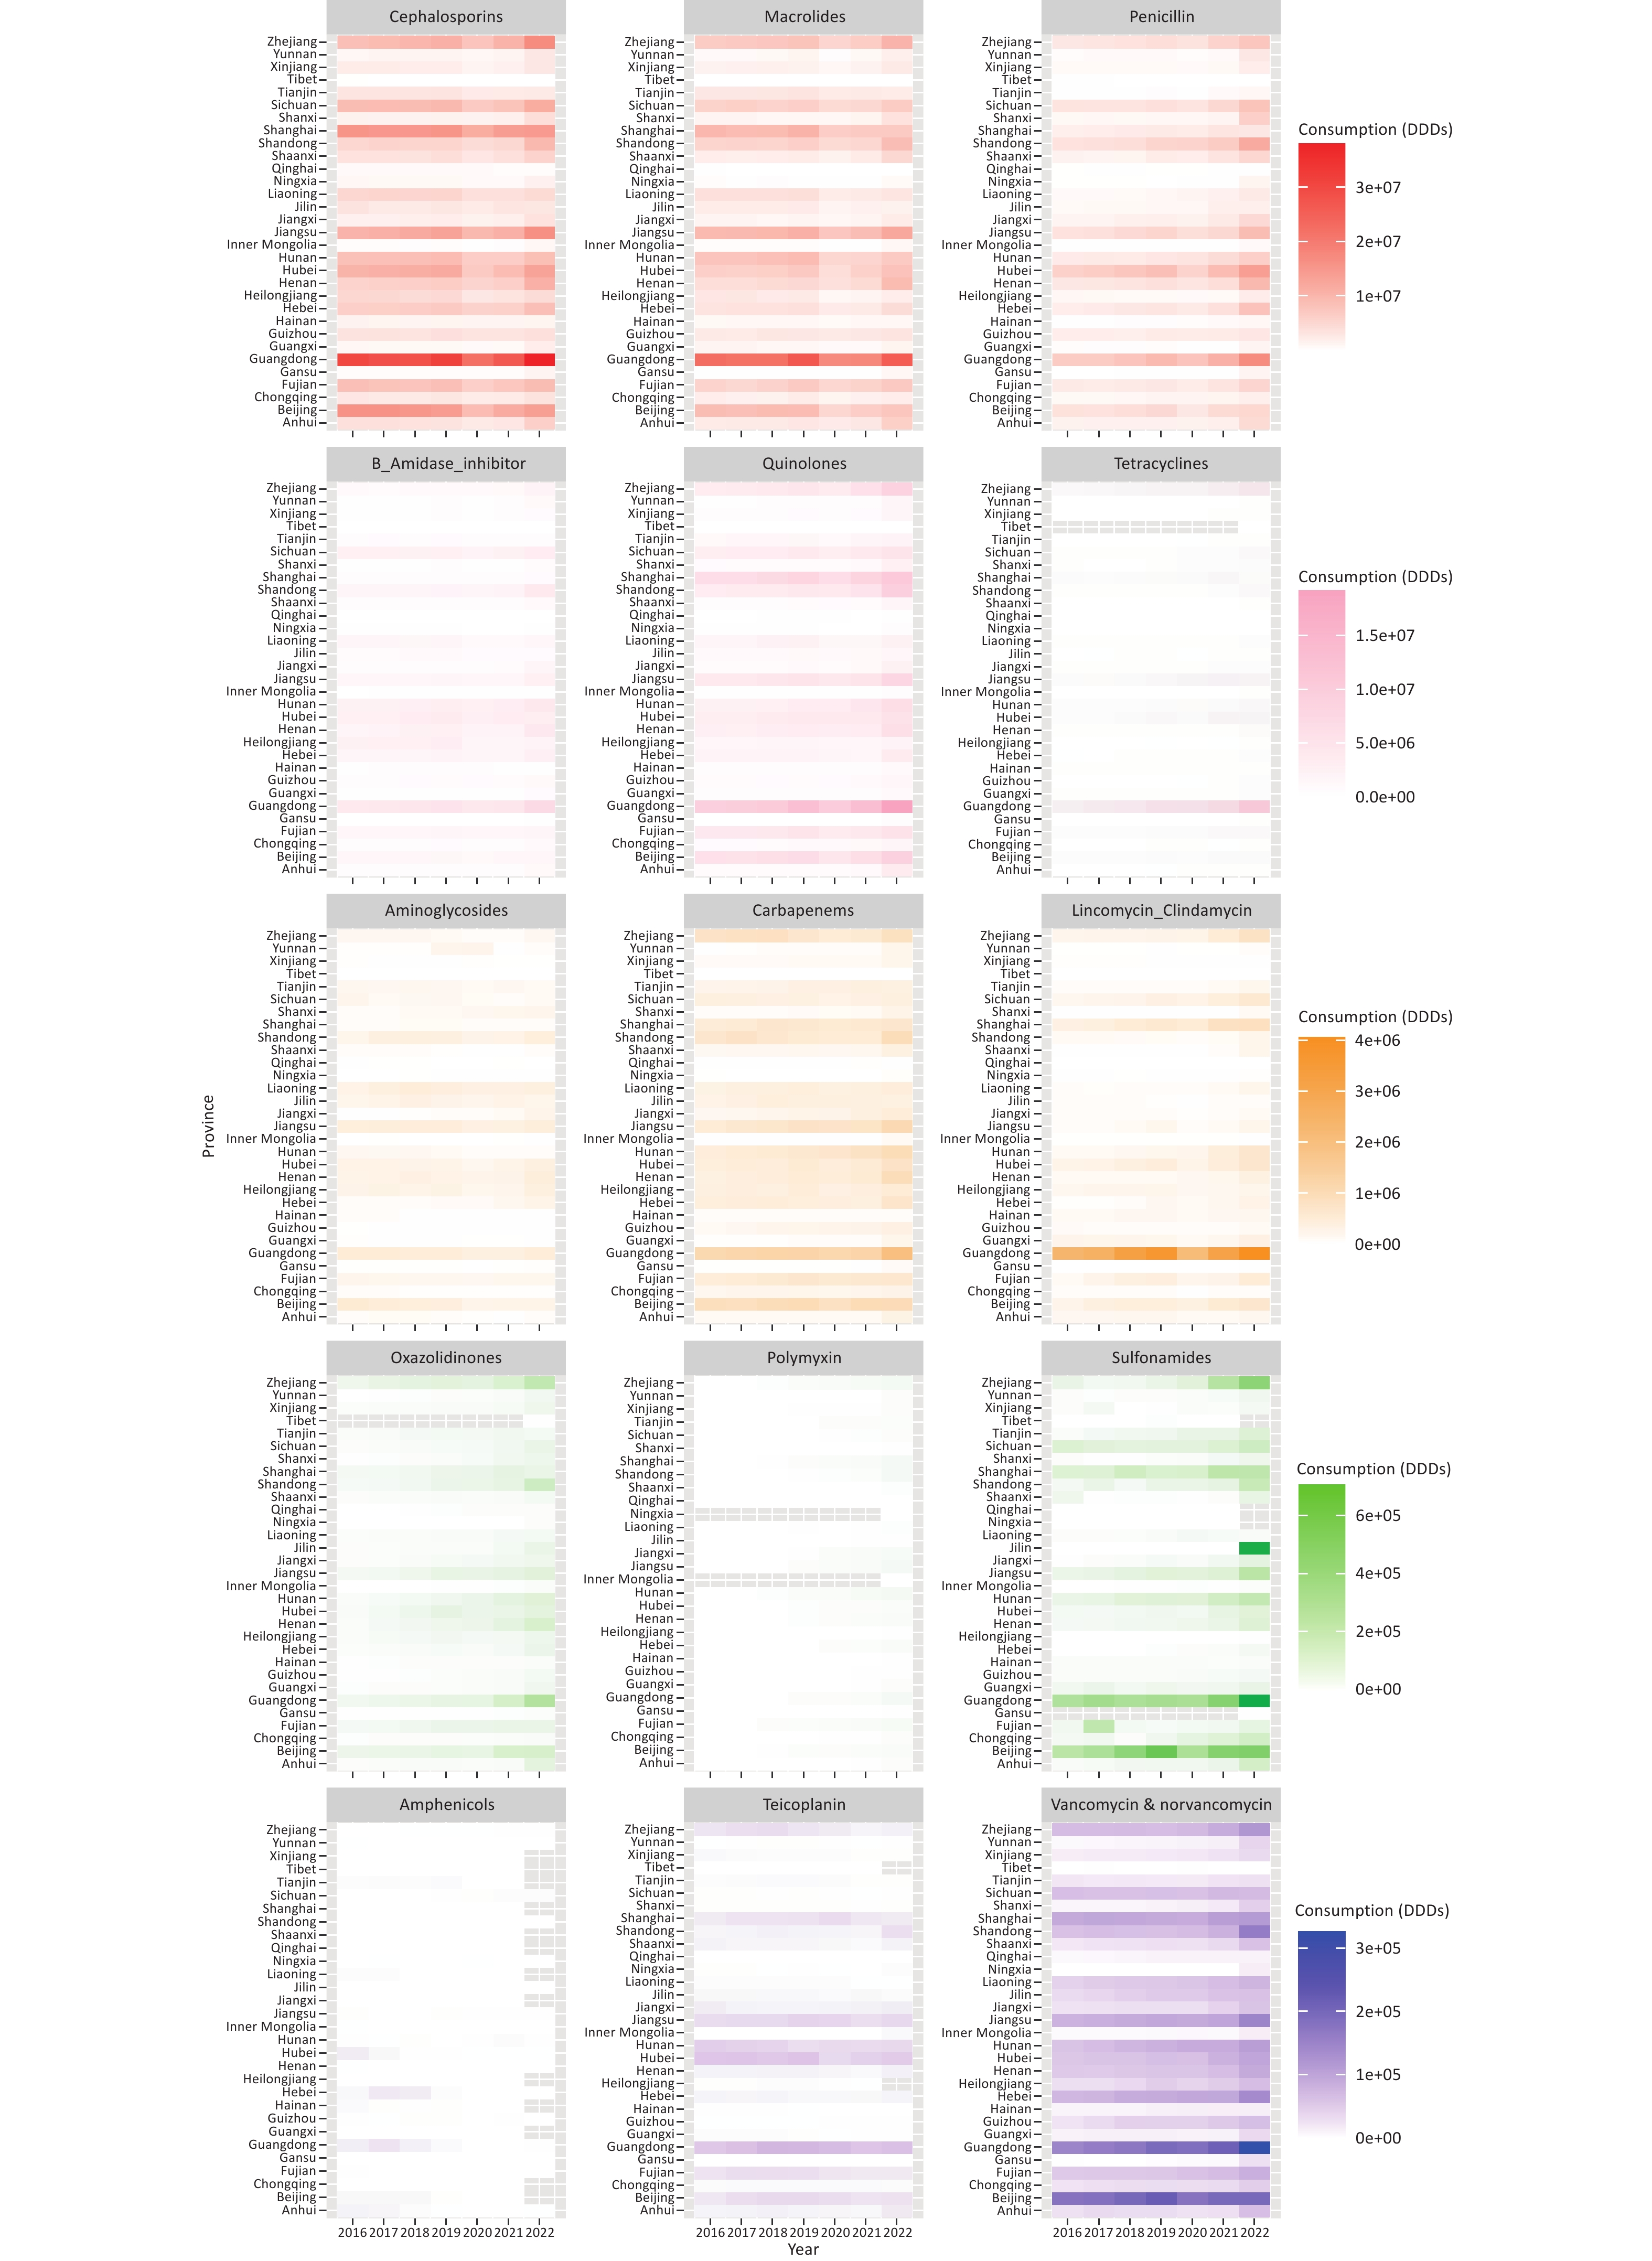
The annual DDDs sums for the 15 antibiotic classes nationwide are presented in Figure 3. After adjusting for the clustering effect of provinces, there was a statistically significant increase in DDDs for the following antibiotic classes from 2016 to 2022: 1) β-lactamase inhibitors, 2) Carbapenems, 3) Vancomycin and norvancomycin, 4) Lincomycin Clindamycin, 5) Oxazolidinones, 6) Penicillin, 7) Polymyxin, 8) Quinolones, 9) Sulfonamides, and 10) Tetracyclines (β > 0, P < 0.05, Supplementary Table S3). At the provincial level, the median DDDs of Penicillin increased from 550.87 × 10⁵ in 2016 to 1490.21 × 105 in 2022, representing a 2.7-fold rise. The median DDDs of Polymyxin rose sharply from < 0.01 × 10² in 2016 to 4176.32 × 102 in 2022. Conversely, the median DDDs of Amphenicols at the provincial level declined substantially, from 1322.06×102 in 2016 to 155.48 × 10² in 2022 (β = −767.23, P = 0.019, Supplementary Table S3). Furthermore, for each antibiotic class, there were significant differences in DDDs among provinces (P < 0.01, Figure 4).
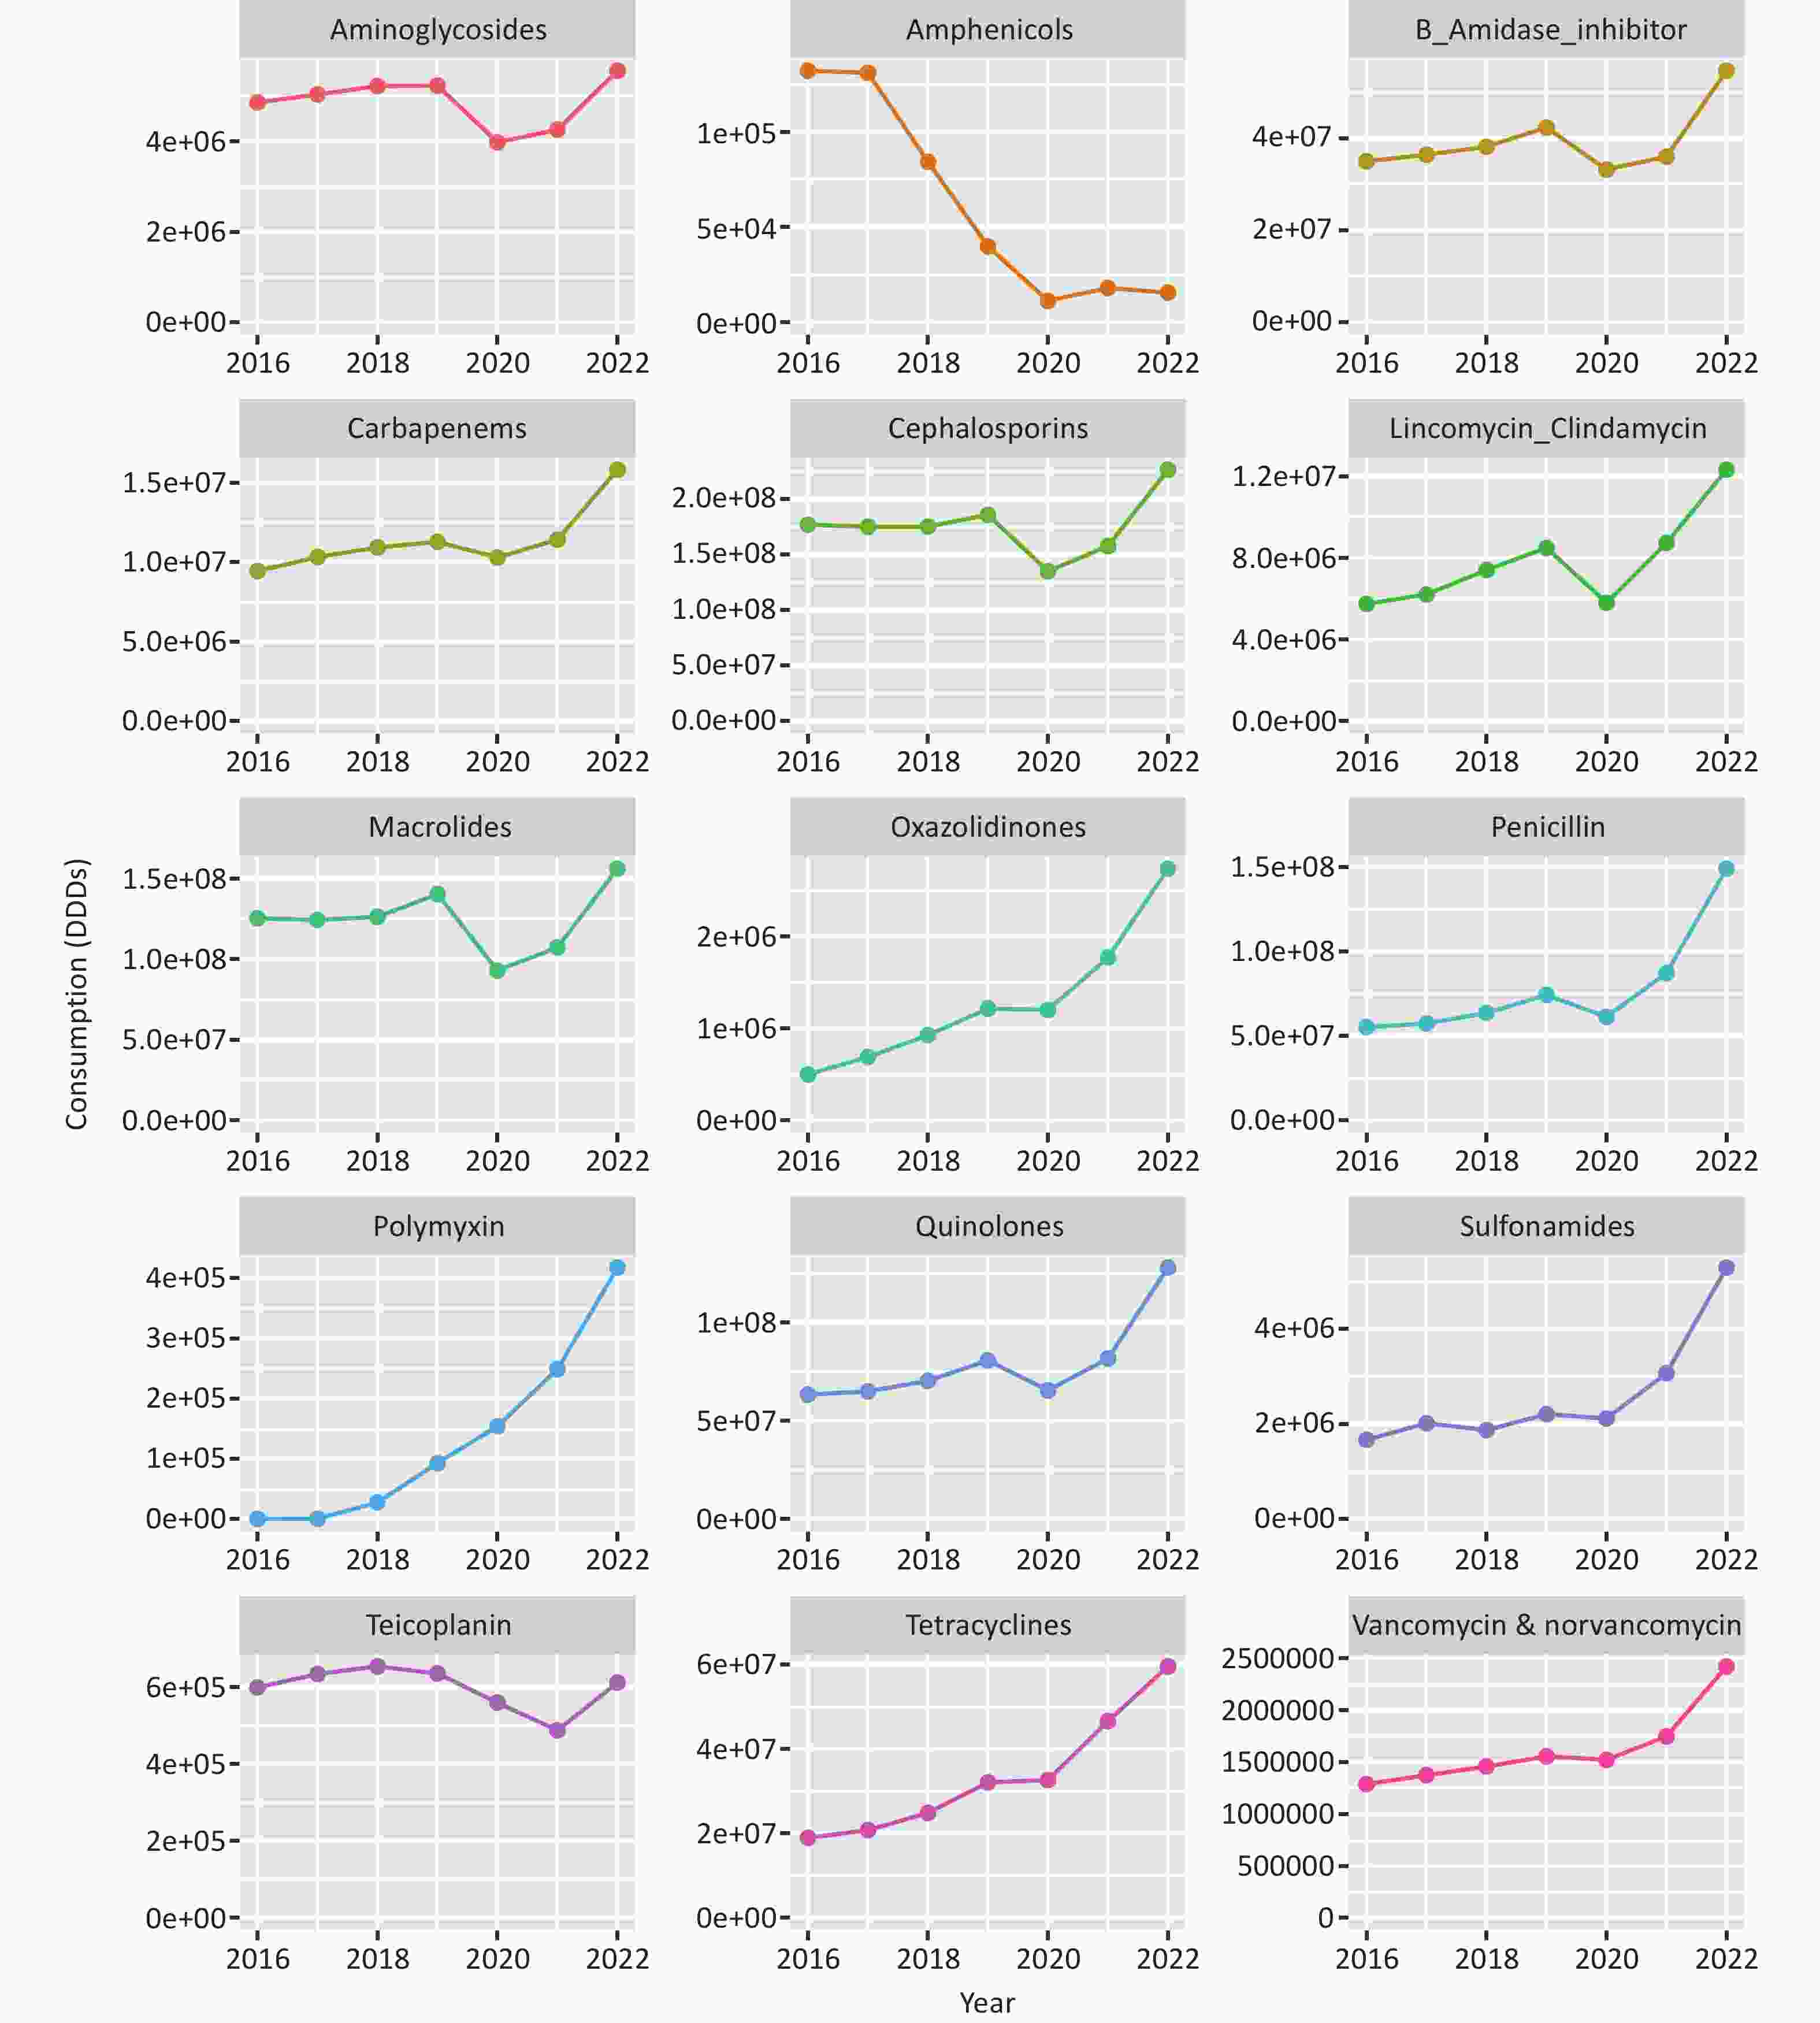
Figure 3. The total consumption of 15 antibiotic classes in China from 2016 to 2022.
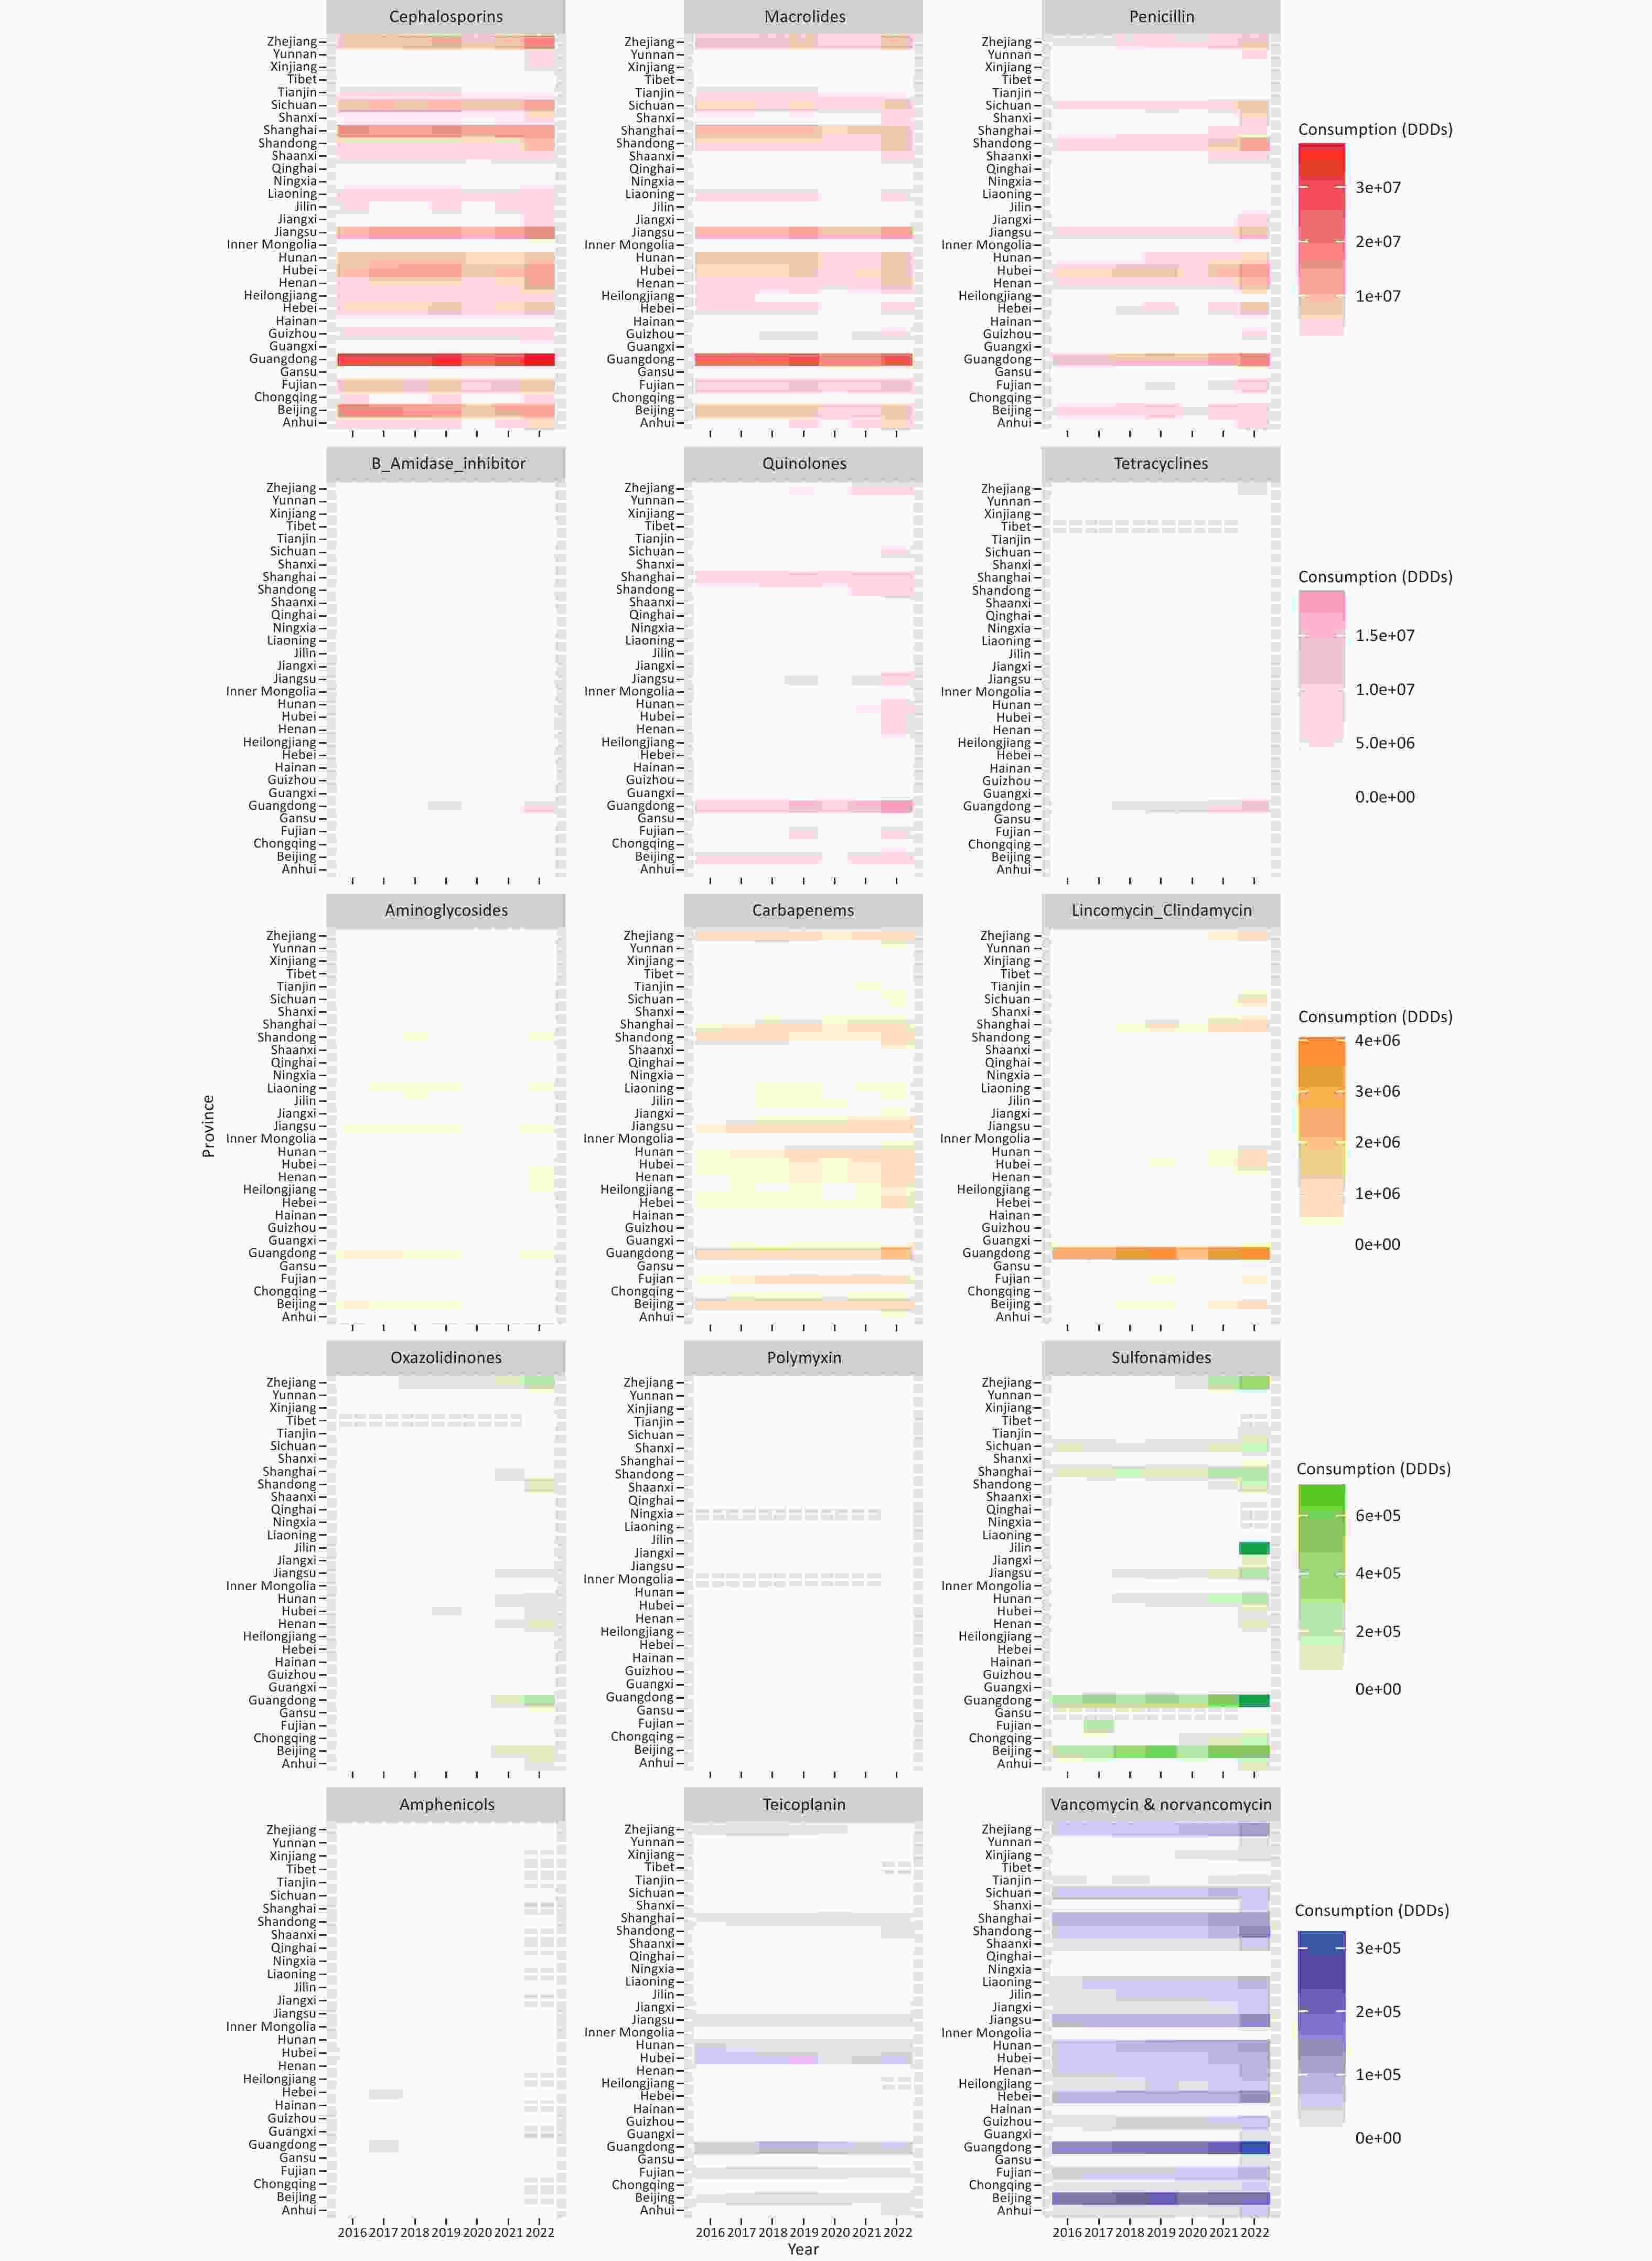
Figure 4. The consumption of 15 antibiotic classes across provinces in China from 2016 to 2022.
-
After adjusting for clustering effects in provinces using a hierarchical model, the proportions of CRAB and CRPA decreased from 2016 to 2022 (P < 0.01). However, there was an increase in the proportion of CRKP (β = 0.06, P < 0.001). Meanwhile, no statistically significant change was observed in the proportion of CREC over time (β < 0.01, P = 0.896). See Table 1.
Variable CRAB CRPA CRKP CREC β (95% CI) p β (95% CI) p β (95% CI) p β (95% CI) p Year −0.04
(−0.06, −0.02)<0.001 −0.05
(−0.06, −0.04)<0.001 0.06
(0.03, 0.09)<0.001 9.87×10⁻⁴
(−0.01, 0.02)0.896 Population 6.96×10⁻⁵
(2.33×10⁻⁵, 11.59×10⁻⁵)0.003 4.52×10⁻⁵
(1.05×10⁻⁶, 8.94×10⁻⁵)0.045 1.55×10⁻⁴
(5.70×10⁻⁵, 2.53×10⁻⁴)0.002 7.83×10⁻⁵
(2.64×10⁻⁵, 1.30×10⁻⁴)0.003 Aminoglycosides 3.34×10⁻⁷
(−2.35×10⁻⁷, 9.03×10⁻⁷)0.250 1.90×10⁻⁸
(−3.67×10⁻⁷, 4.05×10⁻⁷)0.923 −6.71×10⁻⁷
(−1.29×10⁻⁶, −5.60×10⁻⁸)0.033 1.54×10⁻⁷
(−3.98×10⁻⁷, 7.06×10⁻⁷)0.584 Amphenicols 2.92×10⁻⁶
(−5.34×10⁻⁶, 1.12×10⁻⁵)0.489 5.51×10⁻⁶
(4.51×10⁻⁷, 1.06×10⁻⁵)0.033 −7.23×10⁻⁶
(−1.53×10⁻⁵, 8.70×10⁻⁷)0.080 −6.51×10⁻⁶
(−1.31×10⁻⁵, 5.68×10⁻⁸)0.052 β−lactamase inhibitors 2.63×10⁻⁸
(−4.59×10⁻⁸, 9.85×10⁻⁸)0.476 −4.19×10⁻⁸
(−9.28×10⁻⁸, 8.97×10⁻⁹)0.106 −8.63×10⁻⁸
(−1.66×10⁻⁷, −6.45×10⁻⁹)0.034 4.15×10⁻⁹
(−6.94×10⁻⁸, 7.77×10⁻⁸)0.912 Carbapenems 1.07×10⁻⁷
(−1.67×10⁻⁷, 3.82×10⁻⁷)0.444 −2.42×10⁻⁸
(−2.32×10⁻⁷, 1.84×10⁻⁷)0.819 −2.34×10⁻⁷
(−5.87×10⁻⁷, 1.18×10⁻⁷)0.192 2.02×10⁻⁷
(−6.57×10⁻⁸, 4.69×10⁻⁷)0.139 Cephalosporins 1.00×10⁻⁸
(−4.93×10⁻⁹, 2.50×10⁻⁸)0.189 −1.37×10⁻⁹
(−1.47×10⁻⁸, 1.20×10⁻⁸)0.841 −2.13×10⁻⁸
(−4.16×10⁻⁸, −1.04×10⁻⁹)0.039 9.73×10⁻¹⁰
(−1.72×10⁻⁸, 1.92×10⁻⁸)0.916 Vancomycin & norvancomycin 1.24×10⁻⁷
(−1.73×10⁻⁶, 1.92×10⁻⁶)0.896 −4.58×10⁻⁷
(−1.92×10⁻⁶, 1.00×10⁻⁶)0.538 −1.71×10⁻⁶
(−4.15×10⁻⁶, 7.42×10⁻⁷)0.172 1.55×10⁻⁶
(−8.48×10⁻⁸, 3.18×10⁻⁶)0.063 Teicoplanin 2.31×10⁻⁶
(−1.86×10⁻⁶, 6.48×10⁻⁶)0.278 5.23×10⁻⁷
(−2.50×10⁻⁶, 3.54×10⁻⁶)0.734 −2.21×10⁻⁶
(−7.11×10⁻⁶, 2.69×10⁻⁶)0.376 3.21×10⁻⁶
(−1.33×10⁻⁶, 7.75×10⁻⁶)0.166 Lincomycin−Clindamycin 2.07×10⁻⁸
(−1.43×10⁻⁷, 1.85×10⁻⁷)0.804 −2.76×10⁻⁸
(−1.52×10⁻⁷, 9.63×10⁻⁸)0.662 1.70×10⁻⁸
(−1.95×10⁻⁷, 2.29×10⁻⁷)0.875 7.49×10⁻⁸
(−1.06×10⁻⁷, 2.55×10⁻⁷)0.416 Macrolides 1.27×10⁻⁸
(−7.27×10⁻⁹, 3.26×10⁻⁸)0.213 6.07×10⁻⁹
(−8.00×10⁻⁹, 2.01×10⁻⁸)0.398 −3.07×10⁻⁸
(−5.28×10⁻⁸, −8.57×10⁻⁹)0.007 −1.09×10⁻⁹
(−2.45×10⁻⁸, 2.23×10⁻⁸)0.928 Oxazolidinones −3.21×10⁻⁸
(−9.66×10⁻⁷, 9.01×10⁻⁷)0.946 −7.48×10⁻⁷
(−1.61×10⁻⁶, 1.10×10⁻⁷)0.088 6.44×10⁻⁸
(−1.29×10⁻⁶, 1.41×10⁻⁶)0.925 2.09×10⁻⁷
(−5.26×10⁻⁷, 9.44×10⁻⁷)0.577 Penicillin 2.74×10⁻⁹
(−2.17×10⁻⁸, 2.72×10⁻⁸)0.826 −1.46×10⁻⁸
(−3.17×10⁻⁸, 2.60×10⁻⁹)0.096 −4.56×10⁻⁸
(−6.96×10⁻⁸, −2.16×10⁻⁸)<0.001 7.94×10⁻¹⁰
(−1.97×10⁻⁸, 2.13×10⁻⁸)0.940 Polymyxin −1.67×10⁻⁶
(−6.49×10⁻⁶, 3.15×10⁶)0.498 −5.26×10⁻⁶
(−9.97×10⁻⁶, −5.47×10⁻⁷)0.029 −6.42×10⁻⁶
(−1.54×10⁻⁵, 2.55×10⁻⁶)0.162 −1.59×10⁻⁶
(−4.98×10⁻⁶, 1.80×10⁻⁶)0.357 Quinolones 8.73×10⁻⁹
(−2.02×10⁻⁸, 3.77×10⁻⁸)0.554 −7.44×10⁻⁹
(−2.87×10⁻⁸, 1.38×10⁻⁸)0.492 −2.51×10⁻⁸
(−5.74×10⁻⁸, 7.26×10⁻⁹)0.129 8.73×10⁻⁹
(−1.76×10⁻⁸, 3.51×10⁻⁸)0.516 Sulfonamides −2.00×10⁻⁸
(−4.31×10⁻⁷, 3.91×10⁻⁷)0.924 −6.80×10⁻⁸
(−3.52×10⁻⁷, 2.16×10⁻⁷)0.638 −3.24×10⁻⁷
(−8.61×10⁻⁷, 2.12×10⁻⁷)0.236 2.08×10⁻⁷
(−2.26×10⁻⁷, 6.41×10⁻⁷)0.348 Tetracyclines −5.21×10⁻⁹
(−4.12×10⁻⁸, 3.08×10⁻⁸)0.777 −2.68×10⁻⁸
(−6.28×10⁻⁸, 9.29×10⁻⁹)0.146 3.06×10⁻⁸
(−1.53×10⁻⁸, 7.64×10⁻⁸)0.191 1.73×10⁻⁸
(−1.22×10⁻⁸, 4.68×10⁻⁸)0.251 Note. CRAB: Acinetobacter baumannii; CRPA: Pseudomonas aeruginosa; CRKP: Klebsiella pneumoniae; CREC: Escherichia coli. 95% CI: 95% confidence interval. Table 1. Association analysis of CRO drug resistance with single−factor inclusion in hierarchical model in China from 2016 to 2022
When considering only the association between DDDs of a single drug class and resistance proportions, the DDDs of the carbapenem class did not correlate significantly with the resistance proportions of four CRO bacteria (P > 0.05, Table 1), while some other antibiotics had associations with the resistance proportions, including Polymyxin with CRPA, β-lactamase inhibitors, Macrolides, Penicillin, respectively, with CRKP (Table 1). However, when adjusted for all antibiotics in the hierarchical model, the DDDs of the carbapenem class were positively associated with the proportions of CRAB (β = 5.75×10⁻⁷, P = 0.007) and CRPA (β = 5.26×10⁻⁷, P = 0.001). Table 2.
Variabl×10 CRAB CRPA CRKP CR×10C β (95% CI) p β (95% CI) p β (95% CI) p β (95% CI) p Year −2.31×10⁻² (−4.28×10⁻², −3.32×10⁻³) 0.022 −5.70×10⁻² (−7.35×10⁻², −4.05×10⁻²) <0.001 8.12×10⁻² (5.13×10⁻², 1.11×10⁻¹) <0.001 −4.81×10⁻³ (−3.08×10⁻², 2.12×10⁻²) 0.717 Population 8.34×10⁻⁵ (2.41×10⁻⁵, 1.43×10⁻⁴) 0.006 5.03×10⁻⁵ (5.05×10⁻⁶, 9.55×10⁻⁵) 0.029 1.20×10⁻⁴ (3.63×10⁻⁶, 2.37×10⁻⁴) 0.043 6.54×10⁻⁵ (1.03×10⁻⁵, 1.21×10⁻⁴) 0.020 Aminoglycosides −2.29×10⁻⁷ (−8.23×10⁻⁷, 3.65×10⁻⁷) 0.449 −1.82×10⁻⁷ (−6.41×10⁻⁷, 2.77×10⁻⁷) 0.437 −1.94×10⁻⁷ (−9.81×10⁻⁷, 5.92×10⁻⁷) 0.628 5.41×10⁻⁷ (−1.44×10⁻⁷, 1.23×10⁻⁶) 0.122 Amphenicols −1.37×10⁻⁶ (−6.68×10⁻⁶, 3.94×10⁻⁶) 0.613 2.03×10⁻⁷ (−4.00×10⁻⁶, 4.41×10⁻⁶) 0.924 2.66×10⁻⁶ (−4.30×10⁻⁶, 9.61×10⁻⁶) 0.454 −4.40×10⁻⁶ (−1.09×10⁻⁵, 2.06×10⁻⁶) 0.182 β−lactamase inhibitors −4.96×10⁻⁸ (−1.63×10⁻⁷, 6.38×10⁻⁸) 0.391 −1.26×10⁻⁷ (−2.20×10⁻⁷, −3.16×10⁻⁸) 0.009 −1.65×10⁻⁸ (−1.74×10⁻⁷, 1.41×10⁻⁷) 0.838 −1.14×10⁻⁷ (−2.45×10⁻⁷, 1.75×10⁻⁸) 0.089 Carbapenems 5.75×10⁻⁷ (1.60×10⁻⁷, 9.89×10⁻⁷) 0.007 5.26×10⁻⁷ (2.08×10⁻⁷, 8.45×10⁻⁷) 0.001 4.61×10⁻⁷ (−8.85×10⁻⁸, 1.01×10⁻⁶) 0.100 2.91×10⁻⁷ (−1.73×10⁻⁷, 7.55×10⁻⁷) 0.219 Cephalosporins 3.09×10⁻⁸ (−9.83×10⁻⁹, 7.16×10⁻⁸) 0.137 −4.29×10⁻⁹ (−3.66×10⁻⁸, 2.80×10⁻⁸) 0.794 2.12×10⁻⁸ (−3.32×10⁻⁸, 7.56×10⁻⁸) 0.445 −3.11×10⁻⁸ (−8.08×10⁻⁸, 1.87×10⁻⁸) 0.221 Vancomycin & norvancomycin −2.21×10⁻⁶ (−5.56×10⁻⁶, 1.15×10⁻⁶) 0.197 −6.03×10⁻⁷ (−3.28×10⁻⁶, 2.08×10⁻⁶) 0.660 1.61×10⁻⁶ (−2.94×10⁻⁶, 6.16×10⁻⁶) 0.488 3.64×10⁻⁶ (−1.46×10⁻⁷, 7.43×10⁻⁶) 0.060 Teicoplanin 7.82×10⁻¹⁰ (−4.11×10⁻⁶, 4.11×10⁻⁶) 1.000 −1.34×10⁻⁶ (−4.56×10⁻⁶, 1.87×10⁻⁶) 0.413 1.80×10⁻⁷ (−5.21×10⁻⁶, 5.57×10⁻⁶) 0.948 −7.90×10⁻⁷ (−5.37×10⁻⁶, 3.79×10⁻⁶) 0.735 Lincomycin−Clindamycin −7.22×10⁻⁸ (−2.89×10⁻⁷, 1.45×10⁻⁷) 0.514 −3.76×10⁻⁸ (−2.20×10⁻⁷, 1.45×10⁻⁷) 0.686 1.25×10⁻⁷ (−1.89×10⁻⁷, 4.39×10⁻⁷) 0.435 6.01×10⁻⁹ (−2.62×10⁻⁷, 2.74×10⁻⁷) 0.965 Macrolides −1.90×10⁻⁸ (−6.32×10⁻⁸, 2.52×10⁻⁸) 0.400 1.15×10⁻⁸ (−2.41×10⁻⁸, 4.72×10⁻⁸) 0.527 −7.35×10⁻⁸ (−1.30×10⁻⁷, −1.68×10⁻⁸) 0.011 −1.68×10⁻⁸ (−7.07×10⁻⁸, 3.70×10⁻⁸) 0.540 Oxazolidinones −1.28×10⁻⁶ (−3.40×10⁻⁶, 8.32×10⁻⁷) 0.234 −1.50×10⁻⁷ (−1.78×10⁻⁶, 1.48×10⁻⁶) 0.857 −4.01×10⁻⁷ (−2.83×10⁻⁶, 2.03×10⁻⁶) 0.747 7.93×10⁻⁷ (−1.56×10⁻⁶, 3.15×10⁻⁶) 0.509 Penicillin −2.13×10⁻⁸ (−5.97×10⁻⁸, 1.72×10⁻⁸) 0.278 −3.57×10⁻⁸ (−6.75×10⁻⁸, −3.87×10⁻⁹) 0.028 −5.81×10⁻⁸ (−1.09×10⁻⁷, −6.90×10⁻⁹) 0.026 −2.50×10⁻⁸ (−7.17×10⁻⁸, 2.16×10⁻⁸) 0.293 Polymyxin 2.45×10⁻⁶ (−3.91×10⁻⁶, 8.80×10⁻⁶) 0.451 3.84×10⁻⁶ (−1.29×10⁻⁶, 8.97×10⁻⁶) 0.142 −1.93×10⁻⁵ (−2.78×10⁻⁵, −1.08×10⁻⁵) <0.001 −1.13×10⁻⁵ (−1.92×10⁻⁵, −3.42×10⁻⁶) 0.005 Quinolones 3.79×10⁻⁸ (−4.18×10⁻⁸, 1.18×10⁻⁷) 0.351 3.85×10⁻⁸ (−2.38×10⁻⁸, 1.01×10⁻⁷) 0.226 5.86×10⁻⁸ (−4.04×10⁻⁸, 1.57×10⁻⁷) 0.246 5.70×10⁻⁸ (−3.32×10⁻⁸, 1.47×10⁻⁷) 0.215 Sulfonamides 1.76×10⁻⁸ (−3.67×10⁻⁷, 4.02×10⁻⁷) 0.929 2.51×10⁻⁷ (−8.00×10⁻⁸, 5.82×10⁻⁷) 0.137 −4.24×10⁻⁷ (−1.13×10⁻⁶, 2.86×10⁻⁷) 0.242 2.06×10⁻⁷ (−3.41×10⁻⁷, 7.52×10⁻⁷) 0.461 Tetracyclines −4.39×10⁻⁸ (−1.03×10⁻⁷, 1.49×10⁻⁸) 0.143 −1.47×10⁻⁸ (−6.14×10⁻⁸, 3.21×10⁻⁸) 0.539 5.17×10⁻⁸ (−2.46×10⁻⁸, 1.28×10⁻⁷) 0.184 3.96×10⁻¹¹ (−6.79×10⁻⁸, 6.80×10⁻⁸) 0.999 Note. CRAB: Acinetobacter baumannii; CRPA: Pseudomonas aeruginosa; CRKP: Klebsiella pneumoniae; CREC: Escherichia coli. 95% CI: 95% confidence interval. Table 2. Association analysis of CRO drug resistance with multifactor inclusion in hierarchical model in China from 2016 to 2022
There was a decline in the proportions of VR E. faecium (β = −0.13, P < 0.001, Table 3) and VR E. faecalis (β = −0.14, P < 0.001, Table 3) from 2016 to 2022. The proportion of VR E. faecium was positively correlated with the DDDs of vancomycin and norvancomycin, irrespective of the usage of other antibiotics (β > 0, P < 0.001, Table 3 and Table 4). However, with consideration for the usage of other antibiotics, the results indicated a positive correlation between the DDDs of vancomycin and norvancomycin and the proportion of VR E. faecalis (β = 1.36×10⁻⁵, P = 0.001, Table 4), despite the non-significant correlation when only considering the association between the DDDs of vancomycin and norvancomycin and resistance proportions (β = 8.72×10⁻⁷, P = 0.621, Table 3).
Variable VR E. faecium VR E. faecalis β (95% CI) p β (95% CI) p Year −0.13 (−0.19, −0.06) < 0.001 −0.14 (−0.19, −0.10) < 0.001 Population 1.47×10⁻⁵ (−7.00×10⁻⁵, 9.94×10⁻⁵) 0.733 −4.39×10⁻⁵ (−1.05×10⁻⁴, 1.73×10⁻⁵) 0.160 Aminoglycosides 2.18×10⁻⁶ (1.14×10⁻⁶, 3.23×10⁻⁶) < 0.001 −3.34×10⁻⁸ (−1.03×10⁻⁶, 9.60×10⁻⁷) 0.947 Amphenicols 1.72×10⁻⁵ (1.05×10⁻⁶, 3.33×10⁻⁵) 0.037 1.65×10⁻⁵ (1.70×10⁻⁶, 3.14×10⁻⁵) 0.029 β−lactamase inhibitors 3.39×10⁻⁷ (1.96×10⁻⁷, 4.83×10⁻⁷) < 0.001 −5.53×10⁻⁸ (−1.99×10⁻⁷, 8.82×10⁻⁸) 0.450 Carbapenems 1.42×10⁻⁶ (9.41×10⁻⁷, 1.90×10⁻⁶) < 0.001 −1.81×10⁻⁷ (−7.24×10⁻⁷, 3.62×10⁻⁷) 0.514 Cephalosporins 7.50×10⁻⁸ (5.00×10⁻⁸, 9.99×10⁻⁸) < 0.001 1.81×10⁻⁹ (−2.52×10⁻⁸, 2.88×10⁻⁸) 0.896 Vancomycin & norvancomycin 9.14×10⁻⁶ (6.38×10⁻⁶, 1.19×10⁻⁵) < 0.001 8.72×10⁻⁷ (−2.58×10⁻⁶, 4.33×10⁻⁶) 0.621 Teicoplanin 3.94×10⁻⁷ (−7.47×10⁻⁶, 8.26×10⁻⁶) 0.922 −1.41×10⁻⁶ (−8.05×10⁻⁶, 5.24×10⁻⁶) 0.678 Lincomycin−Clindamycin 6.69×10⁻⁷ (3.79×10⁻⁷, 9.59×10⁻⁷) < 0.001 −1.64×10⁻⁷ (−4.82×10⁻⁷, 1.55×10⁻⁷) 0.314 Macrolides 7.33×10⁻⁸ (4.07×10⁻⁸, 1.06×10⁻⁷) < 0.001 −3.30×10⁻⁹ (−3.89×10⁻⁸, 3.23×10⁻⁸) 0.856 Oxazolidinones 7.42×10⁻⁶ (5.03×10⁻⁶, 9.81×10⁻⁶) < 0.001 −2.06×10⁻⁶ (−5.66×10⁻⁶, 1.53×10⁻⁶) 0.261 Penicillin 1.53×10⁻⁷ (1.02×10⁻⁷, 2.03×10⁻⁷) < 0.001 −2.10×10⁻⁸ (−8.23×10⁻⁸, 4.03×10⁻⁸) 0.503 Polymyxin 3.41×10⁻⁵ (1.59×10⁻⁵, 5.23×10⁻⁵) < 0.001 −1.19×10⁻⁵ (−3.13×10⁻⁵, 7.59×10⁻⁶) 0.232 Quinolones 1.40×10⁻⁷ (9.07×10⁻⁸, 1.90×10⁻⁷) < 0.001 −1.66×10⁻⁸ (−7.87×10⁻⁸, 4.55×10⁻⁸) 0.600 Sulfonamides 1.88×10⁻⁶ (1.09×10⁻⁶, 2.66×10⁻⁶) < 0.001 1.61×10⁻⁷ (−6.58×10⁻⁷, 9.79×10⁻⁷) 0.701 Tetracyclines 2.48×10⁻⁷ (1.37×10⁻⁷, 3.59×10⁻⁷) < 0.001 −6.69×10⁻⁸ (−1.65×10⁻⁷, 3.16×10⁻⁸) 0.183 Note. VR E. faecium: Enterococcus faecium; VR E. faecalis: Enterococcus faecalis. 95% CI: 95% confidence interval. Table 3. Association analysis of VRE drug resistance with single−factor inclusion in hierarchical model in China from 2016 to 2022
Variable VR E. faecium VR E. faecalis β (95% CI) p β (95% CI) p Year −0.31 (−0.37, −0.26) < 0.001 −0.20 (−0.27, −0.14) < 0.001 Population −7.77×10⁻⁶ (−9.94×10⁻⁵, 8.39×10⁻⁵) 0.868 −5.48×10⁻⁵ (−1.39×10⁻⁴, 2.89×10⁻⁵) 0.199 Aminoglycosides −4.88×10⁻⁷ (−1.82×10⁻⁶, 8.44×10⁻⁷) 0.473 7.89×10⁻⁸ (−1.37×10⁻⁶, 1.52×10⁻⁶) 0.915 Amphenicols −1.34×10⁻⁵ (−2.66×10⁻⁵, −1.62×10⁻⁷) 0.047 1.48×10⁻⁵ (8.88×10⁻⁷, 2.87×10⁻⁵) 0.037 β−lactamase inhibitors −1.23×10⁻⁷ (−4.00×10⁻⁷, 1.54×10⁻⁷) 0.383 2.70×10⁻⁸ (−2.41×10⁻⁷, 2.95×10⁻⁷) 0.844 Carbapenems 6.26×10⁻⁷ (−5.15×10⁻⁷, 1.77×10⁻⁶) 0.282 −1.18×10⁻⁶ (−2.63×10⁻⁶, 2.62×10⁻⁷) 0.109 Cephalosporins −1.03×10⁻⁹ (−9.58×10⁻⁸, 9.37×10⁻⁸) 0.983 −3.42×10⁻⁸ (−1.48×10⁻⁷, 7.91×10⁻⁸) 0.554 Vancomycin & norvancomycin 1.87×10⁻⁵ (1.06×10⁻⁵, 2.69×10⁻⁵) < 0.001 1.36×10⁻⁵ (5.30×10⁻⁶, 2.20×10⁻⁵) 0.001 Teicoplanin −9.71×10⁻⁶ (−1.89×10⁻⁵, −5.50×10⁻⁷) 0.038 7.62×10⁻⁷ (−9.30×10⁻⁶, 1.08×10⁻⁵) 0.882 Lincomycin−Clindamycin 1.20×10⁻⁶ (6.82×10⁻⁷, 1.71×10⁻⁶) < 0.001 −7.13×10⁻⁸ (−7.11×10⁻⁷, 5.68×10⁻⁷) 0.827 Macrolides −5.38×10⁻⁸ (−1.66×10⁻⁷, 5.79×10⁻⁸) 0.345 2.96×10⁻⁸ (−1.08×10⁻⁷, 1.67×10⁻⁷) 0.673 Oxazolidinones 8.08×10⁻⁶ (2.58×10⁻⁶, 1.36×10⁻⁵) 0.004 3.85×10⁻⁶ (−3.43×10⁻⁶, 1.11×10⁻⁵) 0.300 Penicillin 7.72×10⁻⁸ (−2.84×10⁻⁸, 1.83×10⁻⁷) 0.152 1.03×10⁻⁹ (−1.12×10⁻⁷, 1.14×10⁻⁷) 0.986 Polymyxin −2.46×10⁻⁶ (−2.10×10⁻⁵, 1.61×10⁻⁵) 0.795 3.63×10⁻⁶ (−1.93×10⁻⁵, 2.66×10⁻⁵) 0.757 Quinolones −3.53×10⁻⁷ (−5.62×10⁻⁷, −1.44×10⁻⁷) 0.001 −1.74×10⁻⁷ (−4.11×10⁻⁷, 6.22×10⁻⁸) 0.149 Sulfonamides 7.85×10⁻⁷ (−2.10×10⁻⁷, 1.78×10⁻⁶) 0.122 4.91×10⁻⁷ (−6.32×10⁻⁷, 1.62×10⁻⁶) 0.391 Tetracyclines −1.76×10⁻⁷ (−3.27×10⁻⁷, −2.54×10⁻⁸) 0.022 3.01×10⁻⁸ (−1.41×10⁻⁷, 2.01×10⁻⁷) 0.731 Note. VR E. faecium: Enterococcus faecium; VR E. faecalis: Enterococcus faecalis. 95% CI: 95% confidence interval. Table 4. Association analysis of VRE drug resistance with multifactor inclusion in hierarchical model in China from 2016 to 2022
-
This nationwide ecological study provided an overview of trends in carbapenem-resistant organisms (CRO) and vancomycin-resistant enterococci (VRE), along with antibiotic consumption in mainland China from 2016 to 2022. Although the observed declines in CRAB, CRPA, and VRE were encouraging, the continued increase in CRKP underscores the persistent threat of carbapenem resistance. Furthermore, significant changes in the DDDs of various antibiotic classes were observed from 2016 to 2022, providing evidence for the global trend of antibiotic overuse.
The association between drug resistance and antibiotic use was also investigated. Several studies have indicated a strong correlation between antibiotic drug use and antibiotic resistance[24]. Lopez-Lozano et al. found empirical evidence of nonlinear relationships between population antibiotic consumption and resistance rates in five European settings[25]. Abejew et al. systematically reviewed the correlation between antibiotic resistance and global antibiotic consumption globally[14]. These results inspired the present study and provided a theoretical basis. Maugeri et al. found that antibiotic consumption is one of the main predictors of antimicrobial resistance in European countries[26]. Similarly, in our study, the consumption of carbapenem antibiotics was a predictor of CRAB, CRPA, and CRKP resistance, whereas the use of Vancomycin and Norvancomycin predicted VR E. faecium and VR E. faecalis resistance, consistent with most global research results[27,28].
Many studies have shown a comprehensive association between antibiotic consumption and resistance to CRPA and CRKP due to their complex drug resistance mechanisms and cross-resistance[29,30]. Similarly, in our study, exploring the correlation between a single antibiotic and the resistance proportions of CRO and VRE was insufficient. We did not find an association between the consumption of carbapenem antibiotics and resistance to CRAB, CRPA, CRKP, and CREC, nor between the consumption of vancomycin and vancomycin and resistance to VR E. faecalis when considering only the association with a single drug class. However, this association was evident after adjusting for consumption of all other antibiotics. Therefore, it is necessary to consider the effects of other antibiotics on the development of drug resistance. Furthermore, the use of polymyxin was negatively associated with the proportions of CRKP and CREC, and penicillin usage showed a negative correlation with the resistance of CRPA and CRKP. Similar results have been previously reported[14]. These findings underscore the complex relationship between antibiotic use and emergence of drug-resistant bacterial strains, highlighting the critical need for judicious antibiotic management.
Previous studies and our study indicate that the resistance rate to VRE in China differs from that in Europe and the United States, remaining low[31]. Although the use of various antibiotics has significantly increased in China, there is a clear association between vancomycin and VRE consumption. Therefore, compared with the high drug resistance of VRE in Europe and the United States, it is necessary to strengthen surveillance by conducting more sampling in China, especially in high-risk hospital units, such as hematology, ICU, and renal units[32-34]. However, the observed changes in statistical significance between the unadjusted and adjusted models likely reflect confounding from concurrent antibiotic consumption and the complex interplay among antibiotic classes. Although our ecological design could not confirm causal interactions, these findings are consistent with the possibility of synergistic or indirect effects, particularly in the case of vancomycin use and VRE resistance.
Our findings have important implications for antimicrobial stewardship and public health policies. Continued efforts are needed to sustain the downward trends in CRAB, CRPA, and VRE, likely supported by strengthened infection prevention and rational prescriptions. Simultaneously, targeted interventions, including stricter carbapenem stewardship, improved diagnostic capacity, and expanded access to effective alternative therapies, are urgently required to curb the alarming increase in the incidence of CRKP. Finally, pronounced interprovincial variability highlights the need for region-specific strategies tailored to local epidemiology and resource capacities. Collectively, these measures could contribute to a more comprehensive national response to antimicrobial resistance in China.
Compared with previous studies, our analysis presents novelties that also represent some of its strengths. First, we evaluated the association between antibiotic consumption and AMR at the provincial level in mainland China. These results provide antibiotics as indicators of better AMR control. Second, our study included a majority of drug-resistant CRO and VRE bacteria. These results provide a comprehensive overview of bacterial resistance and antibiotic use in mainland China. Finally, the introduction of a hierarchical model enabled us to disentangle the relationship between antibiotic consumption and AMR.
This study has some limitations. First, as an ecological study, we could not infer causality from observed relationships. Based on previous studies and biological plausibility, we selected a set of antibiotics that may be effective in treating bacterial infections that are likely to induce drug resistance. However, these findings should be interpreted with caution, as the ecological design precludes causal inference and cannot disentangle the influence of concurrent infection control measures, regional prescribing practices, or socioeconomic determinants. Second, differences in reporting practices between the two surveillance networks and incomplete hospital participation across years may have introduced bias, although our harmonization procedures and modeling approach helped minimize these effects. Third, all data were available at provincial and yearly levels. Therefore, it was impossible to evaluate the observed relationships within a smaller geographic unit or season. However, this remains a direction for future research. Future research should account for additional confounders and consider use of spatial statistical approaches to explore potential geographic clustering in antimicrobial resistance and antibiotic consumption.
-
The proportions of CRAB, CRPA, VR E. faecium, and VR E. faecalis declined across the study period, whereas the proportion of CRKP increased in mainland China. The DDDs of 10 antibiotic classes exhibited a statistically significant nationwide increase. Our study corroborates previous findings, suggesting that the consumption of carbapenems could be the main indicator of carbapenem-resistant strains of Acinetobacter baumannii and Pseudomonas aeruginosa, whereas the consumption of vancomycin serves as a key indicator of VRE. However, it is crucial to consider the effect of other antibiotics on drug resistance. Further studies at a more granular level are necessary to thoroughly explore the relationship between AMR and antibiotic use.
Trends in Antibiotic Consumption and Antimicrobial Resistance in China: An Ecological Analysis from 2016 to 2022
doi: 10.3967/bes2025.169
- Received Date: 2025-06-30
- Accepted Date: 2025-10-17
-
Key words:
- Antimicrobial resistance /
- Carbapenem-resistant microorganisms /
- Vancomycin-resistant enterococci /
- Antibiotic consumption
Abstract:
All authors declare no competing interests.
Not applicable.
&These authors contributed equally to this work.
| Citation: | Fei Zhao, Zinan Zhao, Di Chen, Bolin Zhu, Tianqi Zhang, Yuanchao Zhu, Xuelin Sun, Liang Liang, Nan Zheng, Lili Zou, Wenfeng Xu, Sirui Guo, Yue Wang, Ming Zhao, Xin Hu, Pengfei Jin. Trends in Antibiotic Consumption and Antimicrobial Resistance in China: An Ecological Analysis from 2016 to 2022[J]. Biomedical and Environmental Sciences. doi: 10.3967/bes2025.169

|

 Quick Links
 DownLoad: