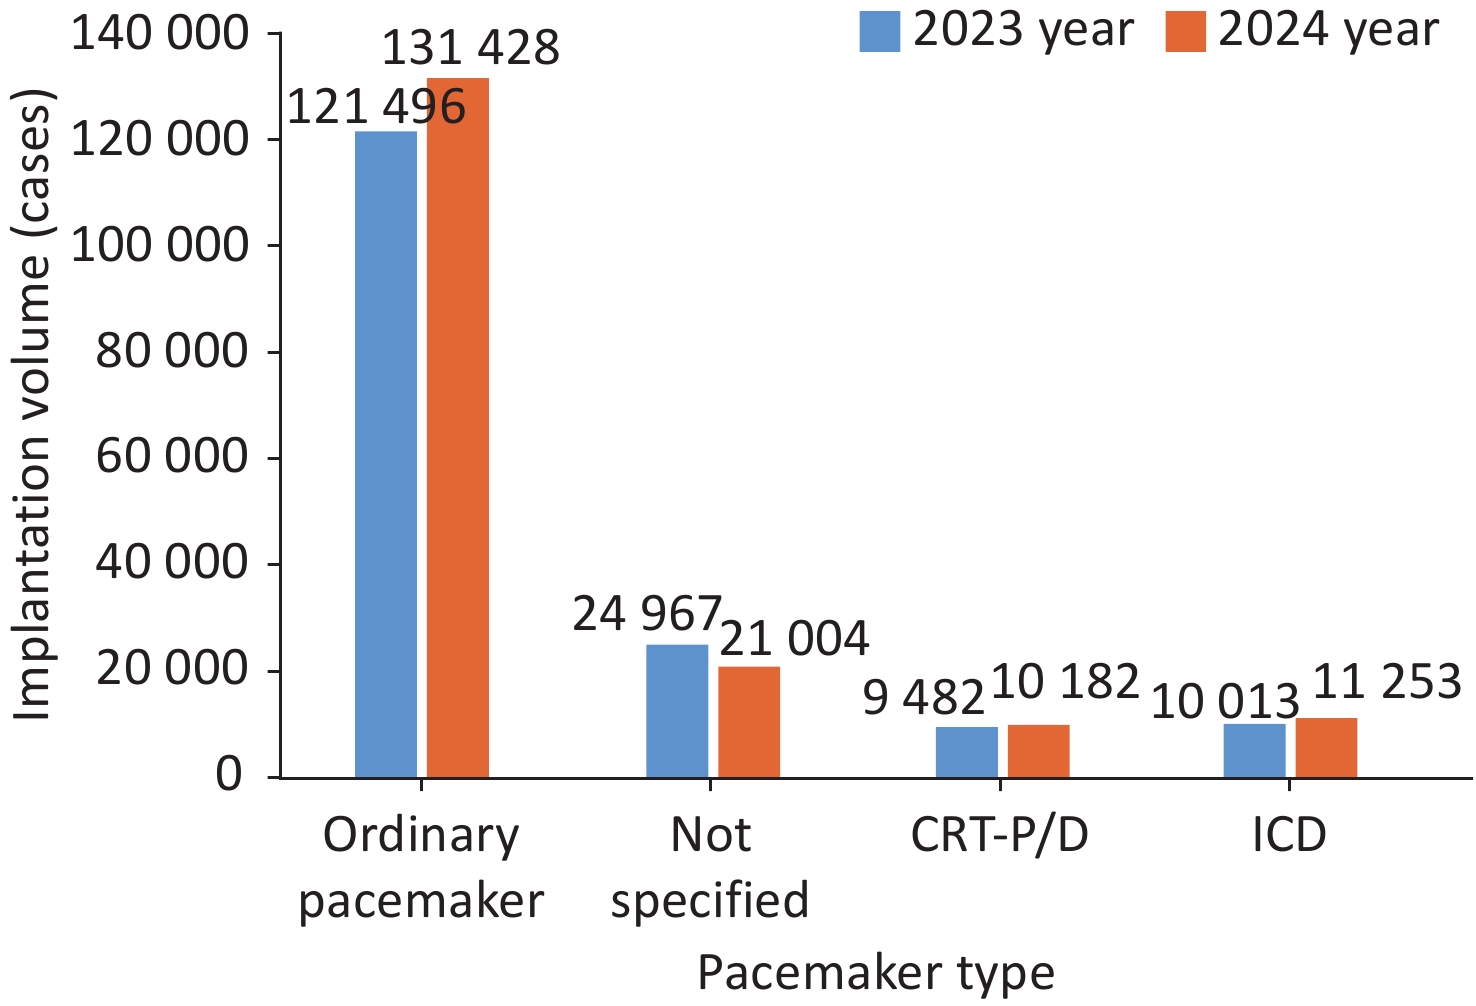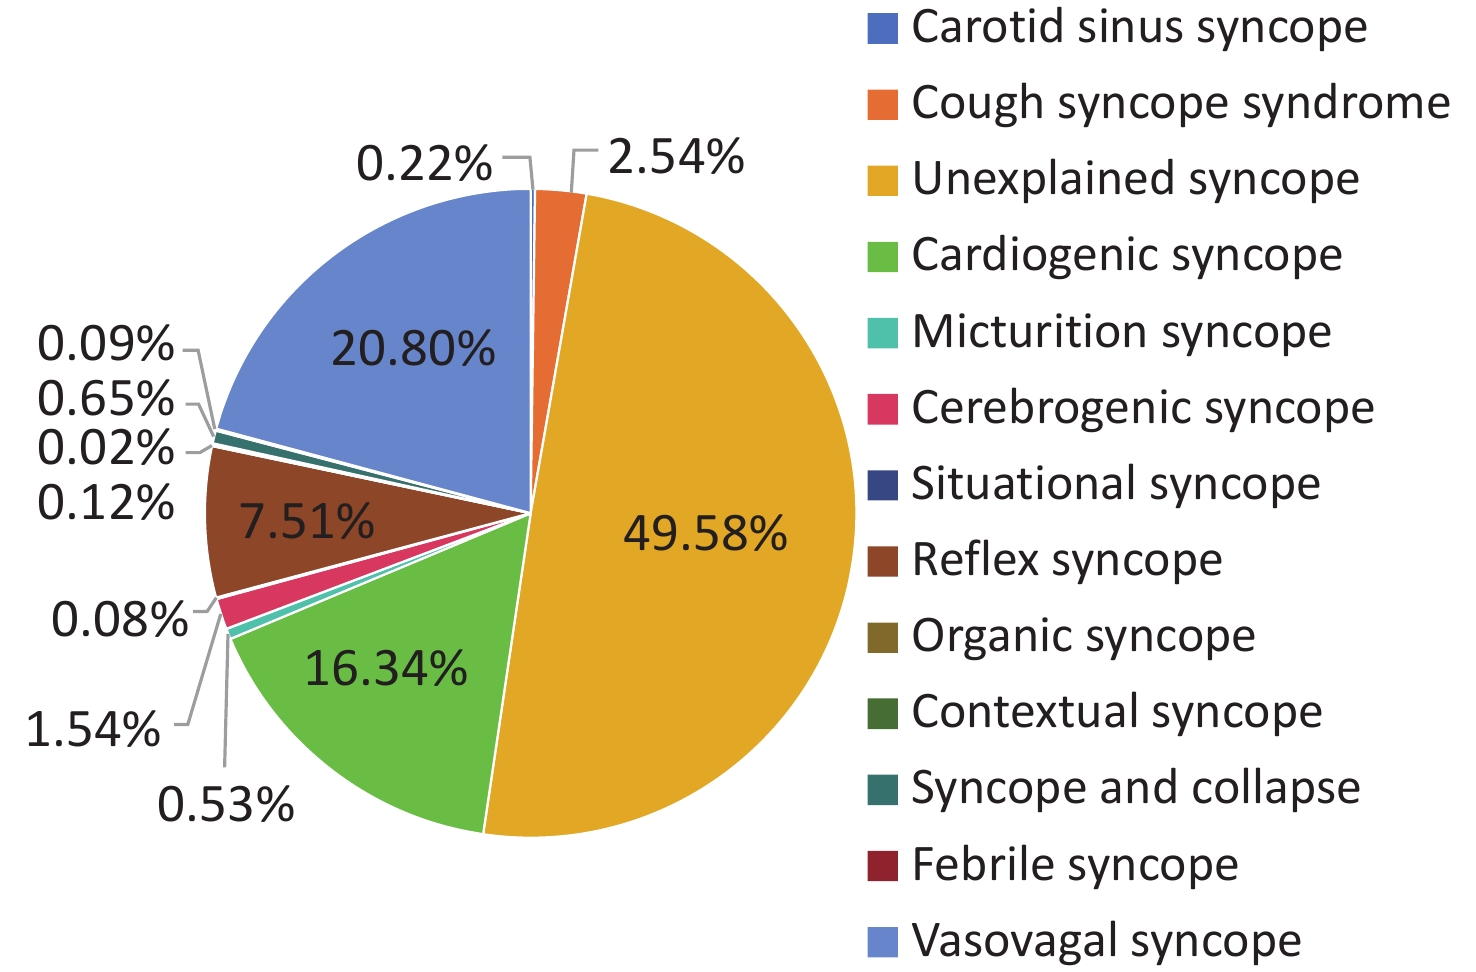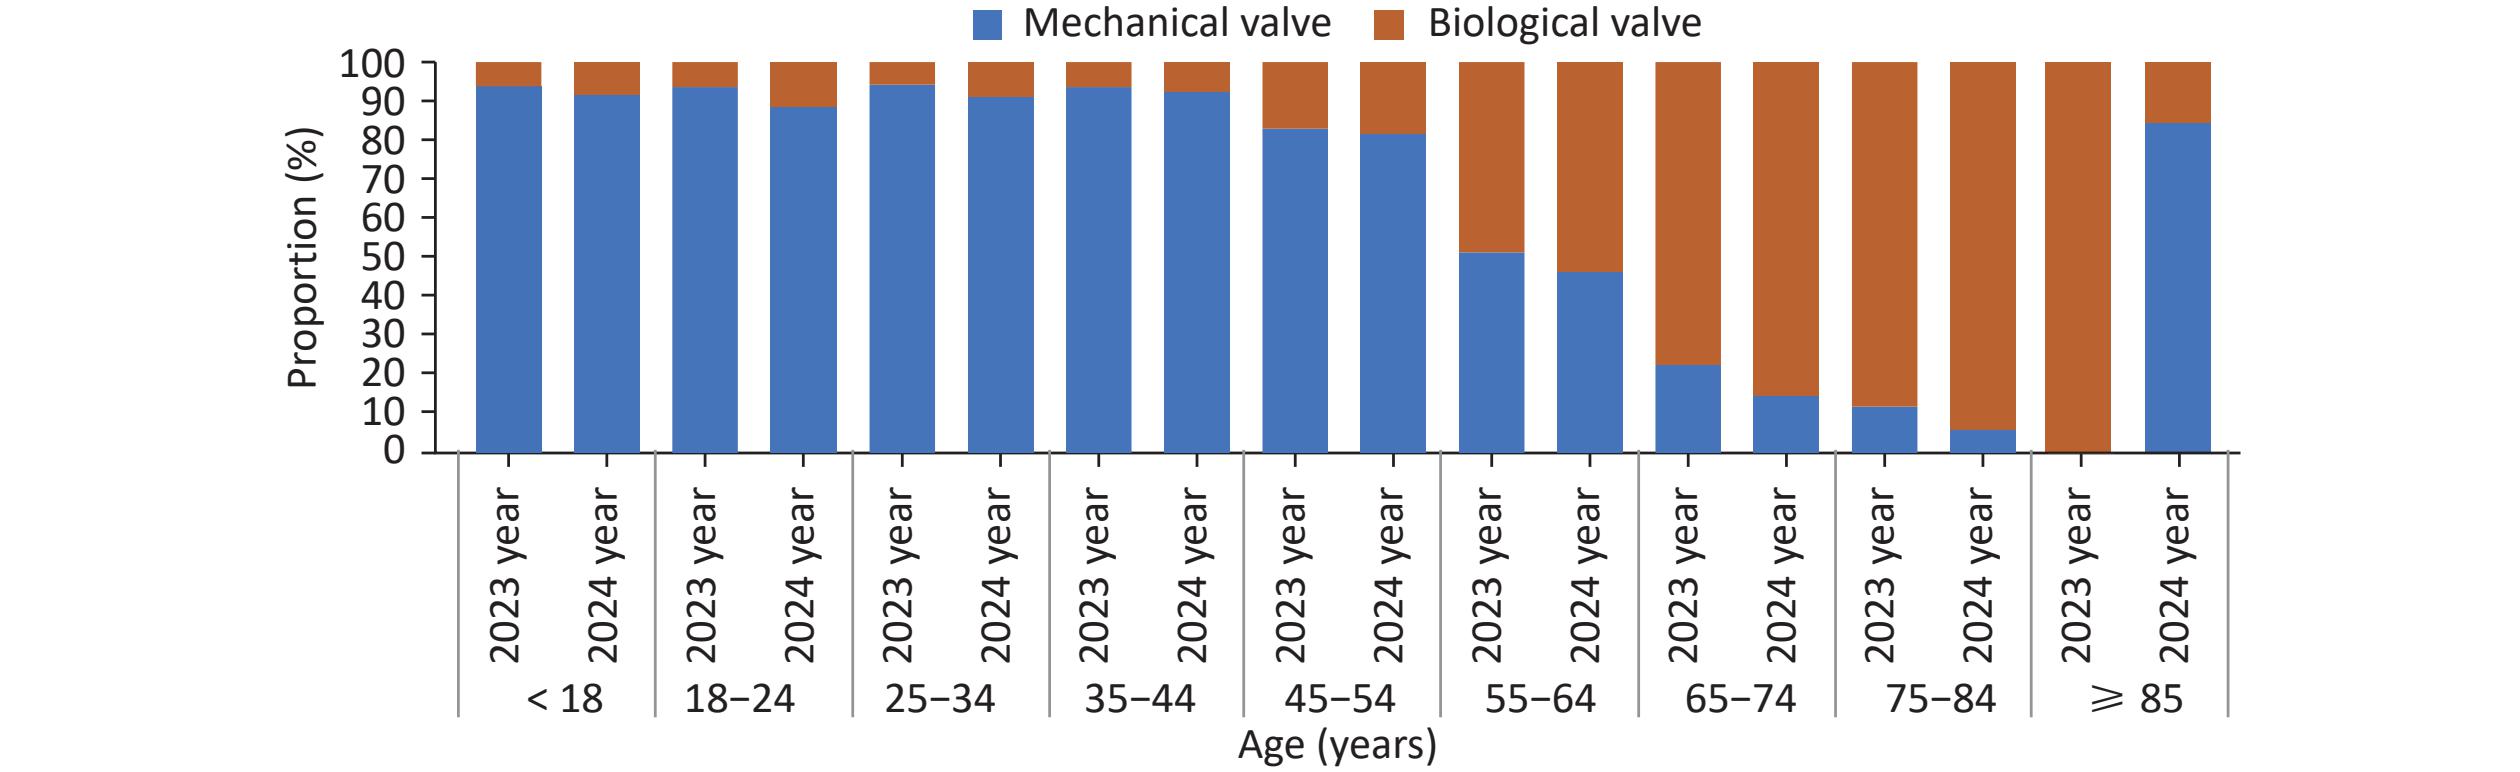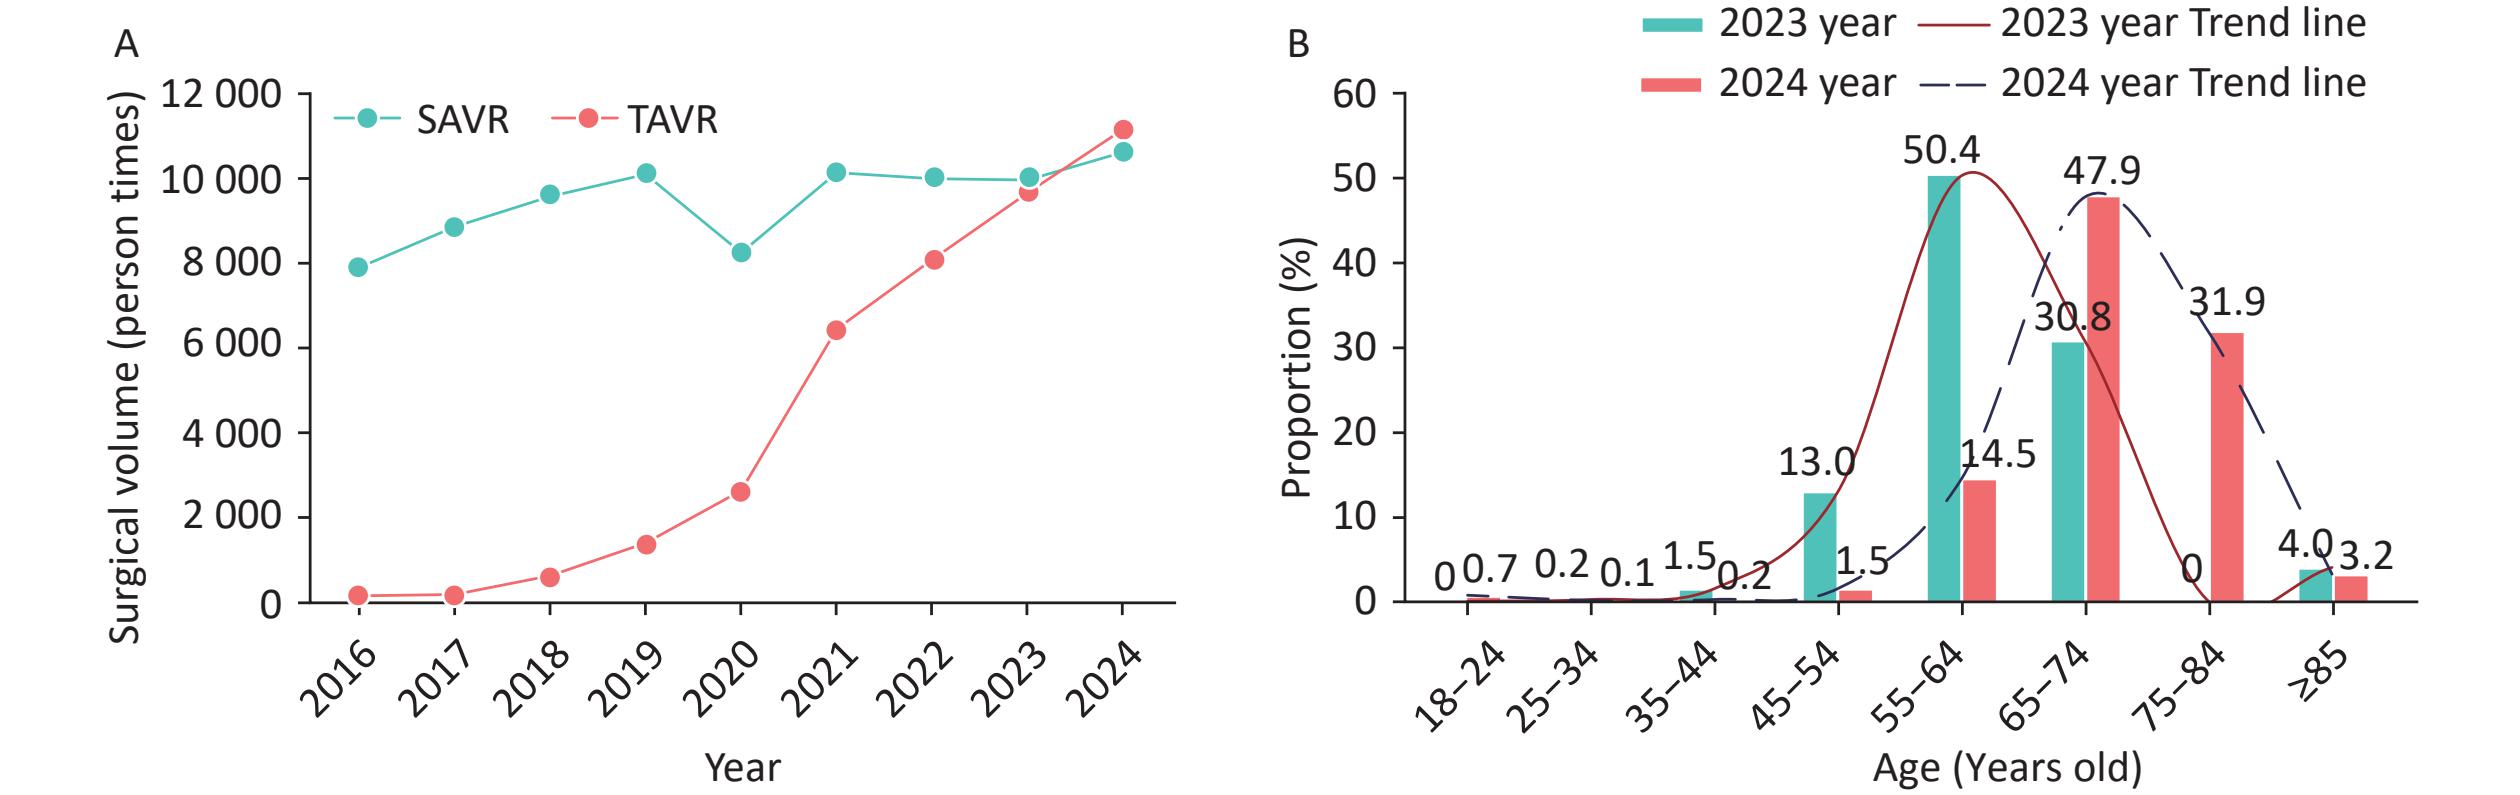

-
Since its inception in 2005, the Report on Cardiovascular Health and Diseases in China has adhered to an objective, scientific, and forward-looking editorial philosophy, consistently documenting and analyzing the epidemiological trends of cardiovascular diseases (CVD), the evolution of risk factors, and progress in prevention and treatment. It has become the most influential comprehensive annual report in China's cardiovascular prevention and control field, providing scientific support for the achievement of the Healthy China 2030 initiative.
The latest data show that CVD remains the leading cause of death among Chinese urban and rural residents. Although the age-standardized mortality rate shows a declining trend, accelerated population aging and the widespread prevalence of risk factors have led to a continued increase in the absolute number of CVD cases and deaths, with rural mortality rates exceeding those in urban areas. The CVD prevention and control challenge reflects several converging pressures: First, the disease burden continues to rise—from 1990 to 2021, the number of prevalent cases increased by 155.60%, incident cases by 156.68%, and deaths by 104.00%. Second, disease-specific trends are diverging: while the age-standardized mortality rate for hemorrhagic stroke has declined substantially, the incidence rates of ischemic heart disease (IHD) and ischemic stroke continue to rise. Third, population aging is accelerating. Fourth, urban-rural and regional disparities are pronounced: rural CVD mortality has consistently exceeded urban rates since 2009, and rates in central and western China are significantly higher than in the eastern regions.
In response to this serious situation, the national government has steadily strengthened high-level policy planning. The Healthy China Initiative (2019–2030) explicitly sets the strategic target of reducing the mortality rate of cardiovascular and cerebrovascular diseases to below 190.7 per 100,000 and details specific measures such as integrated management of hypertension, hyperglycemia, and hyperlipidemia, and community-based prevention and treatment. In 2025, six government departments jointly issued the Guidance on Strengthening Primary-Level Chronic Disease Health Management Services, which for the first time systematically established a four-tiered, coordinated service system with township health centers/community health service centers as hubs and village health rooms/community health service stations as the foundation. This system covers the entire chronic disease process—prevention, screening, diagnosis, treatment, management, and rehabilitation. The Implementation Plan for the Healthcare Foundation Strengthening Project incorporated the expansion of chest pain and stroke center coverage, and the deployment of automated external defibrillators (AEDs) into national projects. These policies represent substantial progress in China's transition from a "treatment-centered" to a "health-centered" approach to CVD prevention and control. Addressing the continued rise in IHD and ischemic stroke incidence requires more than clinical treatment; it necessitates a systematic, comprehensive, end-to-end prevention and control system. At the population level, this involves building a life-course health management system, promoting tobacco control, dietary optimization, physical activity promotion, and weight management, and extending prevention efforts to childhood and adolescence. At the prevention and control level, the focus must remain on primary care, leveraging chronic disease management policies to enhance grassroots capacity for screening and managing hypertension, diabetes, and dyslipidemia, improving secondary prevention and rehabilitation services, and narrowing the urban-rural gap. The integrated management model for hypertension, hyperglycemia, and hyperlipidemia should be deepened, using digital technologies to compensate for workforce shortages at the primary level. A national CVD surveillance network must be improved, and health economic evaluations strengthened to optimize resource allocation.
-
From 1990 to 2021, the prevalence and incidence of CVD in the Chinese population—including rheumatic heart disease, IHD, stroke, hypertensive heart disease, non-rheumatic valvular heart disease, cardiomyopathy and myocarditis, atrial fibrillation and flutter, aortic aneurysm and dissection, peripheral vascular disease, endocarditis, and other cardiovascular and circulatory diseases—increased continuously. Population growth and aging were the key drivers of the sustained increase in China's CVD burden[1]. According to Global Burden of Disease (GBD) 2021 data, from 1990 to 2021, the number of prevalent CVD cases in China increased from 52.3645 million to 133.8456 million, an increase of 155.60%; incident cases rose from 6.2486 million to 16.0392 million, an increase of 156.68%; the age-standardized prevalence rate increased by 9.62% from 6,024.24 per 100,000 to 6,603.72 per 100,000, while the age-standardized incidence rate increased by 3.56% from 783.90 to 811.81 per 100,000. Disability-adjusted life years (DALYs) due to CVD increased by 58.42%, from 63.2538 million person-years to 100.2087 million person-years, while the age-standardized DALY rate decreased by 36.59% from 8,074.76 to 5,120.06 per 100,000, with a faster decline in females (−47.10%) than in males (−26.49%)[1]. The continued rise in absolute DALYs indicates that the overall CVD burden is still increasing, requiring an expansion of healthcare resources. The decline in the age-standardized DALY rate suggests a substantial reduction in the individual risk of CVD morbidity and mortality over the past 30 years, a trend closely associated with advances in medical technology, improved management of risk factors, and greater healthcare accessibility due to economic development.
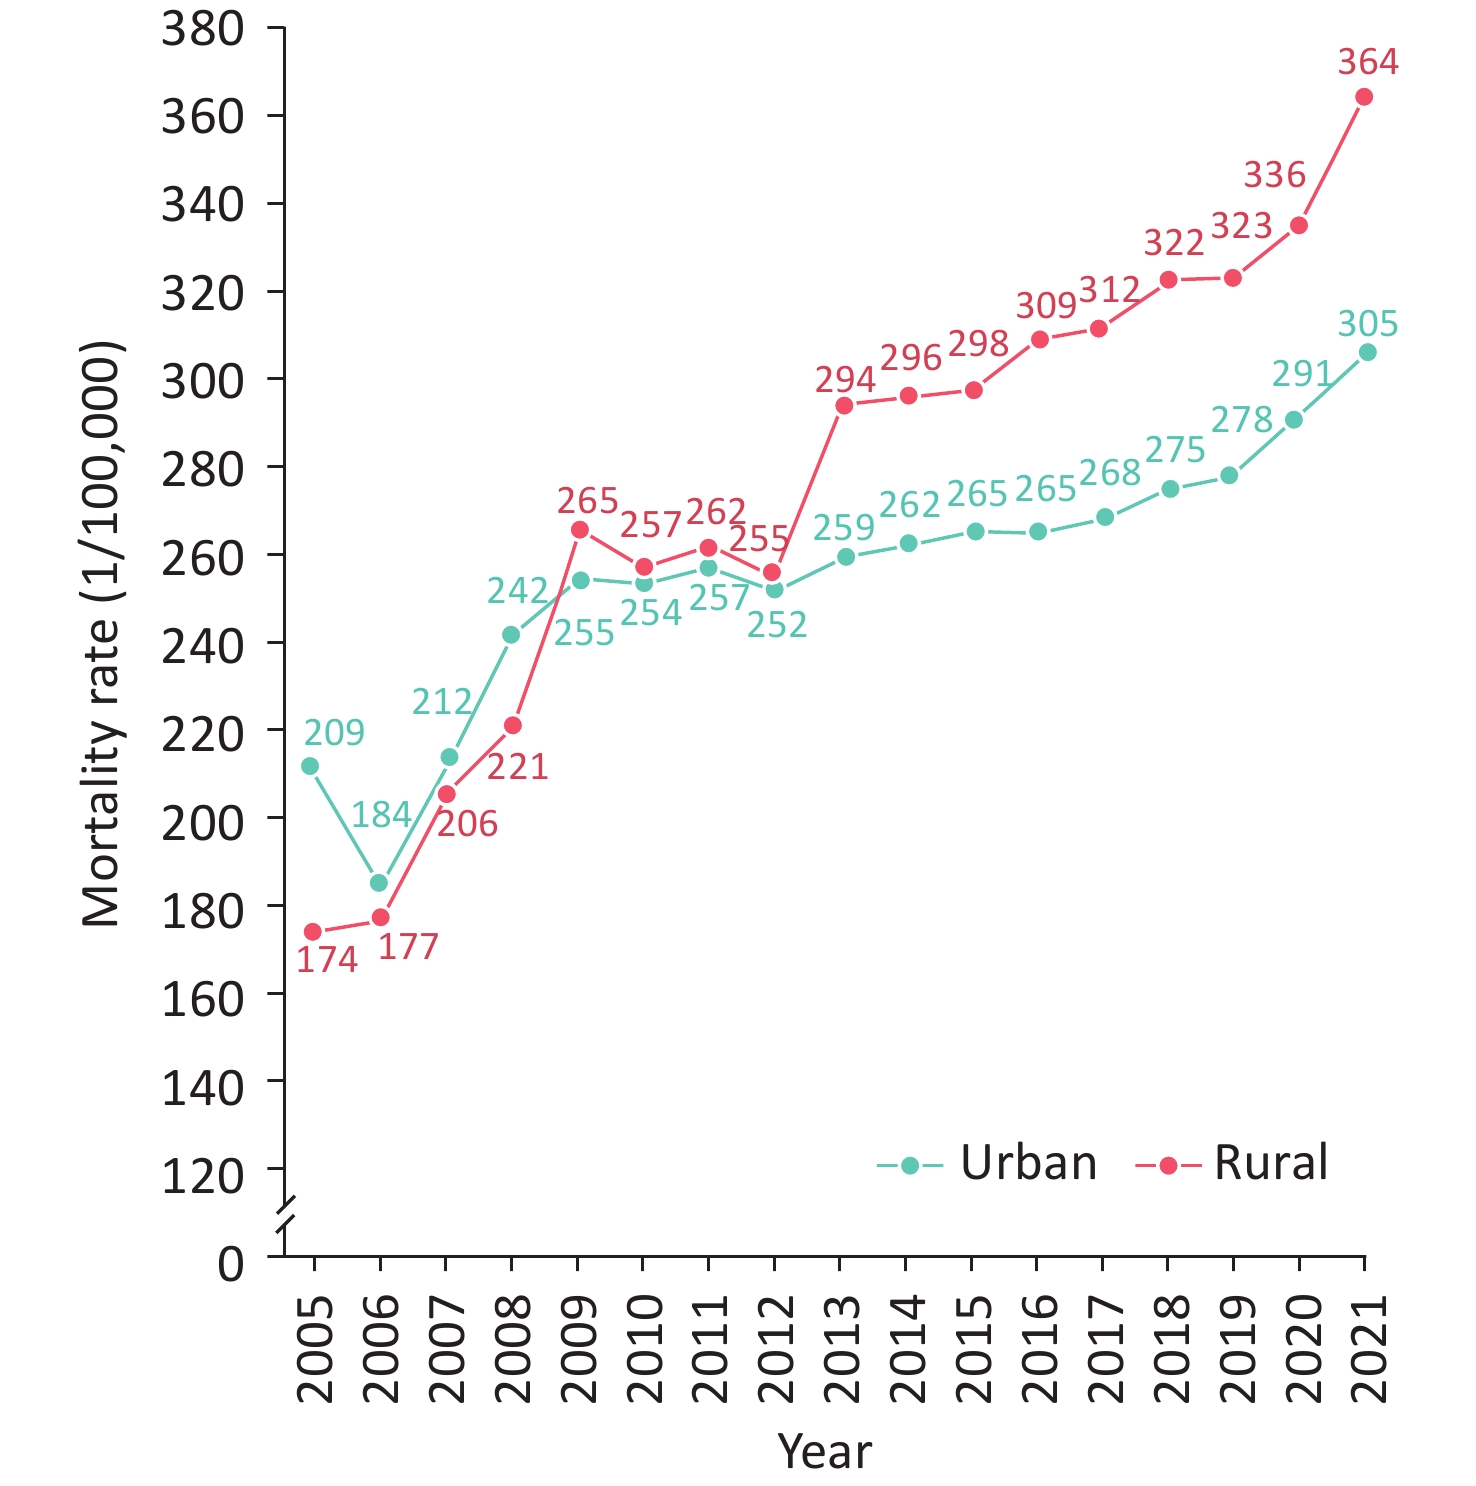
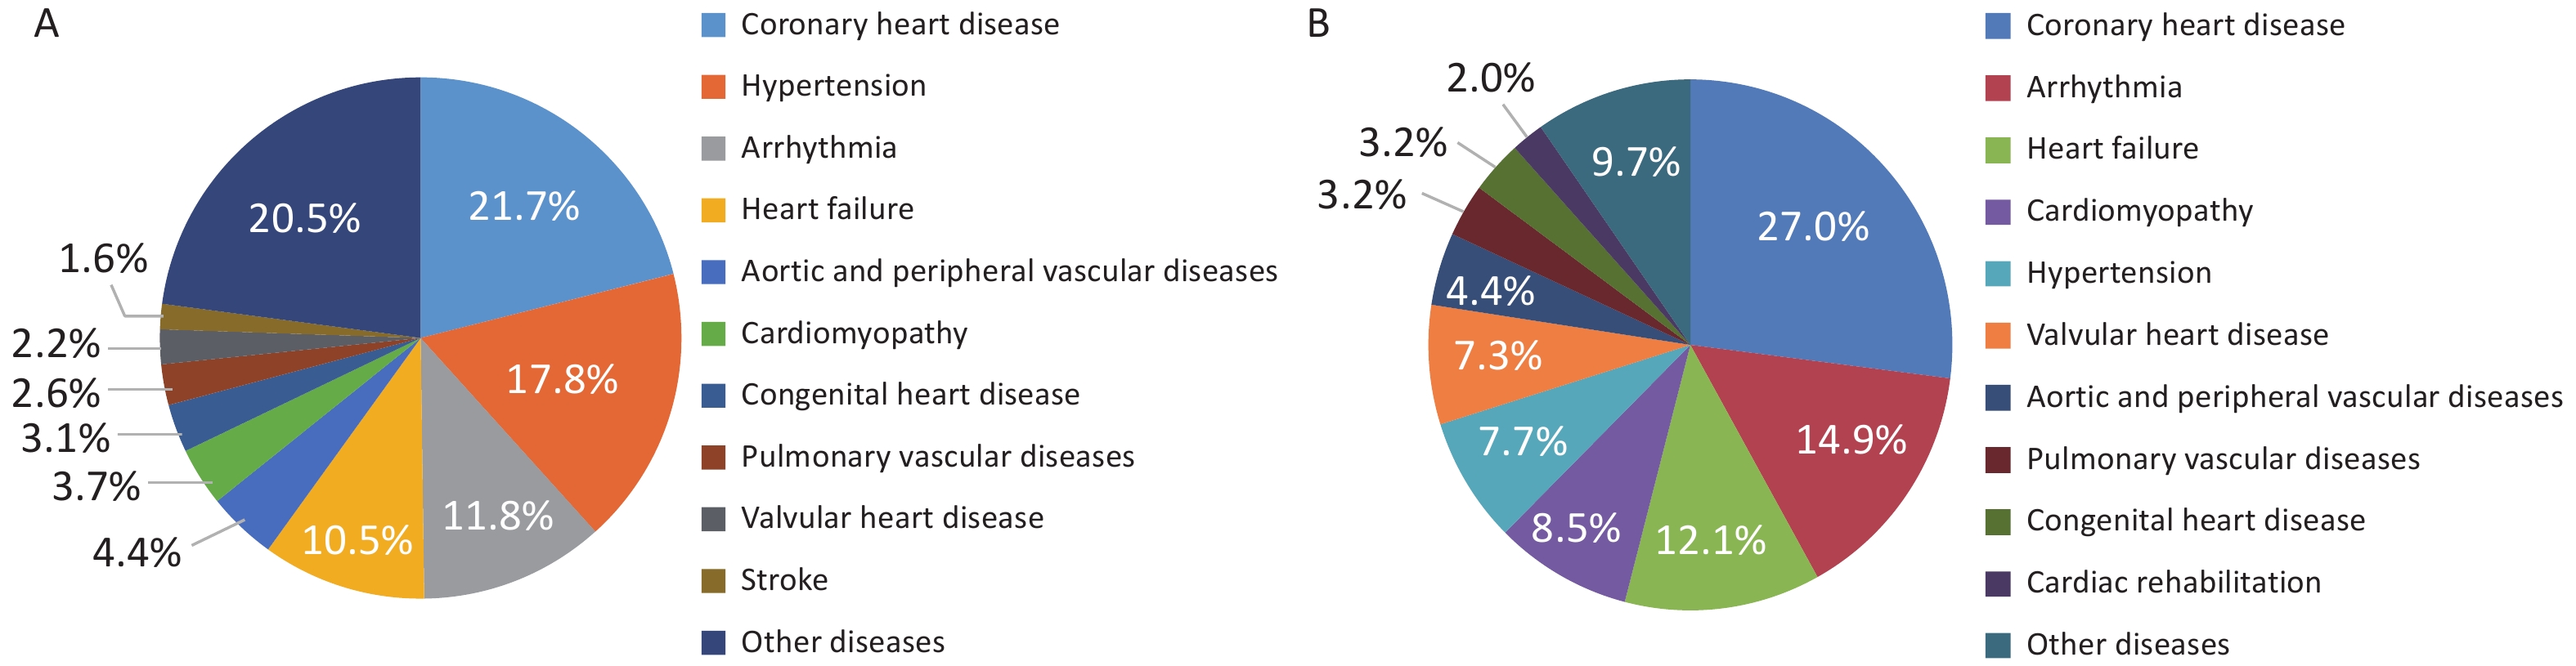
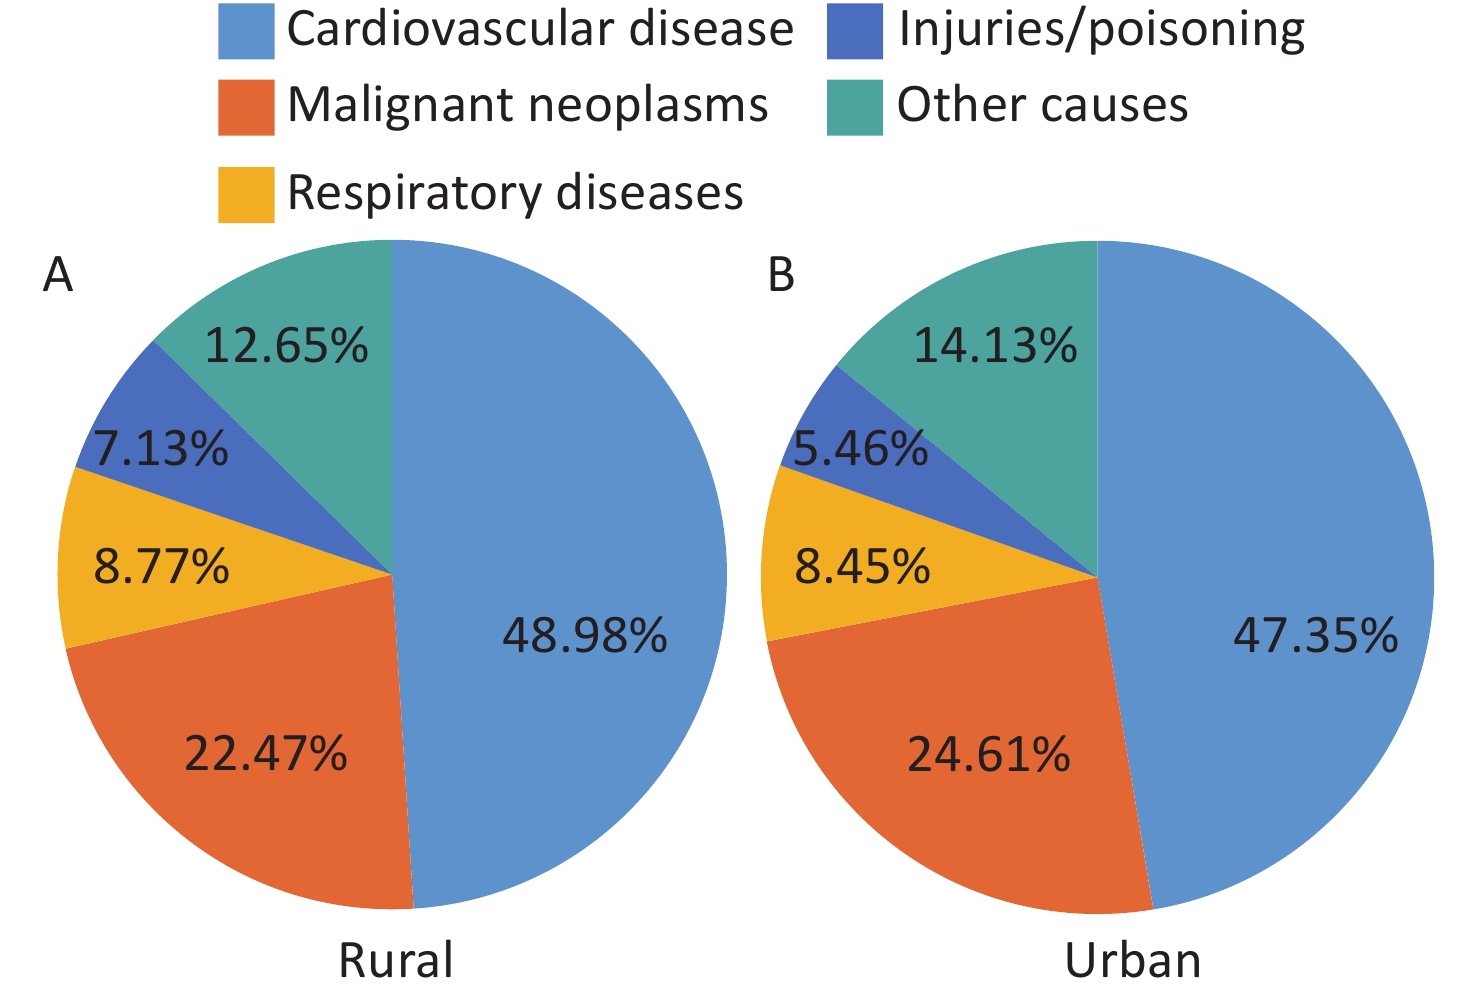
According to the China Health Statistics Yearbook 2022[2], CVD ranked first among causes of death among urban and rural residents. In 2021, CVD accounted for 48.98% of rural deaths and 47.35% of urban deaths (Figure 1). The crude CVD mortality rate in rural areas has exceeded that in urban areas since 2009 (Figure 2). In 2021, the rural CVD mortality rate was 364.16 per 100,000, with heart disease at 188.58 per 100,000 and cerebrovascular disease at 175.58 per 100,000. The urban CVD mortality rate was 305.39 per 100,000, with heart disease at 165.37 per 100,000 and cerebrovascular disease at 140.02 per 100,000.
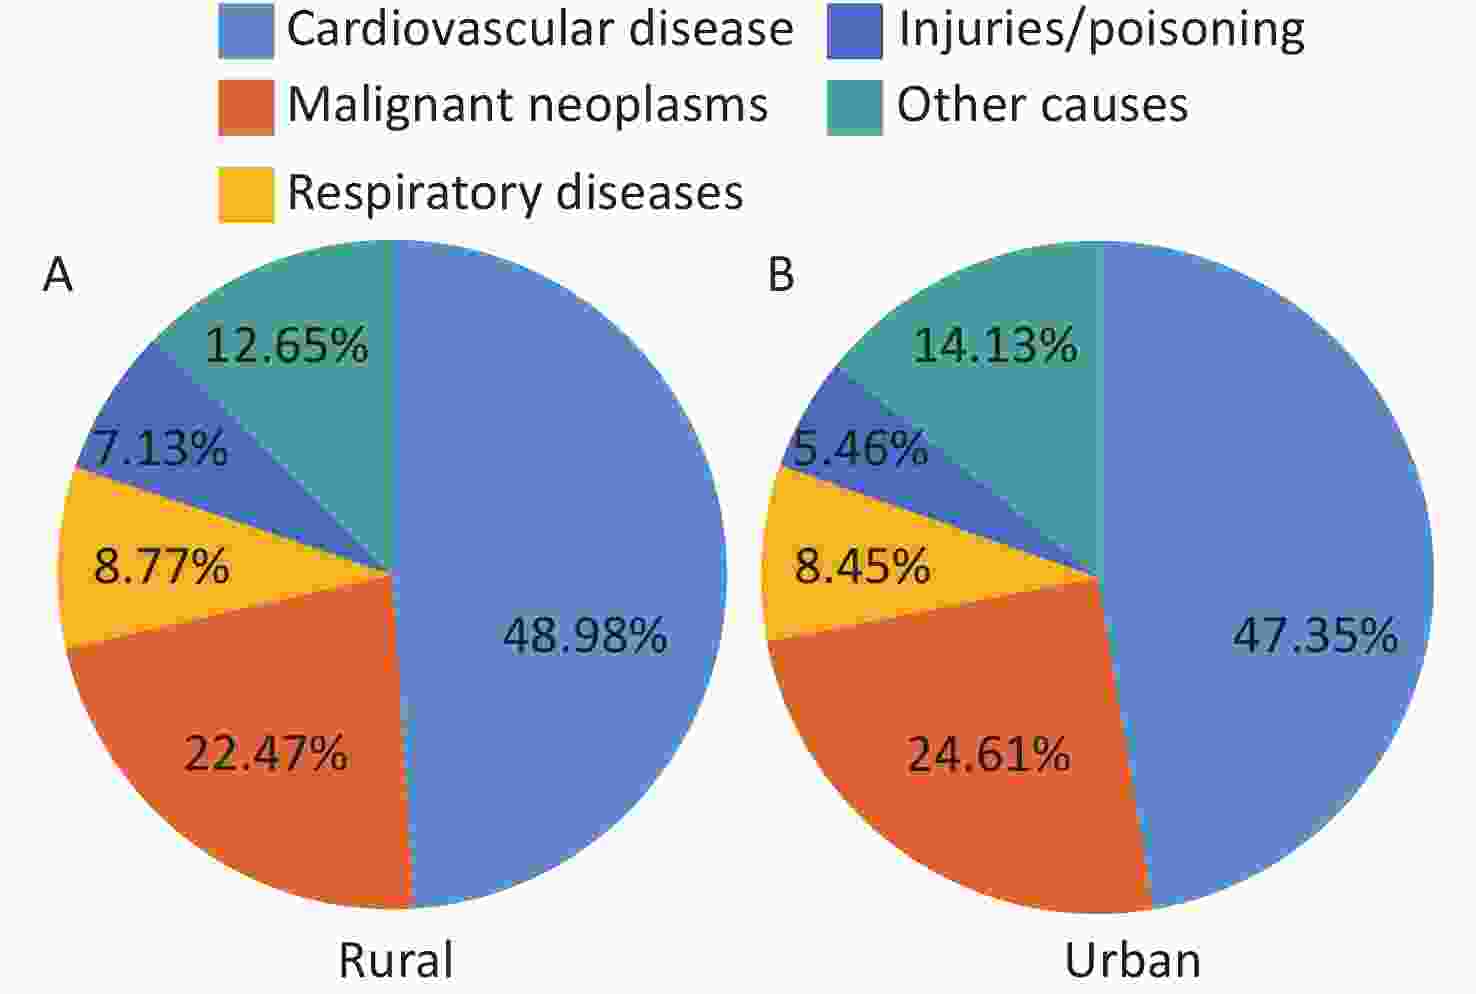
Figure 1. Distribution of the leading causes of death among rural (A) and urban (B) residents in China in 2021.
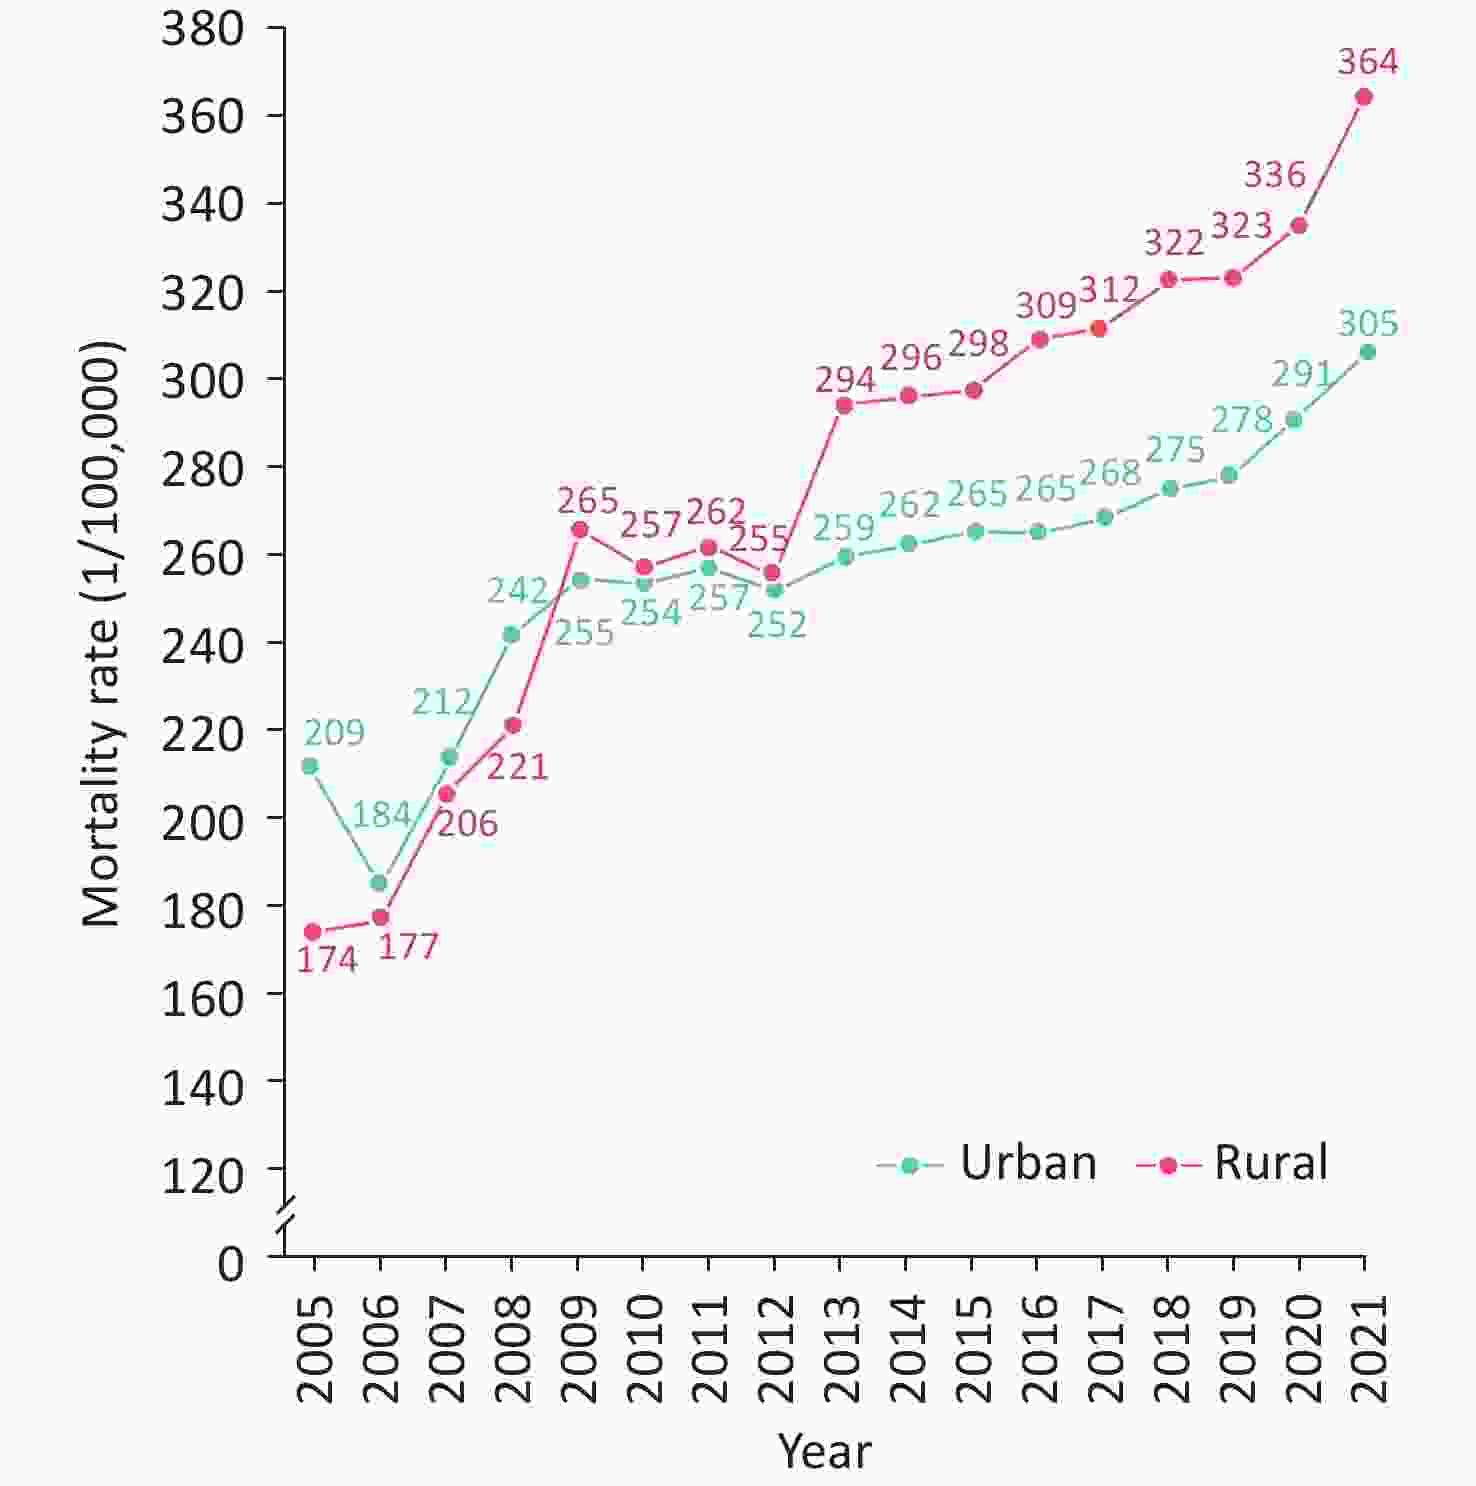
Figure 2. Trends in crude mortality rates due to cardiovascular disease among urban and rural residents in China from 2005 to 2021.
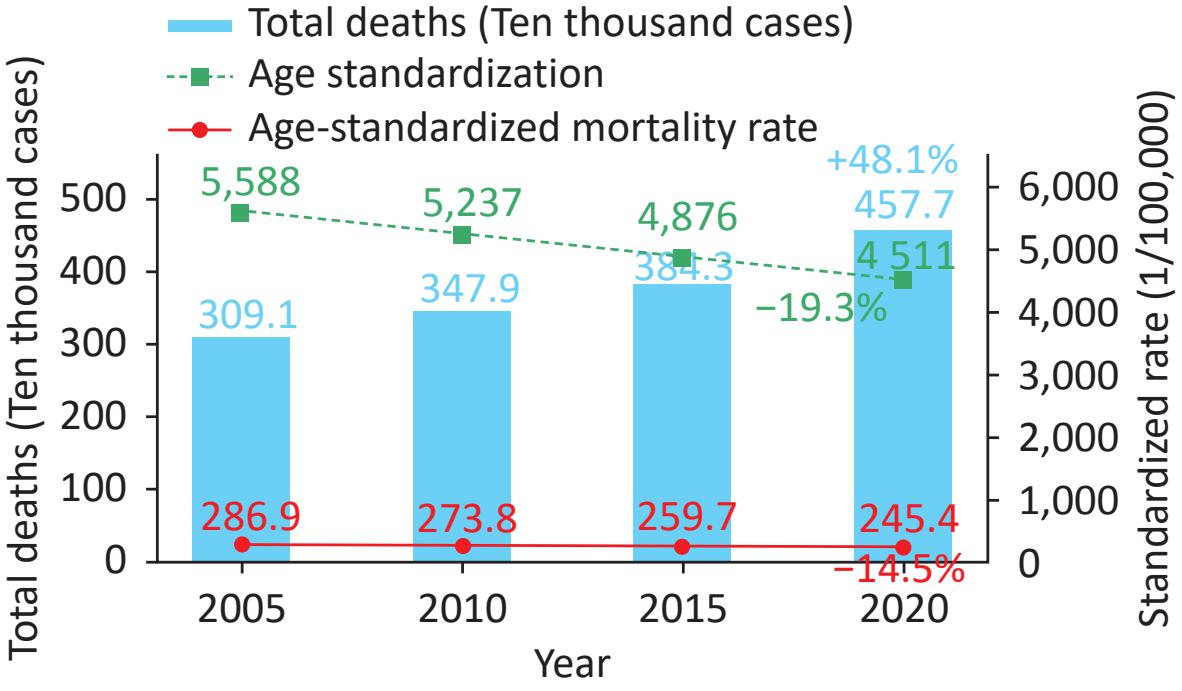
The China Mortality Surveillance System covers 300 million people (24% of the population) from 605 surveillance sites across 31 provinces, autonomous regions, and municipalities. Using the 2010 census population for age standardization and years of life lost (YLL) as the primary measure of premature CVD mortality burden[3], the absolute number of CVD deaths in China rose from approximately 3.09 million to 4.58 million between 2005 and 2020, an increase of about 48.1%. However, over the same period, the age-standardized mortality rate (ASMR) for CVD declined by approximately 14.5%, from 286.85 to 245.39 per 100,000, and the age-standardized YLL rate decreased by about 19.3%, suggesting overall declines in mortality risk and the burden of premature death (Figure 3). This divergence—rising absolute numbers but falling rates—is primarily driven by rapid population aging, which accounts for about two-thirds of the increase in CVD deaths, with population growth and declines in age-specific mortality acting as amplifying and offsetting factors, respectively. IHD, ischemic stroke, and hemorrhagic stroke are the three leading causes of CVD death and YLL, collectively accounting for the vast majority of CVD mortality and YLL. IHD had become the leading cardiovascular cause of death in 2020.
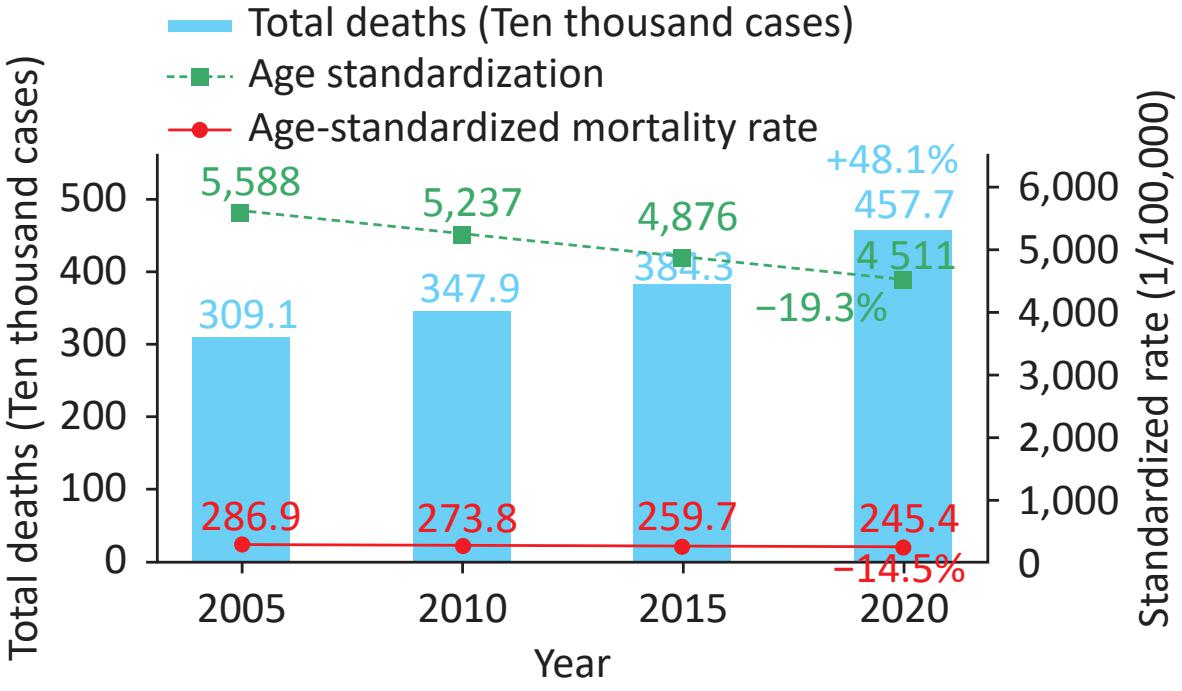
Figure 3. Cumulative changes in total deaths, age-standardized mortality rates, and age-standardized YLL rates (using 2005 as the baseline) from 2005 to 2020. Percentages represent cumulative changes relative to 2005. YLL, years of life lost.
In 2024, analysis of data from 310 surveillance sites across 30 provinces, autonomous regions, and municipalities, as part of the Cardiovascular and Cerebrovascular Event Surveillance Project in Chinese Residents, showed that the crude incidence rate of CVD—including acute myocardial infarction (AMI), angina pectoris treated with percutaneous transluminal coronary angioplasty (PTCA)/percutaneous coronary intervention (PCI) and/or coronary artery bypass grafting (CABG), stroke, and sudden cardiac death—among residents aged ≥ 18 years was 639.46 per 100,000 (age-standardized incidence rate: 651.47 per 100,000). The incidence rate was higher in males (crude rate: 747.96 per 100,000; age-standardized rate: 807.50 per 100,000) than in females (crude rate: 526.66 per 100,000; age-standardized rate: 500.82 per 100,000). CVD incidence increases rapidly with age.
-
According to GBD 2021 data, from 1990 to 2021, the number of prevalent IHD cases in China increased from 19.5055 million to 63.3313 million, an increase of 224.64%. The age-standardized prevalence rate increased by 20.4% (95% Uncertainty Interval [UI]: 14.5%–27.7%), from 2,526.4 to 3,042.4 per 100,000, making China one of the countries with the largest increase globally. During the same period, IHD deaths rose from 547,800 to 1,956,900, and the ASMR increased by 17.8% (95% UI: −1.6% to 41.1%) from 94.1 to 110.9 per 100,000. DALYs due to IHD increased from 13.6241 million person-years to 35.6726 million person-years, and the age-standardized DALY rate increased by 4.8% (95% UI: −13.6% to 28.1%) from 1,771.1 to 1,856.5 per 100,000. Among the 21 GBD regions globally, East Asia is the only region where all age-standardized IHD rates are on the rise. The latest GBD 2021 assessment indicates that both the absolute burden and age-standardized rates of IHD in China continue to rise, consistent with the concurrent surge in the prevalence of obesity, diabetes, and elevated non-high-density lipoprotein cholesterol (non-HDL-C) across all age groups. While age-standardized IHD rates have generally declined in high Socio-demographic Index (SDI) regions globally, East Asia, including China, remains the only region where all age-standardized IHD rates are still increasing. This suggests that population aging and the epidemic of metabolic risk factors have outweighed the counteracting effects of healthcare system improvements, posing substantial challenges for primary prevention and risk factor control.
Preliminary results from the China Cardiovascular Disease and Risk Factor Surveillance Project, conducted from 2020 to 2022 across 262 surveillance sites in 31 provinces, autonomous regions, and municipalities, indicated that the prevalence of coronary heart disease—including AMI, PCI, CABG, and hospitalization for unstable angina—among residents aged ≥ 18 years was 758 per 100,000. Prevalence was higher in males (940 per 100,000) than in females (570 per 100,000), and higher in urban areas (892 per 100,000) than in rural areas (639 per 100,000). The higher prevalence in males is consistent with higher rates of smoking, alcohol consumption, and atherogenic dyslipidemia. The higher prevalence in urban areas may be related to greater exposure to atherosclerotic cardiovascular disease (ASCVD) risk factors, wider availability of diagnostic technologies (e.g., coronary computed tomography angiography, coronary angiography); the difference may also partly reflect underdiagnosis in rural areas.
Analysis of data from the Cardiovascular and Cerebrovascular Event Surveillance Project in Chinese Residents in 2024 (310 sites, 30 provinces, autonomous regions, and municipalities) found that the crude incidence rate of AMI among residents aged ≥ 18 years was 91.47 per 100,000 (age-standardized incidence rate: 93.00 per 100,000), with a higher rate in males (120.31 per 100,000) than in females (61.49 per 100,000). The crude incidence rate of AMI increased rapidly with age.
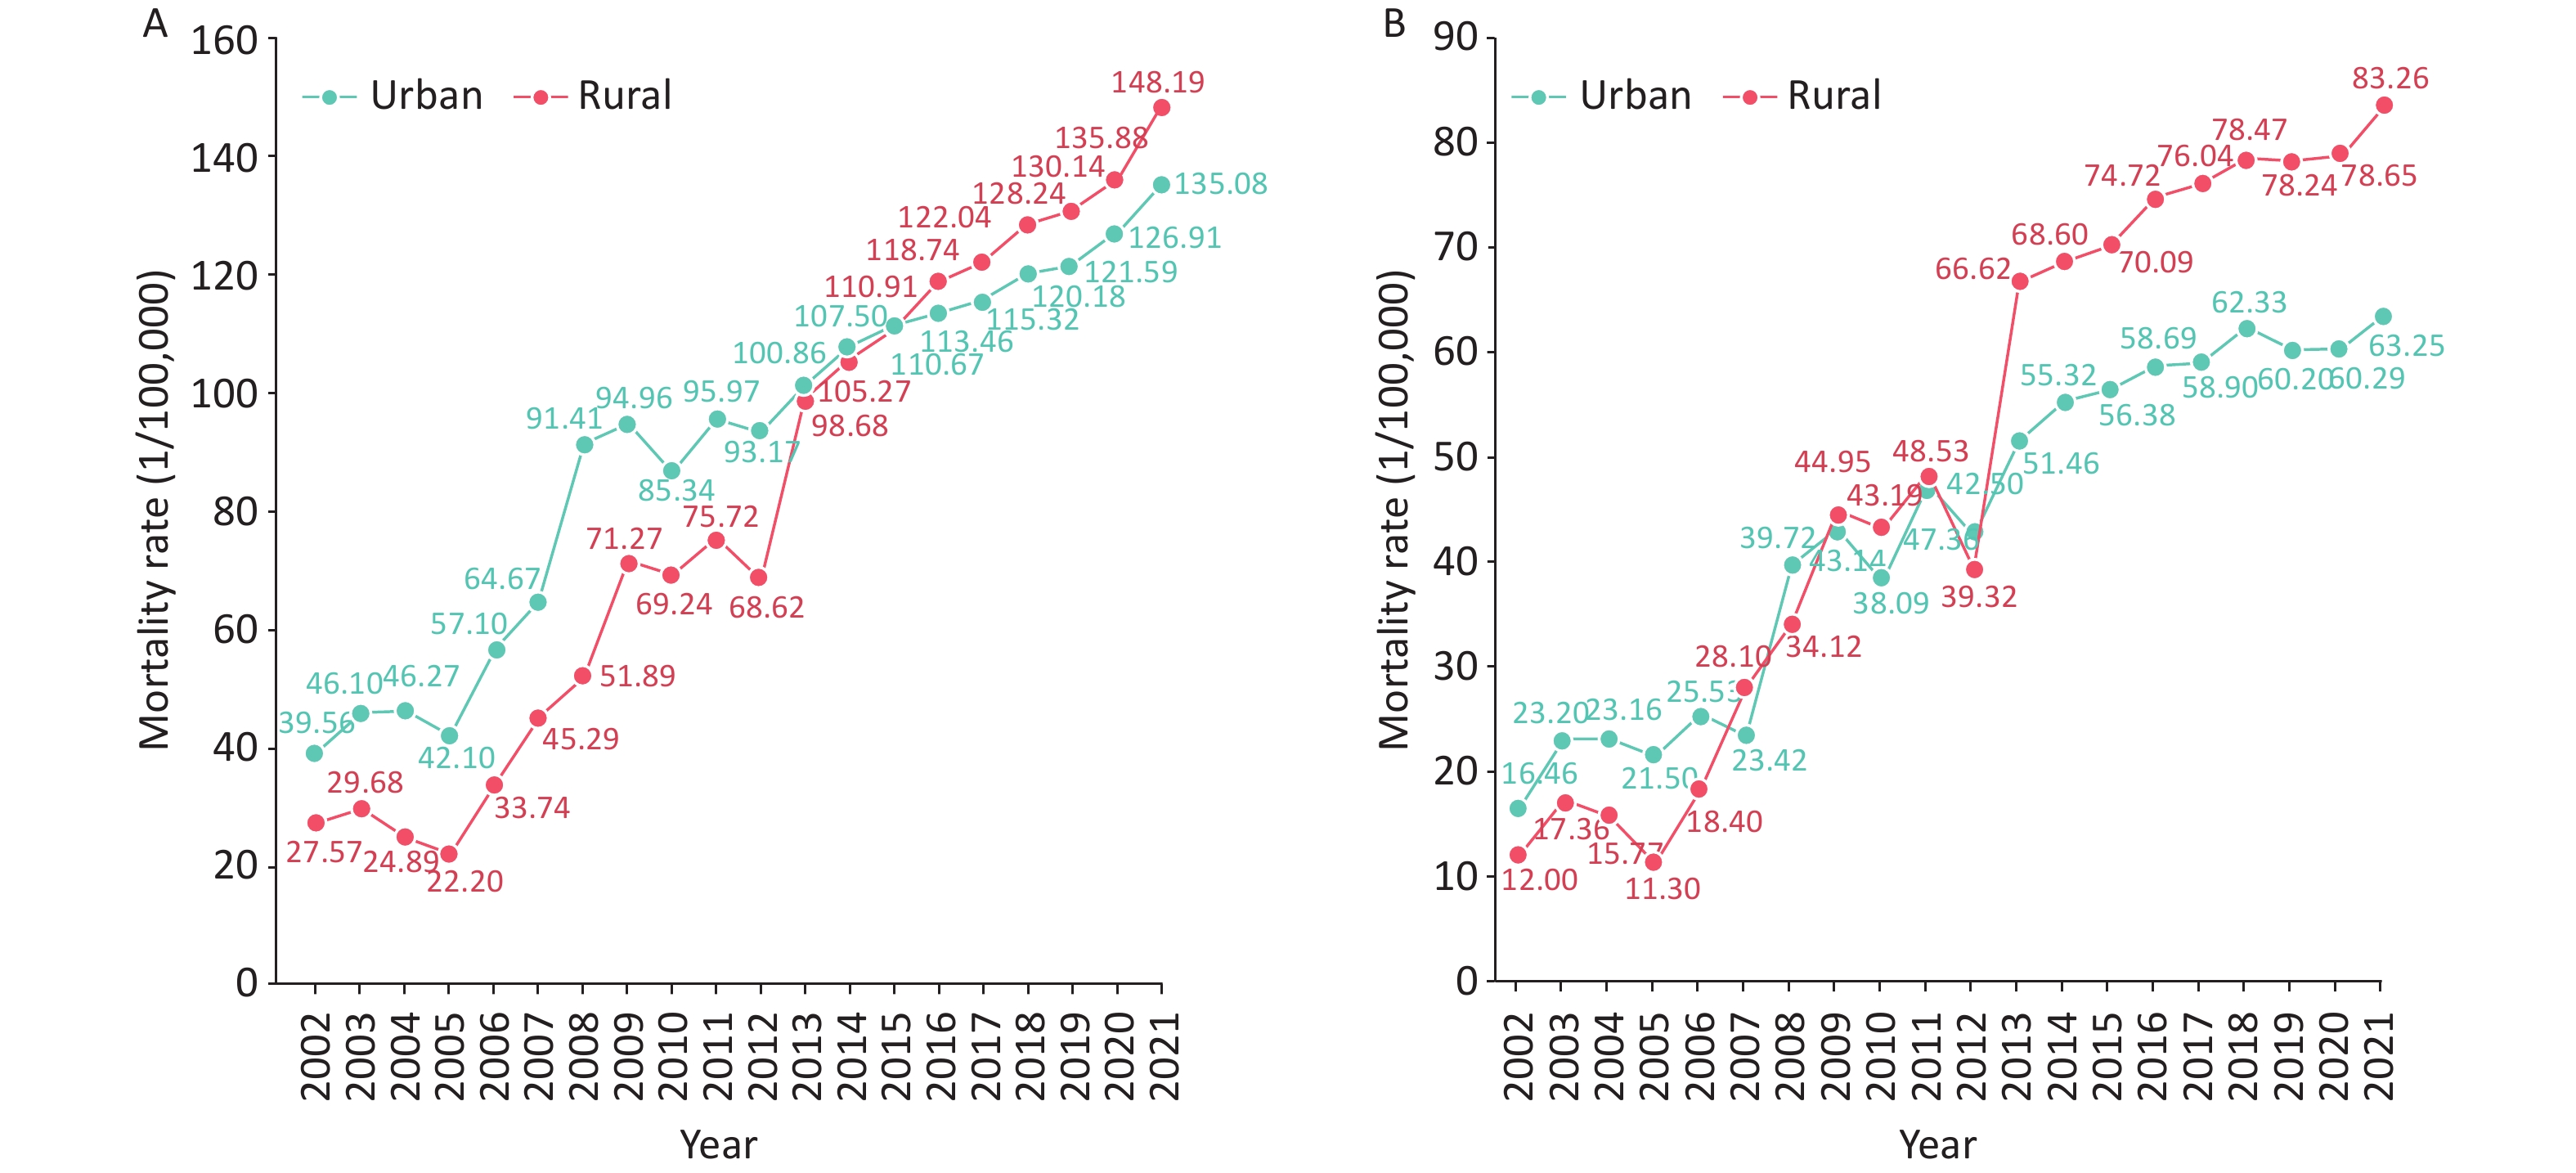
Regarding mortality trends, both coronary heart disease and AMI mortality rates generally increased, with persistent urban-rural disparities. According to the China Health Statistics Yearbook 2022[2], the urban coronary heart disease mortality rate in 2021 was 135.08 per 100,000, while the rural rate was 148.19 per 100,000. In both urban and rural areas, male coronary heart disease mortality rates exceeded female rates. The crude mortality rate for coronary heart disease in 2021 continued the upward trend observed since 2012, with a marked increase in rural areas and surpassing urban rates since 2016 (Figure 4A). From 2002 to 2021, crude AMI mortality rates increased overall in both urban and rural China. Rural AMI crude mortality rates began to rise notably around 2012 and have consistently exceeded urban rates since 2013 (Figure 4B).
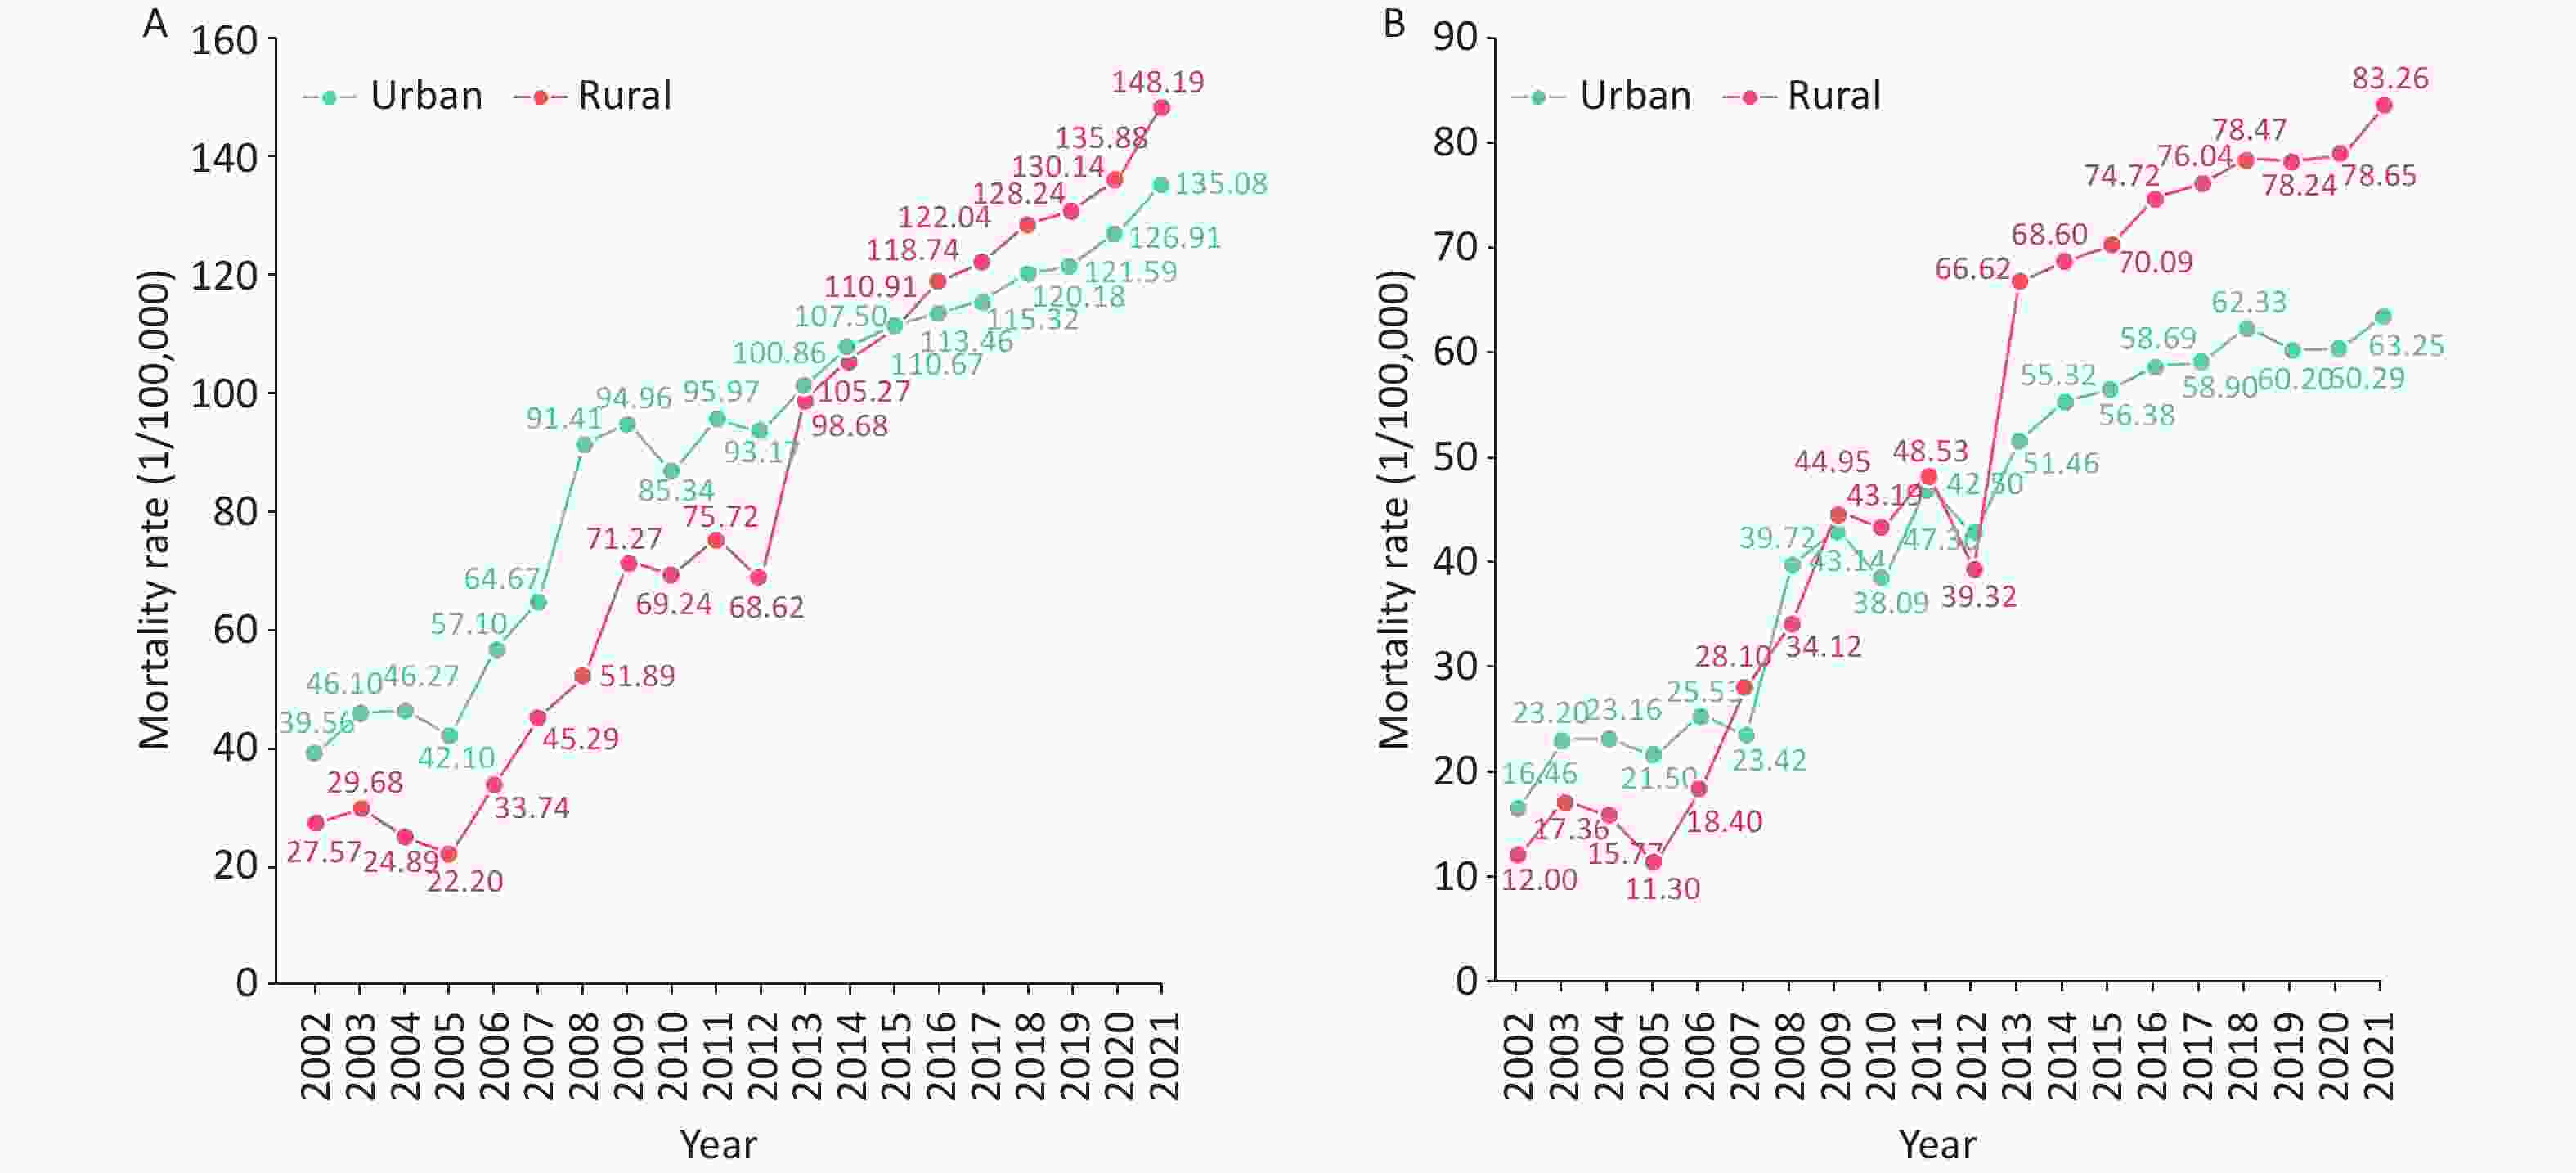
Figure 4. Trends in crude mortality rates of coronary heart disease (A) and acute myocardial infarction (B) among urban and rural residents in China from 2002 to 2021.
-
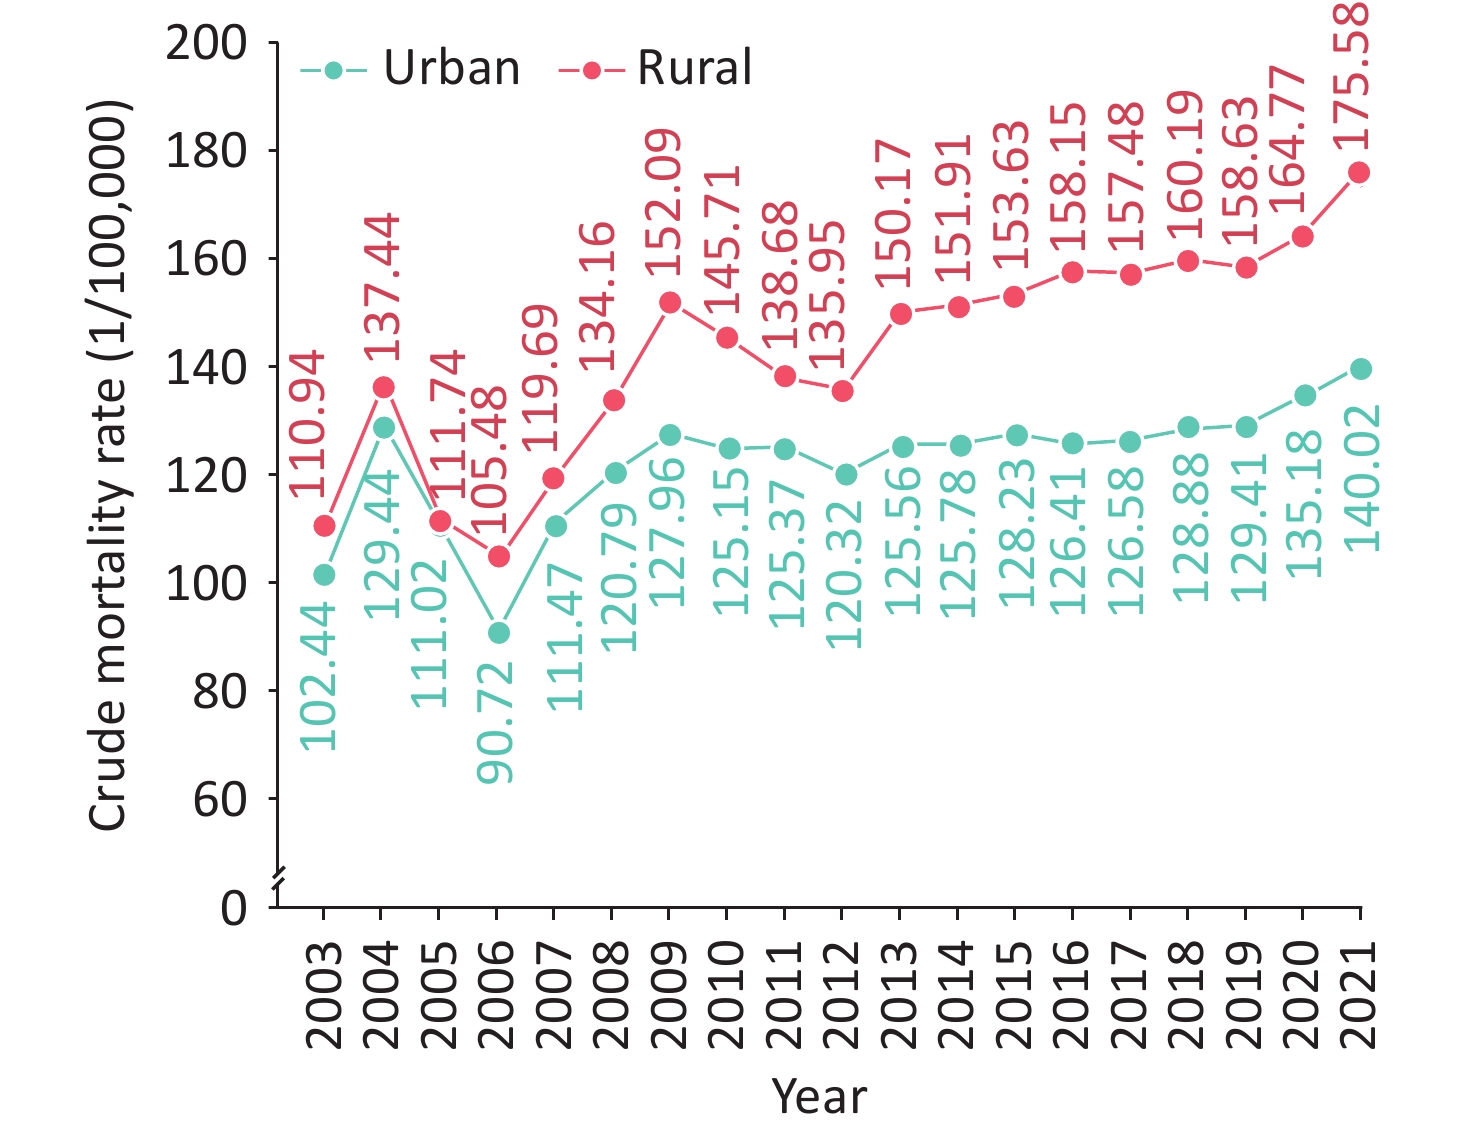
According to the China Health Statistics Yearbook 2022[2], the cerebrovascular disease mortality rate in urban China in 2021 was 140.02 per 100,000, accounting for 21.71% of total urban deaths and ranking third among all causes. In rural areas, the rate was 175.58 per 100,000, accounting for 23.62% of total rural deaths and ranking second. Cerebrovascular disease mortality rates were higher in males than in females, and higher in rural areas than in urban areas. From 2003 to 2021, cerebrovascular disease mortality increased overall. Compared with 2003, the mortality rate increased 1.37-fold in urban residents and 1.58-fold in rural residents by 2021. The crude mortality rates of cerebrovascular disease in rural areas have exceeded those in urban areas each year since 2003 (Figure 5).
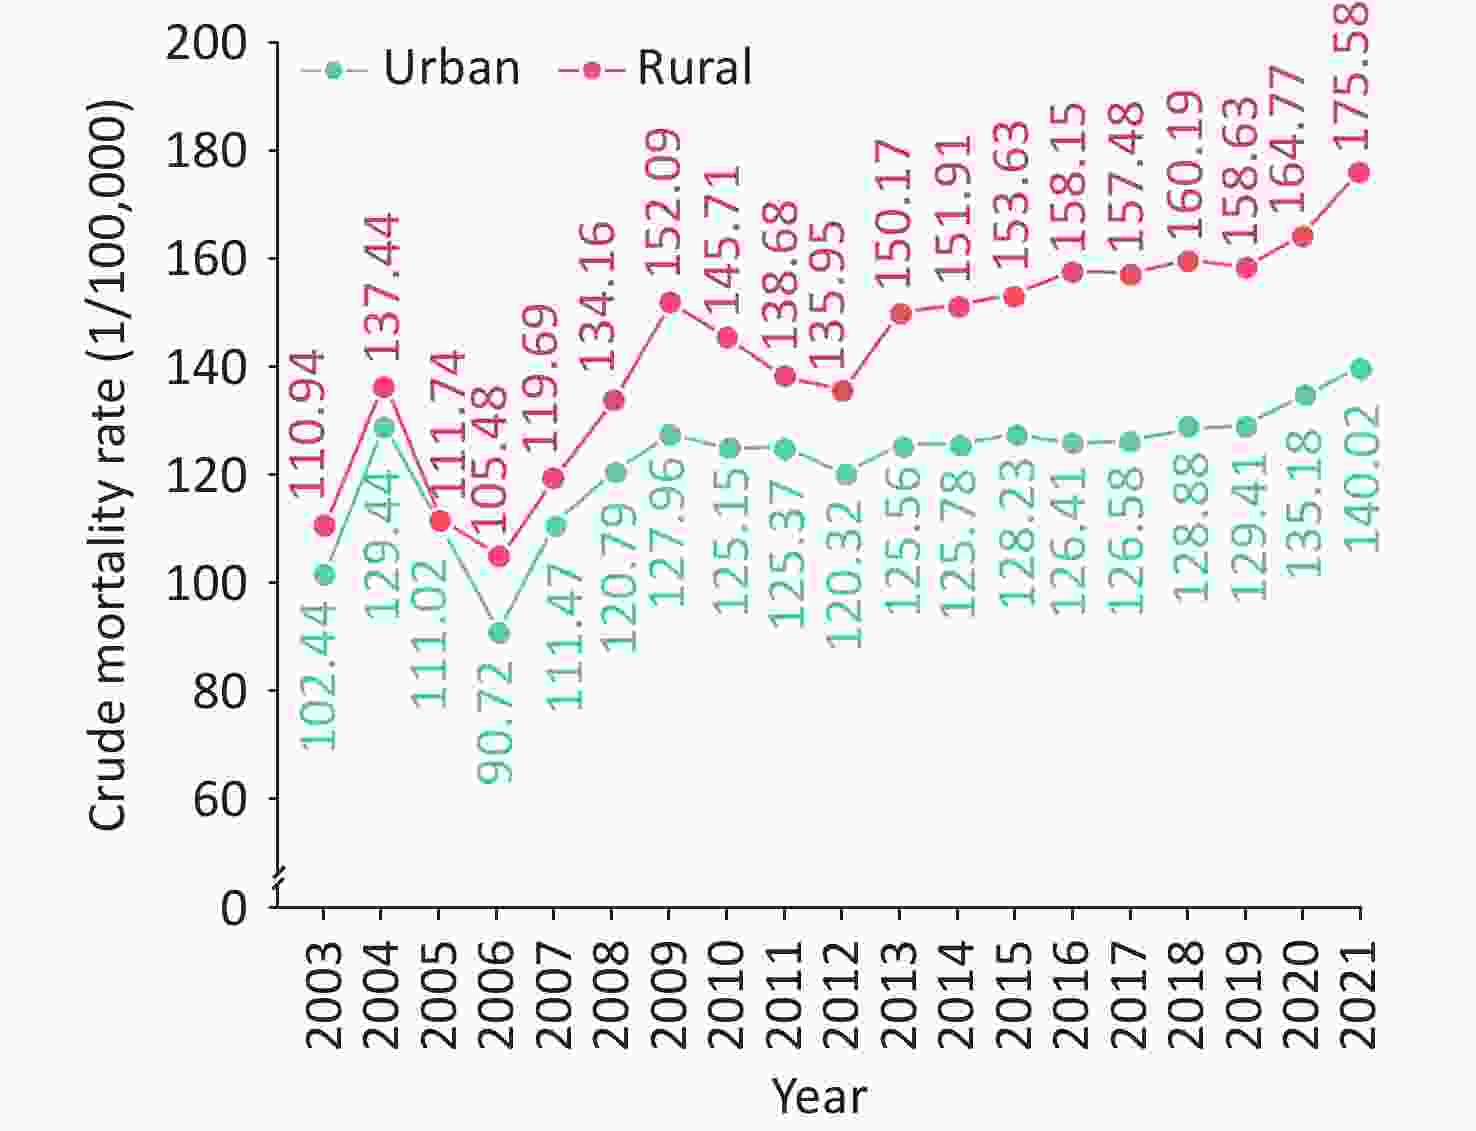
Figure 5. Trends in crude mortality rates due to cerebrovascular disease among urban and rural residents in China from 2003 to 2021.
According to GBD 2021 data, in 2021, ischemic stroke, hemorrhagic stroke, and subarachnoid hemorrhage accounted for 78.3%, 17.1%, and 5.3% of total stroke cases, respectively, with age-standardized prevalence rates of 1,018.8, 222.1, and 68.9 per 100,000. Compared with 1990, the number of cases increased by 216.3%, 40.8%, and 19.8%, respectively. From 1990 to 2021, the number of incident ischemic stroke cases increased by 264.2%, and deaths by 175.0%. Although the ASMR and age-standardized incidence rate for hemorrhagic stroke showed significant downward trends, the absolute number of cases continued to rise[4].
Ischemic stroke is the predominant type of cerebrovascular disease. In 2021, the number of stroke cases in China reached 26.34 million, an increase of 145.4% from approximately 10.74 million in 1990. There were 4.09 million new cases (up 142.6% from 1990) and 2.59 million deaths (up 69.3% from 1990)[4]. The age-standardized prevalence rate for stroke was 1,301.4 per 100,000 in 2021, an 11.5% increase from 1990, while the ASMR fell by 43.0% from 242.0 to 138.0 per 100,000, and the age-standardized incidence rate also declined (by 9.8%)[4]. This suggests that improvements in stroke treatment have been partially offset by population aging and the prevalence of risk factors, leaving substantial challenges for prevention.
Results from the 2013 China Stroke Epidemiological Survey, which analyzed 595,711 residents across 155 surveillance sites in 31 provinces, autonomous regions, and municipalities, showed an age-standardized incidence rate of first-ever stroke of 229.5 per 100,000 person-years and a total stroke event rate of 300.6 per 100,000 person-years[5]. Among 480,687 residents aged ≥ 20 years, 7,672 stroke cases were identified, yielding a crude prevalence of 1,596.0 per 100,000 (age-standardized: 1,114.8 per 100,000). Prevalence was higher in males (1,222.2 per 100,000) than in females (1,005.7 per 100,000), and in rural areas (1,291.1 per 100,000) than in urban areas (814.4 per 100,000)[6].
Analysis of data from the 2024 China Cardiovascular and Cerebrovascular Event Surveillance Project showed that the stroke incidence rate among residents aged ≥ 18 years was 499.78 per 100,000 (age-standardized: 509.27 per 100,000), with a higher rate in males (566.38 per 100,000) than in females (430.54 per 100,000). Stroke incidence increases with age.
The 2013 China Stroke Epidemiological Survey reported 7-day and 30-day mortality rates of 14.3% and 17.8% for first-ever stroke patients, respectively. Significant differences in 30-day mortality were observed by subtype: 8.3% (95% CI: 8.2%–8.5%) for ischemic stroke, 44.4% (95% CI: 42.2%–46.5%) for intracerebral hemorrhage, and 3.1% (95% CI: 3.0%–3.3%) for subarachnoid hemorrhage. The 30-day mortality for first-ever stroke was higher in rural areas (19.8%, 95% CI: 19.3%–20.3%) than in urban areas (14.9%, 95% CI: 14.5%–15.3%)[5].
Analysis of China Mortality Surveillance System data, using the average annual percentage change (AAPC) in ASMR to assess trends from 2015 to 2020, showed that the proportion of stroke deaths among all-cause deaths increased from 19.4% to 20.4%, while the ASMR for stroke showed a declining trend (AAPC = −2.1%, 95% CI: −3.7% to −0.4%). The proportion of deaths due to ischemic stroke increased from 9.3% to 11.7%, with no significant change in ASMR (AAPC = 1.6%, 95% CI: −0.3% to 3.6%). Death proportions for intracerebral hemorrhage and subarachnoid hemorrhage decreased from 9.4% and 0.8% to 8.1% and 0.6%, respectively, with declining ASMR trends for both[7].
From 2015 to 2020, the ASMR for stroke and all subtypes was higher in rural areas than in urban areas. The rural ASMR for ischemic stroke showed an upward trend (AAPC = 3.0%, 95% CI: 0.5%–5.6%), while the urban rate remained stable (AAPC = −0.6%, 95% CI: −1.6% to 0.5%). The ASMR for intracerebral hemorrhage declined in both rural (AAPC = −5.2%, 95% CI: −6.6% to −3.8%) and urban (AAPC = −6.1%, 95% CI: −7.2% to −5.0%) areas. The ASMR for subarachnoid hemorrhage also showed significant declines in both rural (AAPC = −6.5%, 95% CI: −7.7% to −5.4%) and urban (AAPC = −9.3%, 95% CI: −11.7% to −6.8%) areas[7].
GBD 2021 data show that stroke caused 53.19 million DALYs. From 1990 to 2021, stroke-related DALYs in China increased by 40.0%, with the largest increase for ischemic stroke (136.0%), followed by intracerebral hemorrhage (20.6%), while DALYs for subarachnoid hemorrhage declined by 56.7%. In 2021, the age-standardized DALY rate for stroke was 2,648.0 per 100,000, a substantial decrease of 45.2% from 1990. This decline was driven by an 81.3% decrease for subarachnoid hemorrhage and a 52.2% decrease for hemorrhagic stroke, while the age-standardized DALY rate for ischemic stroke declined by 14.9% (95% UI: −30.9% to 4.2%).
-
Data from 2024 show that the current smoking rate and daily smoking rate among Chinese adults were 23.2% and 20.3%, respectively, with both rates significantly higher in males than in females. The current and daily smoking rates were higher in rural areas (24.9%, 22.1%) than in urban areas (20.9%, 17.9%), with the difference particularly pronounced among high-income rural households. Daily smokers started smoking daily at an average age of 22.4 years, with younger smokers starting earlier. Current smokers smoked an average of 5.8 cigarettes per day, with rural smokers consuming more than urban smokers. Slim cigarettes were used by 32.9% of current smokers, with higher proportions among females, urban residents, and adults aged < 50 years[8]. The secondhand smoke exposure rate among non-current smokers in 2024 was 46.5%, with 18.7% exposed almost daily. Overall, with the promotion of tobacco control policies, secondhand smoke exposure in China has improved, decreasing by 5.9 percentage points compared to 2022. In the past 30 days, the highest proportion of participants reporting that they had seen others smoke was in restaurants (52.9%), followed by homes (35.4%), indoor workplaces (34.9%), medical institutions (10.9%), and public transportation (7.1%). Compared with 2022, these proportions decreased by 3.0, 5.9, 8.1, 2.7, and 2.1 percentage points, respectively[8].
From 2010 to 2024, smoking cessation behaviors among Chinese smokers increased significantly, with the quit rate rising from 16.9% to 22.6%, still below the global average of 40.0%. The proportion of smokers who attempted to quit in the past 12 months increased from 14.4% to 24.8%; the proportion planning to quit within 12 months rose from 16.1% in 2010 to 21.6% in 2022, but returned to 16.1% in 2024[8].
From 1990 to 2021, the CVD burden attributable to tobacco declined globally and in China. The global ASMR for smoking-related CVD fell from 57.2 to 26.3 per 100,000 (estimated annual percentage change [EAPC] = −1.81%, 95% CI: −2.00% to −1.63%); for secondhand smoke, it fell from 11.4 to 8.3 per 100,000 (EAPC = −1.72%, 95% CI: −1.91% to −1.53%). In China, the ASMR for smoking-related CVD fell from 52.2 to 39.6 per 100,000 (EAPC = −1.23%, 95% CI: −1.44% to −1.02%), and for secondhand smoke-related CVD from 15.3 to 14.7 per 100,000 (EAPC = −1.26%, 95% CI: −1.63% to −0.90%), with both declining more slowly than the corresponding global rates[9]. Due to population aging and suboptimal risk factor control, tobacco-related IHD deaths and DALYs in China in 2021 increased by 184.34% and 121.12% respectively compared to 1990, with no significant decline in ASMR and DALY rates. In contrast, the corresponding global indicators decreased by 40.43% and 39.95%, indicating a need to further strengthen tobacco-related CVD prevention and control in China further strengthening[10].
-
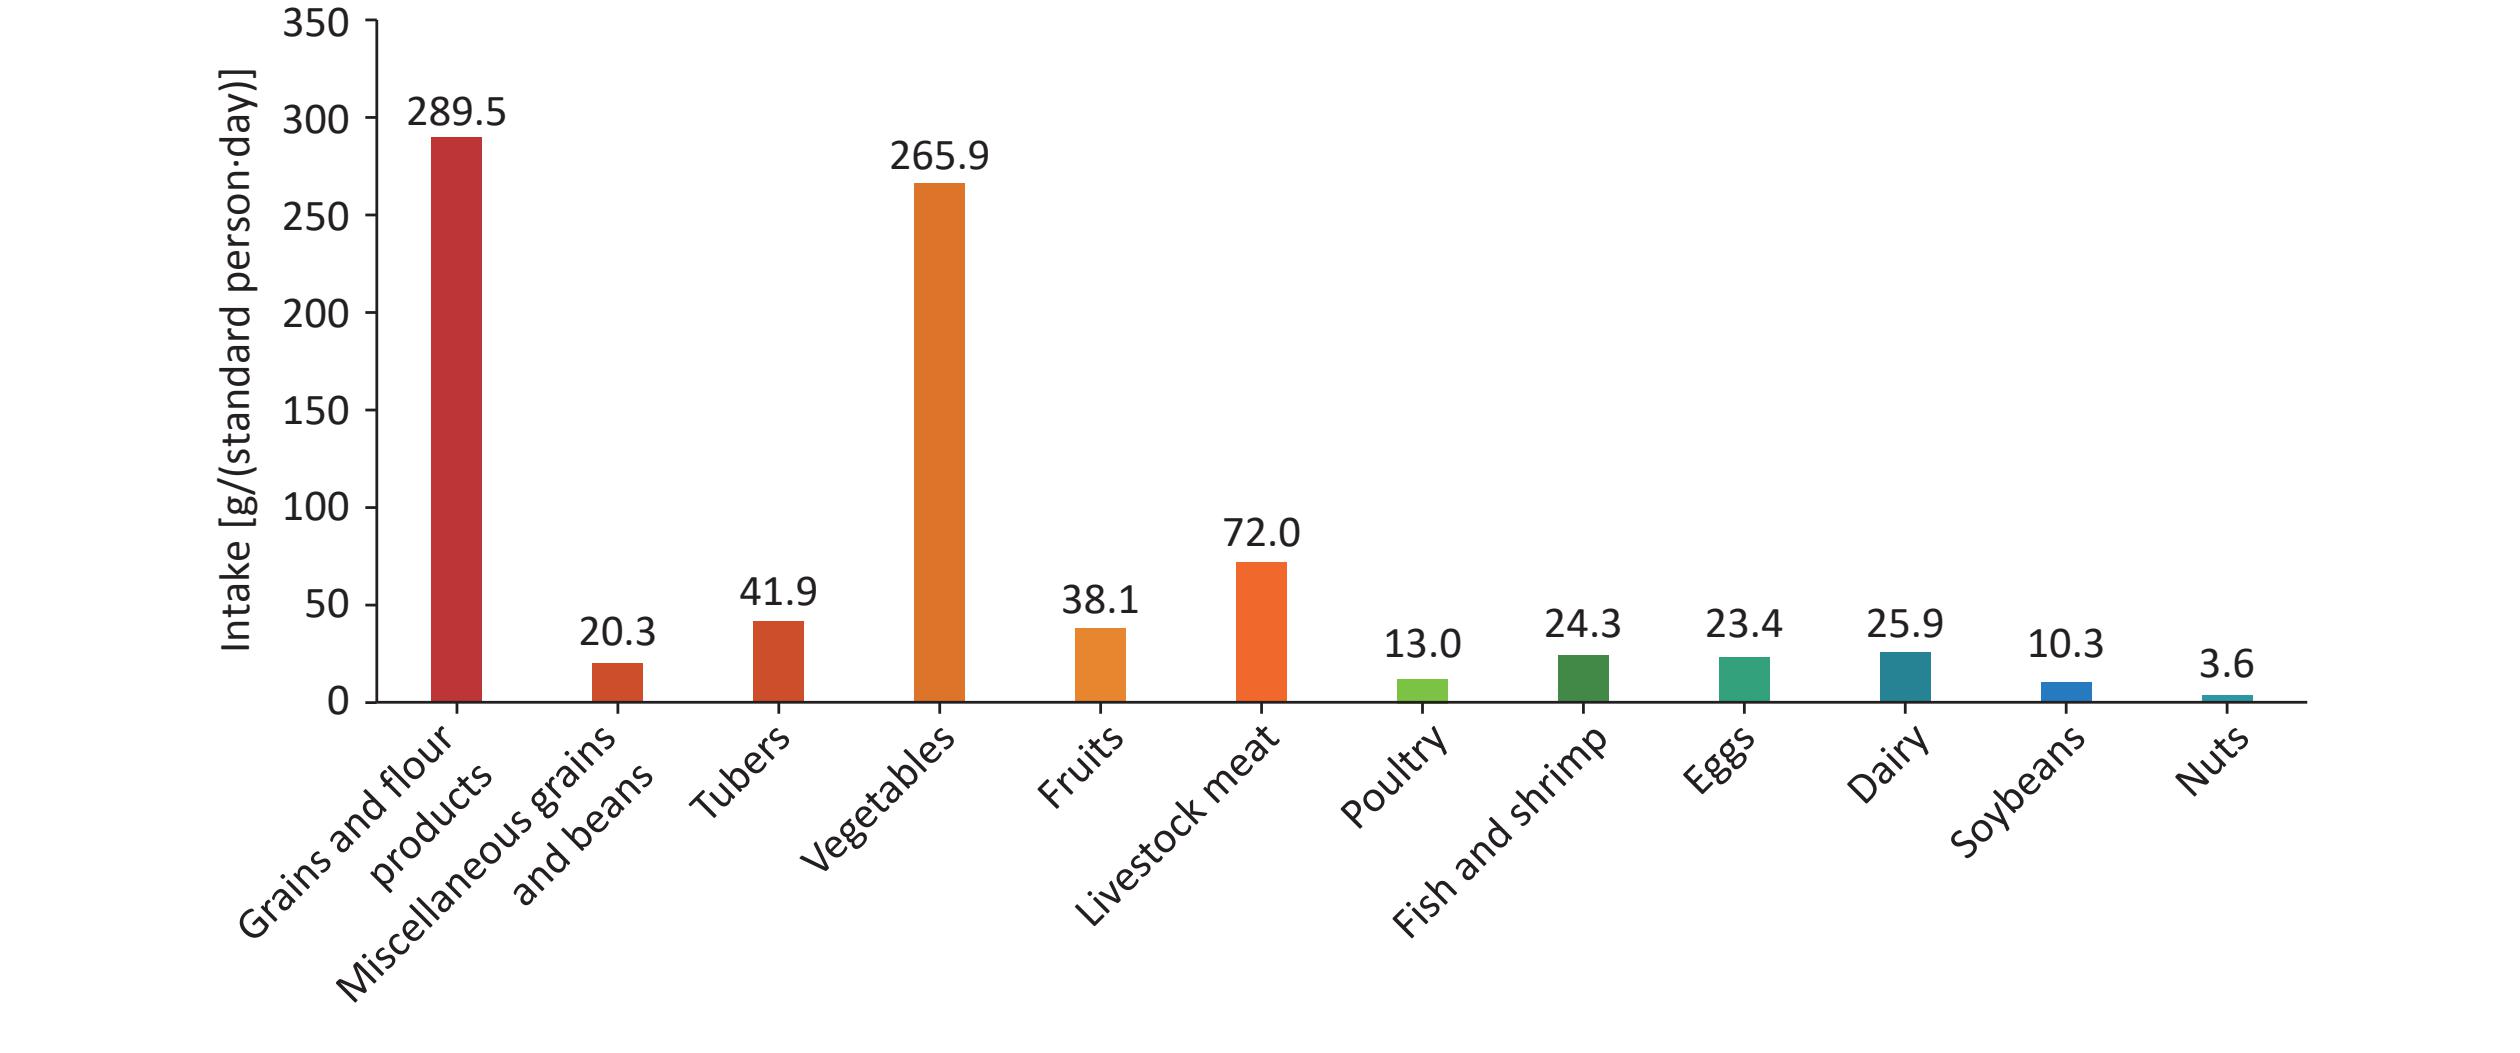
National nutrition survey data show that from 1982 to 2017, major changes in food intake among Chinese residents included decreased consumption of grains, vegetables, and tubers; a persistently imbalanced pattern of animal-source food consumption (excessive pork intake, insufficient poultry and aquatic products); consistently low intake of fruits, eggs, dairy, and soybeans, far below recommended levels; and increased cooking oil intake. Although household cooking salt use decreased, intake of cooking oil [43.2 g/(standard person·day)] and cooking salt [9.3 g/(standard person·day)] during 2015–2017 remained well above recommendations[11]. Intake of various foods among Chinese residents from 2015 to 2017 is shown in Figure 6.
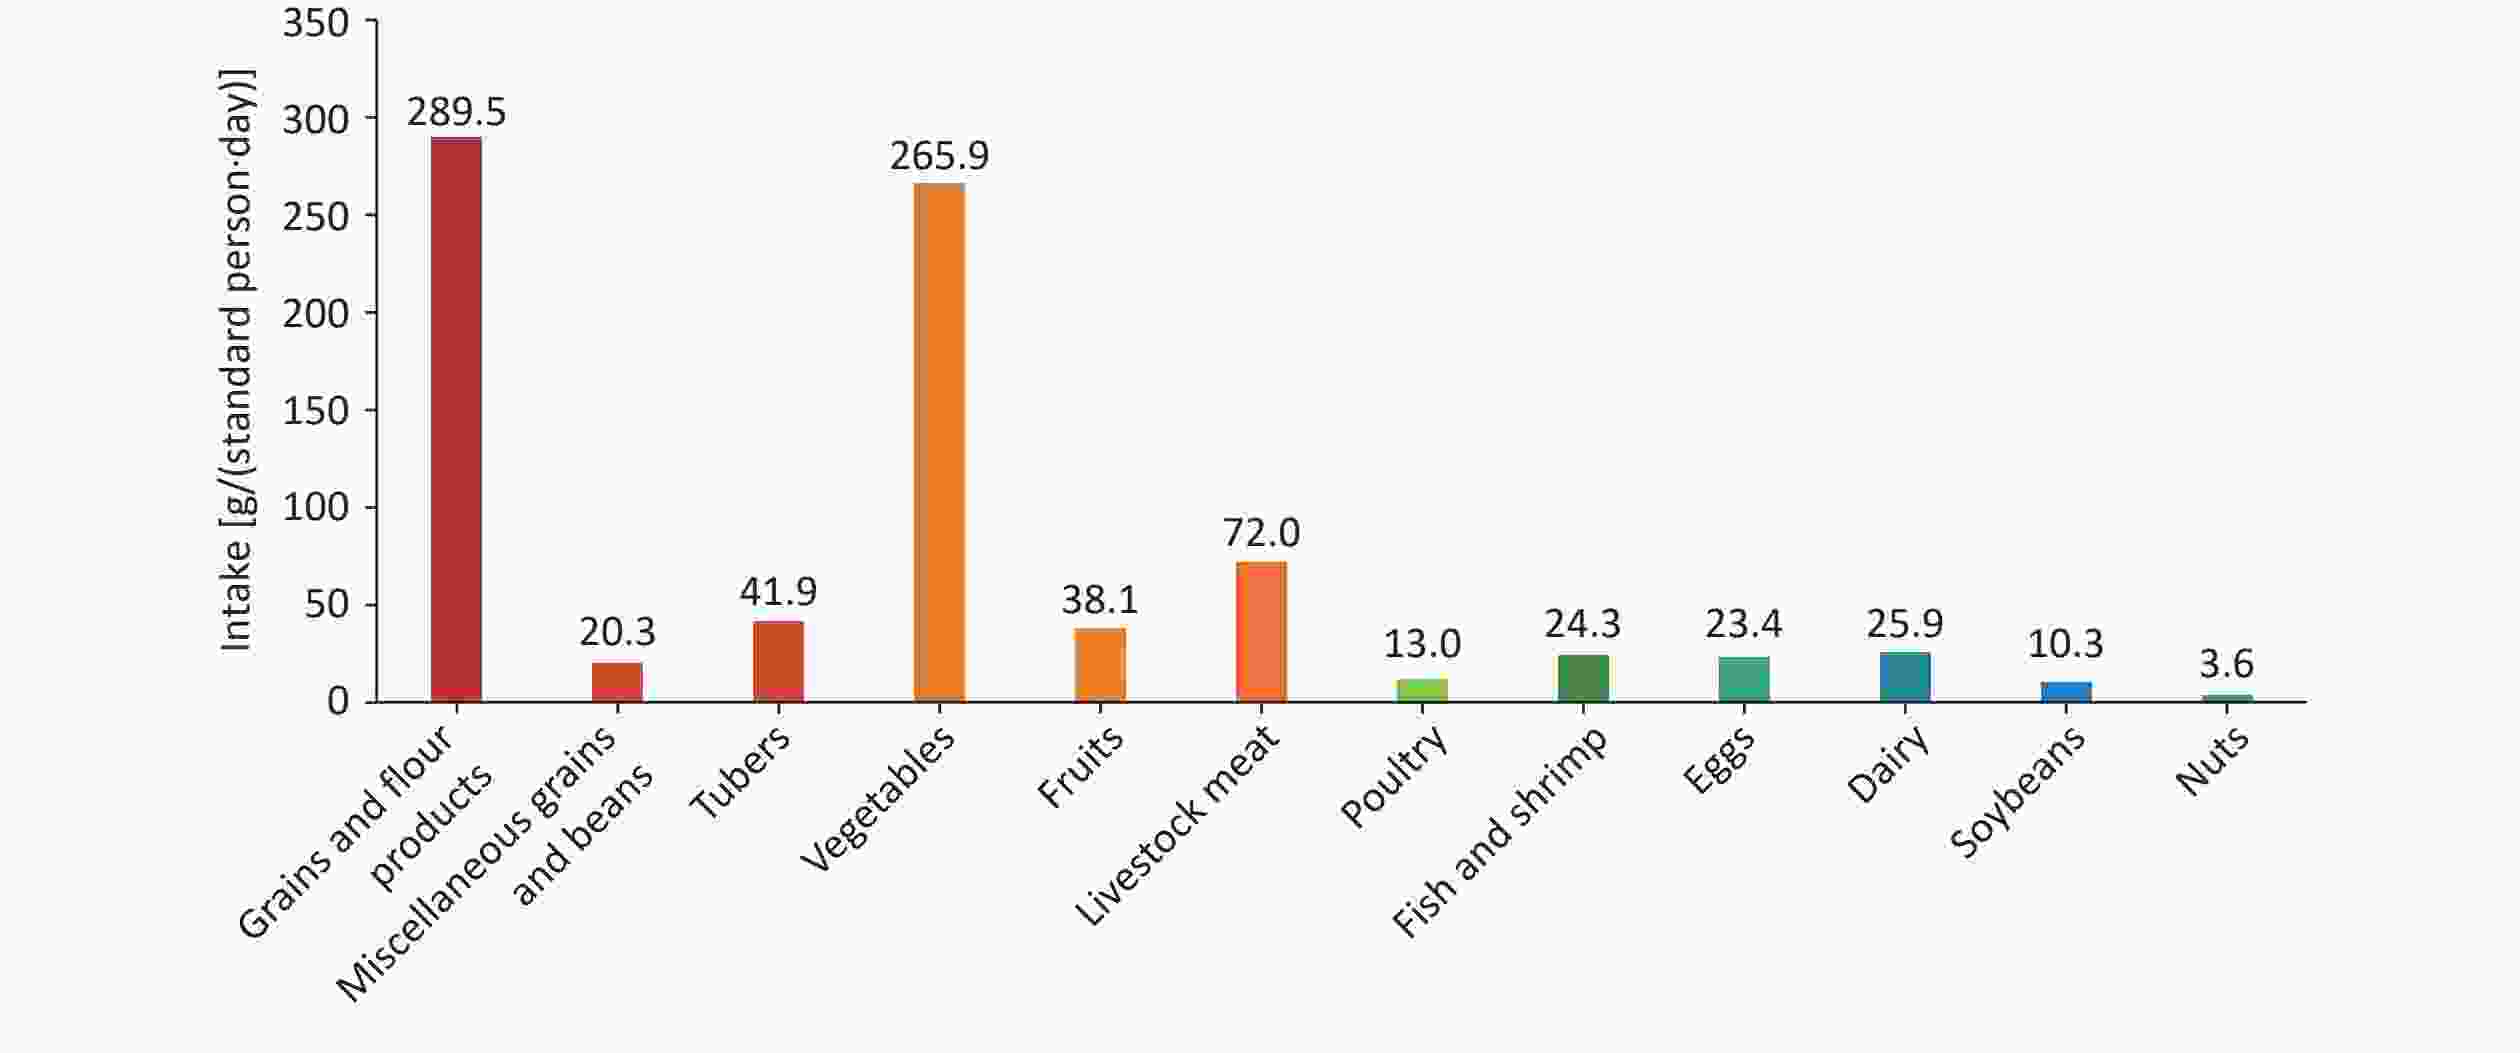
Figure 6. Intake of various foods by Chinese residents between 2015 and 2017.
Data from the China Health and Nutrition Survey (CHNS) and the 2022–2023 China Development and Nutrition Health Impact Cohort across 10 provinces, autonomous regions, and municipalities showed that adult energy intake in 2022–2023 was slightly lower than in 2018, while the percentage of energy derived from fat further increased to an average of 40.08%, the percentage of energy derived from carbohydrates decreased to 44.06%, and the percentage of energy derived from protein remained stable at 13.02%[12]. In 2020, the percentage of energy derived from fat among Chinese children aged 6–17 reached 33.70%[13].
Inadequate intake of micronutrients is widespread among Chinese residents. Data from 72,231 adults aged ≥ 18 years in the 2015–2017 China Nutrition and Health Surveillance (CNHS) showed that the highest inadequacy rate was for calcium, followed by vitamin B2, while sodium intake was excessively high[14]. A 2015–2017 study of 10,114 representative Chinese individuals, using the gold-standard 24-hour urine collection method for the first time, confirmed imbalanced sodium and potassium intake. Average sodium intake was 4,431 mg/d, more than double the WHO-recommended upper limit (2,000 mg/d); average potassium intake was 1,992 mg/d, only about 60% of the WHO-recommended lower limit (3,510 mg/d); and the average sodium-to-potassium ratio was 5.02, far above the WHO ideal level (< 1.0)[15].
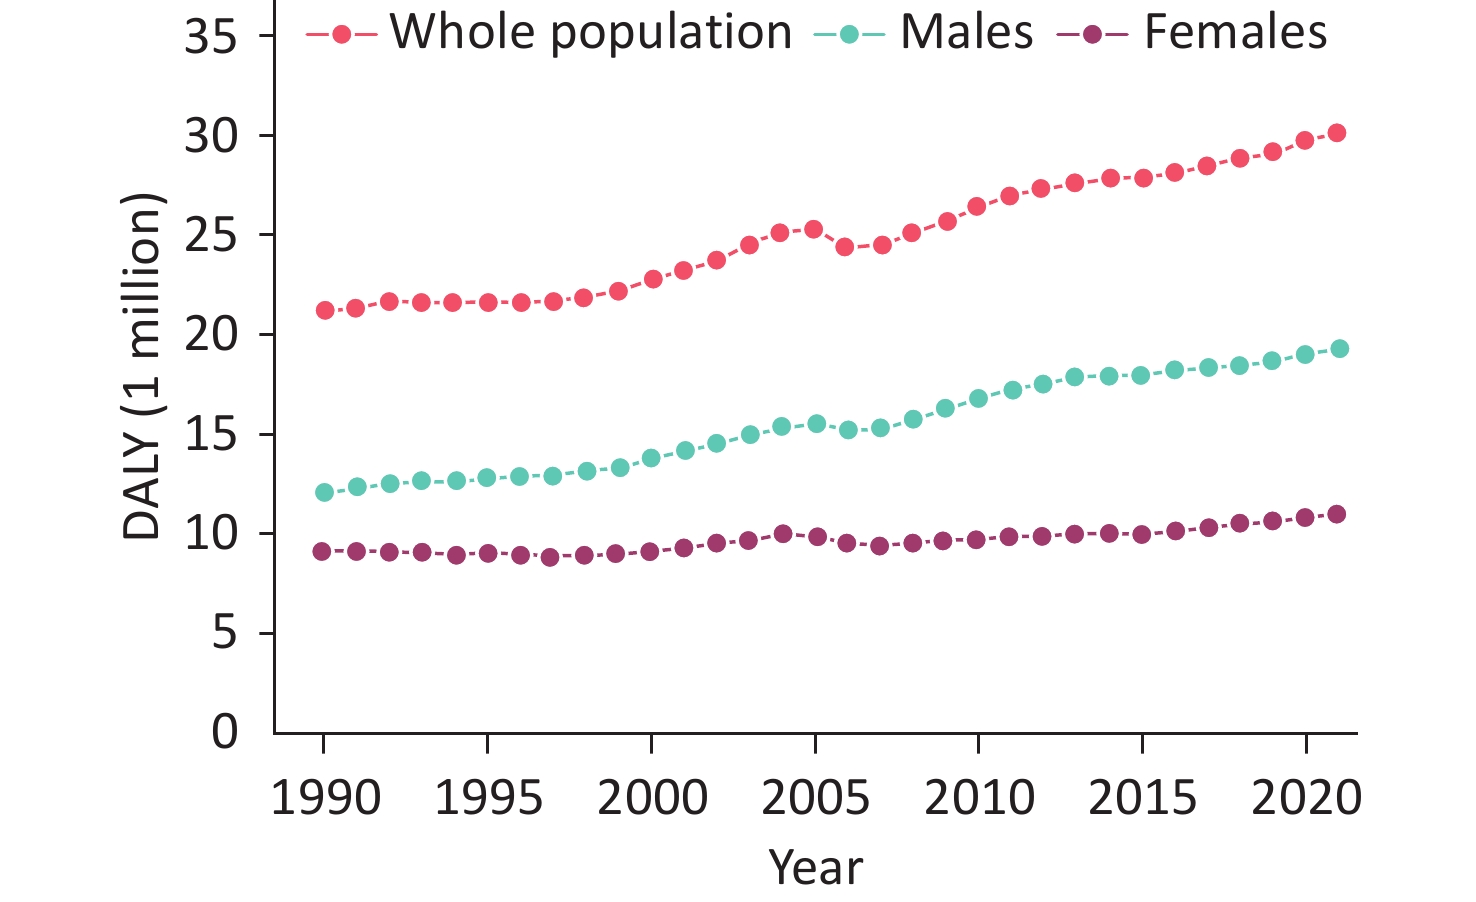
Dietary factors have a significant impact on the CVD burden in China. GBD 2021 data show that compared with 1990, CVD deaths and DALYs attributable to dietary factors increased in 2021. Specifically, in 2021, dietary factors caused 1,449,876 (95% UI: 594,791–2,244,037) CVD deaths and 30,266,167 (95% UI: 13,228,421–45,225,087) DALYs, representing increases of 74.71% and 43.86%, respectively from 1990. The dietary-attributable CVD burden has consistently been higher in males than in females (Figure 7)[16].
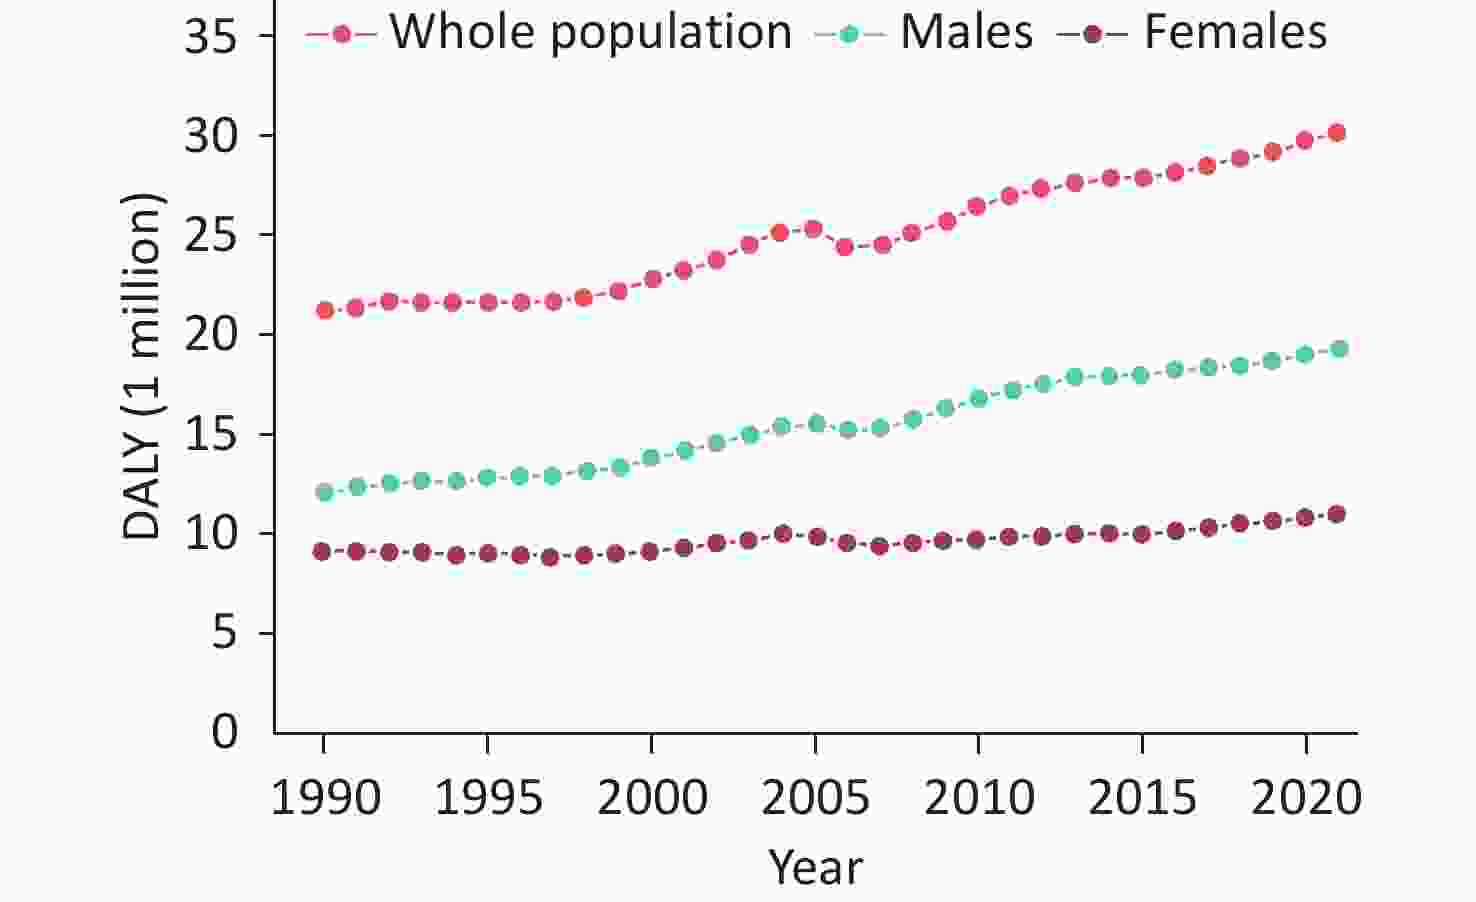
Figure 7. Cardiovascular disease DALYs attributable to dietary factors in China overall and by sex from 1990 to 2021. DALY, disability-adjusted life year.
In 2021, high sodium intake remained the leading dietary risk factor. Notably, the burdens associated with high intake of processed meat and sugar-sweetened beverages and low intake of polyunsaturated fatty acids and whole grains increased; the largest increase in mortality and DALY rates was associated with excessive sugar-sweetened beverage consumption (Table 1)[16].
Items Age-standardized DALY rate [/ten thousand (95% UI)] Average annual percentage change in DALYs (%) 1990 2021 All dietary risk factors 2,630.84 (1,471.93–3,614.80) 1,499.58 (632.89–2,247.22) −1.83 High sodium intake 1,493.92 (580.70–2,545.09) 837.94 (292.23–1,548.70) −1.88 Low fruit intake 886.23 (384.05–1,303.04) 297.87 (119.14–469.39) −3.47 Low vegetable intake 391.19 (278.68–507.01) 27.66 (11.87–50.73) −8.22 Low intake of dietary fiber 306.43 (40.22–562.98) 100.35 (24.54–183.55) −3.57 Low intake of whole grains 306.33 (89.90–510.51) 299.40 (102.42–498.29) −0.11 Low nut intake 205.77 (60.76–339.76) 122.30 (33.80–214.48) −1.69 Low intake of marine foods rich in ω-3 fatty acids 190.45 (40.01–315.64) 74.90 (13.91–135.90) −3.00 Intake of low-unsaturated fatty acids 186.26 (−582.33–706.47) 172.83(−505.67–669.37) −0.25 Low intake of legumes 77.49 (−62.33–197.58) 58.48 (−45.50–158.96) −0.94 Intake of high-chain fatty acids 11.66 (1.33–24.33) 5.27 (0.54–11.67) −2.59 High intake of processed meats 3.00 (0.86–5.12) 5.26 (1.58–9.23) 1.80 Consumption of high-sugar beverages 0.83 (0.16–1.60) 2.70 (0.58–4.98) 3.97 Note. DALY, disability-adjusted life years; UI, uncertainty interval. Table 1. Changes in the disease burden of cardiovascular diseases caused by various dietary factors in China between 1990 and 2021
GBD 2021 analysis showed an upward trend in dietary risk-related DALYs in China from 1990 to 2021[17]. In 2021, 23.51% of type 2 diabetes-related DALYs were attributable to dietary risk factors, up from 19.39% in 1990. The top three dietary risk factors for type 2 diabetes in China in 2021 were high red meat intake, low whole grain intake, and high processed meat intake. Among seven dietary risk factors for type 2 diabetes in China, four showed upward trends from 1990 to 2021: high red meat intake, low whole grain intake, high processed meat intake, and high sugar/sweetened beverage intake (Table 2). A study based on the CHNS cohort (1997–2015) involving 16,029 participants with a median follow-up of 9.86 years showed that each standard deviation increase in the EAT-Lancet diet (proposed in 2019 by the EAT-Lancet Commission on Food, Planet, and Health, is a plant-forward dietary pattern that prioritizes plant-based foods while limiting the intake of animal-sourced foods, added sugars, refined grains and ultra-processed foods) index score was associated with an 8% (95% CI: 2.2%–14.1%) reduction in all-cause mortality risk, a 16.1% (95% CI: 9.2%–20.3%) reduction in CVD risk, and a 25.3% (95% CI: 19.5%–28.4%) reduction in type 2 diabetes risk[18].
Items 1990 2021 EAPC [% (95% CI)] Age-standardized rate
(/100,000)Ranking Age-standardized rate
(/100,000)Ranking High intake of red meat 22.29 3 52.05 1 1.34 (0.89–9.48) Low intake of whole grains 29.50 1 42.02 2 0.42 (0.25–0.60) High intake of processed meats 9.90 4 28.58 3 1.89 (1.48–2.32) Low fruit intake 28.84 2 14.27 4 −0.51 (−0.59 to −0.41) Consumption of high-sugar and
sugary beverages2.24 6 13.35 5 4.95 (3.81–6.29) Low intake of dietary fiber 5.84 5 4.03 6 −0.31 (−0.45 to −0.16) Low vegetable intake 0.69 7 0.09 7 −0.88 (−0.94 to −0.81) Note. DALY, disability-adjusted life years; EAPC, estimated annual percentage change. Table 2. Changes in age-standardized DALY rates for type 2 diabetes attributed to various dietary factors in China between 1990 and 2021
-
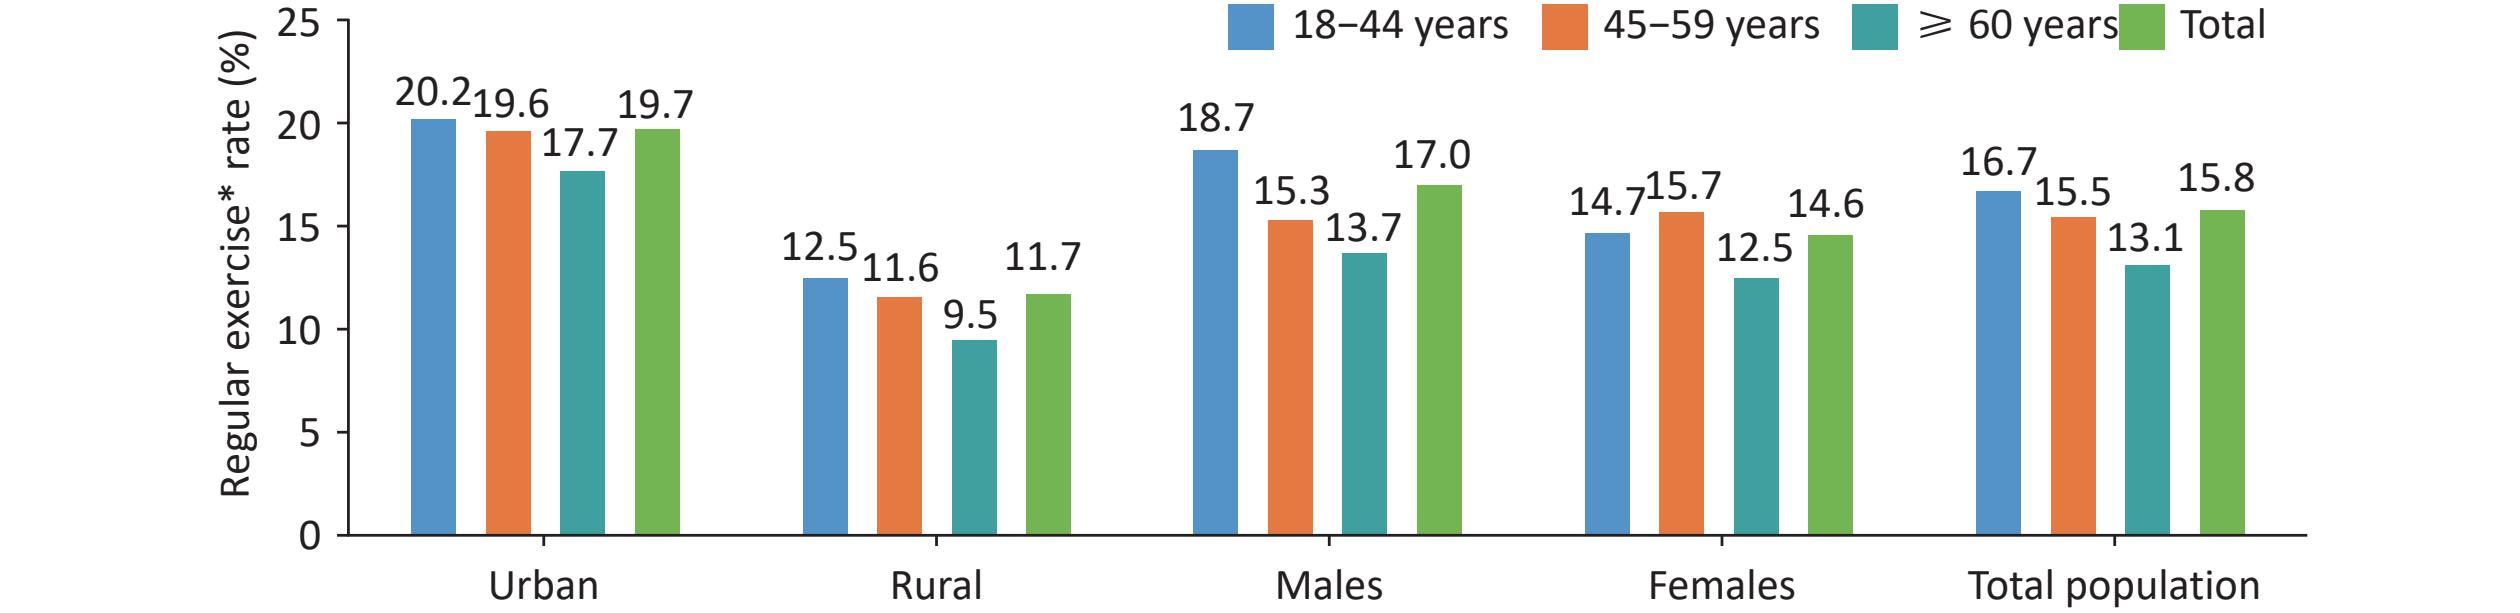
From 1991 to 2009, physical activity levels among Chinese adults decreased substantially (399 vs. 213 MET-h/week), with the largest decline in occupational activity, while sedentary time increased markedly (15.1 vs. 20.0 h/week)[19]. In 2018, the rate of regular exercise among Chinese adults—defined as moderate-to-vigorous exercise at least 3 times per week for at least 30 minutes per session—was 15.8%, higher in urban areas (19.7%) than in rural areas (11.7%), and higher in males (17.0%) than in females (14.6%) (Figure 8). Both the rate of insufficient physical activity (22.3% vs. 17.9%) and leisure-time sedentary behavior (3.2 h/d vs. 2.7 h/d) significantly increased compared with 2010[20].
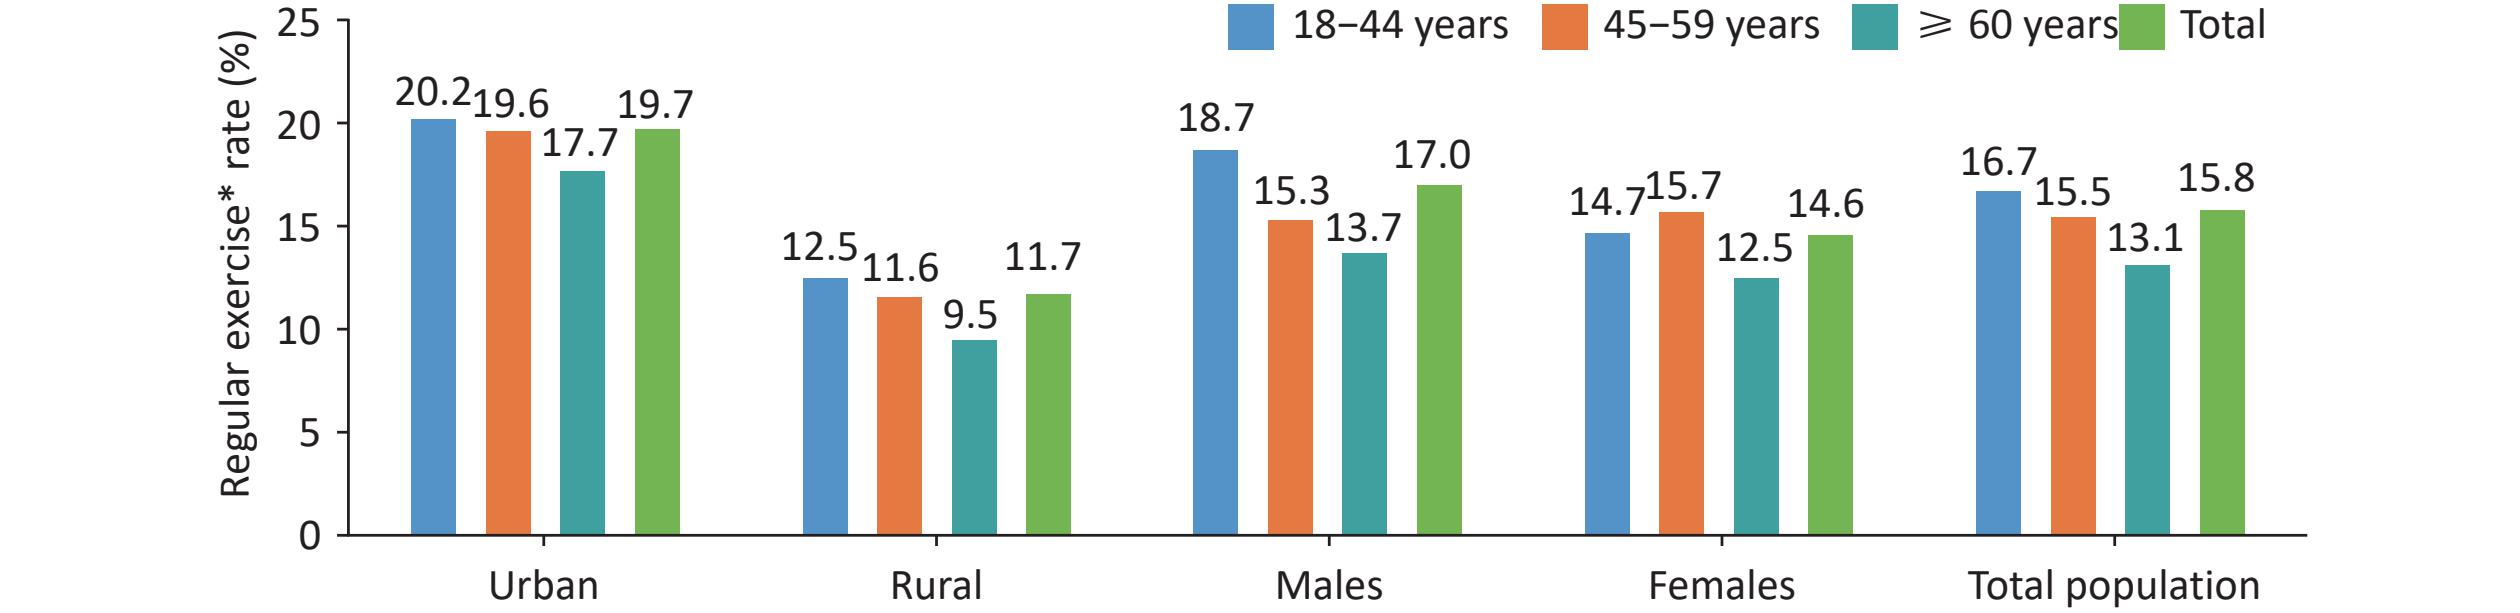
Figure 8. Regular exercise rates among Chinese residents aged ≥ 18 years in 2018. *Regular exercise was defined as engaging in moderate-to-high-intensity exercise at least 3 times per week, with each session lasting at least 30 minutes.
In 2017, the rate of meeting physical activity recommendations among primary and middle school students was higher than in 2016[21], but in 2019, the rates for both primary and middle school students significantly declined compared with 2017 (25.33% vs. 32.61% for primary; 17.61% vs. 28.15% for middle school), while the proportion of students who met the recommendation of limiting screen time to < 2 hours also decreased significantly (80.55% vs. 86.47%)[22]. In 2019, the proportion engaging in muscle-strengthening exercise ≥ 3 times/week reached 39.3%[23]. The excellent rate of students reaching physical health standards generally declined from 1985 to 2014. (2.2% vs. 2.7%)[24].
A 2016 WHO report indicated that meeting physical activity recommendations could reduce premature mortality by 18.3% among Chinese adults aged 40–74, equivalent to preventing 1,016,500 premature deaths annually[25]. In the China-PAR project, higher physical activity was associated with reduced ASCVD risk: a 42% risk reduction in the high-risk group and 38% in the low-risk group compared with the lowest activity group. A proportion of moderate-to-vigorous physical activity > 50% was associated with a 32% risk reduction in the high ASCVD risk group and 23% in the low-to-moderate risk group[26].
According to GBD 2021 data, the contribution of low physical activity to China's CVD burden is substantial and growing[27]. In 2021, approximately 148,000 deaths and 3.255 million DALYs in China were attributable to low physical activity, roughly 3.0 and 2.6 times higher than in 1990, respectively. The burden for IHD is of particular concern, as its ASMR and DALY rates are still rising (EAPC of 1.12% and 0.80%, respectively), contrasting with declining trends for other CVD types. Although age-standardized stroke rates have declined, stroke has the largest absolute burden, with attributable DALYs exceeding 1.087 million in 2021. Absolute burden was slightly higher in females, but the increase was more pronounced in males. Model projections to 2035 suggest attributable deaths and DALYs from low physical activity will rise further to 161,000 and 3.523 million, indicating that declining physical activity has become a critical risk factor in China's CVD prevention efforts.
Multiple prospective cohort studies confirm that both physical activity and sedentary behavior are closely associated with CVD and mortality risk in the Chinese population. The China Kadoorie Biobank (CKB) study showed that compared with the lowest physical activity group (≤ 9.4 MET-h/d), those with the highest activity (≥ 33.8 MET-h/d) had 31%, 32%, and 56% lower risks of all-cause death, CVD death, and diabetes death, respectively. Occupational and nonoccupational activity, at both low and moderate-to-vigorous intensities, was associated with lower all-cause mortality[28]. The Prospective Urban Rural Epidemiology Study in China (PURE-China study), a prospective cohort of 43,256 participants from 115 urban and rural communities across 12 provinces, autonomous regions, and municipalities followed for a median of 11.9 years, recorded 3,408 major cardiovascular events (including MI, stroke, heart failure, and CVD death)[29]. The study showed that prolonged daily sitting time was associated with increased risk of major cardiovascular events in both manual and non-manual workers, with a stronger association in non-manual workers. Compared with sitting < 4 h/day, sitting 6–8 h/day and > 8 h/day were associated with 20% and 43% higher risks of major cardiovascular events in manual workers, respectively; in non-manual workers, sitting > 8 h/day was associated with an 86% higher risk.
-
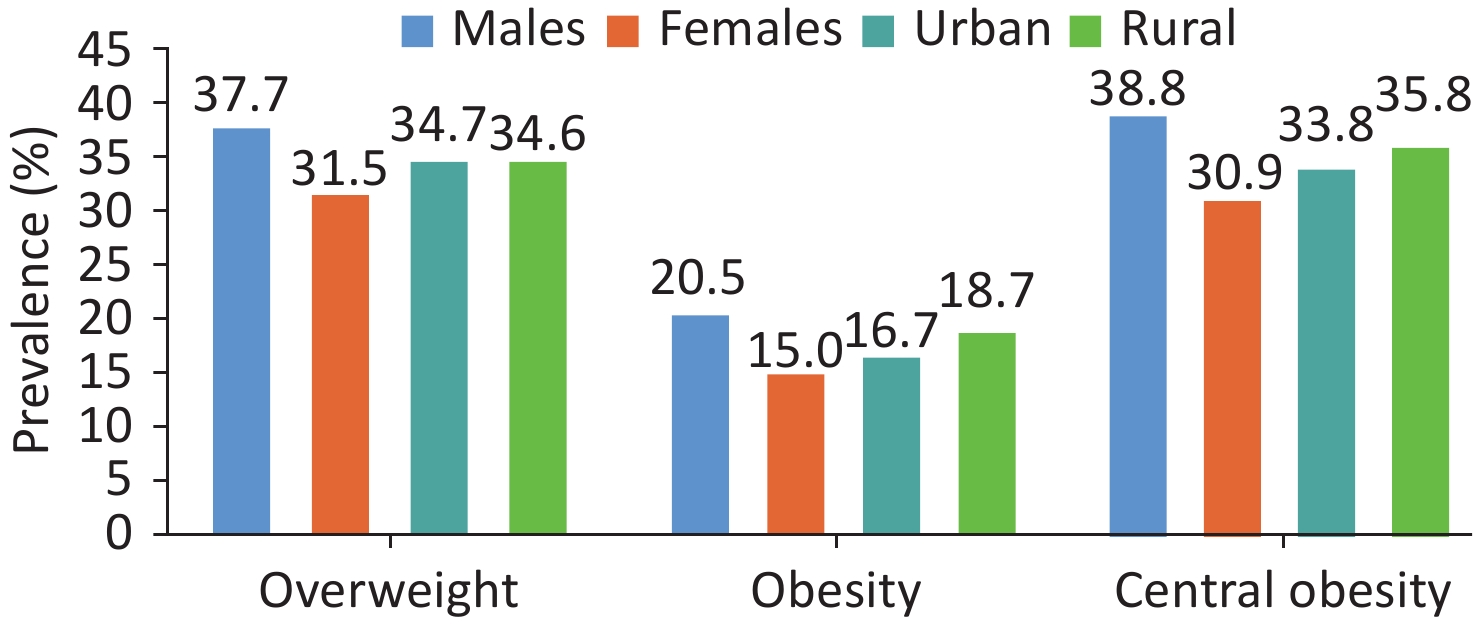
Data from the 2020–2022 China Cardiovascular Disease and Risk Factor Surveillance Project, involving 2,293,022 individuals across 262 sites in 31 provinces, autonomous regions, and municipalities, showed that the prevalence of overweight, obesity, and central obesity among adults aged ≥18 years was 34.6%, 17.8%, and 34.9%, respectively. The prevalence of overweight, obesity, and central obesity was higher in males than in females, and the prevalence of obesity and central obesity was higher in rural residents than in urban residents (Figure 9). The prevalence of overweight, obesity, and central obesity initially increased with age and then declined.
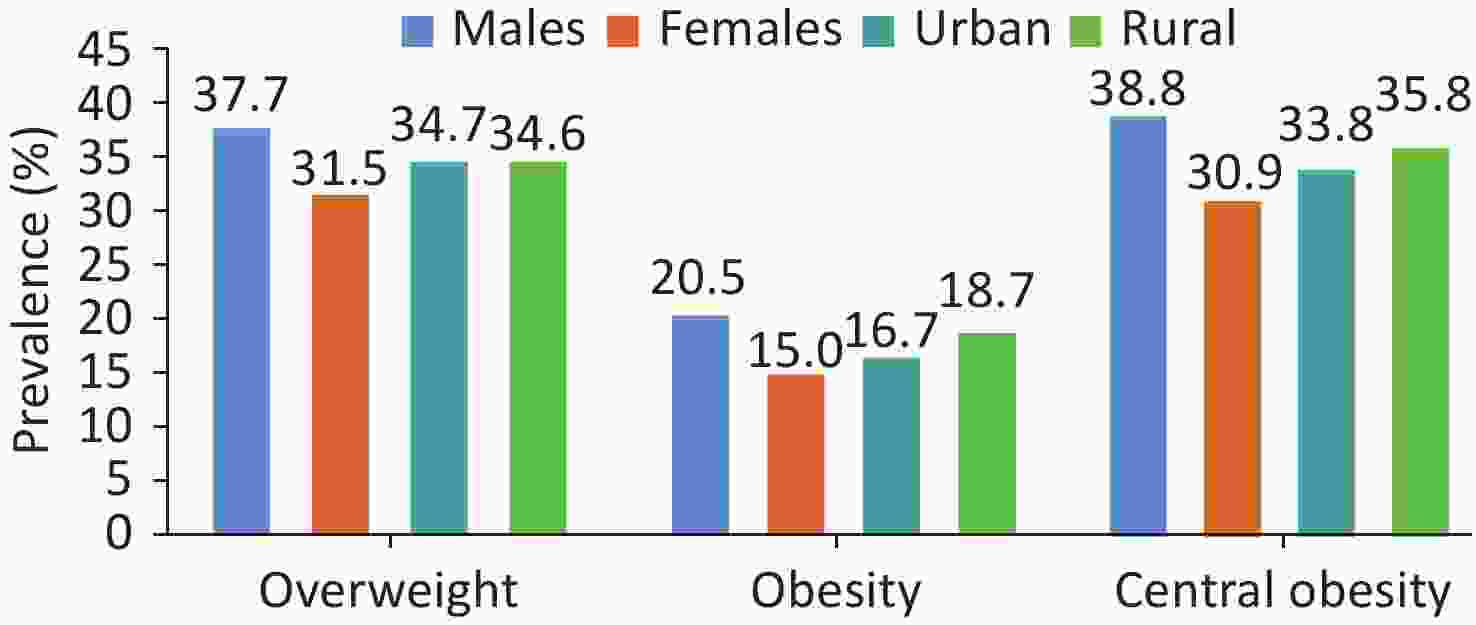
Figure 9. Prevalence rates of overweight, obesity, and central obesity among residents of sexes and regions in China from 2020 to 2022. Overweight and obesity were assessed using China's diagnostic criteria (overweight: 24 kg/m2 ≤ BMI < 28 kg/m2; obesity: BMI ≥ 28 kg/m2; central obesity: waist circumference > 90 cm in males and > 85 cm in females). BMI, body mass index.
Data from the CHNS (2000–2018) and the 2022–2023 China Development and Nutrition Health Impact Cohort across 10 provinces showed that in 2022–2023, the prevalence of overweight, obesity, pre-central obesity, and central obesity among adults was 38.5%, 17.1%, 19.5%, and 46.9%, respectively. Compared with 2000, these rates increased by 12.8%, 10.2%, 4.7%, and 23.7%, respectively, and obesity prevalence increased 1.5-fold overall and nearly 3-fold in adults aged 18–44. The urban-rural gap in the prevalence of overweight/obesity and central obesity is narrowing[30].
Data from the China 0–18 Year Old Child Nutrition and Health Systematic Survey and Application Project, analyzing 105,000 children and adolescents, showed that in 2020, the prevalence of overweight/obesity among children aged 0–5 years was 7.8% (overweight 5.7%, obesity 2.1%), with higher rates in rural than urban areas (overweight: 6.4% vs. 5.0%; obesity: 2.6% vs. 1.6%) and in boys than girls (overweight: 6.1% vs. 5.3%; obesity: 2.6% vs. 1.6%). For children and adolescents aged 6–17 years, the prevalence of overweight/obesity was 26.5% (overweight 14.5%, obesity 12.0%), higher in urban than rural areas (overweight: 15.3% vs. 13.7%; obesity: 13.4% vs. 10.7%) and in boys than girls (overweight: 16.1% vs. 12.9%; obesity: 15.1% vs. 8.8%)[13].
Data from seven rounds of the Chinese National Student Physical Fitness and Health Survey (1985–2019) showed that in 2019, the prevalence of overweight/obesity among children and adolescents aged 7–18 years was 23.4% (overweight 13.9%, obesity 9.6%), an 18.1-fold increase from 1985. The overweight/obesity detection rate increased by 22.3-fold, 11.7-fold, 54.2-fold, and 10.1-fold for urban boys, urban girls, rural boys, and rural girls, respectively, compared with 1985, with the fastest growth observed in rural boys[31].
Overweight and obesity significantly increase the CVD burden. GBD 2023 data show that in 2023, high body mass index (BMI) accounted for 243,900 CVD deaths in China, with a corresponding CVD ASMR of 17.05 per 100,000, meaning 5.4% of CVD deaths were attributable to high BMI[32]. Overweight and obesity also impose a heavy economic burden. A study on the health and economic impact of overweight/obesity in Chinese children and adolescents estimated that without intervention, the cumulative DALYs from 2025 to 2092 would reach 3.3 billion, resulting in an economic loss of 218 trillion RMB (31.6 trillion USD), with an average lifetime cost of approximately 2.5 million RMB (350,000 USD) per affected child or adolescent[33].
-
Smoking, an unhealthy diet, physical inactivity, and overweight/obesity are four upstream factors that have broad and substantial effects on the CVD morbidity and mortality burden in China. Their common characteristics include "pervasiveness": exposure to at least one risk factor affects more than half of the adult population, far from a problem confined to high-risk groups. The shift toward younger ages is particularly concerning, with childhood obesity prevalence surging, adolescent physical activity rates declining significantly, and obesity among young adults increasing threefold, pointing to a generational amplification of future CVD risk. An "urban-rural convergence" is also evident: rural smoking rates now exceed urban, rural obesity is growing fastest, and the urban-rural gap in overweight prevalence is narrowing, indicating a rapid spread of CVD risk factors from urban to rural areas. These four factors are upstream, modifiable behavioral and metabolic risks whose improvement is indispensable for fundamentally reducing CVD incidence. The current decline in ASMR is mainly attributable to advances in medical treatment, but this achievement is being progressively offset by the widespread prevalence of risk factors and systemic challenges such as population aging. Clinical care alone cannot curb the sustained growth of the CVD burden; upstream behavioral interventions and population-wide health promotion are imperative.
-
Sampling surveys on hypertension prevalence from 1958 to 2022 show an overall upward trend nationwide (Table 3).
Research title Survey year Age (years) Sampling method Sample size Prevalence (%) Key Project of the Chinese Academy of Medical Sciences–Hypertension Research* 1958–1959 ≥ 15 Non-random sampling 739,204 5.1 National Hypertension Sampling Survey△ 1979–1980 ≥ 15 Random sampling 4,012,128 7.7 National Hypertension Sampling Survey▲ 1991 ≥ 15 Stratified random sampling 950,356 13.6 Survey on Nutrition and Chronic Disease Status of Chinese Residents▲ 2012 ≥ 18 Multi-stage stratified random sampling - 25.2 China Hypertension Survey▲ 2012–2015 ≥ 18 Multi-stage stratified random sampling 451,755 27.9 ( weighted rate 23.2) China Health and Nutrition Survey▲ 2015 20–79 Multi-stage, hierarchical cluster random sampling 8,907 34.1 ( Age-standardized rate▼ 25.6) China Chronic Diseases and Risk Factors Monitoring▲ 2018 ≥ 18 Multi-stage, hierarchical cluster random sampling 179,873 27.5 ( weighted rate ) Monitoring of Cardiovascular Diseases and Their Risk Factors among Chinese Residents▲ 2020–2022 ≥ 18 Multi-stage, hierarchical cluster random sampling 298,438 31.6 ( weighted rate ) Note. *: Diagnostic criteria for hypertension: diastolic blood pressure (DBP) > 90 mmHg, and/or systolic blood pressure (SBP) > 140 mmHg for individuals under 39 years old. For those aged 40 and above, the SBP threshold rises by 10 mmHg for every additional 10 years of age. △: Diagnostic criteria for hypertension: SBP ≥ 141 mmHg and/or DBP ≥ 91 mmHg; medication use within the preceding two weeks was not taken into account. ▲: Diagnostic criteria for hypertension: SBP ≥ 140 mmHg and/or DBP ≥ 90 mmHg, or antihypertensive medication taken within the past two weeks. ▼: The standard population adopts the age distribution of the WHO Standard Population. 1 mmHg = 0.133 kPa. -: No specific data available. Table 3. National hypertension prevalence survey results from 1958 to 2022
The 2019 National Student Physical Fitness and Health Survey, covering 190,000 Han children and adolescents aged 7–17 years, showed a hypertension prevalence of 13.0%, higher in girls than boys (13.2% vs. 12.7%), higher in rural than urban areas (14.1% vs. 11.9%), and generally increasing with age (P < 0.001)[34]. Cross-sectional CHNS data from 1991 to 2015 showed the age-standardized prevalence of hypertension among children and adolescents aged 7–17 years increased from 5.7% to 12.8%[35].
From 1993 to 1997, the age-standardized incidence rate of hypertension in China increased from 40.8 per 1,000 person-years to 48.6 per 1,000 person-years, based on the CHNS prospective cohort of 12,952 adults aged ≥ 18 years.
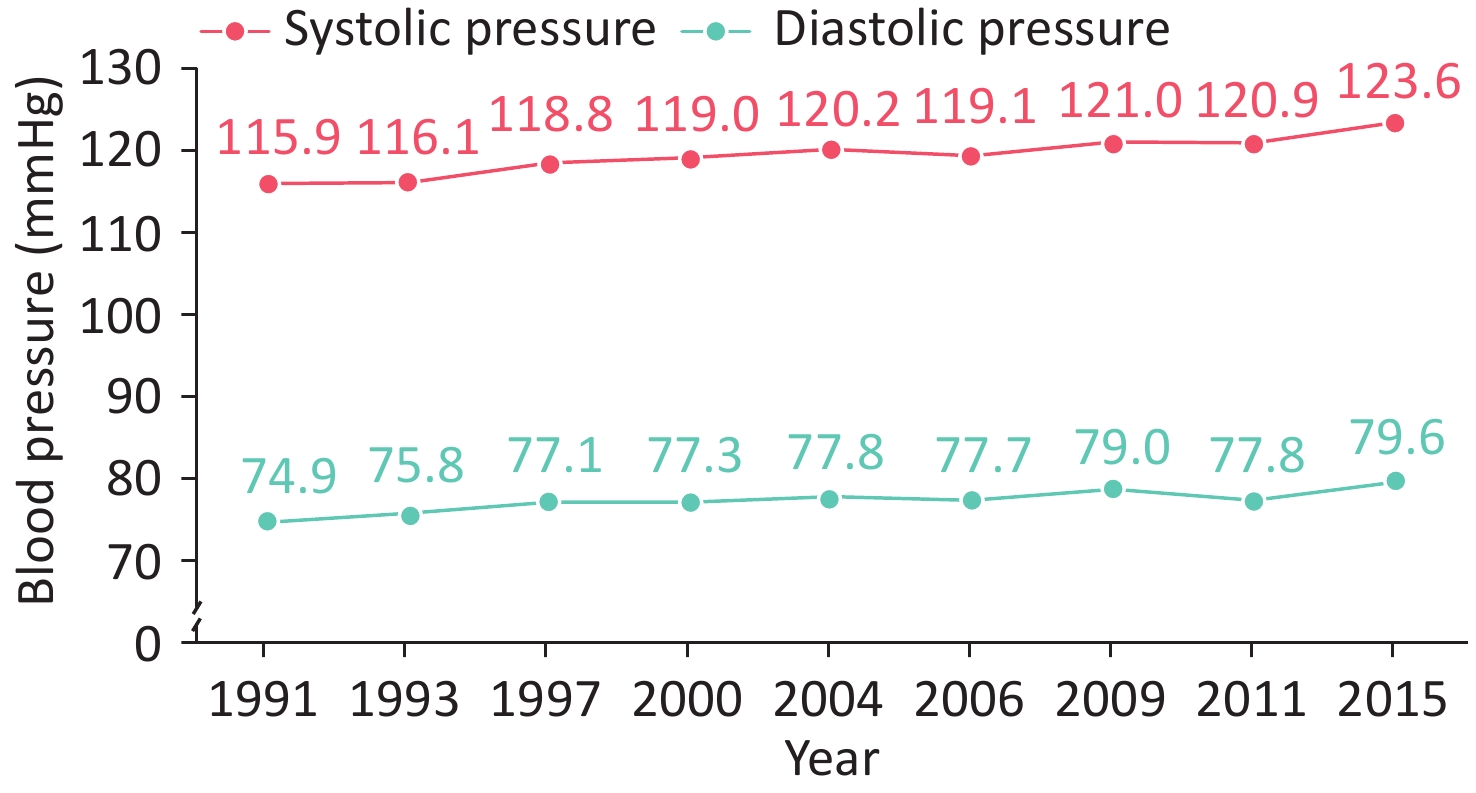
From 1991 to 2015, mean systolic and diastolic blood pressure levels in adults and across different age and sex groups showed upward trends (Figure 10)[36].
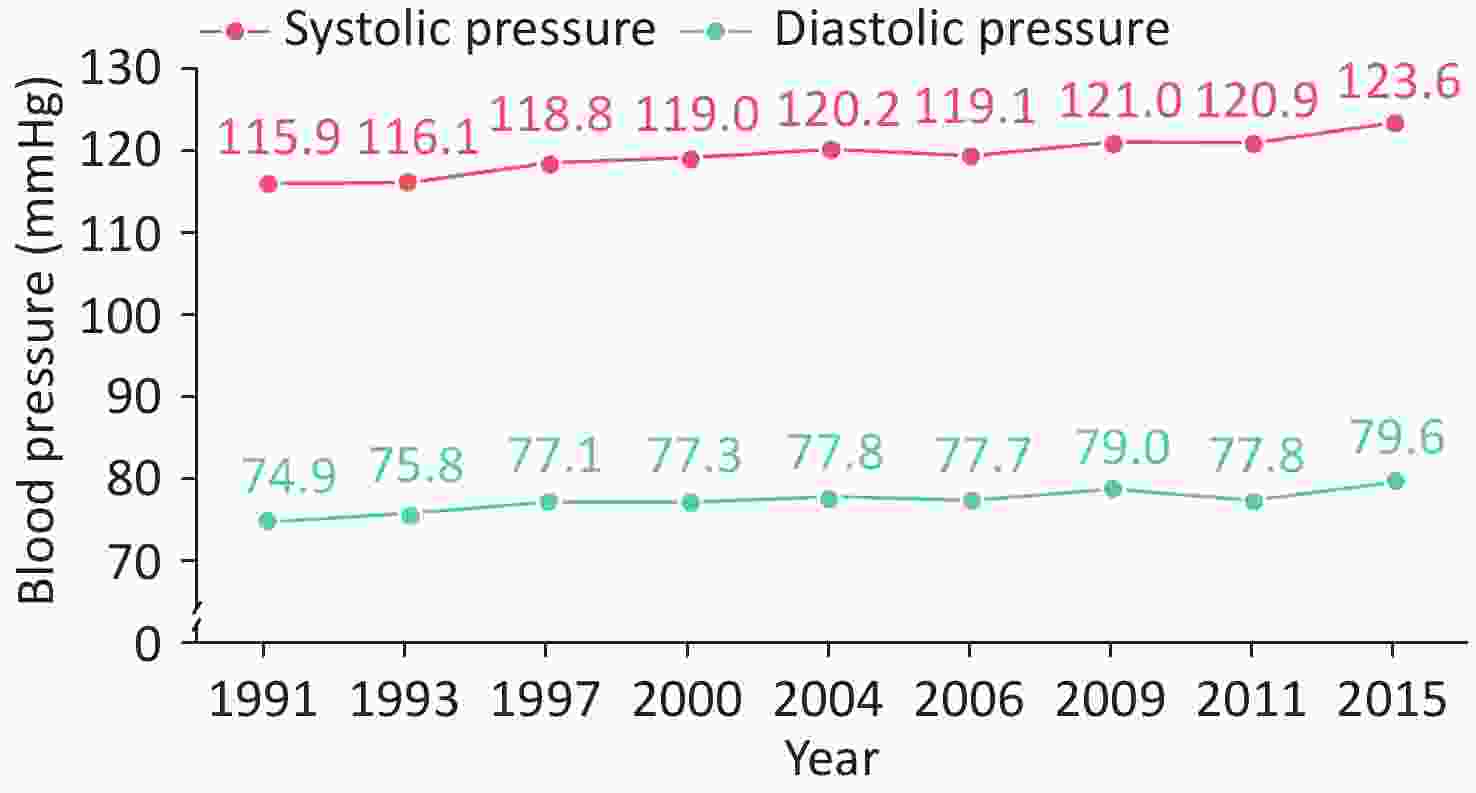
Figure 10. Trends in age-standardized blood pressure levels in Chinese adults from 1991 to 2015. The standard population for age-standardization was derived from the data of the Sixth National Population Census conducted in 2010. 1 mmHg = 0.133 kPa.
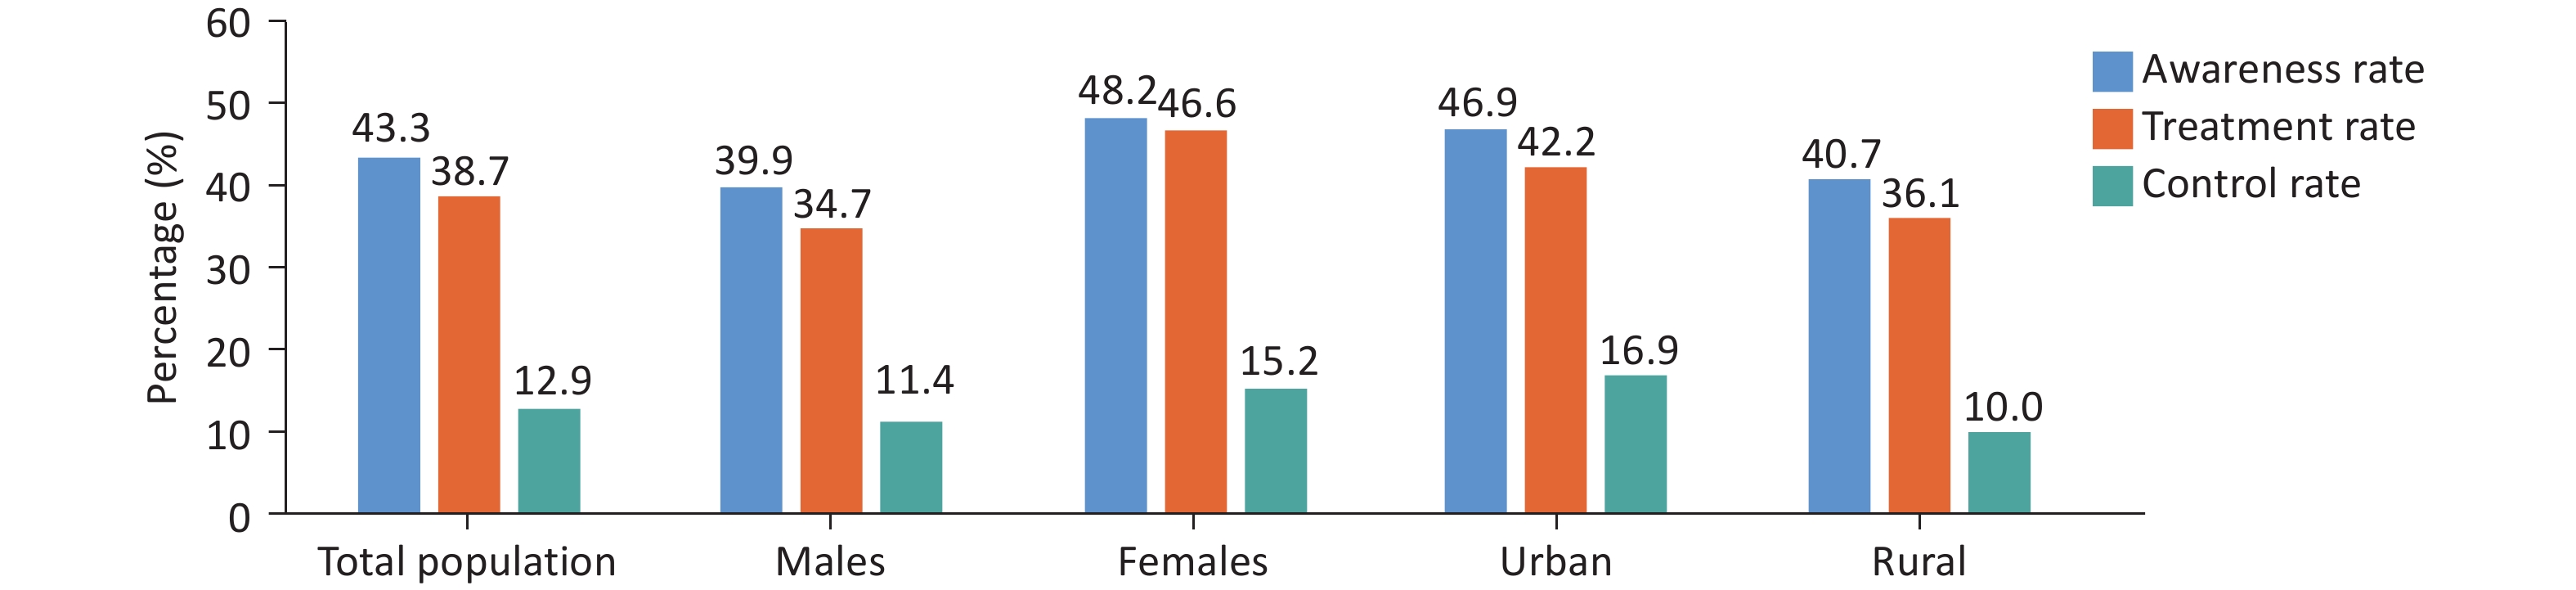
Nationwide surveys have consistently shown improvements in hypertension awareness, treatment, and control rates in China (Table 4). Data from six rounds of the China Chronic Disease and Risk Factor Surveillance (CCDRFS) between 2004 and 2018 showed upward trends in these rates among adults aged 18–69 years. The 2020–2022 CVD and Risk Factor Surveillance Project across 262 sites in 31 provinces, autonomous regions, and municipalities, showed that the awareness, treatment, and control rates of hypertension among residents aged ≥ 18 years were 43.3%, 38.7%, and 12.9%, respectively (Figure 11)[37].
Research title Survey year Age (years) Sampling method Sample size Awareness rate (%) Treatment rate (%) Control rate (%) National Hypertension Sampling Survey 1991 ≥ 15 Stratified random sampling 950,356 27.0 12.0 3.0 Monitoring of Nutrition and Health Status among Chinese Residents 2010–2012
≥ 18 Multi-stage, stratified cluster random sampling 120,428 46.5 41.1 13.8 Survey of Hypertension Prevalence, Awareness, Treatment, and Control among China's Working Population* 2012–2013 18–60
Multi-stage cluster sampling 37,856 57.6 (standardized rate 47.8) 30.5 (standardized rate 20.6) 11.2 (standardized rate 8.5) China Hypertension Survey 2012–2015 ≥ 18 Multi-stage stratified random sampling 451,755 51.6 (weighted rate 46.9) 45.8 (weighted rate 40.7) 16.8 (weighted rate 15.3) ChinaHEART* 2014 35–75 Convenience sampling 640,539 46.5 (standardized rate) 38.1 (standardized rate) 11.1 (standardized rate) China Health and Nutrition Survey△ 2015 20–79 Multi-stage, hierarchical cluster random sampling 8,907 43.8 (standardized rate 27.2) 39.2 (standardized rate 23.6) 13.8 (standardized rate 8.4) China Chronic Diseases and Risk Factor Surveillance 2018 ≥ 18 Multi-stage, hierarchical cluster random sampling 179,873 41.0 (weighted rate) 34.9 (weighted rate) 11.0 (weighted rate) Monitoring of Cardiovascular Diseases and Their Risk Factors among China Residents 2020–2022 ≥ 18 Multi-stage, hierarchical cluster random sampling 298,438 43.3 (weighted rate) 38.7 (weighted rate) 12.9 (weighted rate) Note. China HEART: China Cardiovascular High-Risk Population Early Screening and Comprehensive Intervention Project. *: Age and gender standardized; the standard population uses data from the sixth national population census in 2010. △: Age standardized; the standard population uses data from the World Health Organization's standard population in 2011. Table 4. Awareness, treatment, and control rates for hypertension across studies
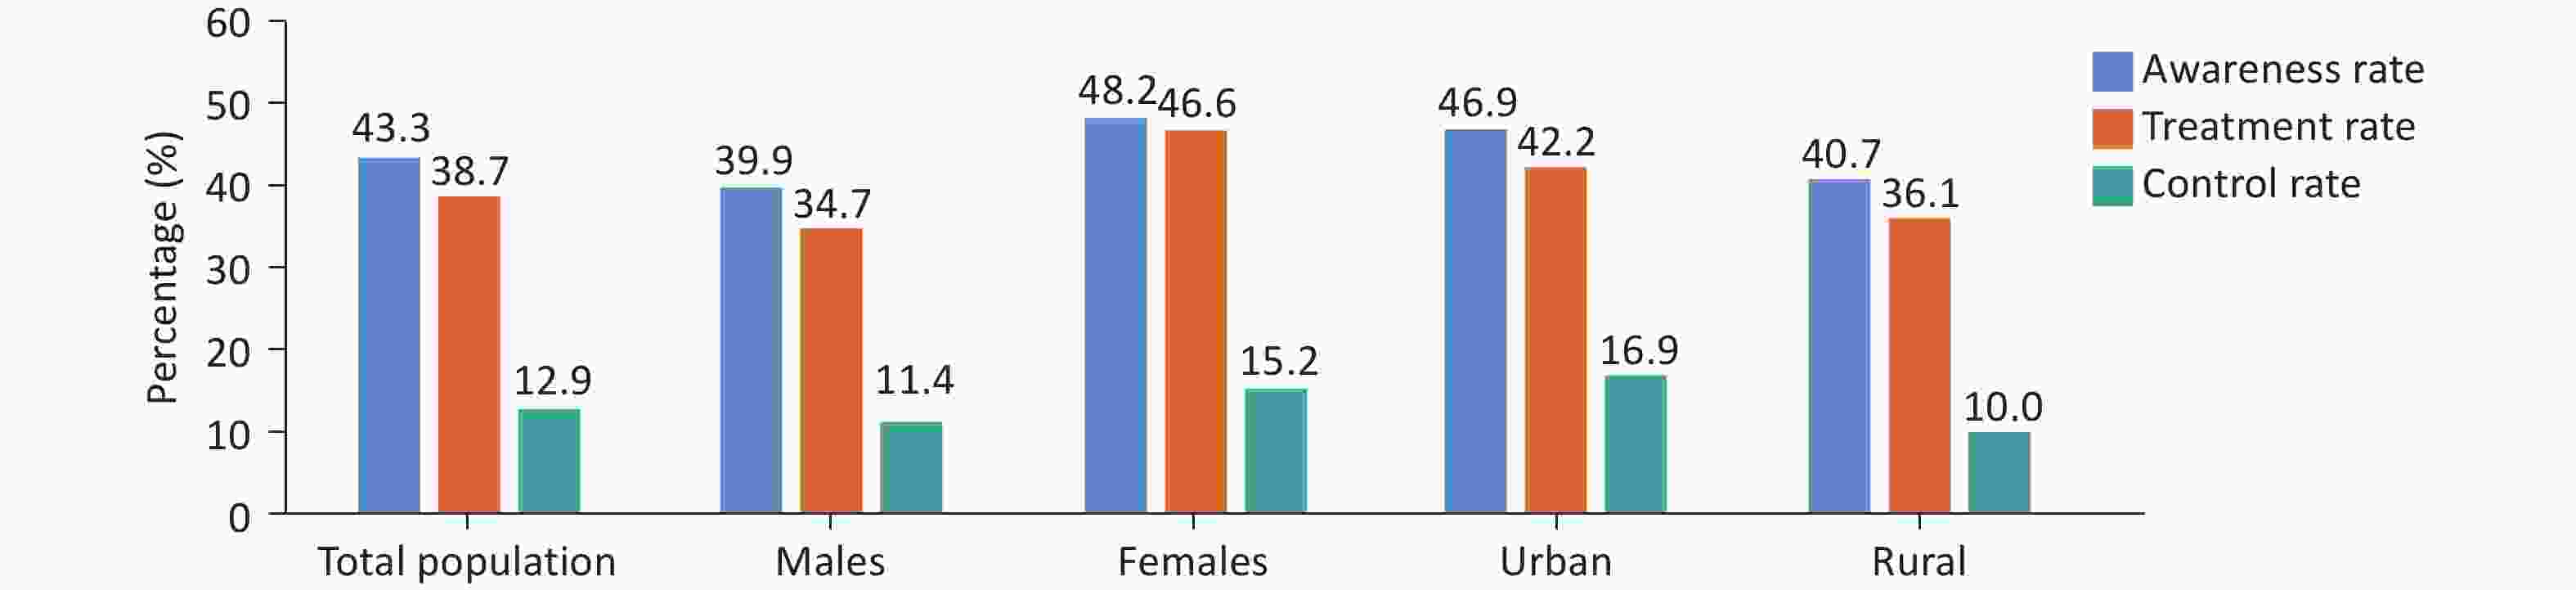
Figure 11. Awareness rate, treatment rate, and control rate of hypertension among residents aged ≥ 18 years in China from 2020 to 2022.
CHNS data showed that the age-standardized detection rate of prehypertension among adults aged ≥ 18 years increased from 30.1% in 1991 to 43.1% in 2015[38]. The China Hypertension Survey (CHS) (2012–2015) found a crude prehypertension detection rate of 39.1% (weighted: 41.3%) among adults ≥ 18 years, with an estimated 435 million people with prehypertension nationwide. Mean weighted systolic and diastolic blood pressure were 126.1 mmHg and 76.0 mmHg, respectively (1 mmHg = 0.133 kPa). Systolic pressure increased with age, while diastolic pressure initially rose then declined. Blood pressure was higher in males (128.0/77.8 mmHg) than females (124.2/74.2 mmHg), with no significant urban-rural difference (126.4/76.0 mmHg vs. 125.6/76.0 mmHg)[39]. Data from nine cross-sectional CHNS surveys from 1991 to 2015 showed increasing trends in systolic and diastolic blood pressure among children and adolescents aged 7–17 years, rising from 96.1 mmHg and 62.6 mmHg to 102.7 mmHg and 67.4 mmHg, respectively[35].
The China Basic Public Health Service Development Report (2025) showed that in 2024, the number of hypertensive patients receiving health management services reached 115 million, with a standardized management rate of 77% and a significant improvement in blood pressure control among managed patients. The incidence and mortality of hemorrhagic stroke, the complication most closely associated with hypertension, have declined by nearly 50% compared with 30 years ago[40].
-
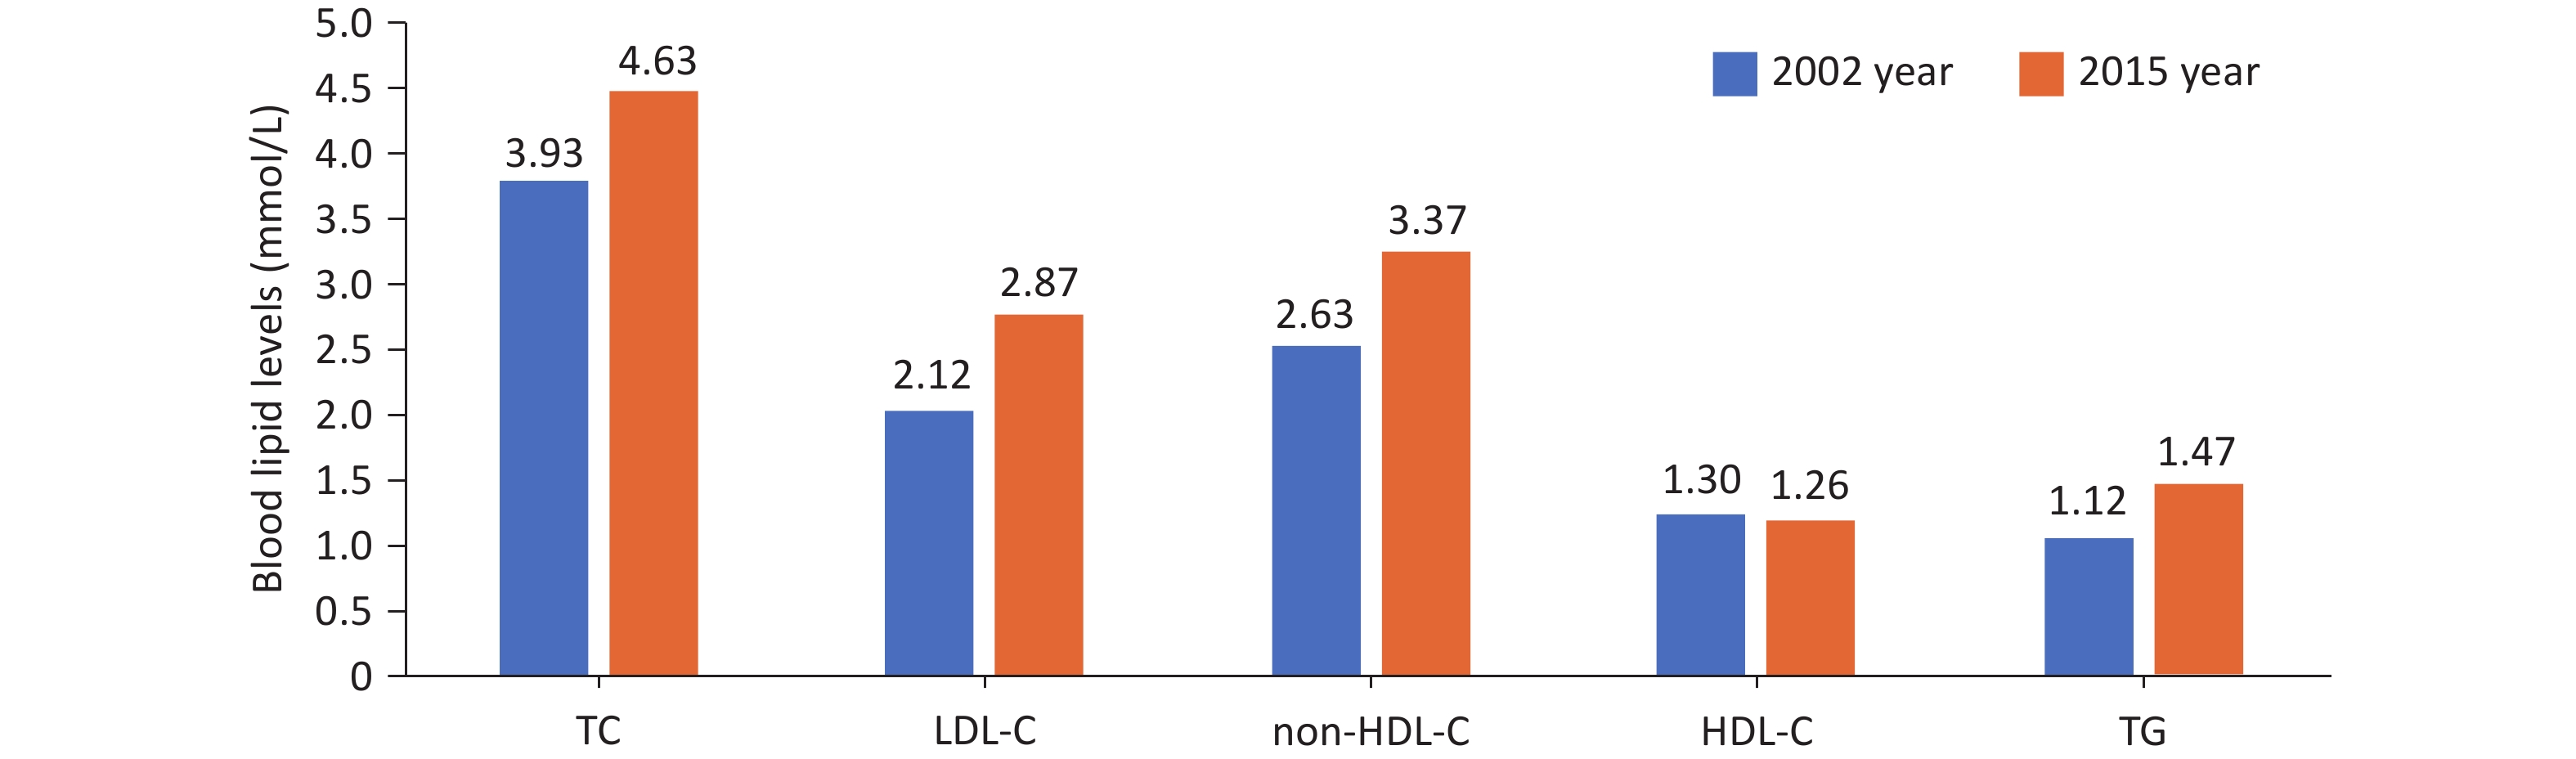
The 2015 China Adult Nutrition and Chronic Disease Surveillance (CANCDS) of 179,728 adults aged ≥18 years showed that the mean levels of total cholesterol (TC), low-density lipoprotein cholesterol (LDL-C), non-HDL-C, and triglycerides (TG) in Chinese residents had all increased compared with 2002[41] (Figure 12).
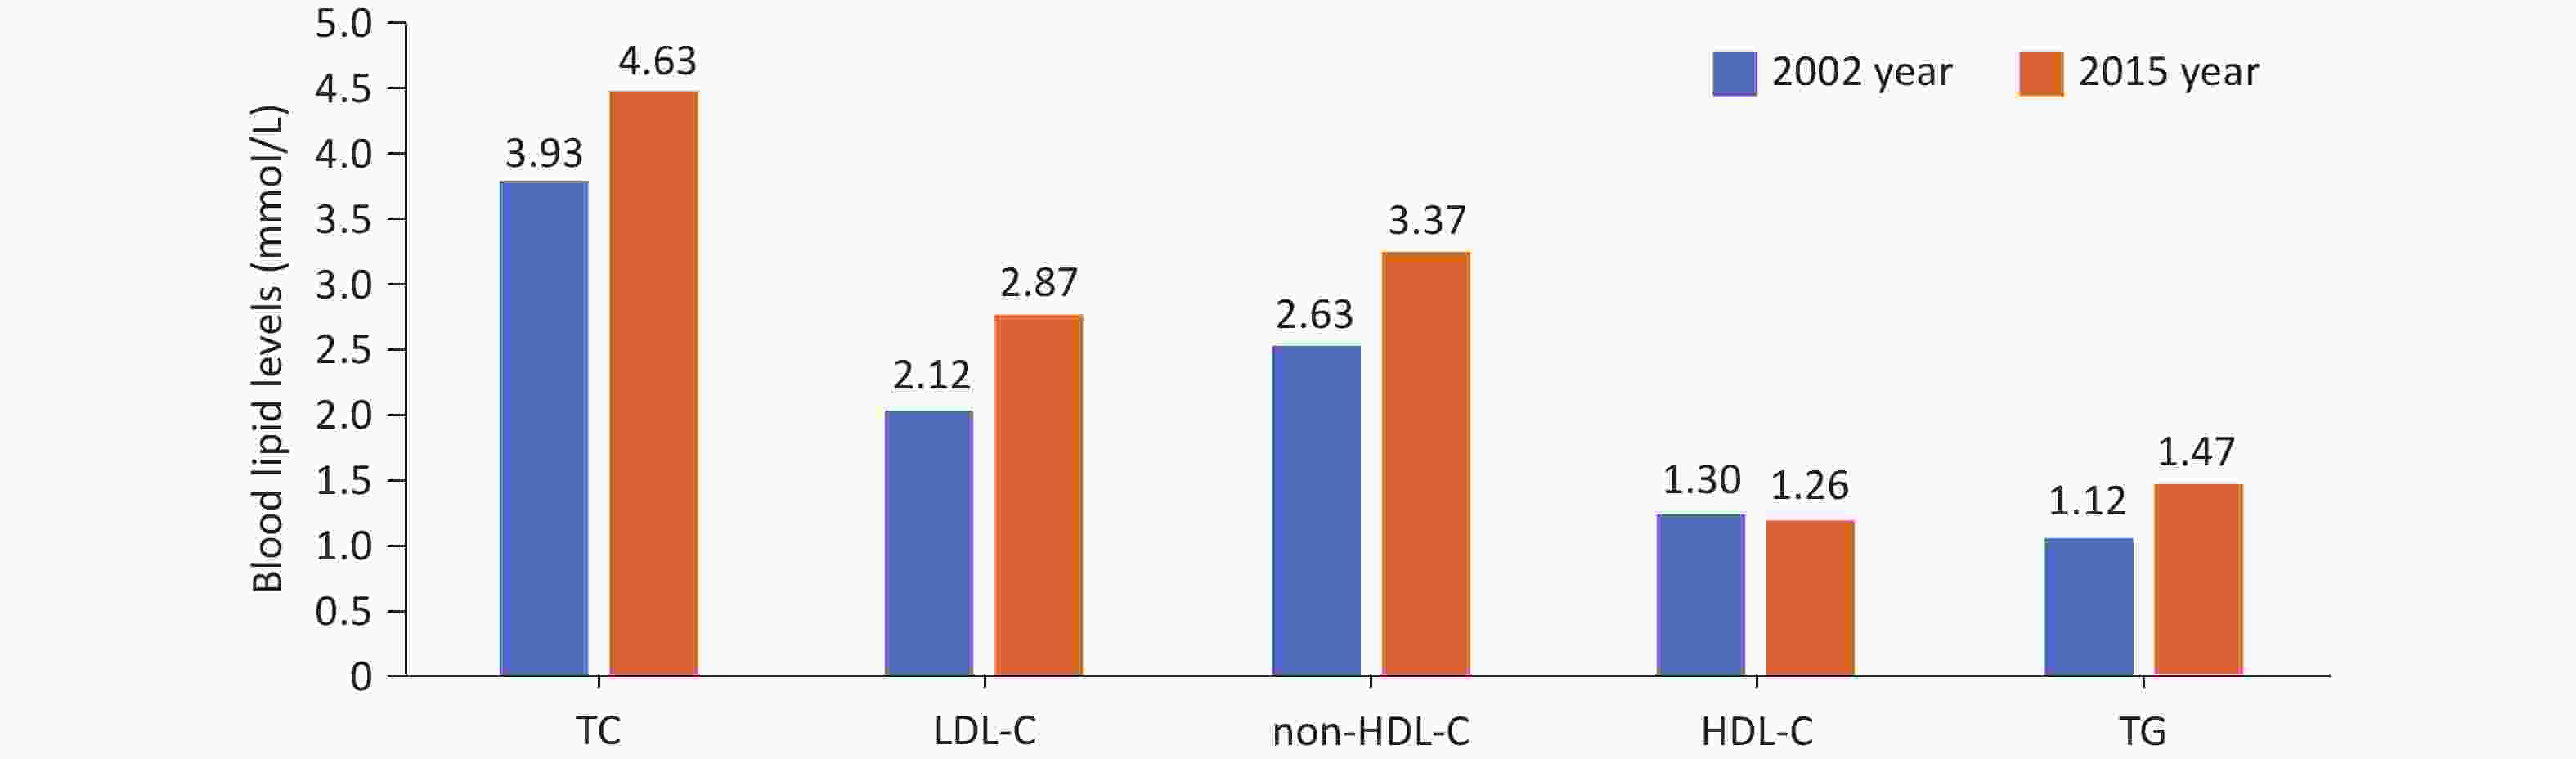
Figure 12. Comparison of blood lipid levels in adults aged ≥ 18 years in China between 2002 and 2015. TC: Total cholesterol; LDL-C: Low-density lipoprotein cholesterol; HDL-C: High-density lipoprotein cholesterol; TG: Triglycerides.
Global data from 1,127 population-based studies showed that East and Southeast Asian countries had the largest increase in mean non-HDL-C levels from 1980 to 2018, with an increase of 0.23 mmol/L per decade. China, which had one of the lowest non-HDL-C levels globally in 1980, had reached and surpassed levels in many high-income Western countries by 2018[42].
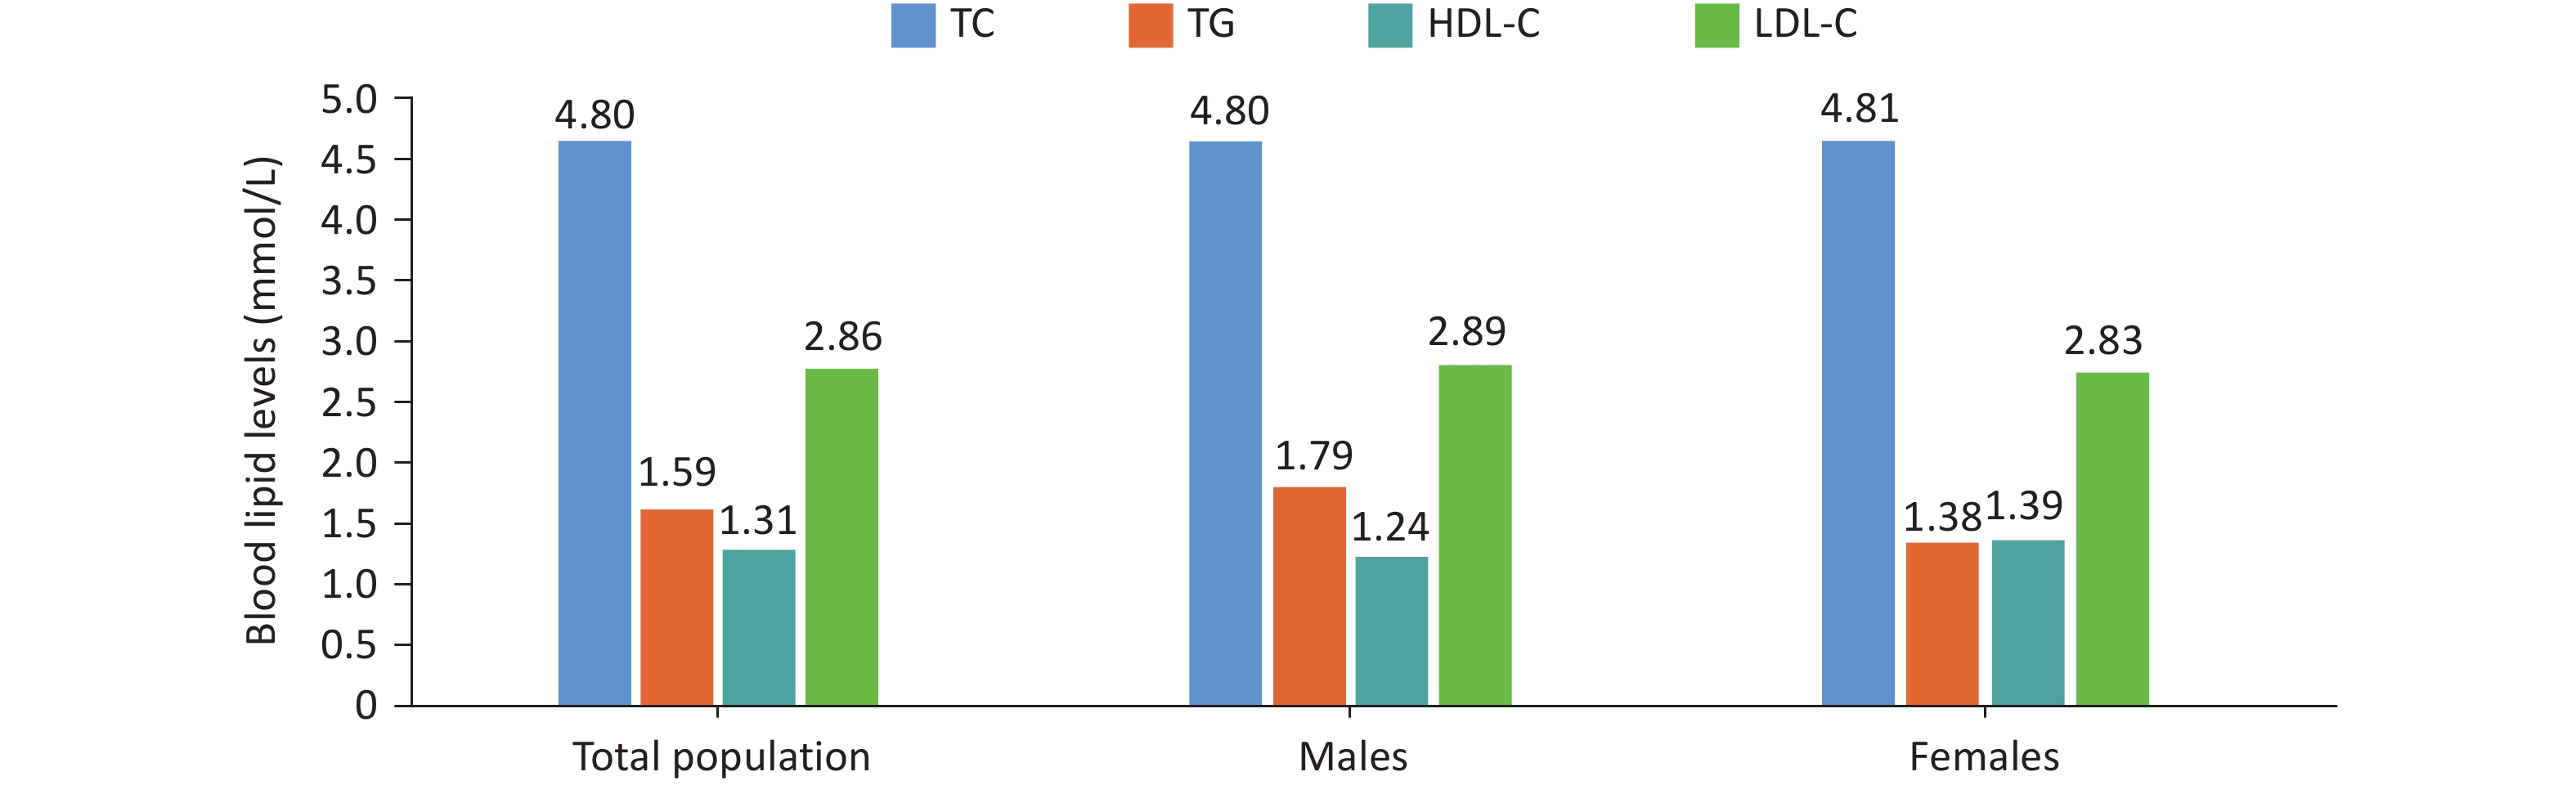
Preliminary analysis from the 2020–2022 CVD and Risk Factor Surveillance Project (275,961 individuals across 262 sites in 31 provinces, autonomous regions, and municipalities) showed mean levels of TC, TG, HDL-C, and LDL-C among residents aged ≥ 18 years were 4.80, 1.59, 1.31, and 2.86 mmol/L, respectively (Figure 13).
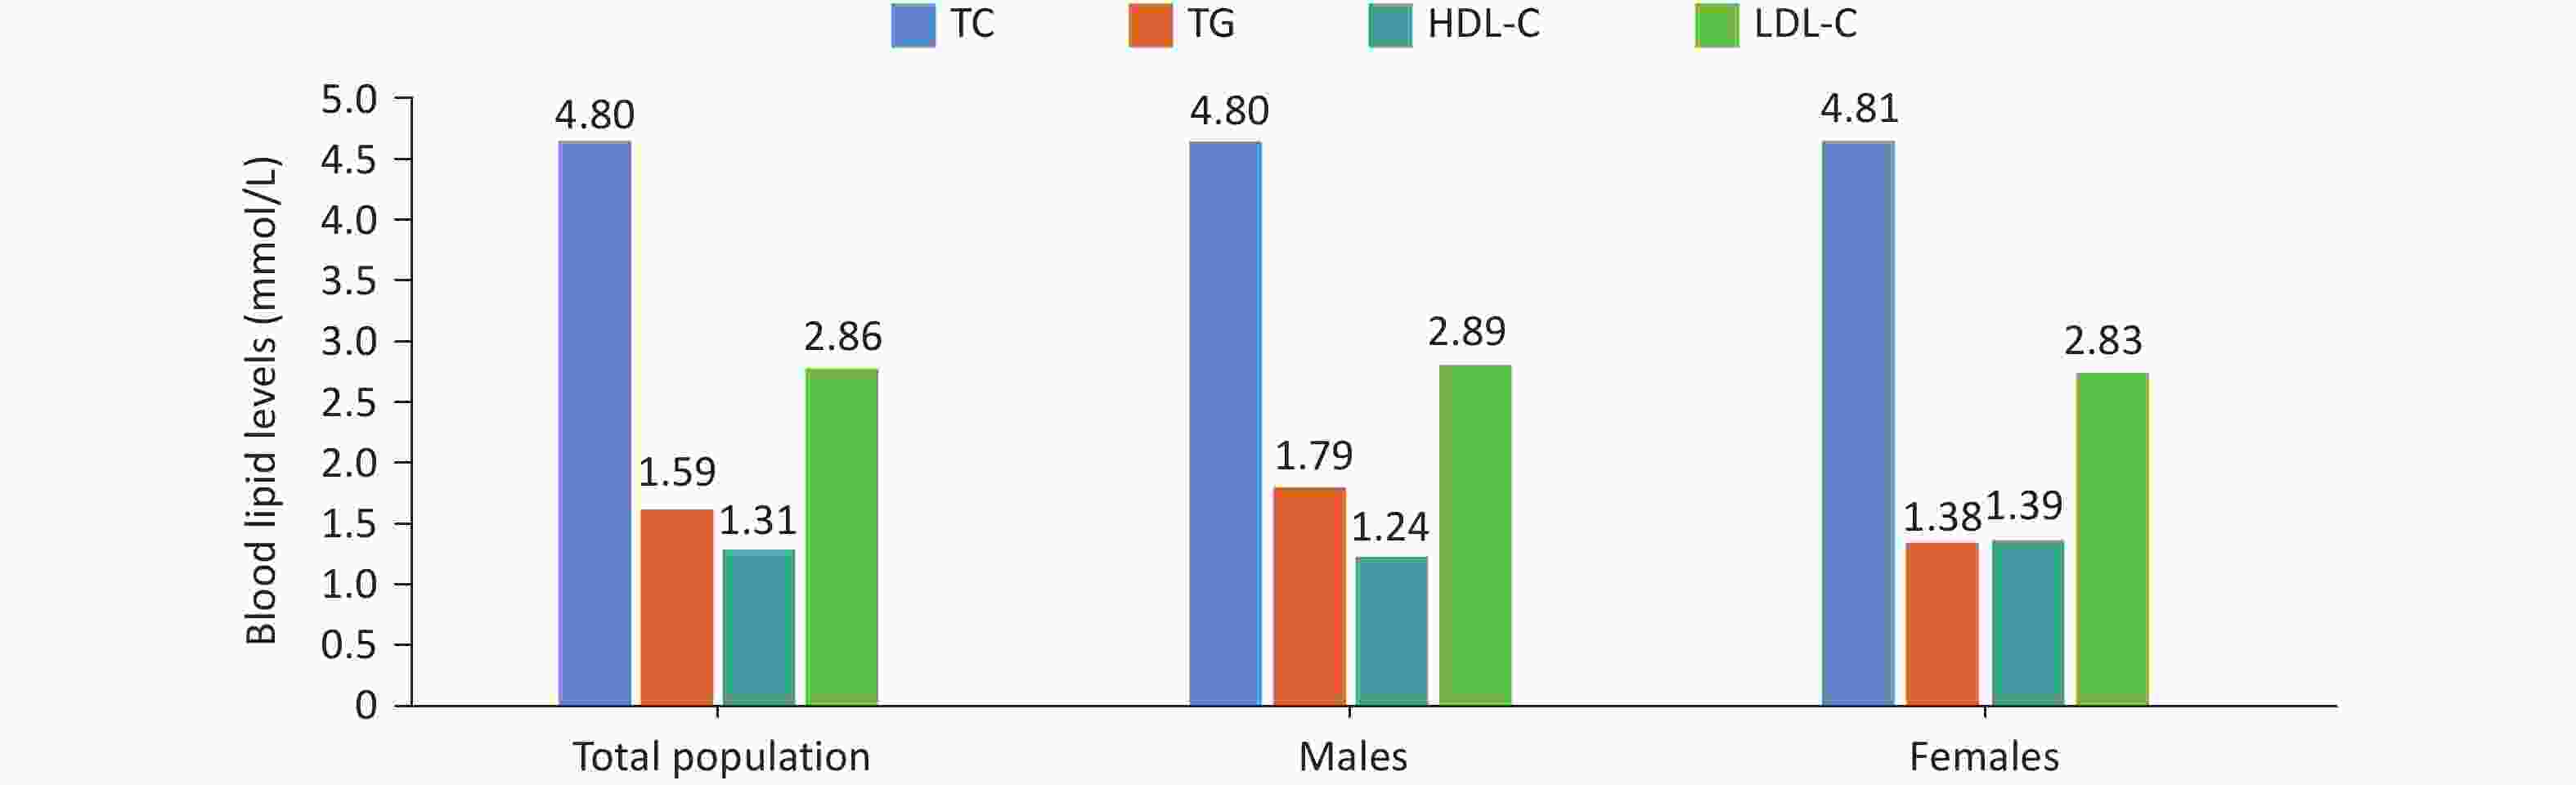
Figure 13. Blood lipid levels in adults aged ≥ 18 years in China from 2020 to 2022. TC: Total cholesterol; LDL-C: Low-density lipoprotein cholesterol; HDL-C: High-density lipoprotein cholesterol; TG: Triglycerides.
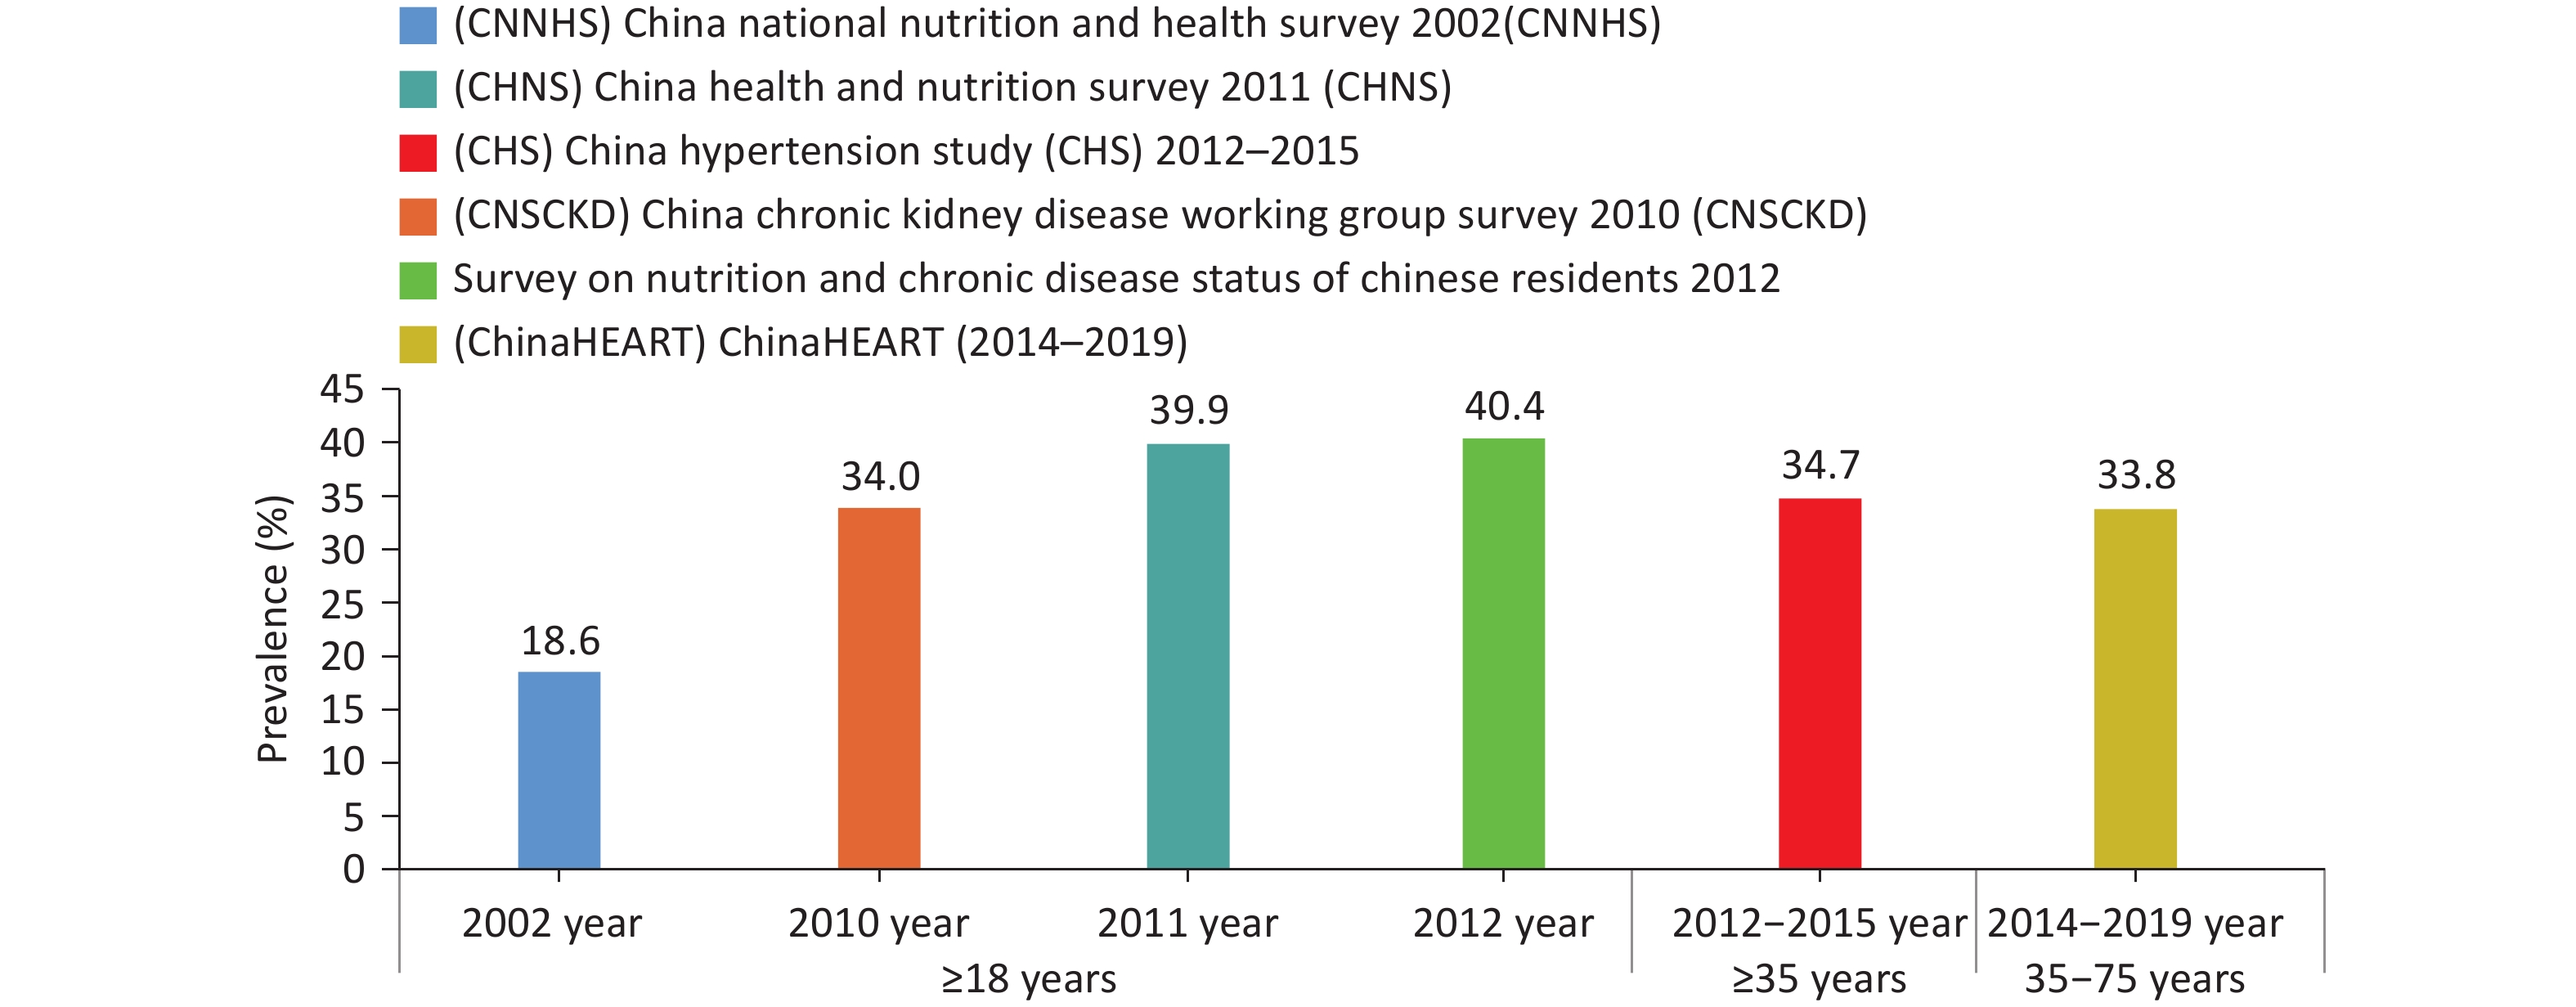
Dyslipidemia was defined as the presence of any type of dyslipidemia (TC ≥ 6.22 mmol/L, LDL-C ≥ 4.14 mmol/L, HDL-C < 1.04 mmol/L, or TG ≥ 2.26 mmol/L) or current use of lipid-lowering medication. The 2002 China National Nutrition and Health Survey (CNNHS)[43], the 2010 China Chronic Kidney Disease Working Group Survey (CNSCKD)[44], the 2011 CHNS[45], and the 2012 China National Nutrition and Chronic Disease Status Survey[46] all demonstrated a significant increase in the prevalence of dyslipidemia among Chinese adults aged ≥ 18 years. The survey results from the CHS[47] (2012–2015) and the ChinaHEART[48] (2014–2019), which focused on adults aged ≥ 35 years, showed similar trends in dyslipidemia prevalence (Figure 14).
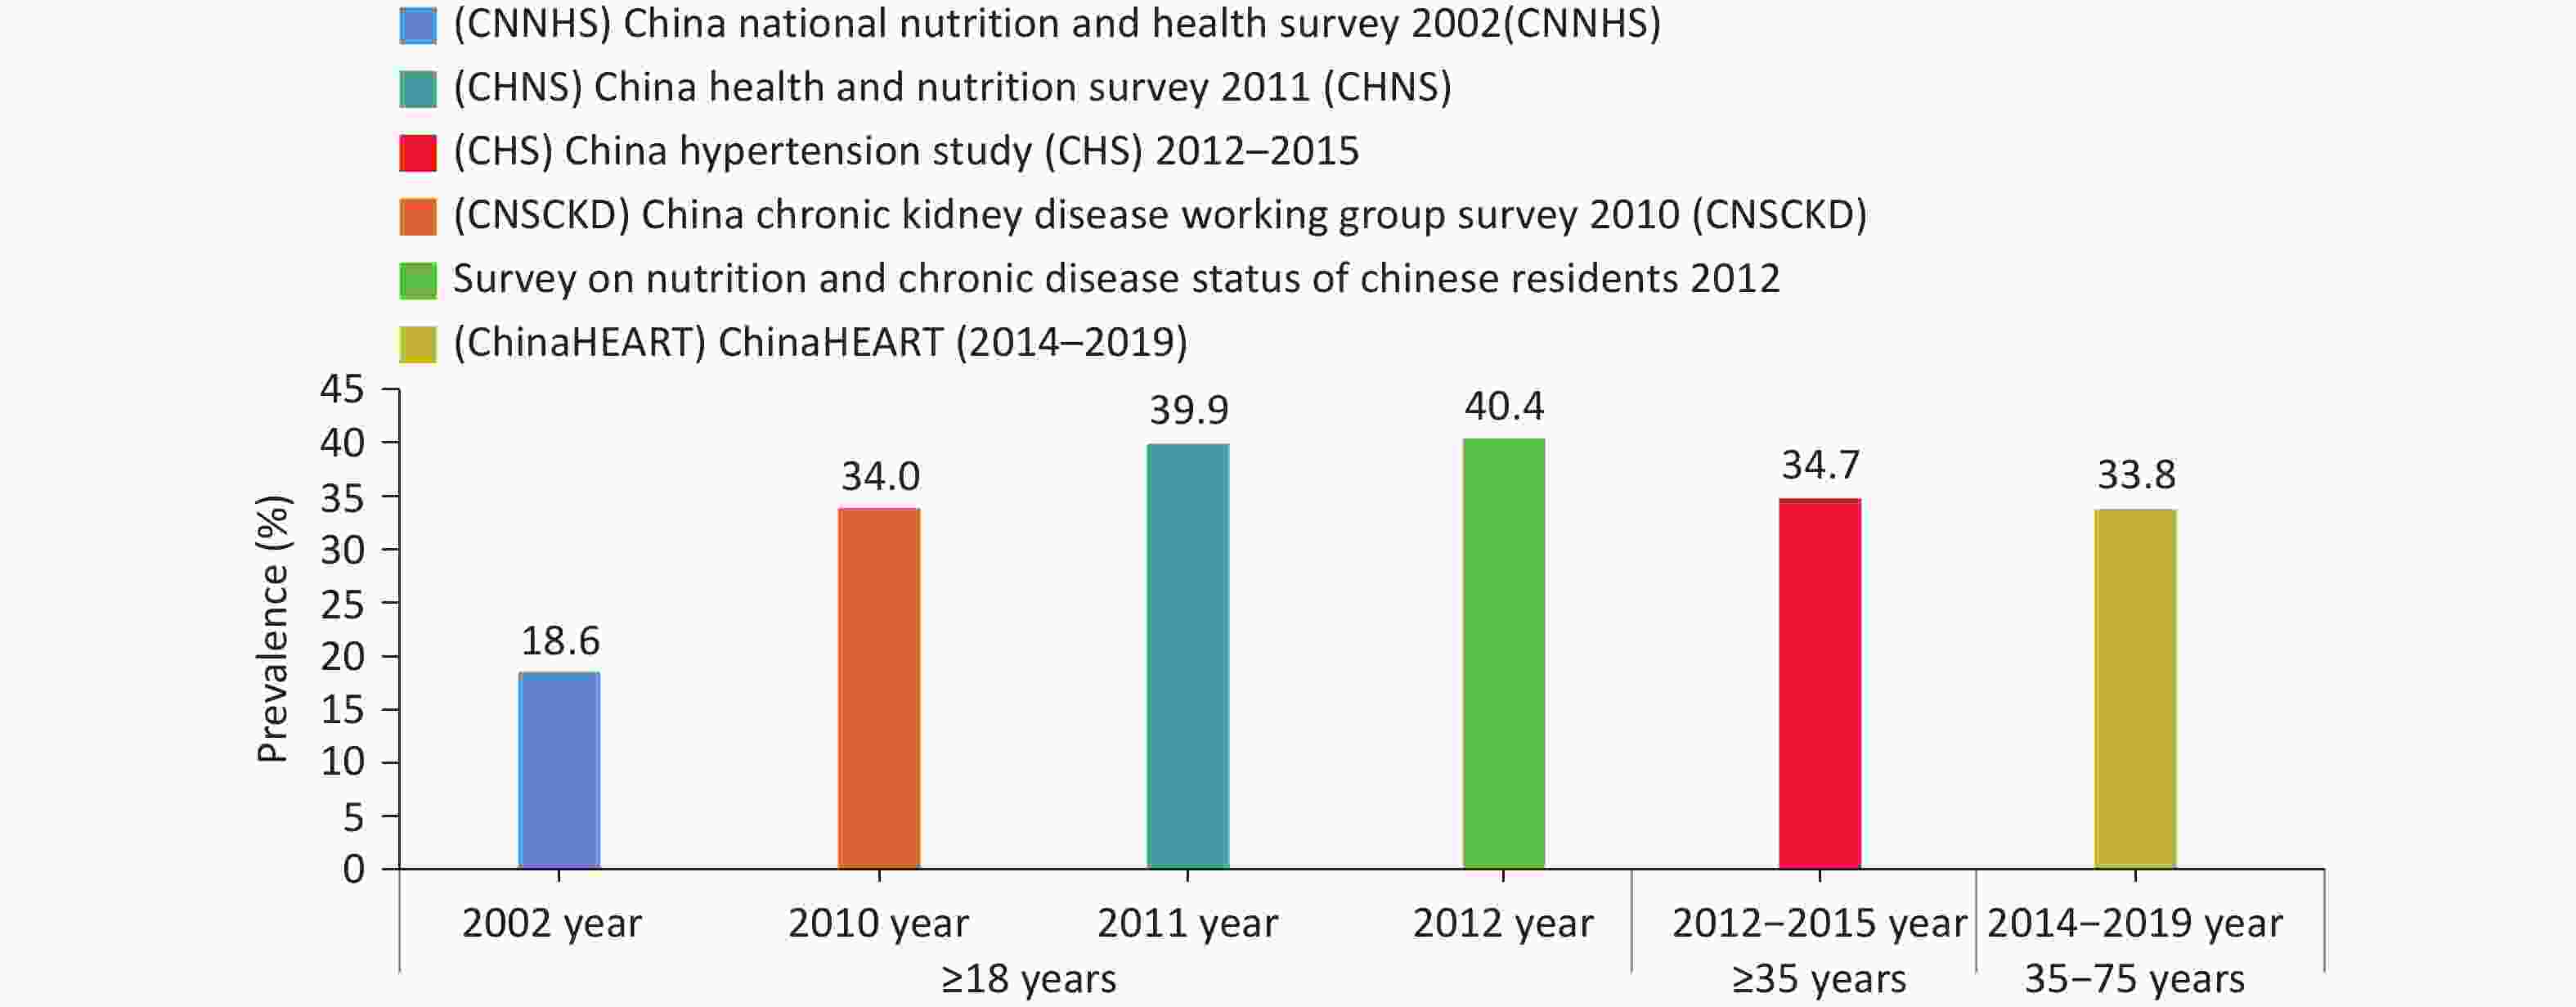
Figure 14. Prevalence of dyslipidemia among adults in China from 2002 to 2019.
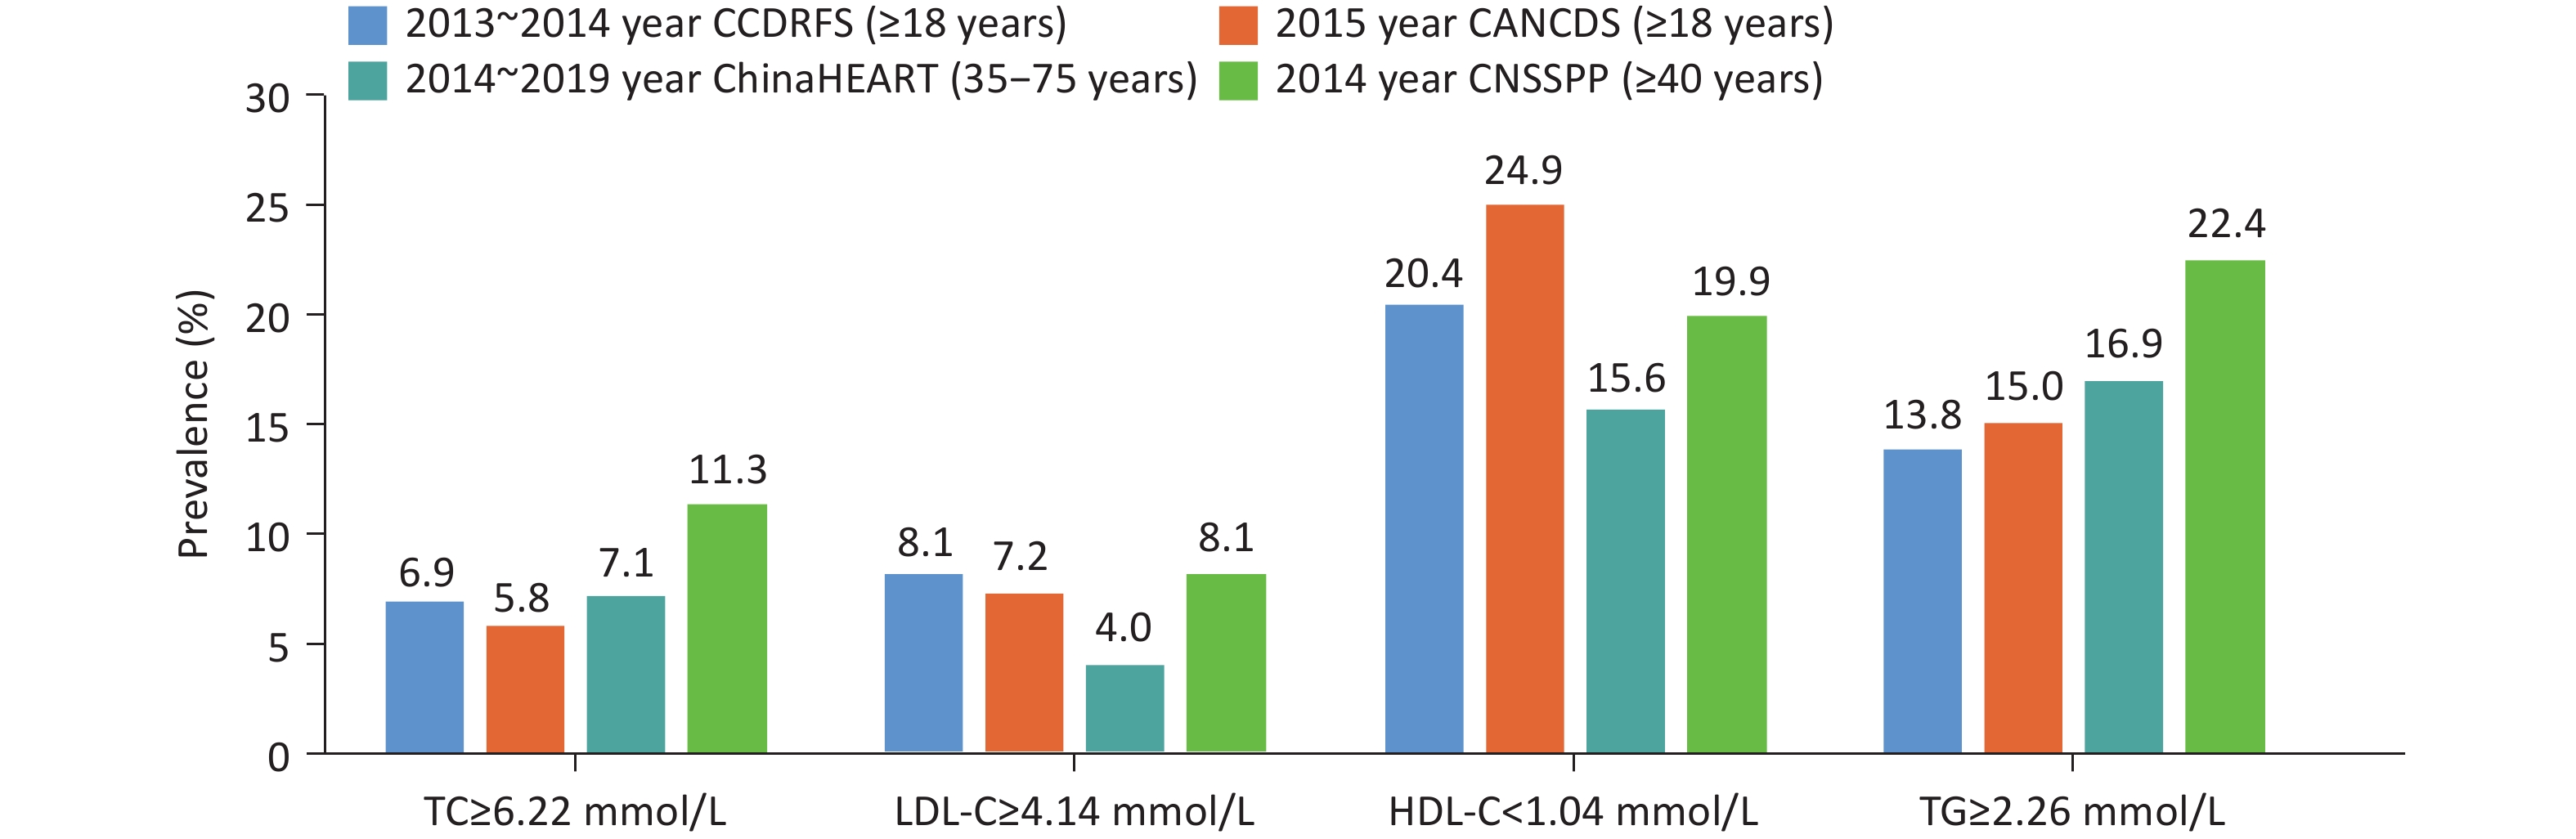
The fourth CCDRFS (2013–2014)[49], 2015 CANCDS[41], 2014 China National Stroke Screening and Prevention Project (CNSSPP)[50], and 2014–2019 ChinaHEART[48] surveys all indicated that the most common types of dyslipidemia in Chinese adults were low HDL-C and high TG (Figure 15). Among the various forms, high LDL-C rose from the 14th leading risk factor for global death and disability in 1990 to the 8th in 2019; in China, it rose from 15th to 6th. High LDL-C accounted for 25.1%[51] of the total CVD burden and 41.9% and 9.6% of the burden attributable to coronary heart disease and stroke, respectively[52].
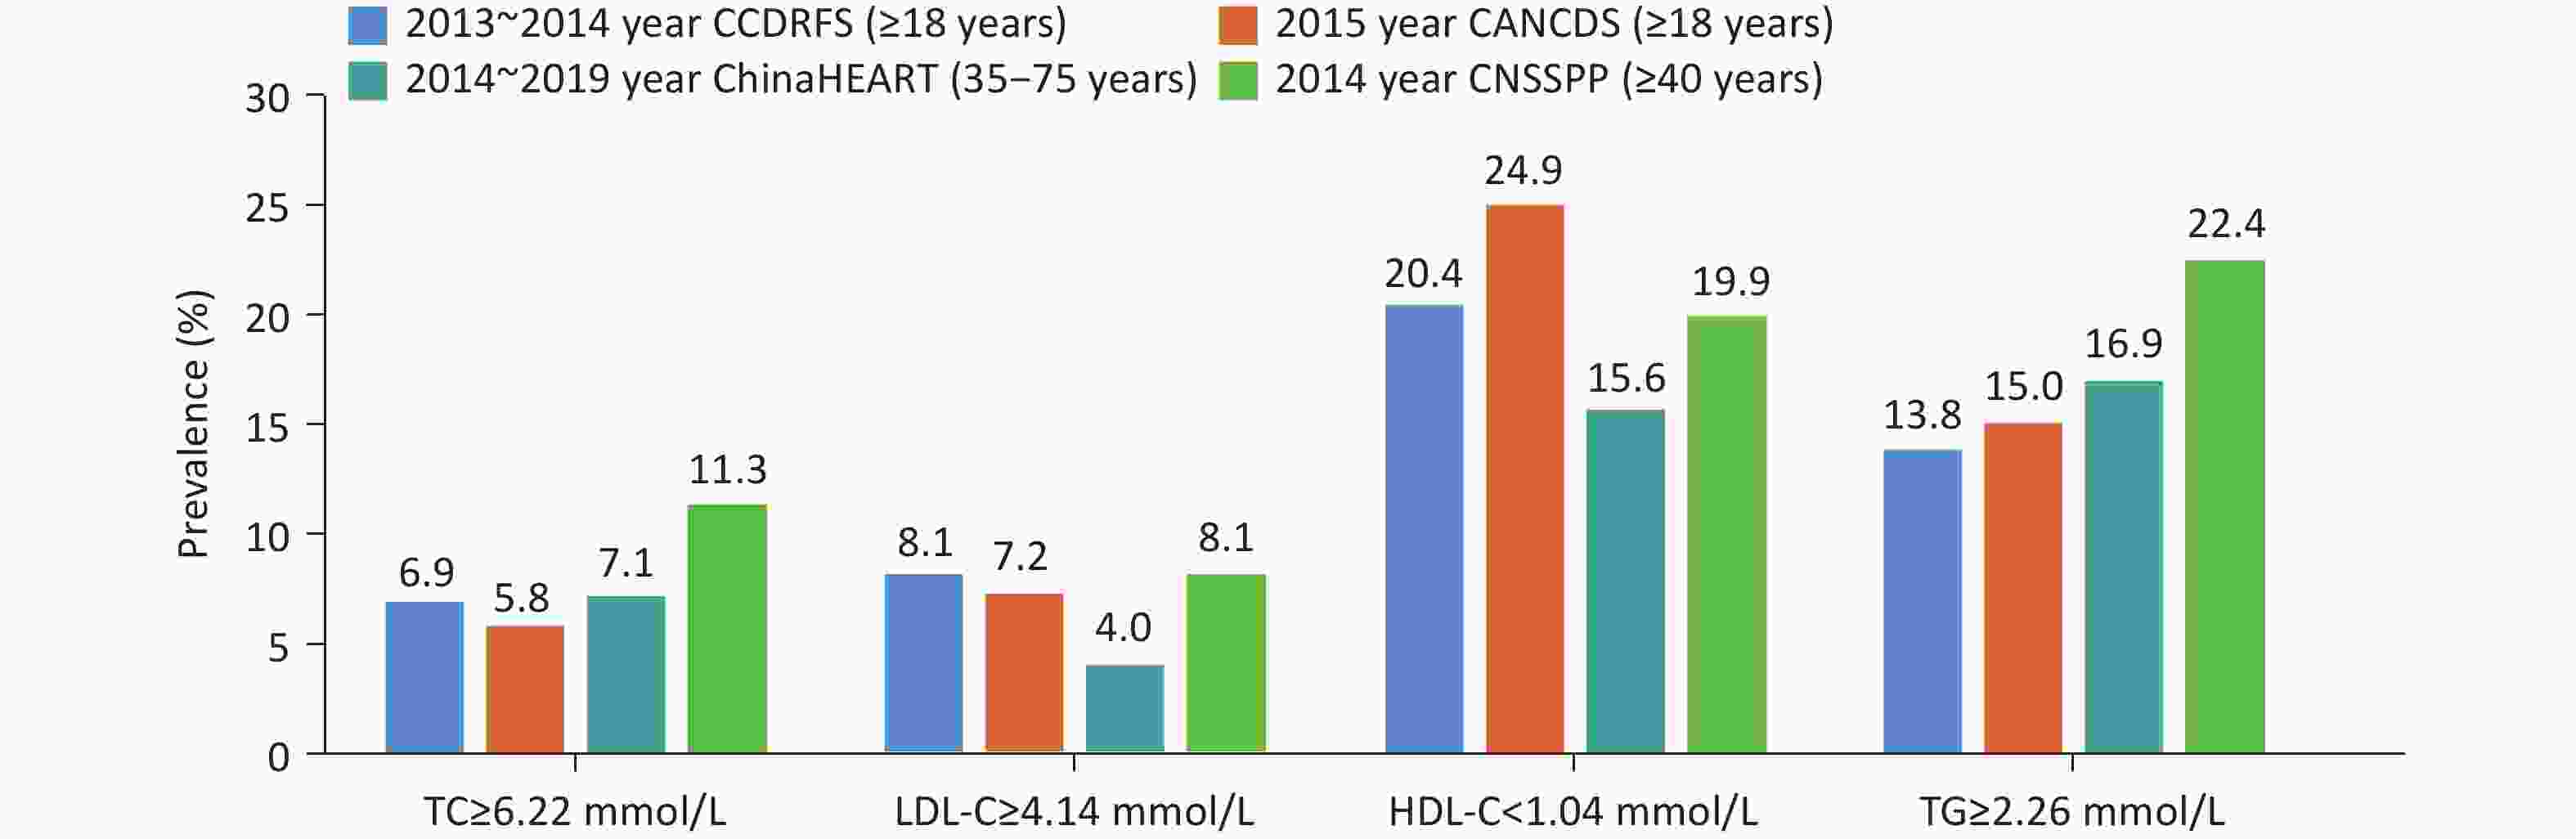
Figure 15. Prevalence rates of different types of dyslipidemia in adults in China. CCDRFS: China Chronic Disease and Risk Factor Surveillance; CANCDS: China Adult Nutrition and Chronic Disease Surveillance; ChinaHEART: China Early Screening and Comprehensive Intervention Program for Cardiovascular High-Risk Populations; CNSSPP: China National Stroke Screening and Prevention Project. TC: Total cholesterol; LDL-C: Low-density lipoprotein cholesterol; HDL-C: High-density lipoprotein cholesterol; TG: Triglycerides.
Analysis of data from over 3.79 million participants in ChinaHEART showed a U-shaped relationship between LDL-C and both all-cause and CVD mortality[53]. Compared with those with LDL-C 2.6–3.4 mmol/L, those with LDL-C < 1.8 mmol/L and > 4.9 mmol/L had 16% and 31% higher risks of all-cause and CVD death, respectively. The relationships of LDL-C levels with all-cause and cardiovascular mortality varied across different ASCVD-risk populations. In low-risk groups and primary prevention groups, the relationship followed a U-shaped pattern, whereas in secondary prevention groups it exhibited a J-shaped pattern. As ASCVD risk increases, the LDL-C level corresponding to the lowest cardiovascular mortality risk decreases progressively across all three groups[54]. The LDL-C level associated with the lowest CVD mortality risk varied by ASCVD risk: 3.1 mmol/L in the low-risk group, 2.8 mmol/L in the primary prevention group, and 1.4 mmol/L in the secondary prevention group.
The 2020–2022 CVD and Risk Factor Surveillance data showed that the awareness, treatment, and control rates of dyslipidemia among adults aged ≥ 18 years were 11.7%, 10.1%, and 4.8%, respectively. Compared with the 2010 China Chronic Disease Surveillance Project (awareness 10.93%, treatment 6.84%, control 3.53%)[55], awareness and control rates have improved but remain low.
According to the Chinese Guidelines for the Prevention and Treatment of Dyslipidemia in Adults (2016 revision), among 236,579 participants in ChinaHEART classified as high 10-year ASCVD risk (10.2%), the rate of achieving LDL-C ≤ 2.6 mmol/L was 42.9% (lower in females: 36.47% vs. 49.81%), and only 4.5% of those not at target were on treatment. Among 71,785 participants (3.2%) classified as very high 10-year ASCVD risk, the rate of achieving LDL-C ≤ 1.8 mmol/L was 26.6% (lower in females: 22.22% vs. 30.99%), and the treatment rate was 14.1%, with an LDL-C target attainment rate of 44.8%[48]. Using Chinese consensus criteria to screen 1,059,936 participants, ChinaHEART identified 1,383 cases of familial hypercholesterolemia; their LDL-C treatment rate was only 18.1%, and none achieved LDL-C ≤ 1.8 mmol/L[56].
The China Cardiovascular Disease Quality Improvement (CCC) project, involving 80,282 patients hospitalized with acute coronary syndrome (ACS) across 192 hospitals, showed that among 6,523 patients with a prior MI or coronary revascularization who presented with recurrent ACS, the lipid-lowering treatment rate at admission was 50.8%, and the LDL-C target attainment rate (≤ 1.8 mmol/L) was 36.1%[57]; the statin treatment rates were even lower in patients aged ≥ 75 years (treatment 33.9%, attainment 24.7%)[58].
-
The prevalence of diabetes in China has increased significantly. Cross-sectional data from the CCDRFS in 2013–2014 (170,287 adults) and 2018–2019 (173,642 adults) showed that according to American Diabetes Association (ADA) criteria, the prevalence of diabetes increased from 10.9% (95% CI: 10.4%–11.5%) in 2013 to 12.4% (95% CI: 11.8%–13.0%) in 2018 (Table 5). The prevalence of prediabetes increased from 35.7% (95% CI: 34.2%–37.3%) to 38.1% (95% CI: 36.4%–39.7%) over the same period[59].
Items Sample size (cases) Prevalence of diabetes mellitus classified according to different diagnostic criteria [% (95% CI)] Fasting blood glucose, 2-hour postprandial blood glucose, or glycated hemoglobin△ Fasting blood glucose or 2-hour postprandial blood glucose▲ 2013 2018 2013 2018 2013 2018 Total population 170,287 173,642 10.9 (10.4–11.5) 12.4 (11.8–13.0) 10.4 (9.8–10.9) 11.9 (11.3–12.5) Males 72,736 76,726 11.7 (11.0–12.4) 13.3 (12.6–14.0) 11.1 (10.4–11.7) 12.9 (12.2–13.6) Females 97,551 96,916 10.2 (9.7–10.7) 11.5 (10.8–12.2) 9.6 (9.1–10.2) 11.0 (10.3–11.6) Age groups (years) 18–29 13,486 9,046 5.0 (4.0–6.1) 5.0 (3.9–6.2) 4.4 (3.6–5.3) 4.4 (3.4–5.4) 30–39 21,980 17,173 6.9 (6.3–7.6) 6.5 (5.9–7.1) 6.6 (5.9–7.2) 6.3 (5.6–6.9) 40–49 42,268 31,466 10.6 (9.9–11.2) 11.1 (10.5–11.8) 10.1 (9.5–10.8) 10.9 (10.2–11.6) 50–59 43,011 45,951 16.2 (15.5–16.9) 19.3 (18.4–20.1) 15.4 (14.6–16.1) 18.7 (17.9–19.6) 60–69 32,714 47,291 19.8 (18.8–20.7) 23.9 (22.9–24.9) 19.0 (18.1–19.9) 23.3 (22.3–24.3) ≥ 70 16,828 22,715 20.7 (19.1–22.3) 27.3 (25.7–28.9) 19.8 (18.2–21.4) 26.6 (24.9–28.2) Urban 78,317 70,790 12.6 (11.7–13.5) 13.1 (12.2–14.0) 12.0 (11.1–12.9) 12.7 (11.9–13.5) Rural 91,970 102,852 9.5 (9.0–10.1) 11.6 (10.8–12.4) 8.9 (8.4–9.5) 11.1 (10.3–12.0) Note. *: A weighting method was used to represent the population of China; the Taylor series linearization method was employed to estimate variance and 95% confidence interval, with percentages weighted according to the same age and gender characteristics from the sixth national census of China. △: Self-reported diabetes diagnosis includes cases diagnosed with diabetes by a physician or with fasting blood glucose ≥ 7.0 mmol/L, or 2-hour postprandial blood glucose ≥ 11.1 mmol/L after a 75-g glucose load, or glycated hemoglobin ≥ 6.5%. ▲: Self-reported diabetes diagnosis includes cases diagnosed with diabetes by a physician or with fasting blood glucose ≥ 7.0 mmol/L, or 2-hour postprandial blood glucose ≥ 11.1 mmol/L after a 75-g glucose load. Table 5. Prevalence of diabetes in the Chinese population in 2013 and 2018*
In 2013, the awareness, treatment, and control rates for diabetes were 36.5%, 32.2%, and 49.2%, respectively. In 2018, these rates were largely unchanged at 36.7%, 32.9%, and 50.1%[59]. Treatment rates were higher in females, while control rates (using HbA1c < 7% as target) were higher in males; both treatment and control rates were higher in urban than rural areas. Compared with 1998 and 2010, the 2013 treatment rate showed slight improvement, while the control rate improved significantly, reaching 49.0% and 49.2% in 2017, approaching 50%[60].
From 2020 to 2022, an observational study conducted among 1,870,720 patients with type 2 diabetes across 1,669 hospitals in 30 provinces, autonomous regions, and municipalities directly under the central government of China found that 67.50% were at extremely high risk of cardiovascular disease (CVD)[61]. The proportions of type 2 diabetes patients at CVD risk were highest in Northeast China (75.82%), followed by Central China (73.65%) and Southwest China (72.66%), while the lowest was observed in South China (60.15%). Multivariate logistic regression analysis revealed that the category of extremely high CVD risk was associated with age, body mass index (BMI), duration of diabetes, hypertension, dyslipidemia, and smoking.
Prediabetes is associated with an elevated risk of cardiovascular disease (CVD) and heart failure. The Diabetes Prevention Program in Daqing, the world's longest-running lifestyle intervention study for diabetes prevention, showed in its 30-year follow-up that the cumulative incidence of cardiovascular death or heart failure hospitalization was 51% lower in the prediabetes remission group (fasting glucose ≤ 5.6 mmol/L, 2-hour post-load glucose ≤ 7.8 mmol/L, HbA1c < 5.7%), with reductions of 61% for heart failure hospitalization, 44% for cardiovascular death, and 39% for composite cardiovascular events (including cardiovascular death, nonfatal MI, nonfatal stroke, coronary/peripheral revascularization, hospitalization for heart failure/unstable angina, new coronary disease, or silent MI)[62]. This suggests that intervening at the prediabetes stage to achieve reversion to normoglycemia could be a simpler and more effective approach for CVD prevention. Early prevention may be simpler and more cost-effective than lifelong diabetes treatment, with significant public health implications.
-
Data from the sixth national chronic disease and risk factor surveillance (August 2018–June 2019), involving 176,874 adults aged ≥ 18 years across 31 provinces, autonomous regions, and municipalities, showed a prevalence of albuminuria and impaired renal function of 6.7% and 2.2%, respectively, with an overall CKD prevalence of 8.2%, a decrease from 10.8% in 2009–2010[63-64]. CKD prevalence was higher in individuals with diabetes (32.6%, albuminuria 30.8%, impaired renal function 5.5%)[65] and hypertension (25.3%, albuminuria 18.0%, impaired renal function 8.7%) than in the general population[64].
GBD 2023 data show that from 1990 to 2023, CKD prevalence in China increased continuously, with the age-standardized prevalence rising from 7,565 to 8,159 per 100,000; the number of cases rose from 75.42 million to 156 million[66]. According to the China Kidney Disease Network (CK-NET) annual report, among patients in tertiary hospitals, the prevalence of coronary heart disease, cerebral infarction, heart failure, and atrial fibrillation was higher in CKD patients than in non-CKD patients, with the highest CVD prevalence observed in CKD caused by hypertension and diabetes[67].
The 2015–2019 ChinaHEART survey of 269,026 adults aged ≥ 35 years across China showed a prevalence of urinary albumin-to-creatinine ratio (UACR) ≥ 30 mg/g of 8.75% (7.38% for 30–300 mg/g, 1.37% for ≥ 300 mg/g). Across the entire UACR range, higher UACR levels were associated with increased risks of all-cause, cardiovascular, and CVD-specific mortality.
GBD 2023 data show that in 2023, CKD-related deaths, YLL, YLD, and DALYs in China were 153,890, 3.23 million person-years, 1.87 million person-years, and 5.10 million person-years, respectively, compared with 119,500, 3.79 million person-years, 0.78 million person-years, and 4.57 million person-years in 1990. After age standardization, mortality, YLD, and DALYs declined by 52.89%, 7.94%, and 51.05%, respectively. The top three causes of CKD death in 2023 were hypertension (19.6%), type 2 diabetes (18.9%), and glomerulonephritis (10.9%). The top five risk factors for CKD death, YLL, YLD, and DALY burden were high fasting plasma glucose, high systolic blood pressure, dietary risks, high BMI, and non-optimal temperature[66]. By 2023, CKD ranked 9th globally as a cause of death and 12th in DALY burden[68].
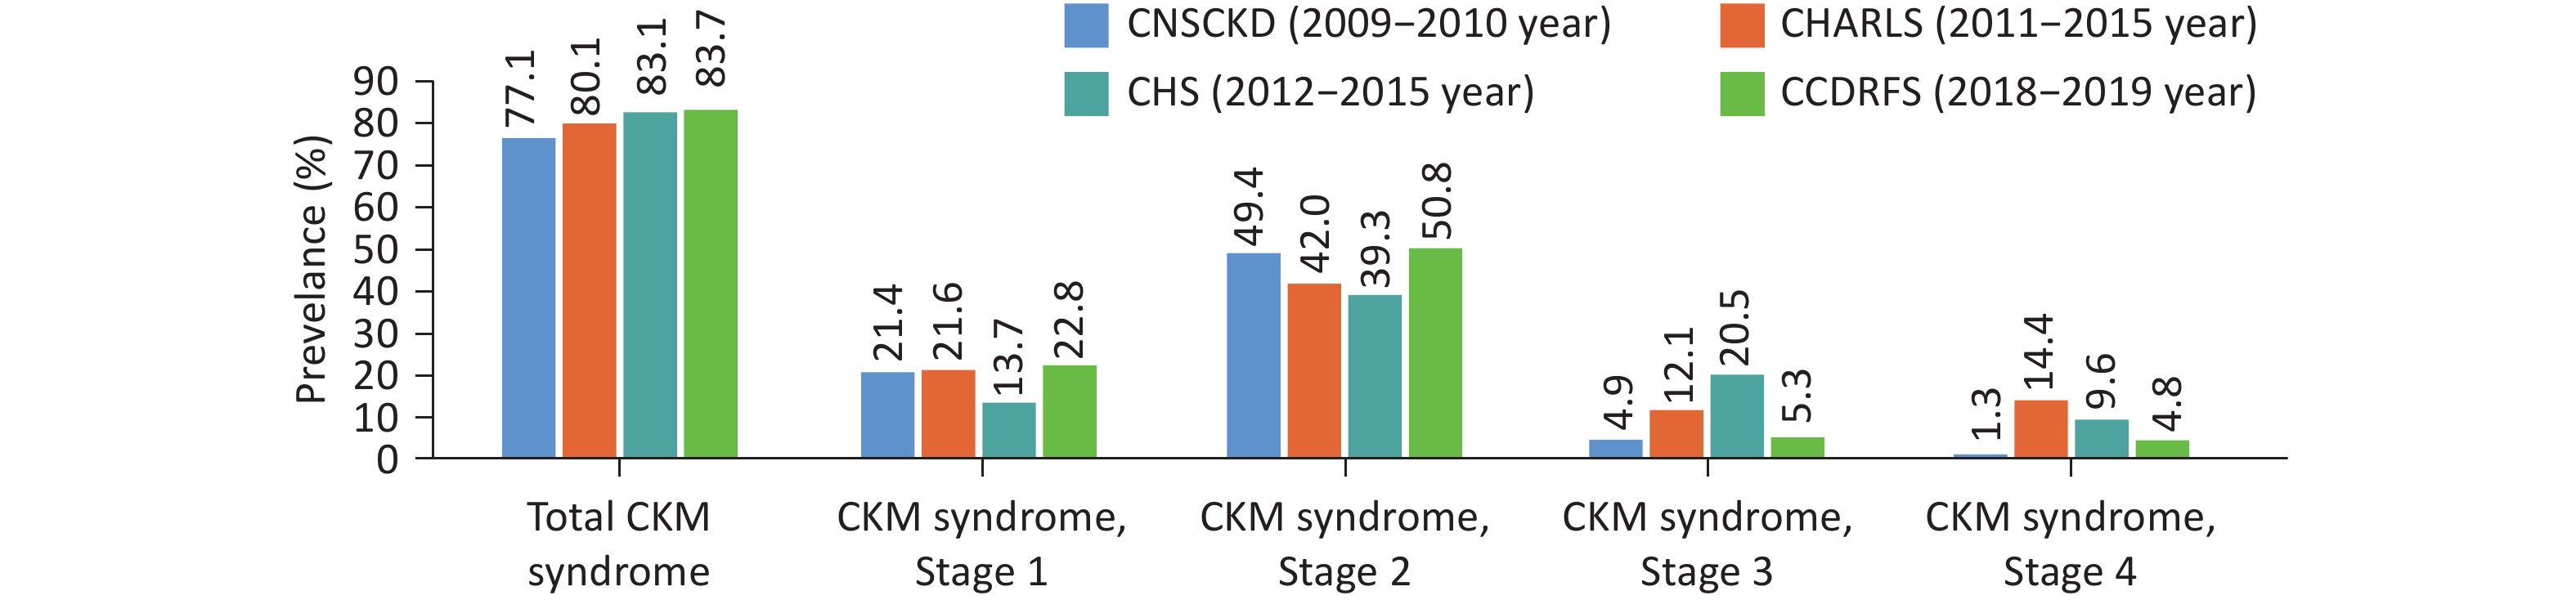
Furthermore, from 2010 to 2019, the prevalence of cardiovascular-kidney-metabolic (CKM) syndrome in China increased steadily, rising from 77.1% to 83.7% among adults, with a particularly marked increase in CKM stage 4 prevalence (from 1.3% to 4.8%)[69] (Figure 16). Higher CKM stage or a greater number of involved components was associated with higher risks of cardiovascular events and death. Results from the Chinese Multi-provincial Cohort Study (CMCS, n = 529, median follow-up 13.3 years)[70] and the China CVD and Cancer Cohort Study (CCDCC, n = 100,727, median follow-up 10.1 years)[71] both showed significantly increased composite cardiovascular event risk with higher CKM stage.
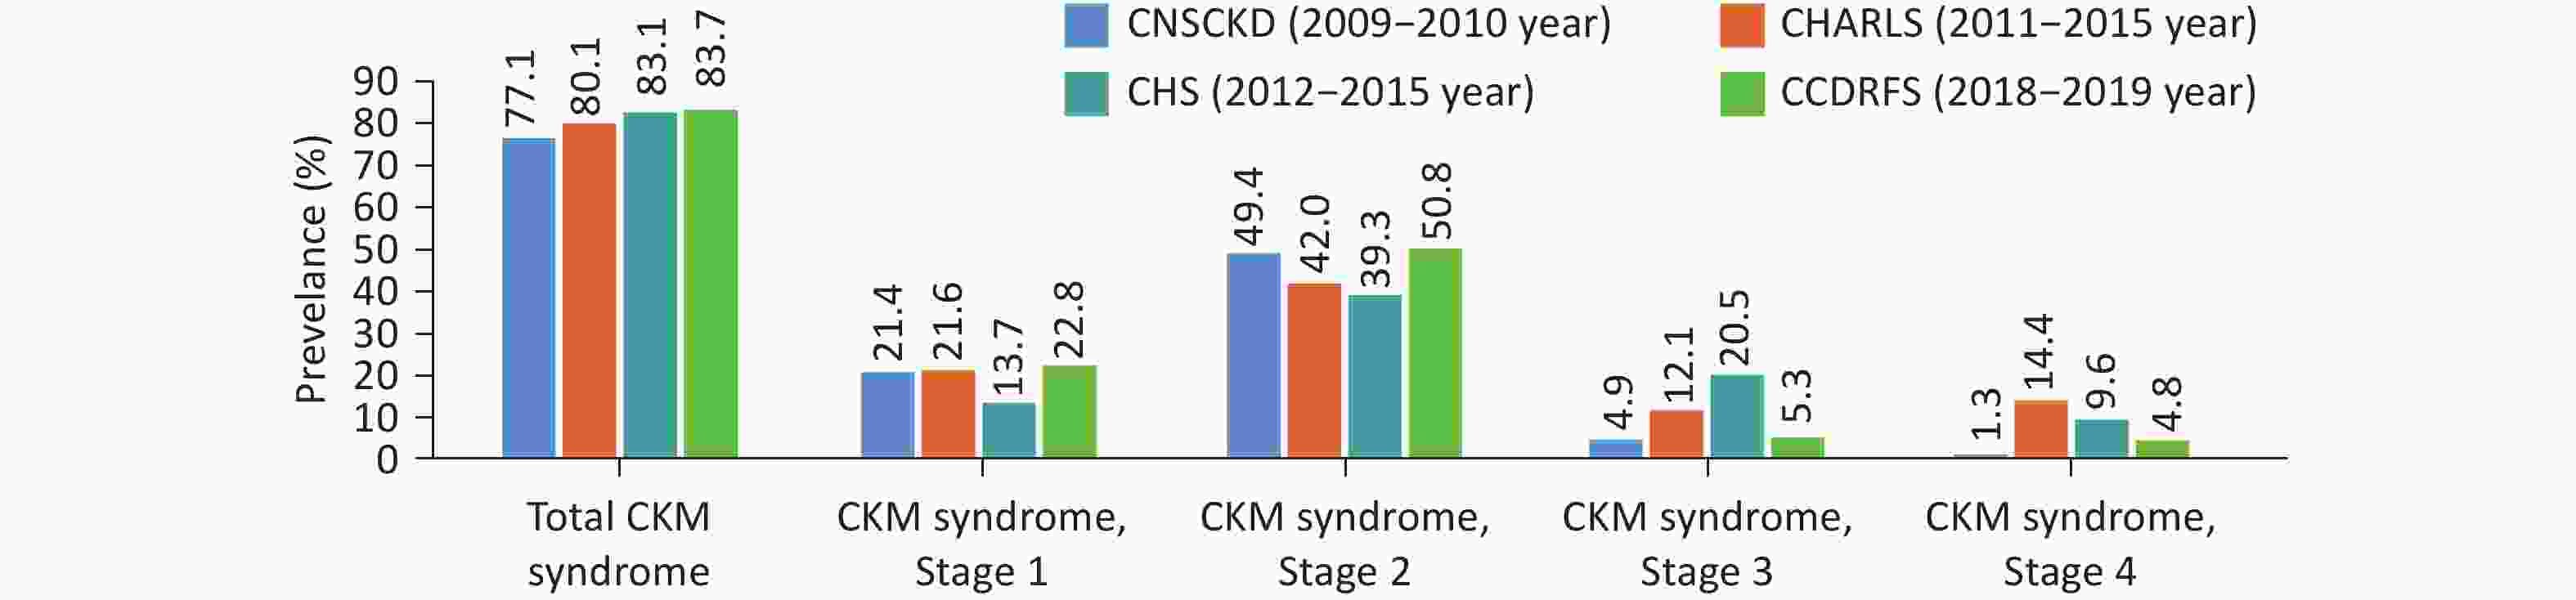
Figure 16. Prevalence of CKM syndrome and stage distribution among nationally representative populations in China. CNSCKD: China Chronic Kidney Disease Working Group survey, covering 41,088 adults aged ≥ 18 years; CHS: China Hypertension Survey, covering 33,685 adults aged ≥ 35 years; CHARLS: China Health and Elderly Care Follow-up Survey, covering 14,256 adults aged 45–85 years; CCDRFS: China Chronic Diseases and Risk Factors Monitoring, covering 171,462 adults aged ≥ 18 years. CKM syndrome: Cardiovascular-Renal-Metabolic Syndrome.
-
A 2024 meta-analysis of 32 sleep studies involving over 370,000 Chinese individuals found that 19.0% (95% CI: 15.8%–22.8%) reported poor sleep quality, with higher prevalence among those with lower education levels (Q = 4.12, P = 0.042) and those living in less developed regions (Q = 60.28, P < 0.001)[72]. A survey of 17,085 university students from three universities in eastern, central, and western China found that 57.94% reported poor sleep quality. Multivariate linear regression showed that, after controlling for age and sex, BMI (β = −2.69) and mobile phone (β = −1.34) dependence were significantly and inversely associated with sleep quality (P < 0.001)[73].
The Dongfeng-Tongji prospective cohort study examined the impact of sleep pattern changes and genetic predisposition on CVD risk in older adults from 2013 to 2018. Maintaining a healthy sleep pattern was associated with approximately 20% lower risks of CVD, coronary heart disease, and stroke compared with persistently unhealthy patterns, and genetic risk did not significantly modify these associations; however, poor sleep combined with high genetic risk further increased risk[74]. Regardless of genetic background, maintaining healthy sleep habits over the long term was associated with a lower CVD risk. The China Health and Retirement Longitudinal Study (CHARLS) from 2011 to 2018 found that compared with those maintaining ideal nighttime sleep duration, those with persistently non-ideal duration [IRR (Incidence Rate Ratio) = 1.36], those transitioning from ideal to non-ideal (IRR = 1.20), and those transitioning from non-ideal to ideal all had significantly higher CVD risk (IRR = 1.23). Additionally, those with persistently poor (IRR = 1.42) or worsening (IRR = 1.55) nighttime sleep quality had significantly higher CVD risk than those with consistently good sleep quality. Among sleep-deprived individuals, the relationship between nighttime sleep duration changes and CVD risk was U-shaped, while the association with sleep quality changes was linear[75].
Regarding mental health, China's first national epidemiological survey of mental disorders (2019) showed that among 32,552 adults surveyed, the lifetime prevalence of depressive disorders was 6.8%, with a 12-month prevalence of 3.6%; for anxiety disorders, the lifetime prevalence was 7.6%, with a 12-month prevalence of 5.0%[76]. GBD 2021 data show that from 1990 to 2021, the number of depressive disorder cases in China increased from 34.4 million to 53.1 million (up 54.0%), and anxiety disorder cases from 40.5 million to 53.1 million (up 31.2%); the age-standardized prevalence of depressive disorders decreased by 6.4% from 3,071.8 to 2,875.7 per 100,000, while that for anxiety remained stable[77].
A study of 47,841 individuals aged ≥ 45 years from seven regions of China (2014–2016) showed significantly higher prevalence of depression and anxiety disorders in CVD patients than in sex-matched individuals without CVD. Prevalence of depression and anxiety was 12.0% and 9.1% in heart failure patients, and 10.9% and 7.9% in stroke patients. Among those with three or more CVDs, depression and anxiety prevalence was 9.7% and 7.3% in women, and 6.3% and 3.5% in men[78]. A 2021–2022 cross-sectional study of 1,049 cardiovascular outpatients from multiple centers, using the GAD-7 and PHQ-9 scales, found that depressive and anxiety symptom burdens were substantial (prevalence 61% and 53%, respectively), with about one-quarter experiencing moderate-to-severe symptoms. Recognition of these disorders was less than half (approximately 42%–44%), and treatment rates were also low, with significant regional and hospital-level disparities. Standardized screening and collaborative integrated care models are urgently needed in cardiovascular clinics[79].
A 2024 prospective study of 1,432 CVD-free older adults (aged 70–84) with a median follow-up of 18 weeks found that those with significant depressive symptoms (GDS-15 score ≥ 10) had markedly higher risks of death (HR = 12.56, 95% CI: 3.58–43.99) and composite cardiovascular endpoints (HR = 3.46, 95% CI: 1.19–3.75). Significant depressive symptoms were also positively correlated with log(BNP) levels (β = 0.56, P = 0.02), and among those with depressive symptoms, the depression score was correlated with log(BNP) (rs = 0.21, P = 0.04)[80].
-
GBD data show that the top two environmental factors affecting health in China are air pollution and non-optimal temperatures. Air pollution fell from first to third in the ranking of risk factors for disease mortality burden in China between 2013 and 2023, but attributable deaths remained high at 2.051 million, with ambient particulate matter pollution accounting for 1.187 million CVD deaths. Non-optimal temperature ranked 9th in both 2013 and 2023, with attributable CVD excess deaths exceeding 400,000 in 2023.
The China Climate Bulletin 2024 reported a national average temperature of 10.9 °C, 1.01 °C above the 1991–2020 average and the highest since 1951. All four seasons had above-average temperatures. The average winter temperature was −2.8 °C, 0.3 °C above the climatological normal; the average summer temperature reached 22.3 °C, 1.1 °C above normal. The national extreme high-temperature event station ratio (the proportion of stations recording extreme temperature events) was 0.59, 0.47 above average and the second highest since 1961; the extreme continuous high-temperature event station ratio was 0.73, 0.47 above average. The extreme low-temperature event station ratio was 0.05, 0.07 below average. There were 33 cold-air events in 2024, five reaching cold wave intensity, an above-average frequency.
A summer time-series analysis covering over 2.39 million heart disease deaths (2013–2019) across 31 provinces, autonomous regions, and municipalities directly under the central government showed[81] that short-term heatwave exposure significantly increased heart disease mortality risk. Heatwaves were classified as daytime-only, nighttime-only, and compound day-night (defined as Tmax ≥ 90th percentile and Tmin ≥ 90th percentile for ≥ 2 consecutive days), using the excess cumulative temperature (ECT-HW) metric. Compound heatwaves carried the highest risk (OR = 1.86), significantly higher than daytime-only (OR = 1.19) and nighttime-only (OR = 1.16). Estimated excess cardiac deaths attributable to compound, nighttime-only, and daytime-only heatwaves were 41,869, 9,092, and 9,809, accounting for 1.75%, 0.38%, and 0.41% of total cardiac deaths. Cardiac arrest, AMI, and heart failure were most sensitive to compound heatwaves, and pulmonary heart disease exhibits lower sensitivity. Traditional heatwave definitions may underestimate heatwave-related CVD mortality and burden, highlighting the need for tailored prevention strategies.
A study on the health effects of heatwave warnings, covering 9,659,745 CVD-free participants in Shenzhen (including 1,332 hospitals and 922 primary healthcare institutions) from January 1, 2017, to July 31, 2023[82]. Over the follow-up period, 238,278 participants (2.47%) experienced incident CVD; affected individuals were generally older men with higher education and more pre-baseline hospital admissions. The study found that heat-related illness was significantly associated with CVD onset (HR = 2.526, 95% CI: 2.301–2.773), suggesting a causal relationship. Such mitigating effects exhibited a lagged pattern: the protective impact against heat-related hospitalizations peaked at 1–2 days following warning release, whereas the maximum risk reduction for CVD emerged 3–4 days post-warning.
Low temperatures (cold spells) are important CVD risk factors, with differential effects by MI type. A national time-stratified case-crossover study (2015–2021) including 83,784 patients with myocardial infarction with non-obstructive coronary arteries (MINOCA) and 918,730 with myocardial infarction with obstructive coronary artery disease (MI-CAD)[83] found that extreme cold had a stronger effect on MINOCA (OR = 1.58, 95% CI: 1.31–1.90) than on MI-CAD (MI-CAD unmatched population: OR = 1.32, 95% CI: 1.23–1.43; age-and sex-matched population: OR = 1.25, 95% CI: 1.04–1.50). This association was more pronounced in patients aged ≥ 65 years, females, and those living in southern regions.
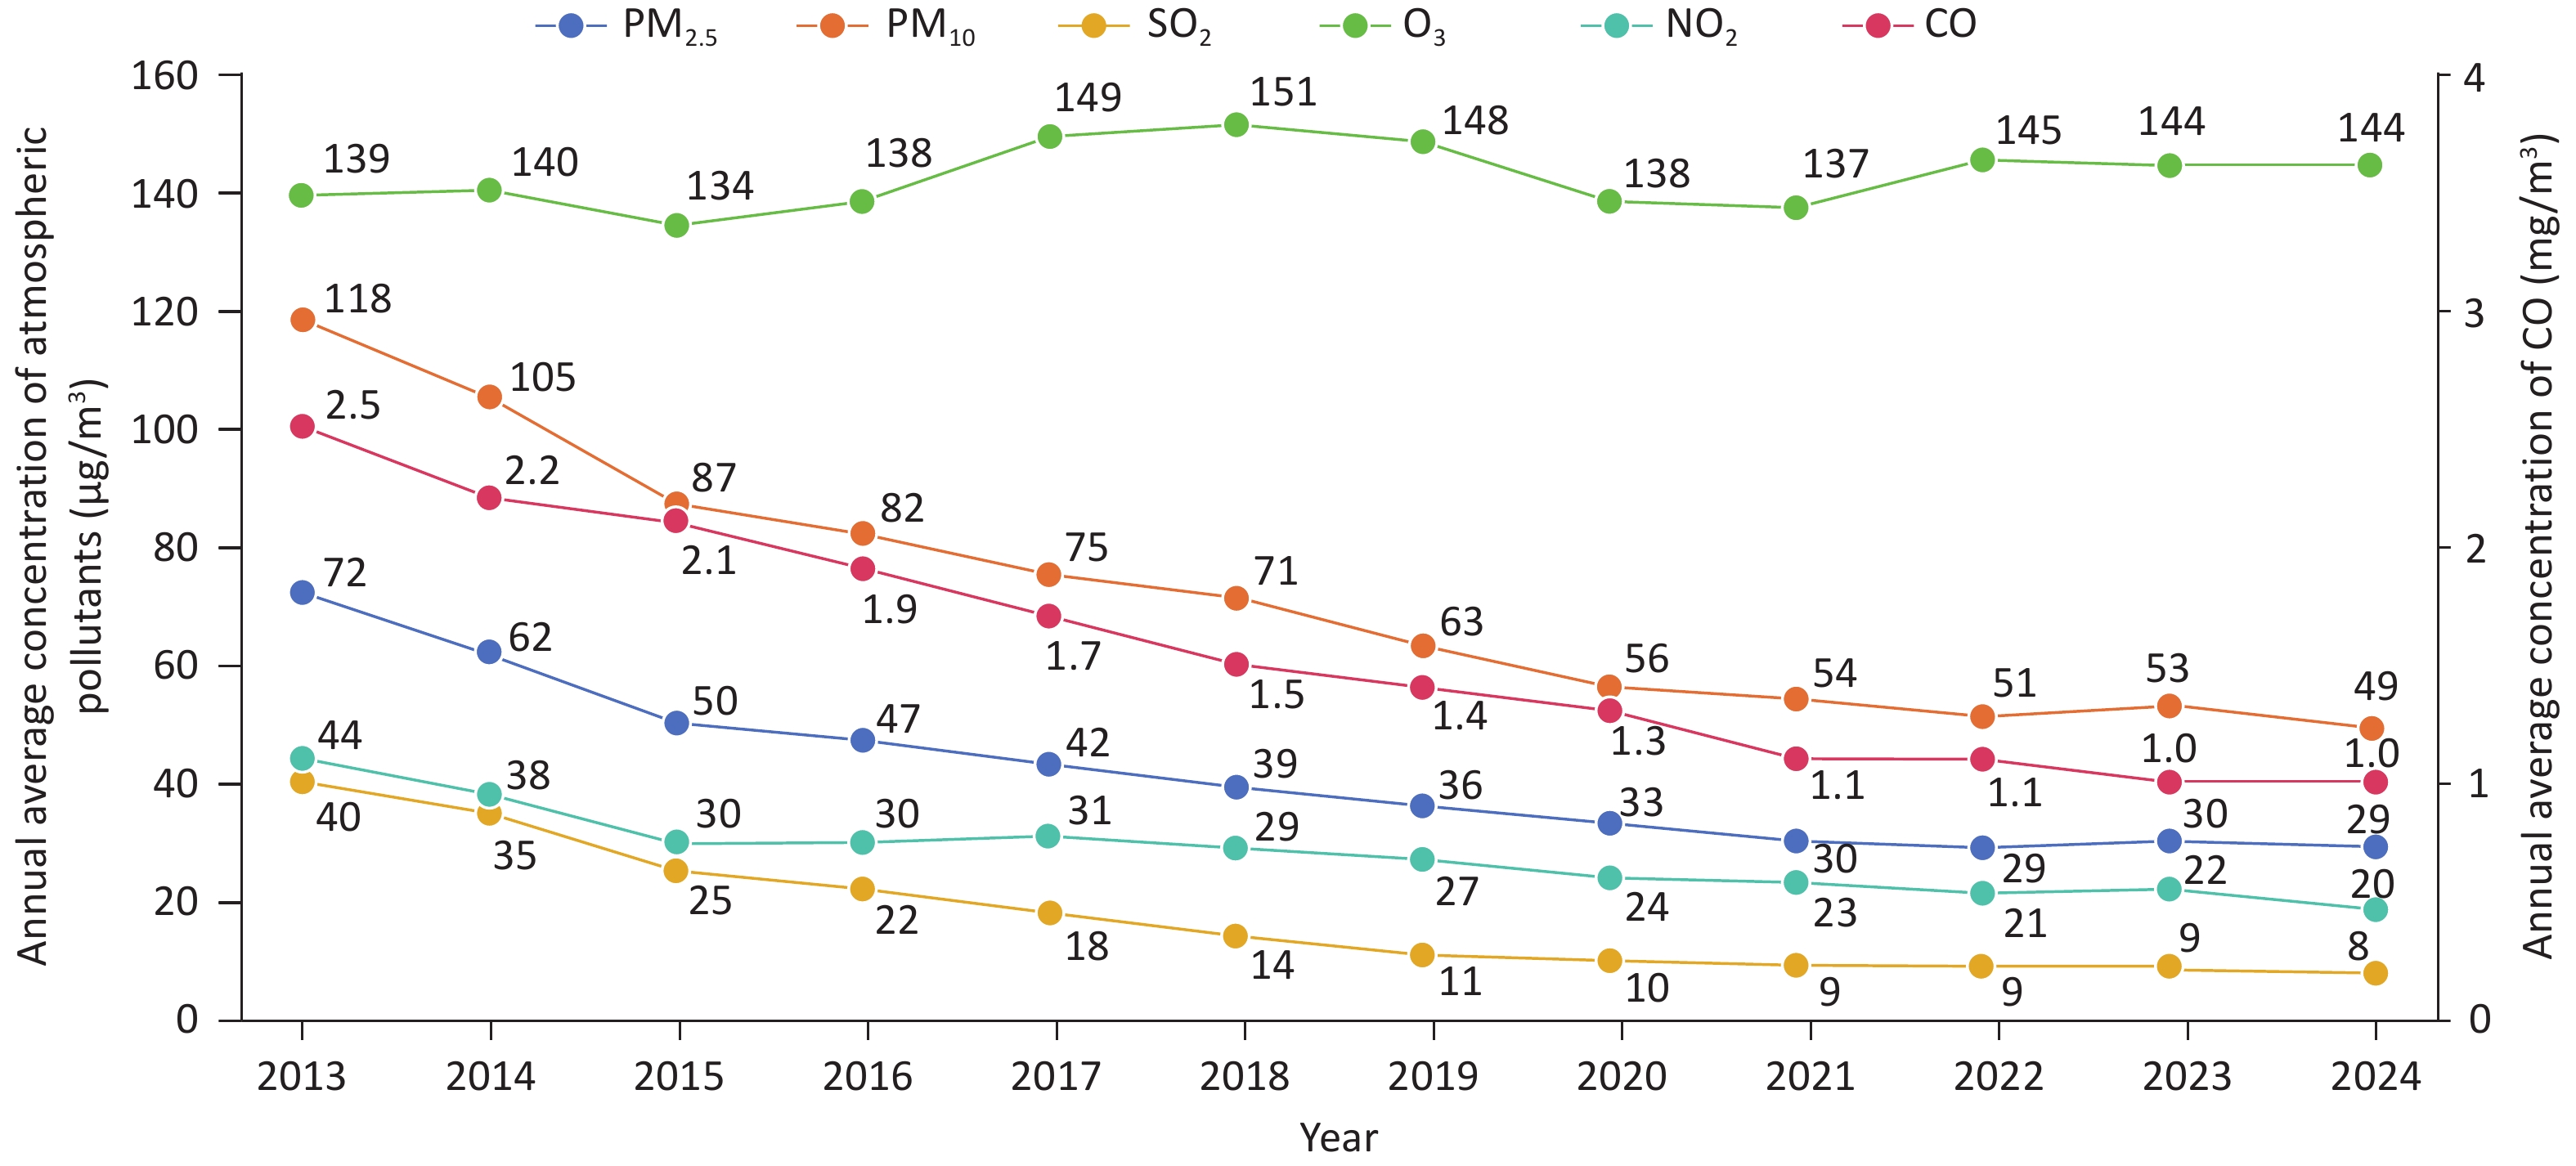
The Report on the State of the Ecology and Environment in China showed that in 2024, among 339 cities, 222 (65.5%) met ambient air quality standards. Levels of four major pollutants (PM2.5, PM10, SO2, NO2) decreased compared with 2023 (Figure 17). Among days on which standards were exceeded, ozone (O3) was the primary pollutant in the highest proportion (45.3%). The annual average PM2.5 concentration across these cities ranged from 6.1 to 50.6 μg/m3, averaging 29.3 μg/m3, a 2.7% decrease from 2023.
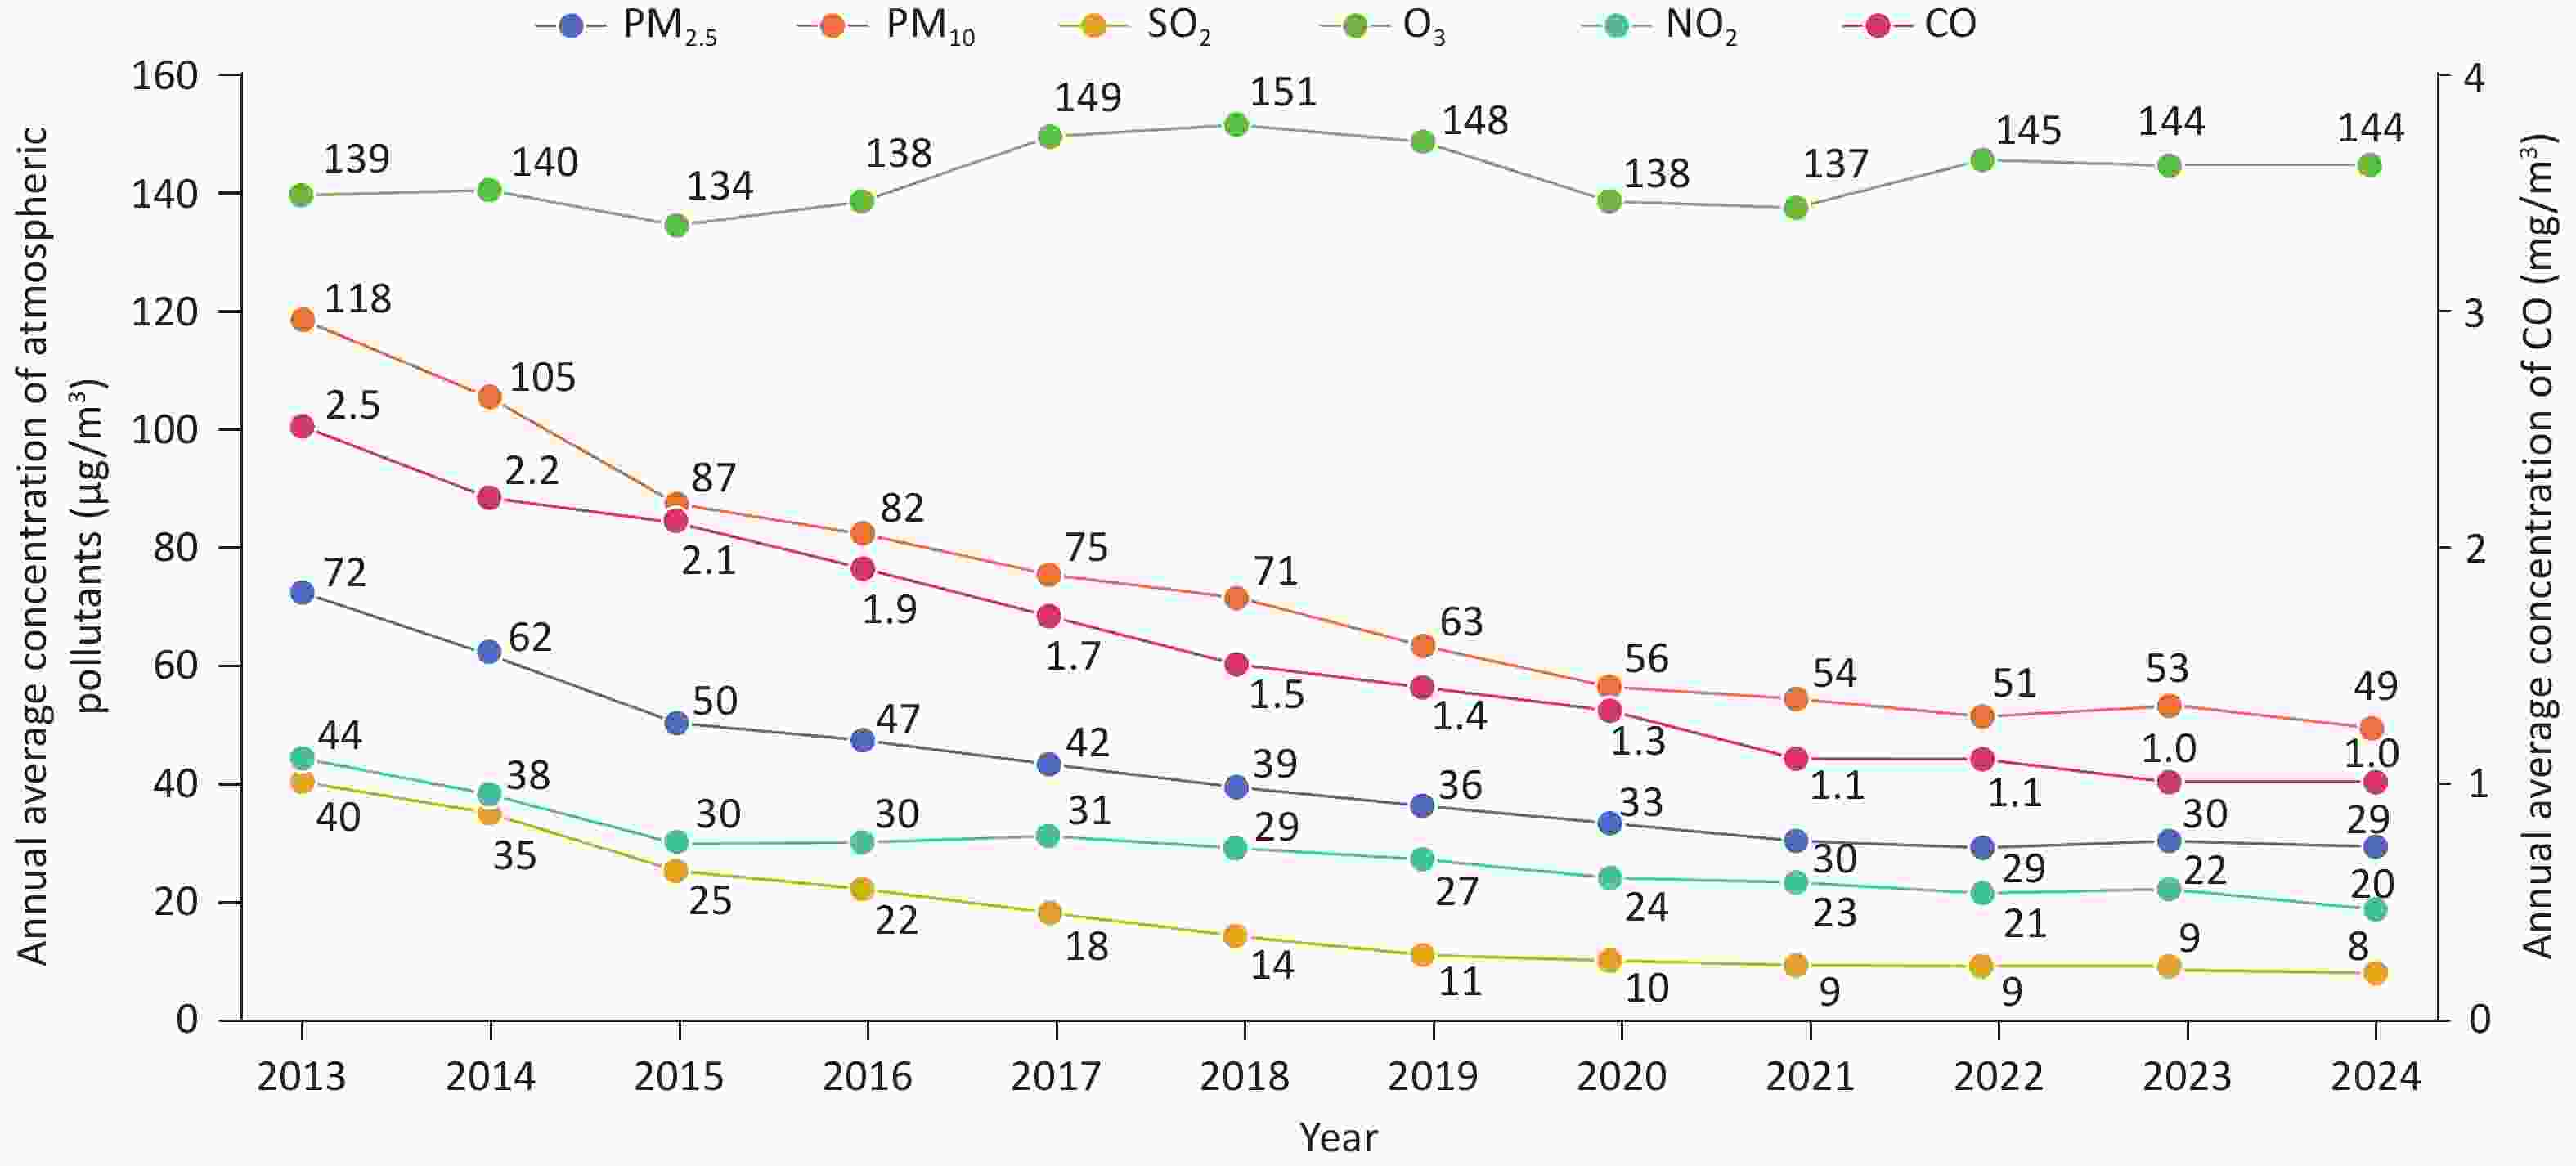
Figure 17. Trends of six major atmospheric pollutants from 2013 to 2024. PM2.5: Fine particulate matter; PM10: Inhalable particulate matter; SO2: Sulfur dioxide; O3: Ozone; NO2: Nitrogen dioxide; CO: Carbon monoxide.
Air pollution and lifestyle factors significantly affect CVD risk, with synergistic interactions. A prospective cohort study in northwestern China (2019–2021, 5.8 million participants without CVD) found that during follow-up, 414,218 developed CVD. Long-term exposure to PM1, PM2.5, PM10, O3, and CO significantly increased CVD risk[84]. For each 10 μg/m3 increase in annual average concentration of these five pollutants, CVD risk increased by 37.3%, 9.0%, 2.3%, 41.2%, and 0.5%, respectively. Physical activity had the most significant modifying effect, with regular exercisers showing lower risk than non-exercisers. Significant interactions between air pollution and lifestyle were observed (Pinteraction< 0.001). CVD risk was highest in the group with high pollution exposure and an unhealthy lifestyle, emphasizing the importance of promoting healthy lifestyles alongside air pollution control.
-
In recent years, the CVD risk factor profile in China has shown a dual pattern: "persistent high burden of traditional risk factors alongside the emergence of novel risk factors." Metabolic risk factors—hypertension, dyslipidemia, and diabetes—show rising prevalence. Hypertension prevalence has surpassed 30%, dyslipidemia levels have risen substantially, and the population with diabetes and prediabetes continues to expand, indicating an increasing overall cardiometabolic risk. While awareness, treatment, and control rates for hypertension and diabetes have improved, overall control remains suboptimal. The notably low awareness and treatment rates for dyslipidemia represent a prominent gap in the current prevention and control system.
Furthermore, CKD, as a major comorbidity and risk amplifier for CVD, is increasing in prevalence and interacts with hypertension and diabetes in a mutually reinforcing vicious cycle, further increasing the CVD burden. Concurrently, the impact of sleep disorders, psychological problems, and unhealthy lifestyles on cardiovascular risk is gaining attention. Their high prevalence and interaction with traditional risk factors necessitate a shift from a purely biomedical model to comprehensive behavioral interventions.
Additionally, the impact of environmental and climatic factors on cardiovascular health is increasingly significant. While air pollution has improved, it remains a major contributor to mortality. Extreme temperature events (heatwaves and cold spells) have a clear impact on cardiovascular events and mortality. In the context of global climate change, environmental factors are becoming an important external driver.
Overall, China's CVD prevention and control efforts face a complex pattern of multiple overlapping risk factors, transitioning from "single risk factor control" to "multi-factor comprehensive intervention." Future efforts should strengthen population-based early screening and stratified management, promote life-course management of metabolic risk factors, and integrate behavioral interventions with environmental governance strategies to move CVD prevention upstream and optimize the overall system.
-
Hospital Quality Monitoring System (HQMS) data for 2024 showed that 6,879 hospitals admitted hypertensive patients (with hypertension as a primary or secondary discharge diagnosis, aged ≥ 18 years). Hypertension was the primary discharge diagnosis in 1.892 million patients, with a mean age of 57.5 ± 17.2 years; 55.0% were female. The top three comorbidities among hospitalized hypertensive patients were coronary heart disease (30.3%), cerebrovascular disease (29.9%), and diabetes (26.0%), similar to 2023. Among patients with a primary diagnosis of hypertension, the proportion of secondary hypertension ranged from 19.5% (highest) to 1.7% (lowest); most provinces showed a slight increase in proportion of secondary hypertension compared with 2023.
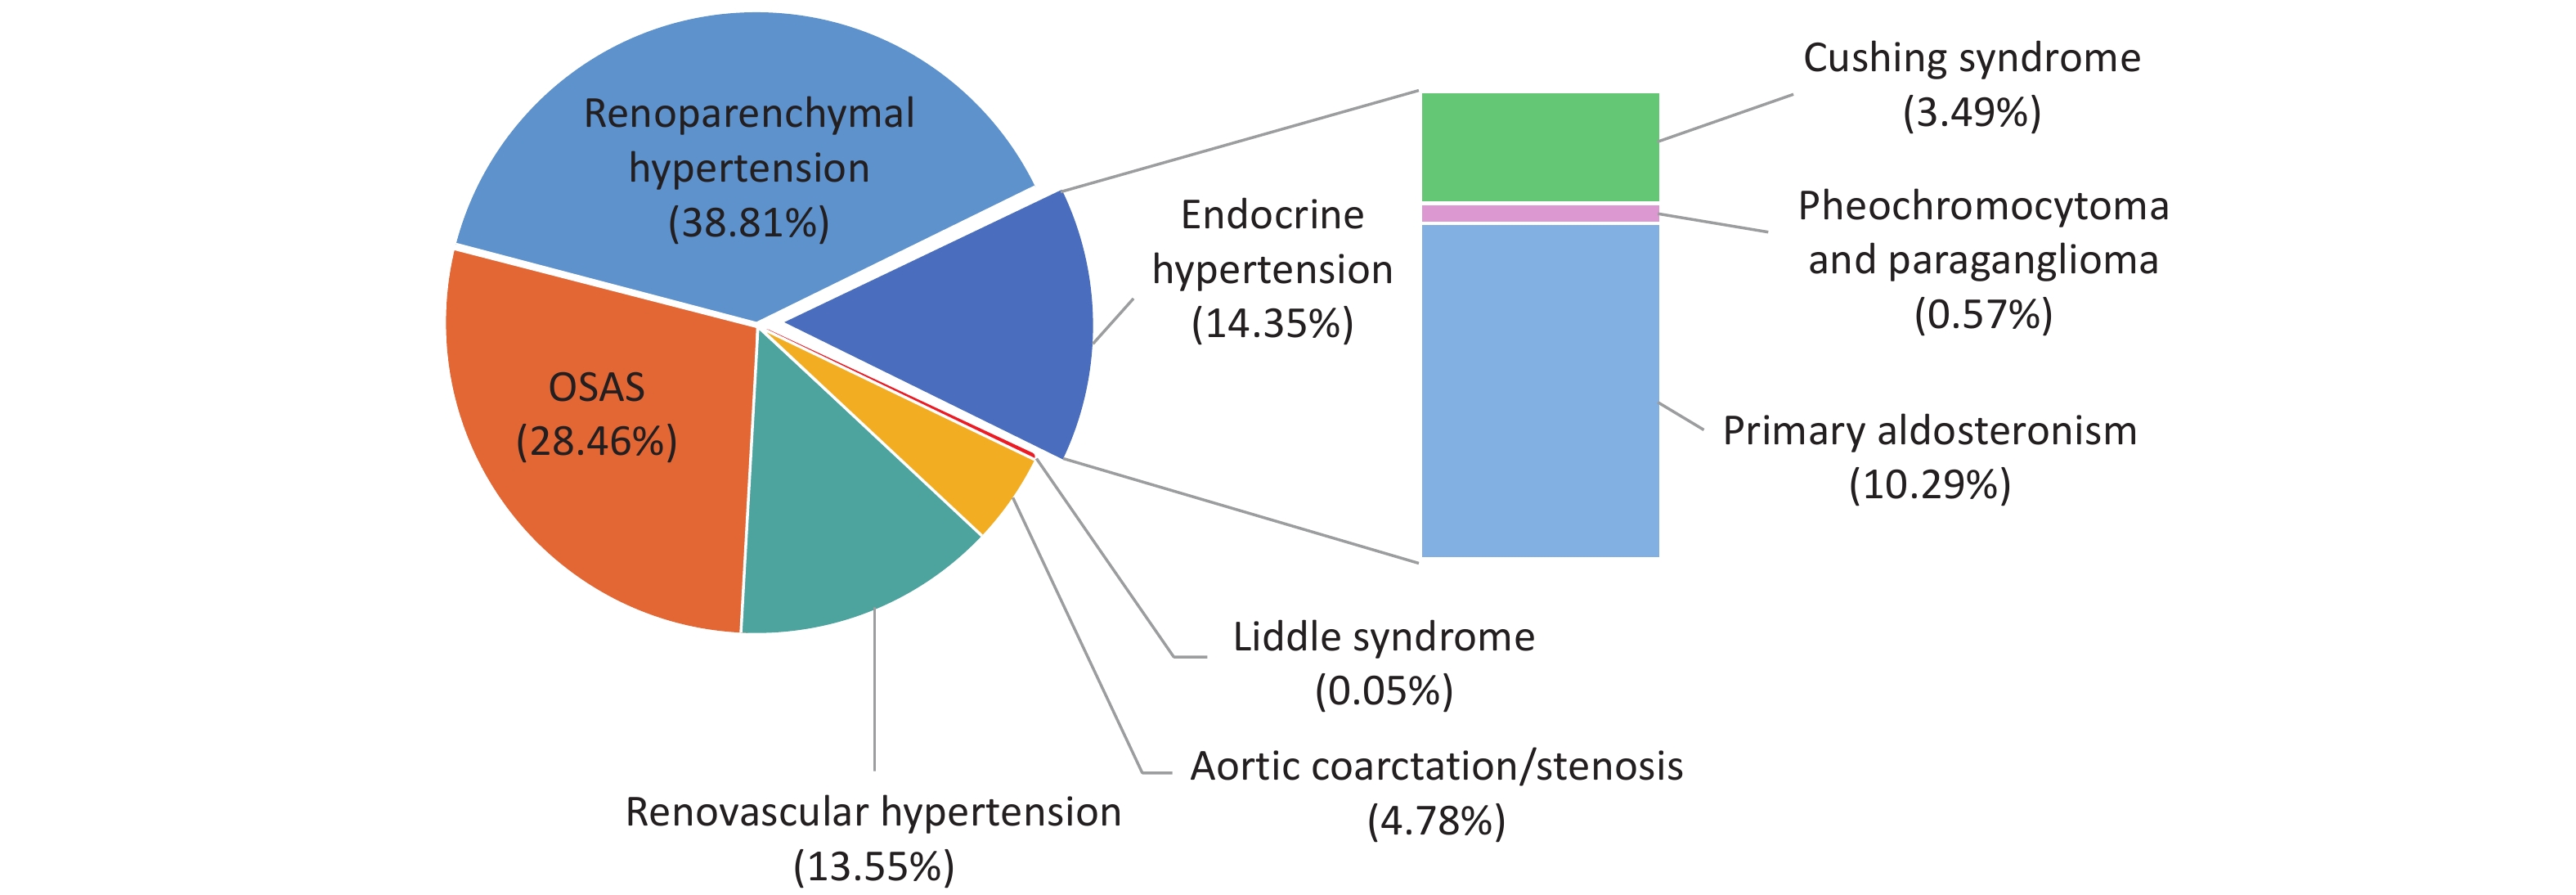
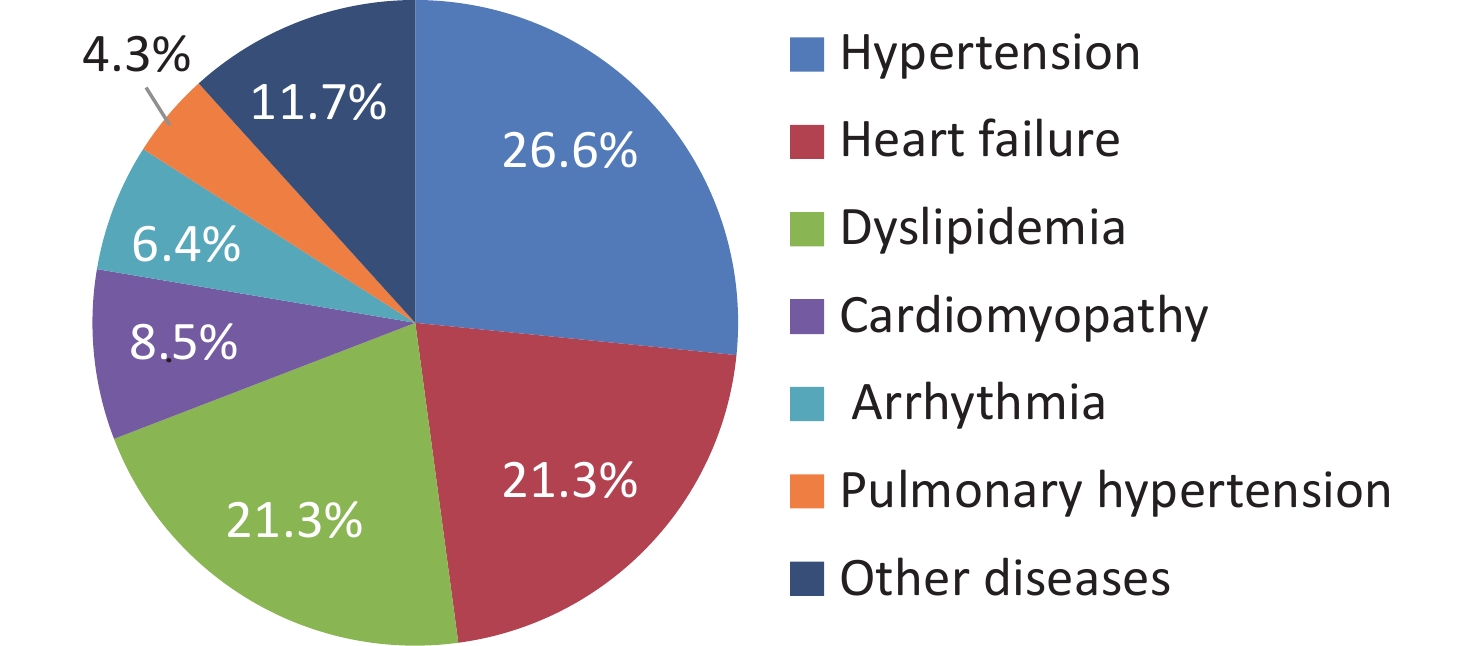
The three most common etiologies of secondary hypertension in 2024, the top three were renal parenchymal hypertension (38.81%), obstructive sleep apnea syndrome (OSAS, 28.46%), and endocrine hypertension (14.35%) (Figure 18). Among 127,000 hospitalized patients with renovascular hypertension, atherosclerosis accounted for 7.0%, Takayasu arteritis for 1.5%, fibromuscular dysplasia for 0.1%, and unspecified or other etiologies for 91.4%.
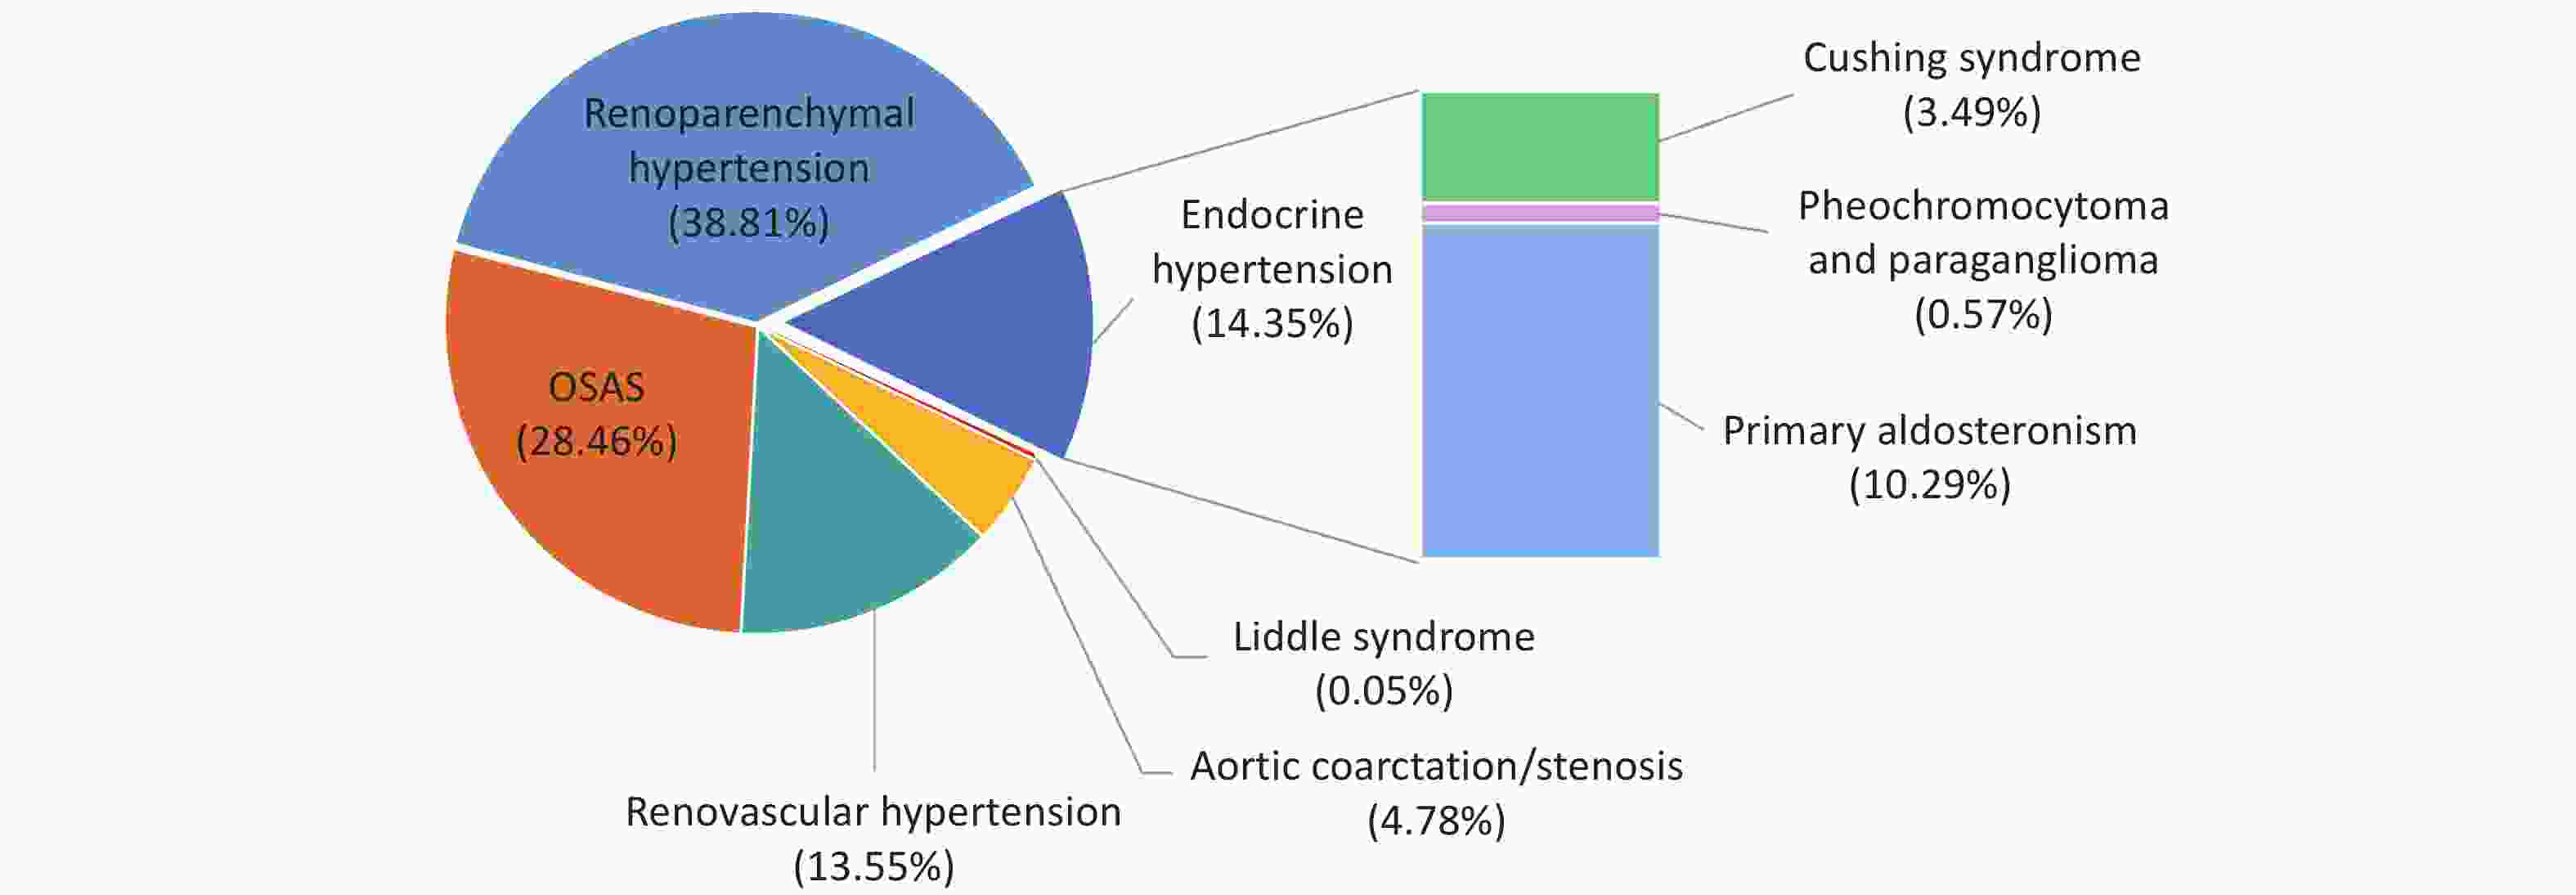
Figure 18. Distribution of secondary hypertension etiologies in 2024. OSAS: Obstructive sleep apnea syndrome.
Three recent sham-controlled, randomized, multicenter trials from China compared the safety and efficacy of renal denervation (RDN) at 6 months post-procedure. Two studies found greater reductions in 24-hour mean SBP (12.4 vs. 3.7 mmHg; 13.0 vs. 3.0 mmHg) and DBP (6.4 vs. 1.3 mmHg; 7.7 vs. 2.8 mmHg) in the RDN group than in the sham group[85-86]. The third study found that 6-month office SBP control rates were comparable between groups (95.4% vs. 92.8%, P = 0.429), but the RDN group had a significantly lower medication burden index (4.37 vs. 7.61, P = 0.010), indicating that fewer drugs were needed to achieve SBP < 140 mmHg[87]. No major safety events were reported in any trial.
A 2024 study showed that in high-cardiovascular-risk hypertensive patients, regardless of diabetes status or stroke history, targeting an SBP < 120 mmHg, compared with < 140 mmHg, provided greater protection against major vascular events with only minor additional risks[88]. A 2025 randomized controlled trial of Chinese patients with diabetes (n = 12,821, 145 centers) compared intensive (SBP target < 120 mmHg) vs. standard (SBP target < 140 mmHg) blood pressure control[89]. After a median 4.2-year follow-up, the intensive group had a 21% lower risk of the primary composite endpoint (stroke, MI, heart failure hospitalization, cardiovascular death), but higher rates of symptomatic hypotension and hyperkalemia. These findings confirmed the greater benefit of intensive SBP control in high-cardiovascular-risk type 2 diabetes patients aged ≥ 50 years.
The phase III China Rural Hypertension Control Project (CRHCP), involving 33,995 patients aged ≥40 years with uncontrolled hypertension in rural China, provided the first evidence that intensive SBP reduction (22.0 mmHg drop) delivered by nonphysician primary care health workers reduced all-cause dementia risk by 15% and cognitive impairment risk by 16%, with fewer serious adverse events[90], providing an evidence-based foundation for primary care hypertension management in dementia prevention.
-
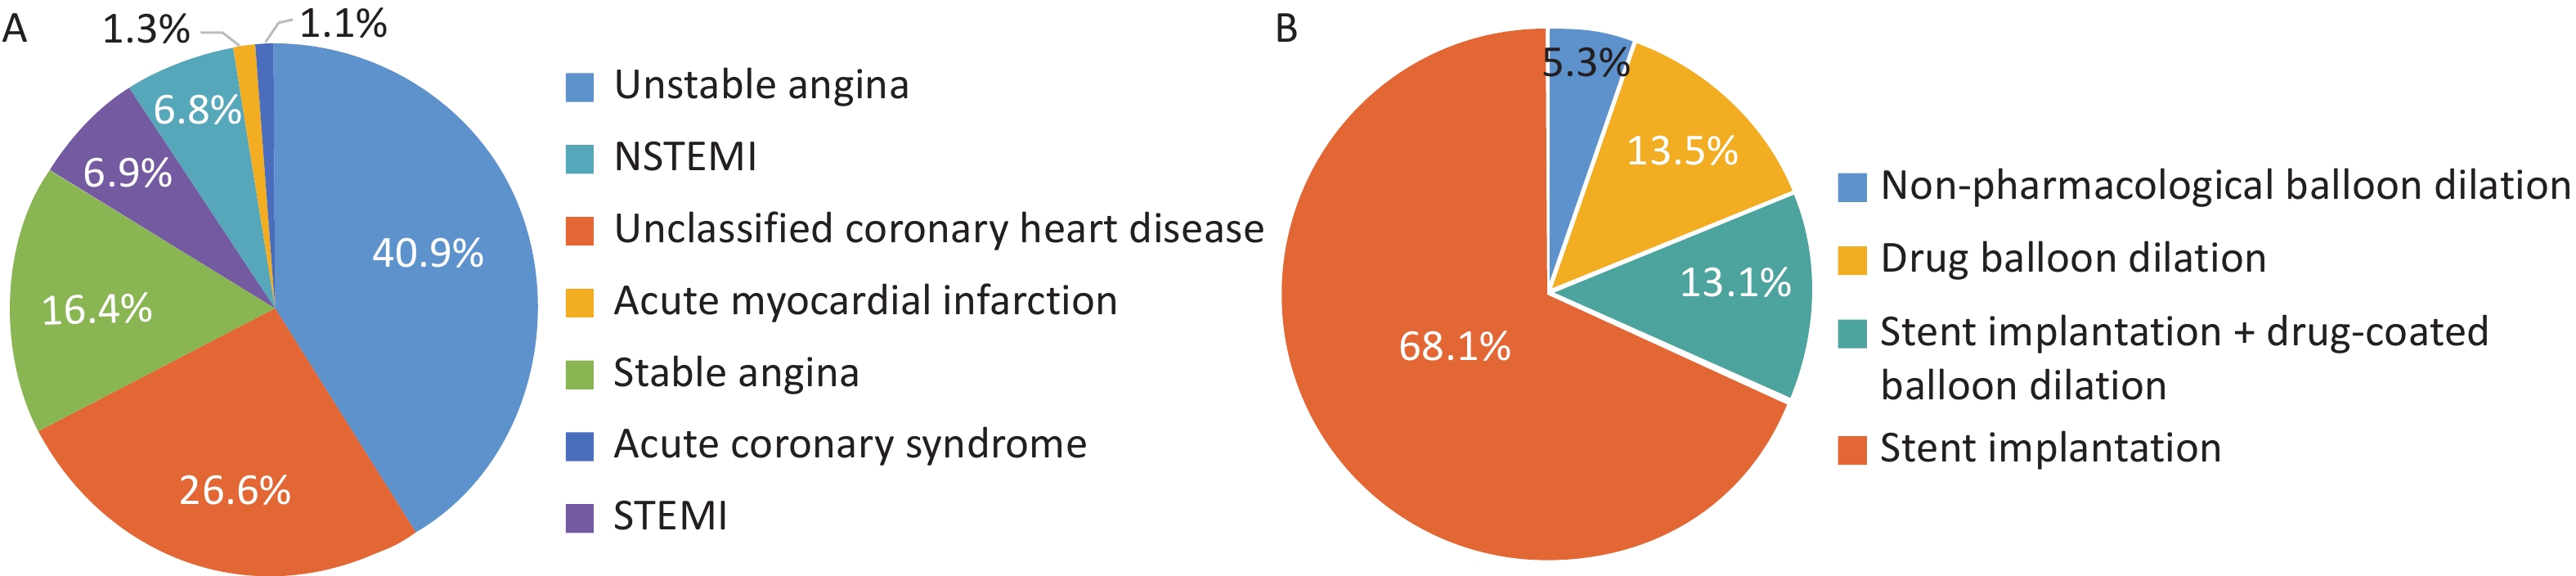
HQMS data for 2024 showed that 6,753 hospitals (2,297 tertiary, 4,456 secondary) admitted patients (aged ≥ 18 years) with a primary diagnosis of coronary heart disease, totaling 8.776 million admissions (6.205 million in tertiary, 2.571 million in secondary). The top three primary discharge diagnoses were unstable angina (40.9%), unspecified coronary heart disease (26.6%), and stable angina (16.4%) (Figure 19A). The top three comorbidities were hypertension (62.6%), type 2 diabetes (28.6%), and cerebrovascular disease (17.8%).
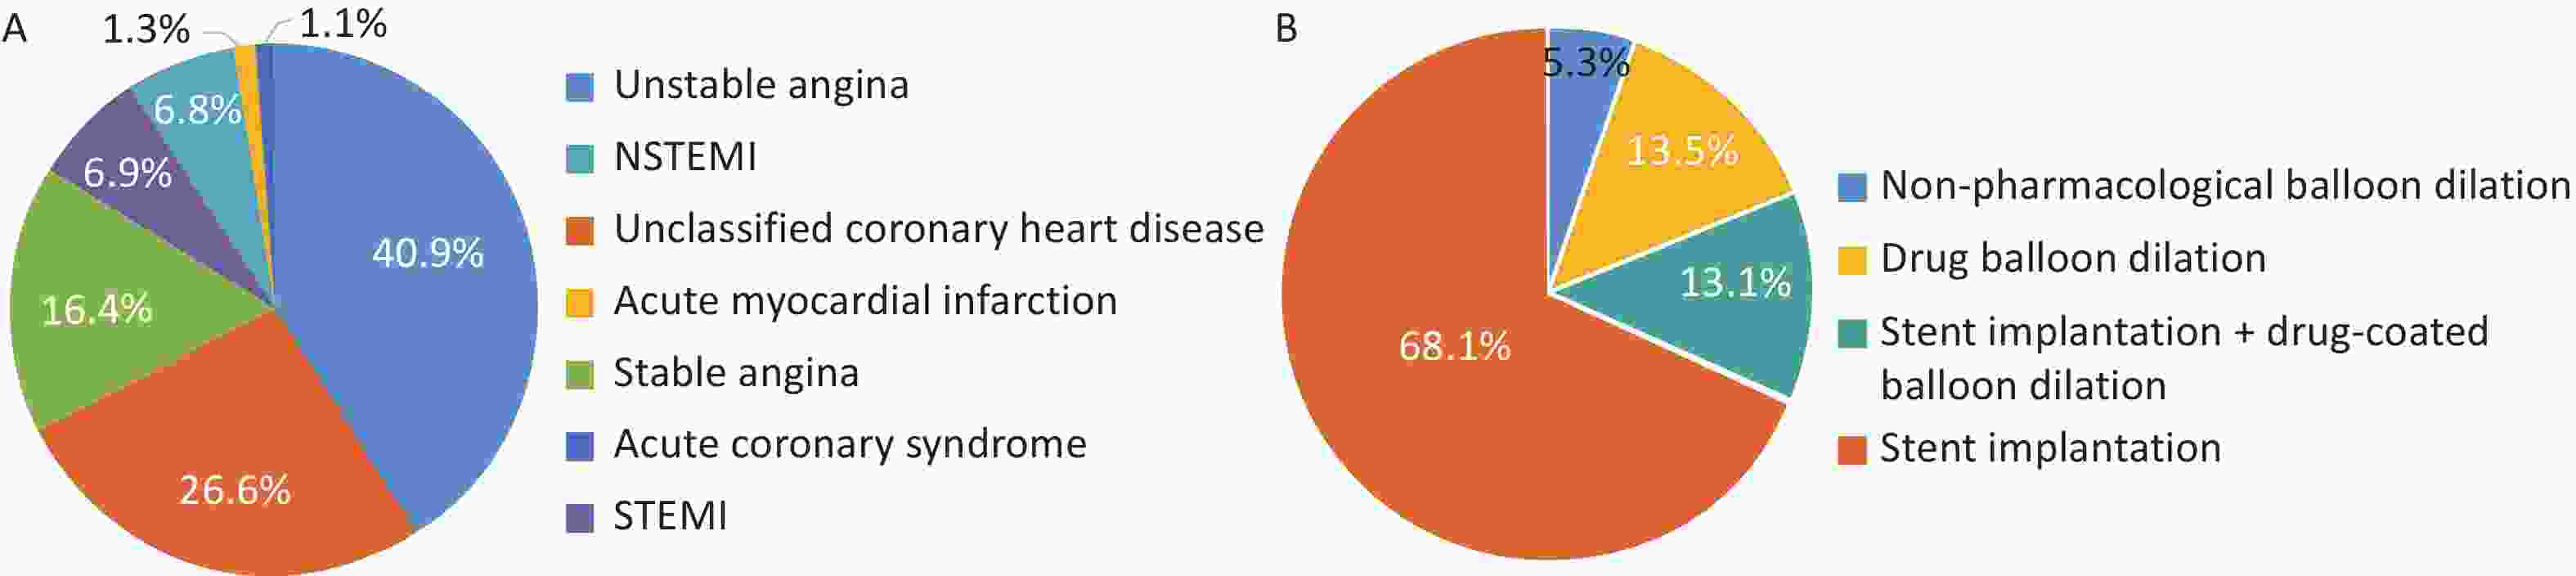
Figure 19. Proportion of major diagnostic classifications among hospitalized patients with coronary heart disease discharged in 2024 (A) and distribution of coronary interventional therapy types (B). NSTEMI: Non-ST-segment elevation myocardial infarction; STEMI: ST-segment elevation myocardial infarction.
In 2024, 2.211 million patients (25.2% of coronary heart disease admissions) underwent PCI, and 2.290 million (26.1%) underwent diagnostic coronary angiography alone. Among those treated with PCI, simple stent implantation was most common (68.1%), and non-drug balloon angioplasty was least common (5.3%) (Figure 19B).
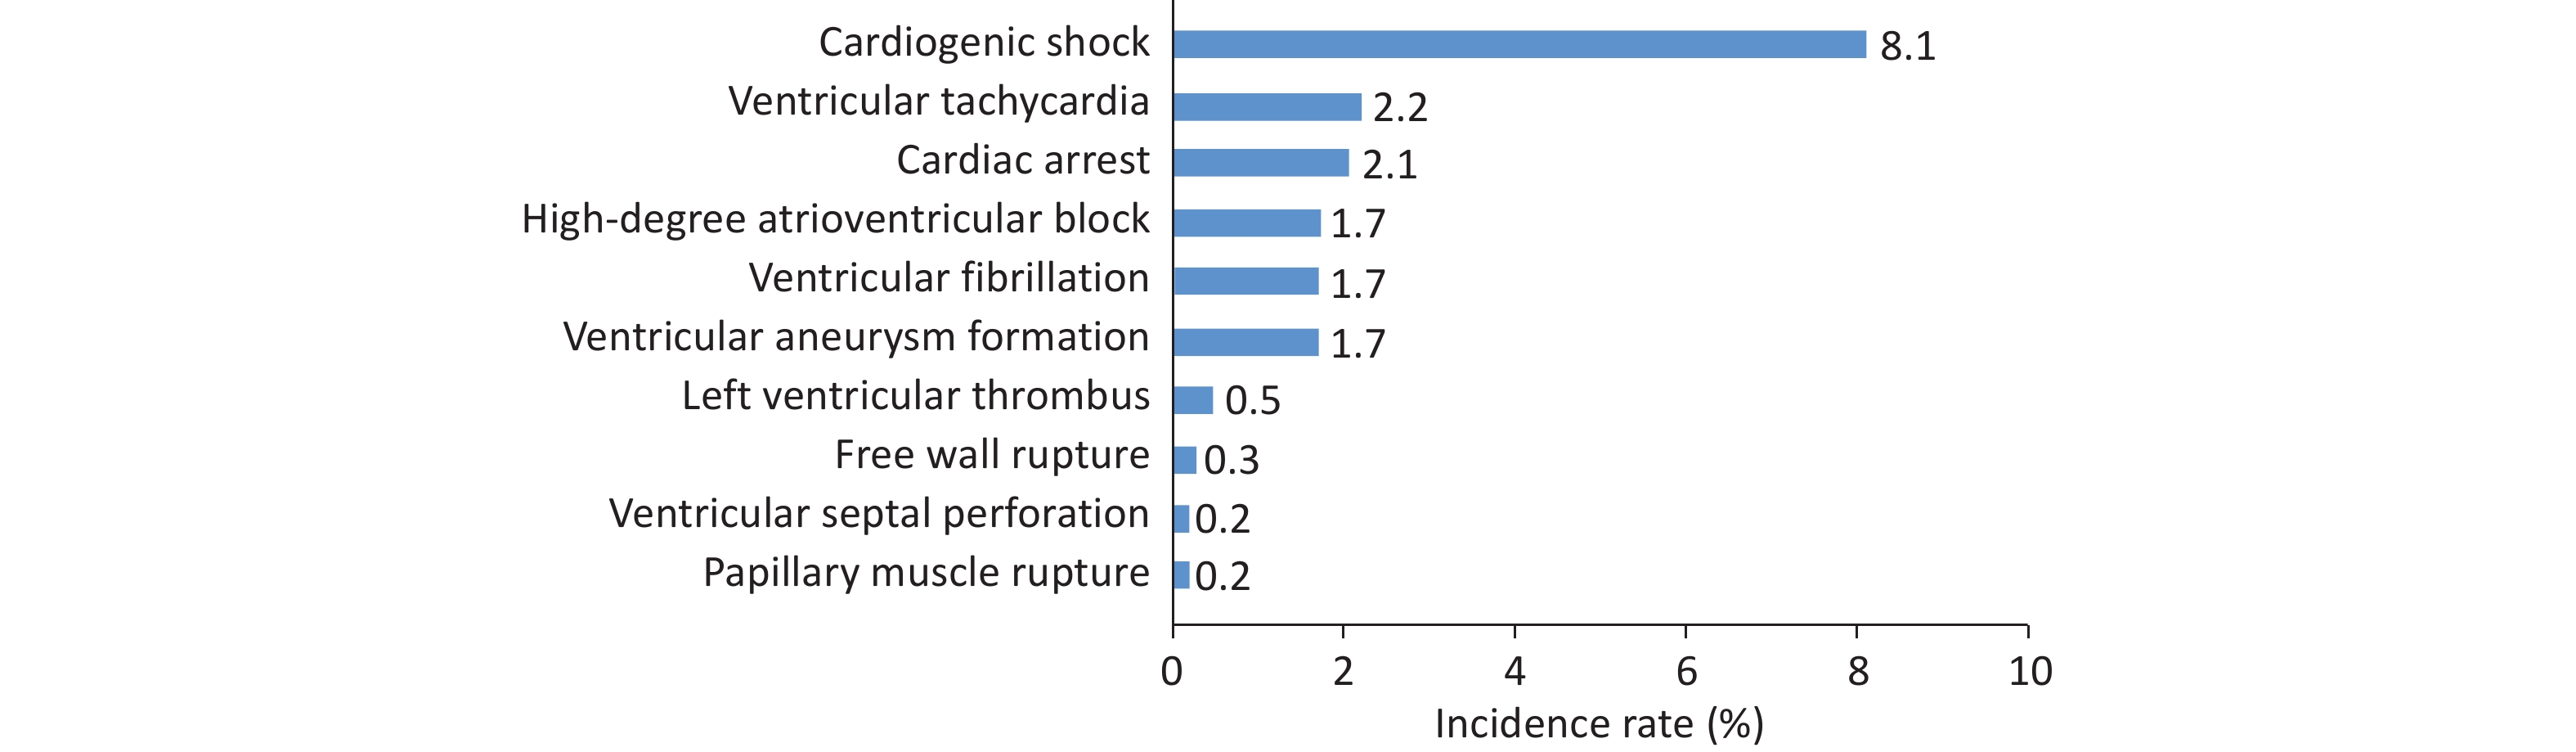
In 2024, there were 1.324 million AMI admissions (an increase of 102,000 from 2023), of which ST-elevation MI (STEMI) accounted for 45.4%, non-STEMI (NSTEMI) for 45.9%, and unspecified AMI for 8.7%. Among AMI patients, 8.1% had cardiogenic shock and 6.0% had malignant arrhythmias (including ventricular tachycardia, ventricular fibrillation, and cardiac arrest) (Figure 20). The in-hospital mortality rate for AMI was 3.6%, and the non-recovery discharge rate (death or discharge against medical advice) was 9.9% (males: 3.0% mortality, 8.8% non-recovery; females: 5.1% mortality, 12.5% non-recovery).
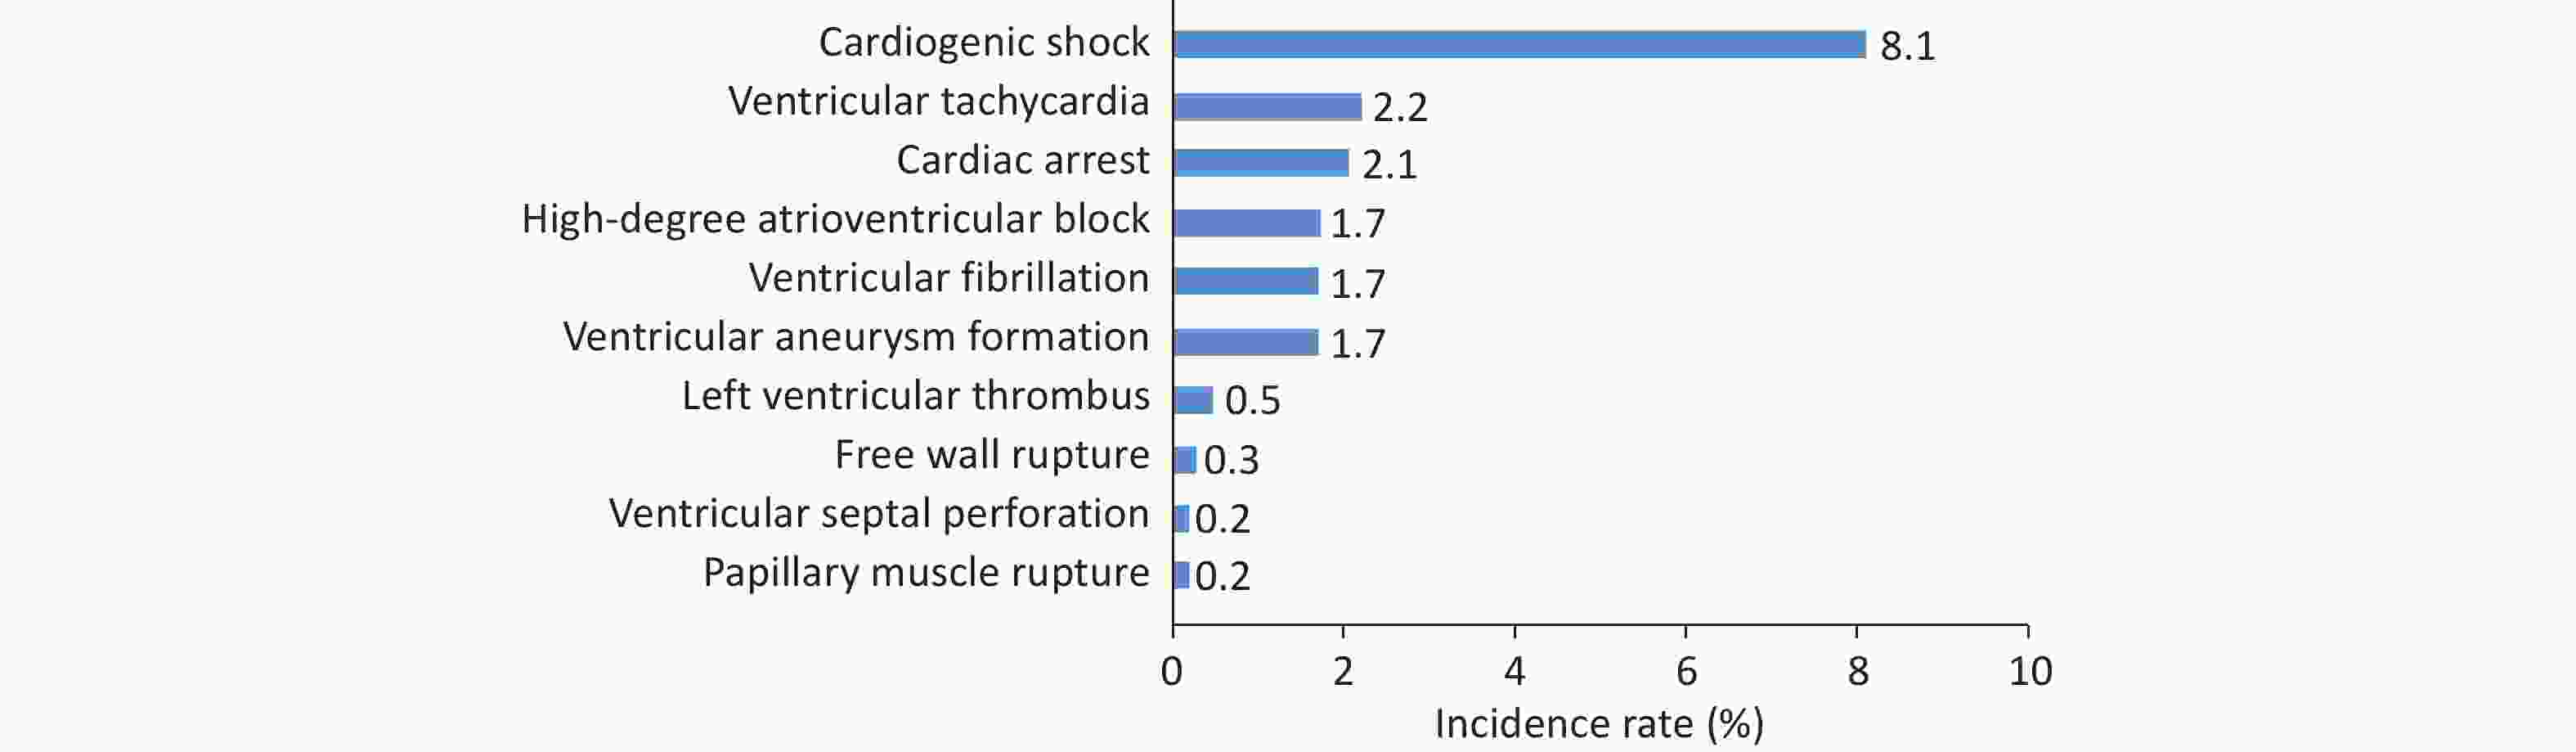
Figure 20. Incidence of complications among hospitalized patients with acute myocardial infarction in 2024.
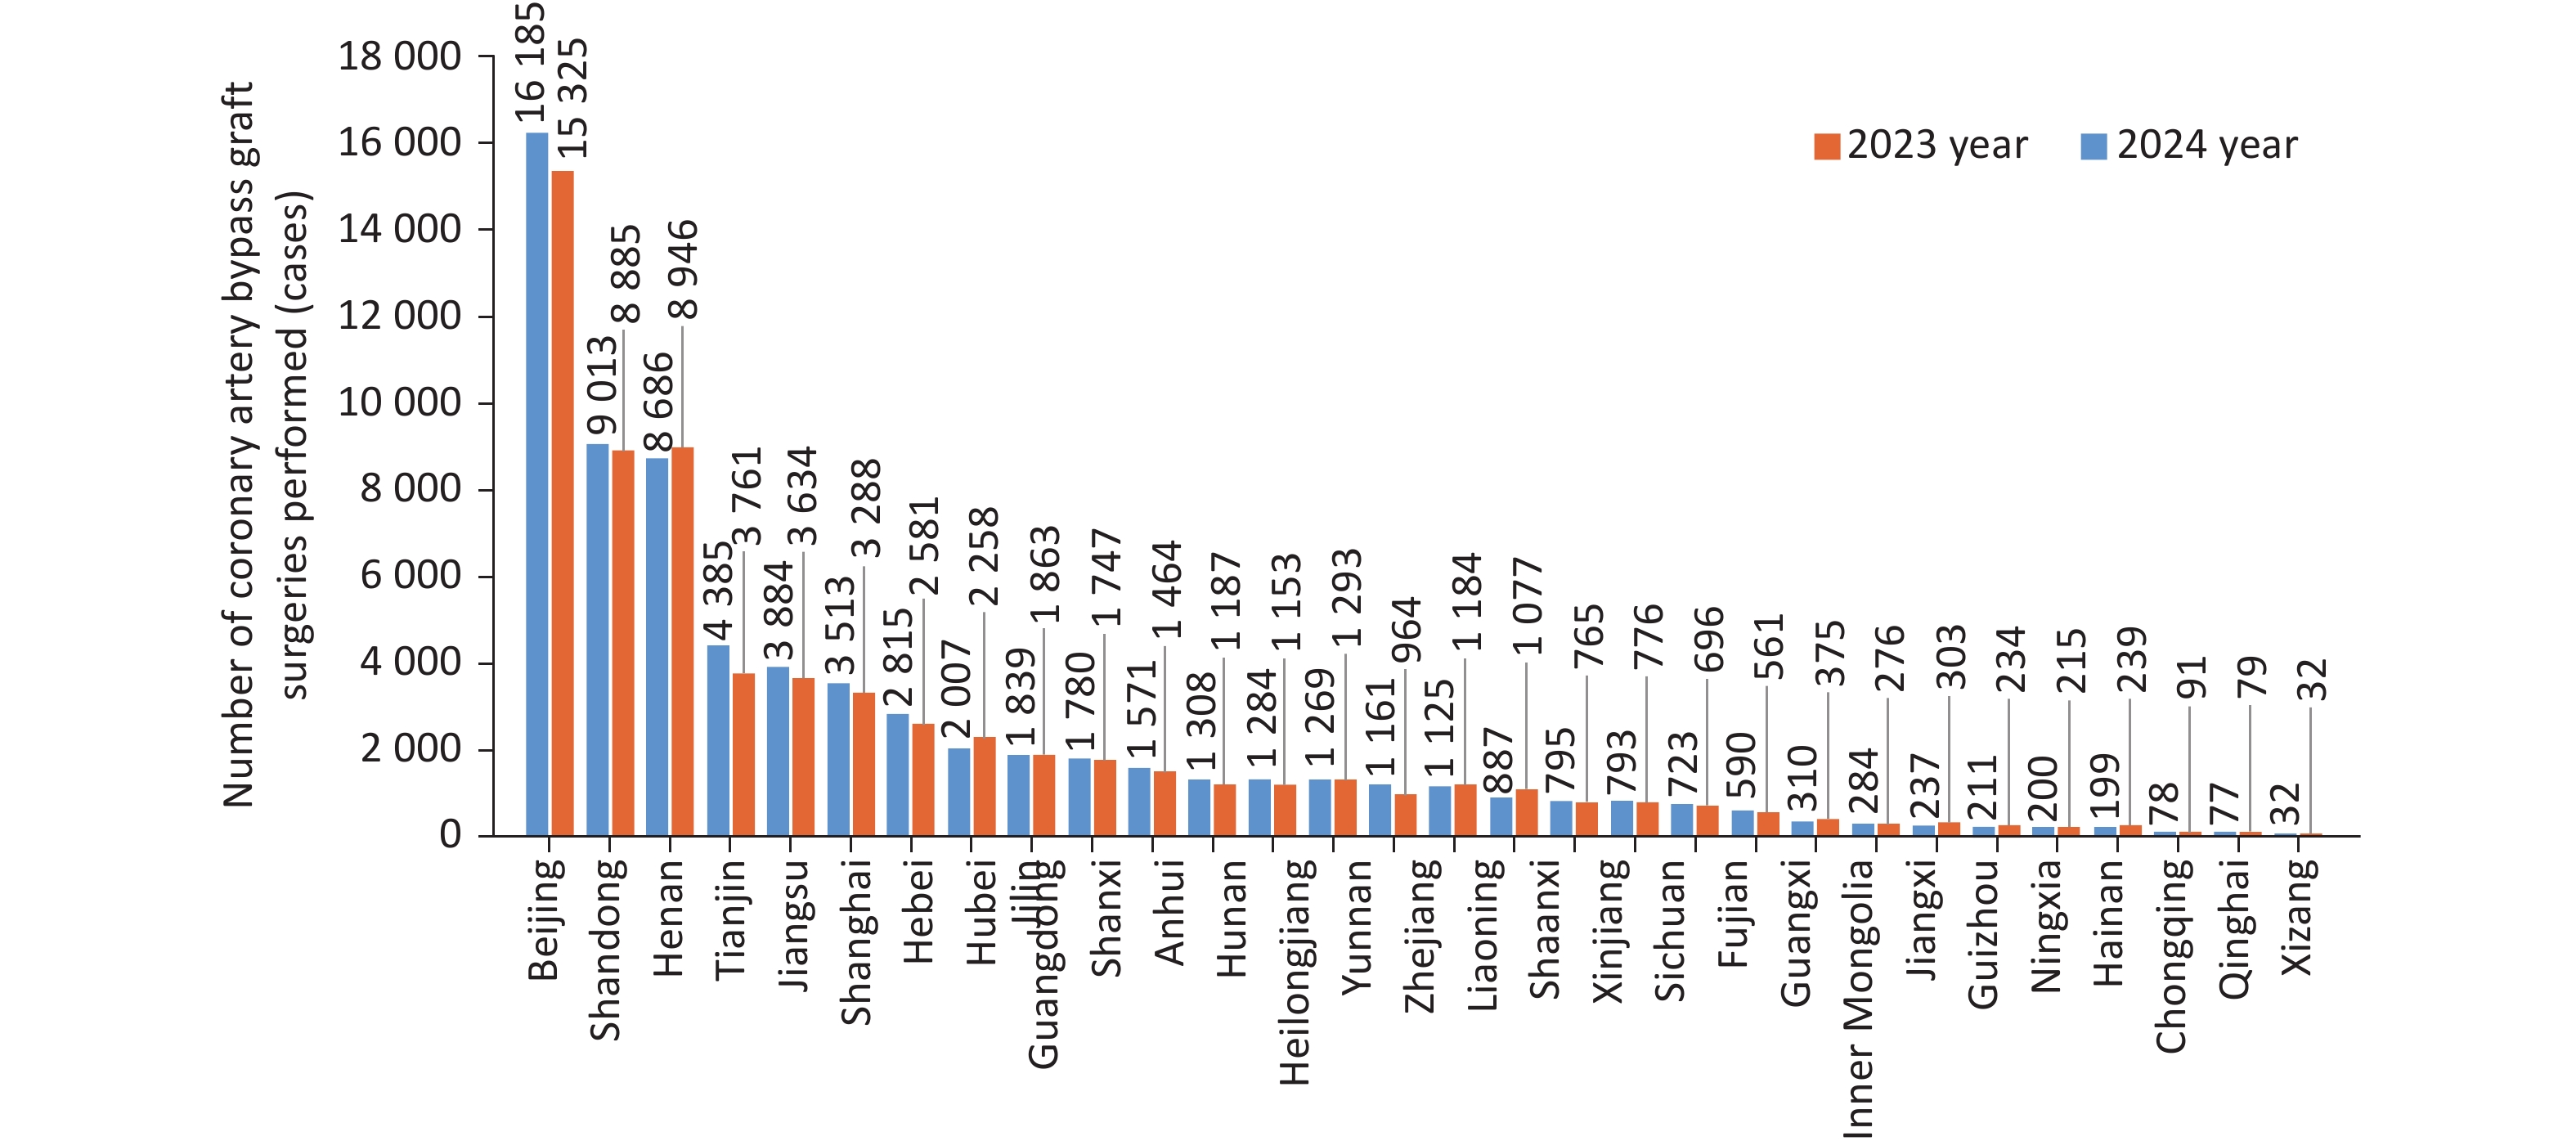
Among coronary heart disease patients undergoing PCI, 18.0% received intravascular ultrasound (IVUS), 3.2% received optical coherence tomography (OCT), 1.4% received fractional flow reserve/quantitative flow ratio (FFR/QFR) assessment, and 0.8% received rotational atherectomy. The in-hospital mortality rate for PCI patients was 0.6%, with a non-recovery discharge rate of 2.0% (males: 0.5% mortality, 2.0% non-recovery; females: 0.7% mortality, 2.0% non-recovery). For those undergoing diagnostic angiography alone, mortality was 0.1%, and the non-recovery discharge rate was 1.5%. In 2024, 718 hospitals performed at least one CABG procedure, with > 67,000 isolated CABG cases. CABG volume varied substantially across provinces, autonomous regions, and municipalities, with the top three performing 52% of all procedures (Figure 21).
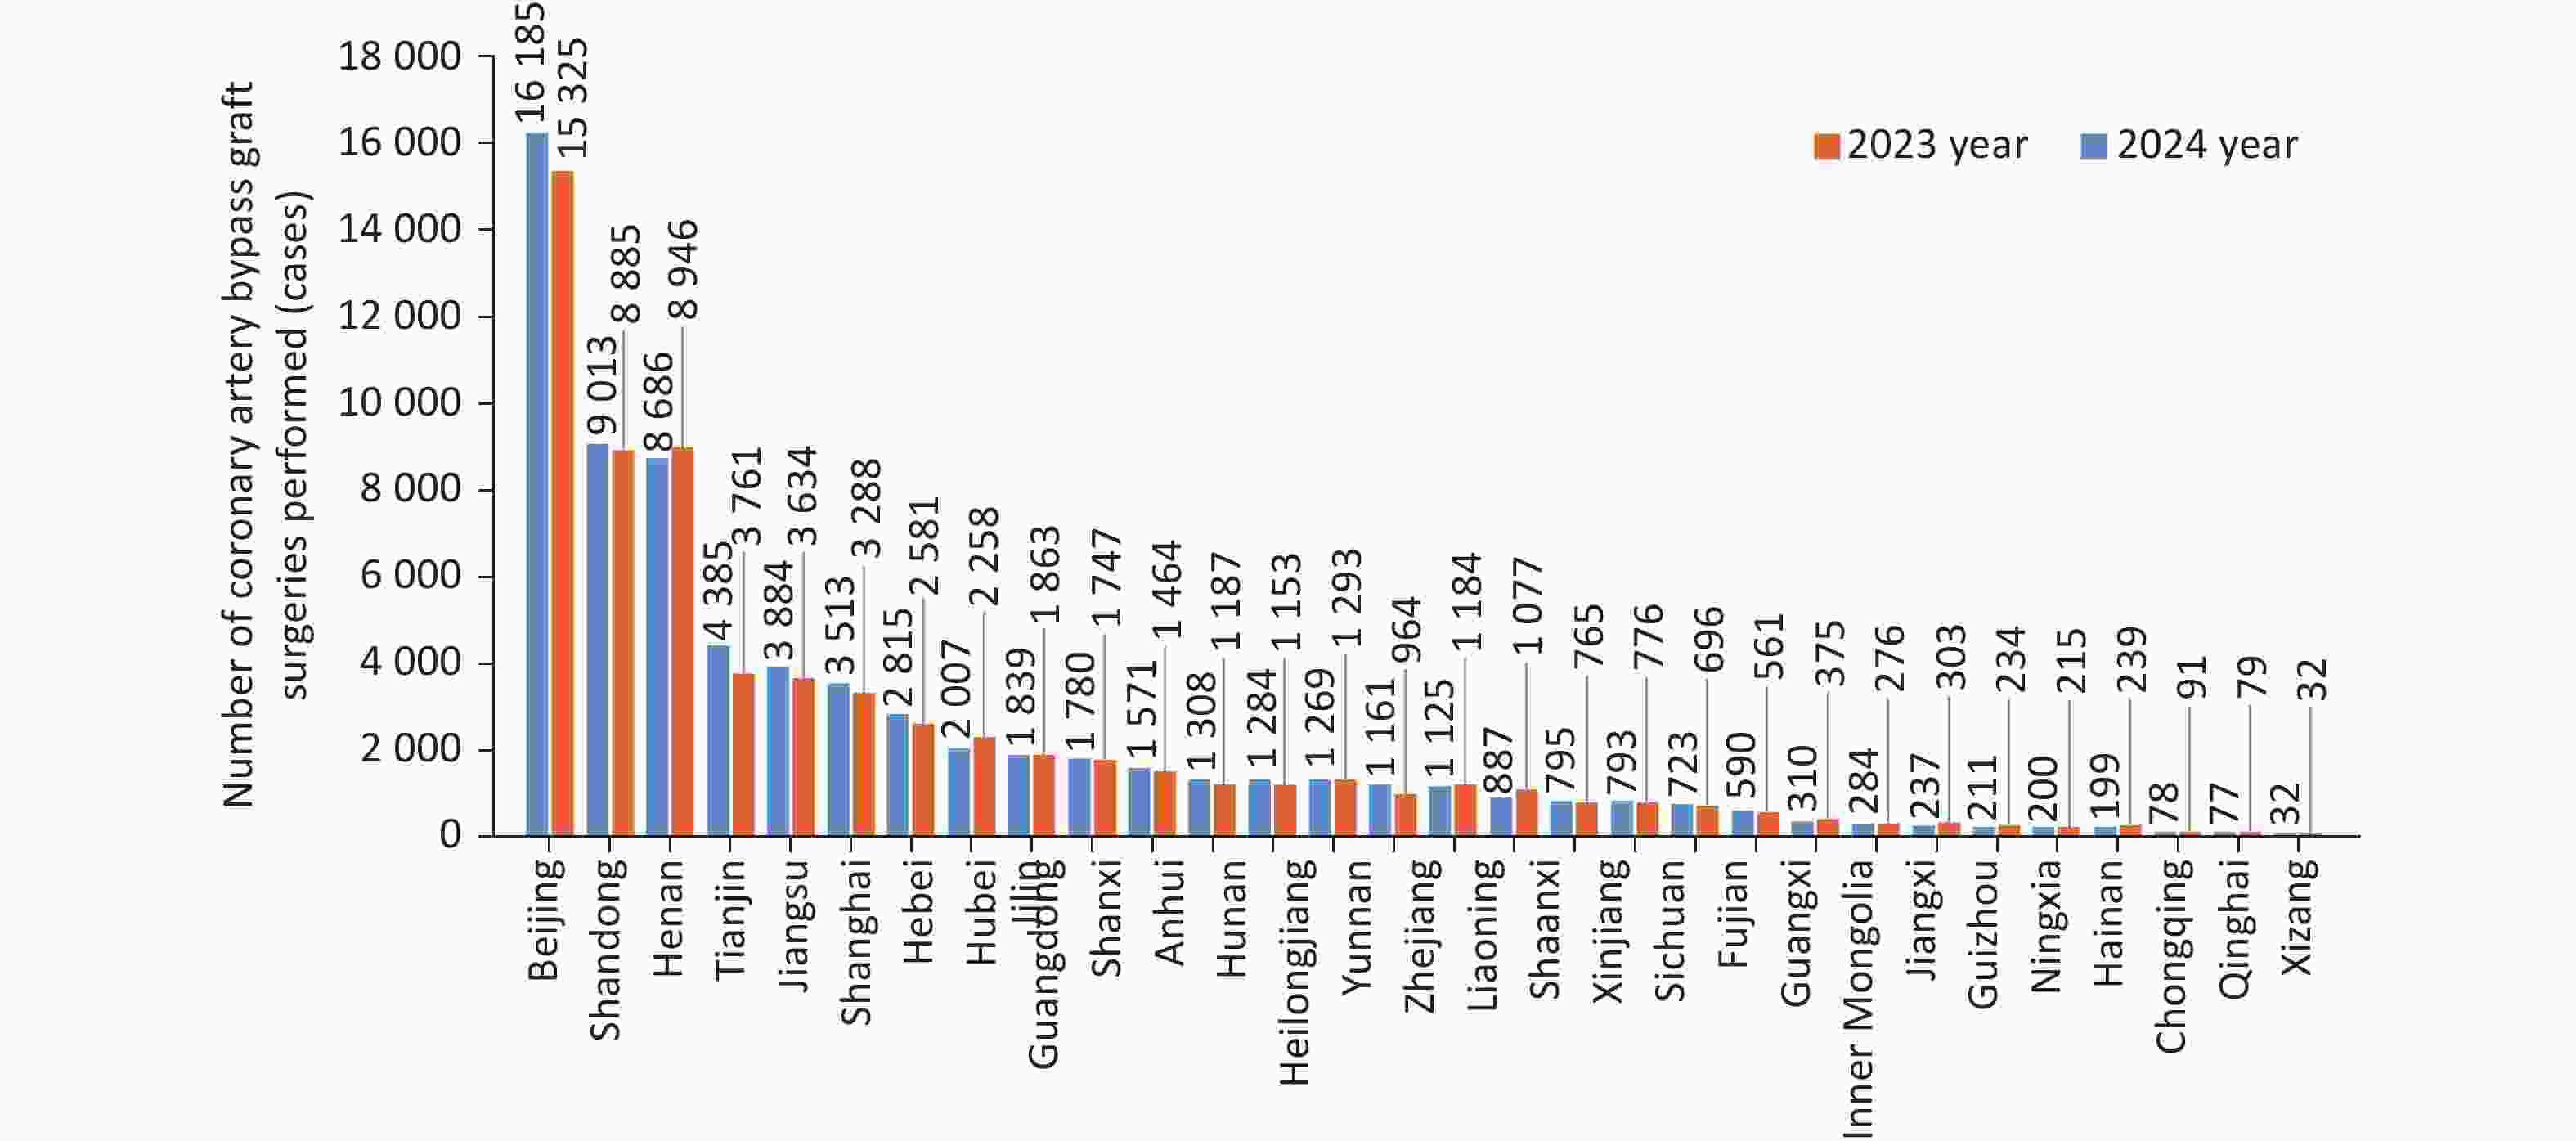
Figure 21. Numbers of coronary artery bypass graft procedures in 30 provinces, autonomous regions, and municipalities directly under the central government of China in 2023 and 2024.
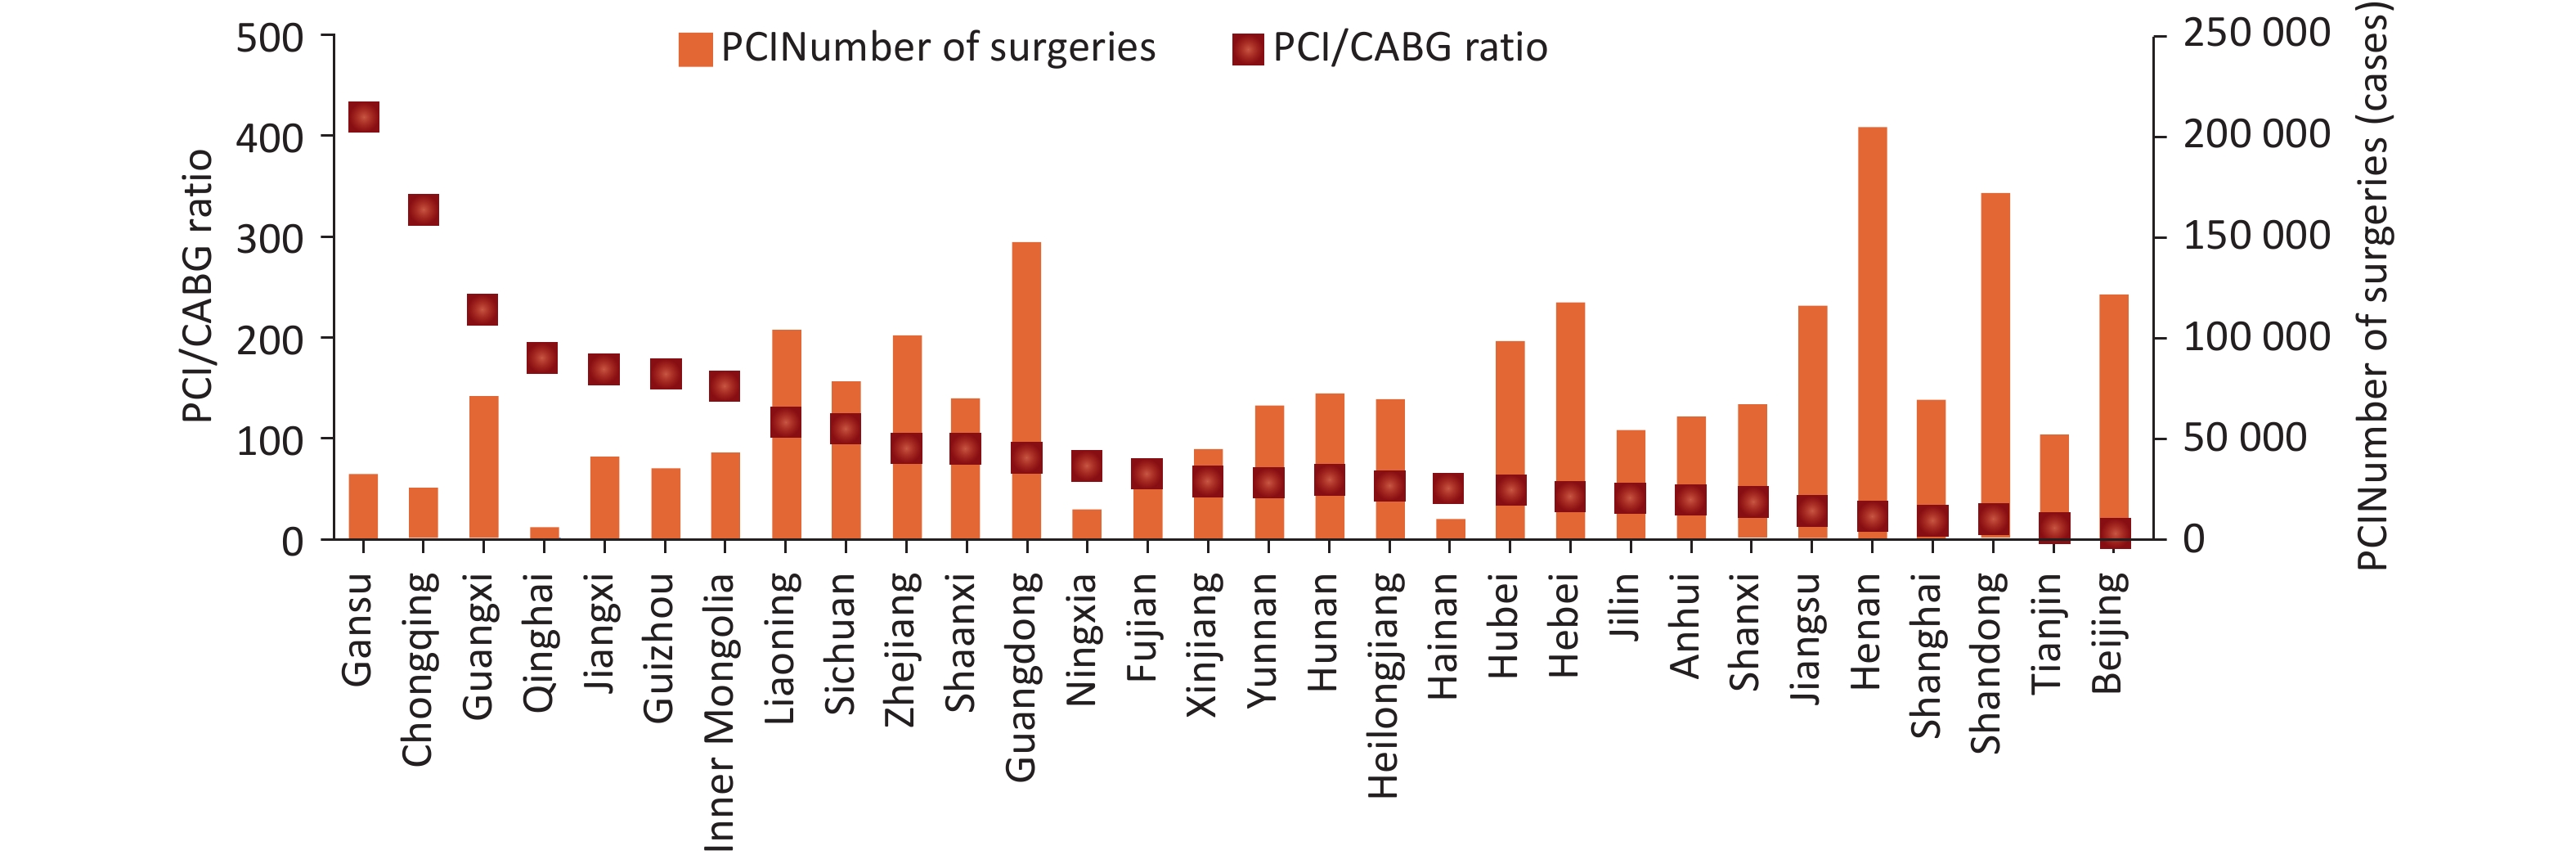
The mean age of CABG patients was 63.3 ± 8.9 years; 75.2% were aged 55–74, and 8.0% were ≥ 75 years. Hypertension (63.6%), diabetes (41.2%), and stroke (34.0%) were the most common comorbidities. The in-hospital mortality for isolated CABG was 1.1%, and the non-recovery discharge rate was 2.2%. The nationwide PCI-to-CABG ratio was 30.8:1, with a 55-fold difference between the highest and lowest provinces, autonomous regions, and municipalities (Figure 22).
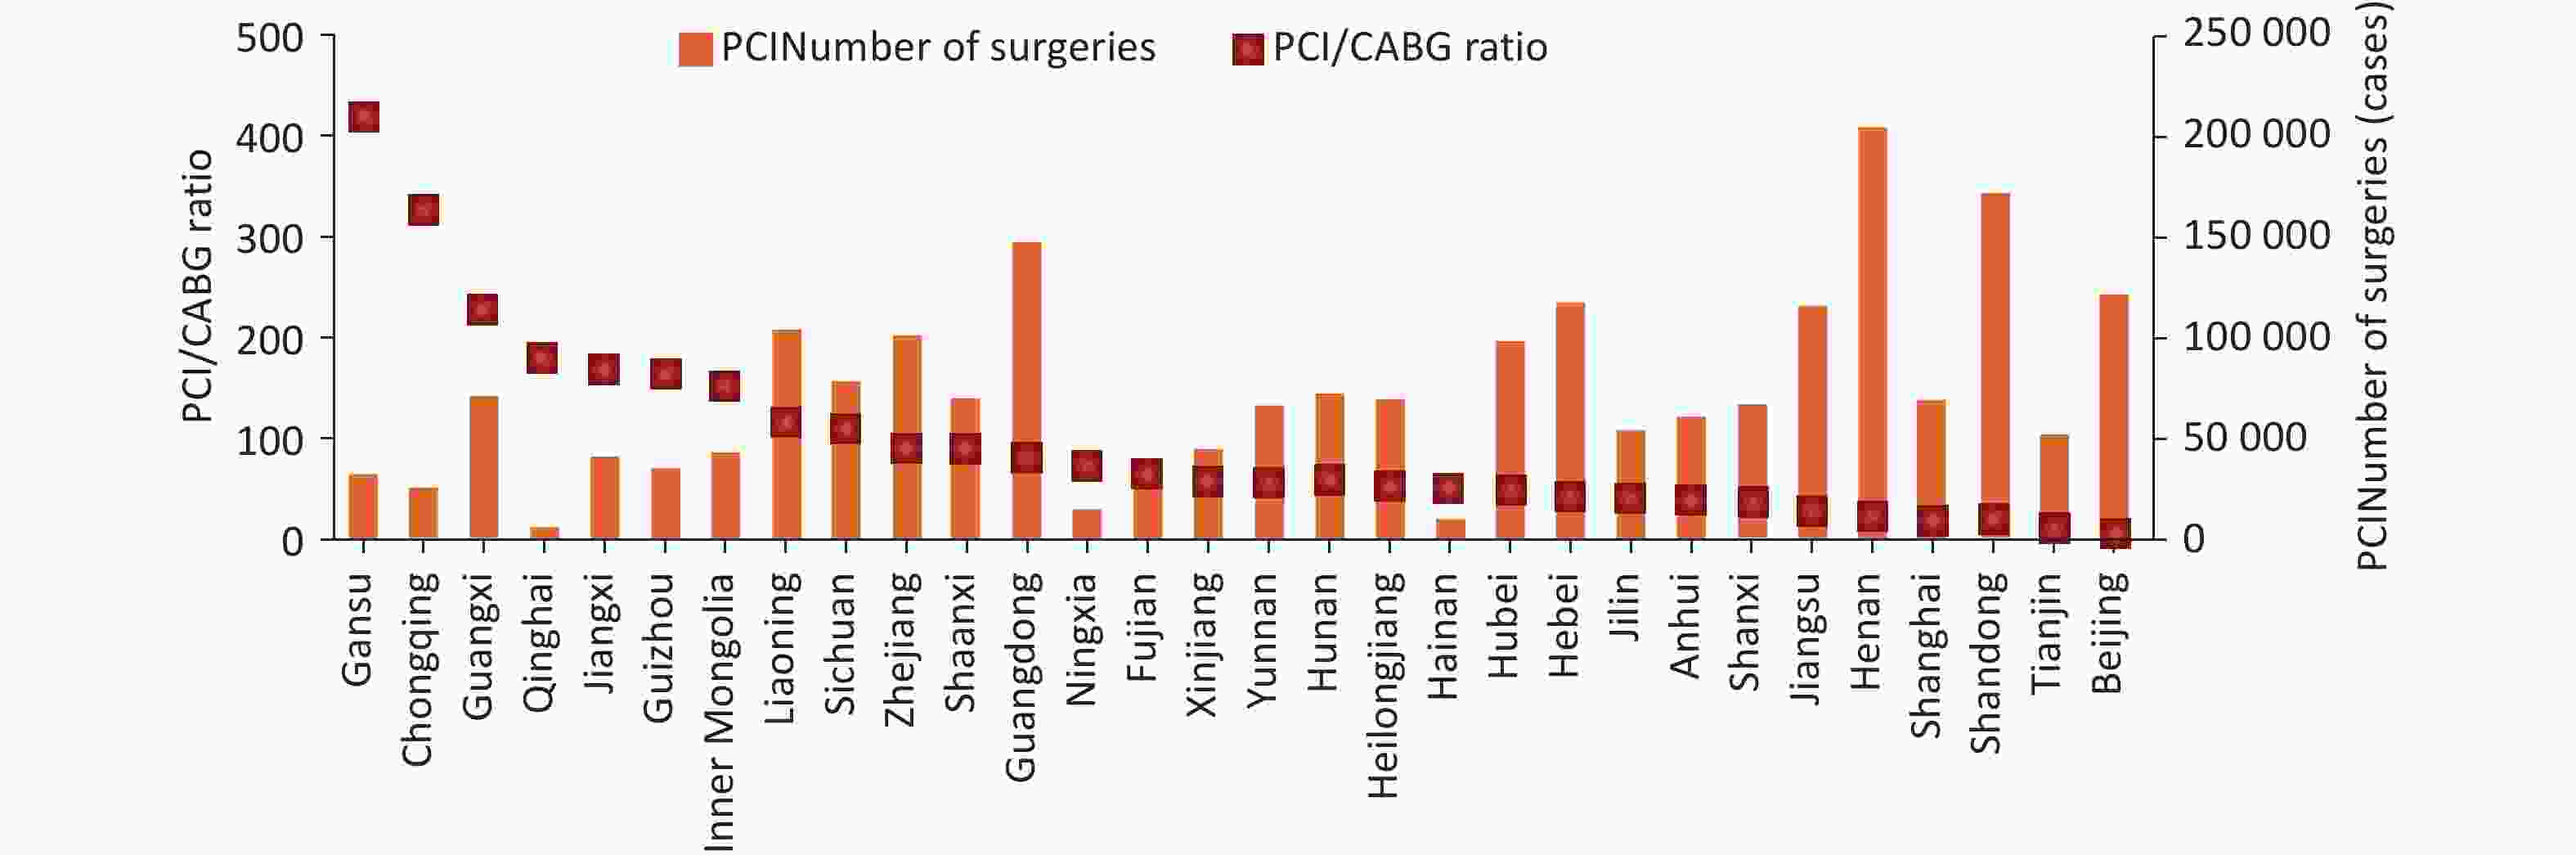
Figure 22. PCI procedures performed and their ratios to CABG procedures in 30 provinces, autonomous regions, and municipalities directly under the central government of China in 2024. PCI: Percutaneous coronary intervention; CABG: Coronary artery bypass grafting.
-
HQMS data for 2024 showed that 8,367 hospitals provided diagnostic and treatment services for arrhythmias (2,720 tertiary, 5,647 secondary), a 10.3% increase from 2023 (tertiary hospitals increased by 235, secondary hospitals increased by 549). There were 12.614 million hospitalizations with a primary or secondary diagnosis of arrhythmia. The top three diagnoses were atrial tachycardia/atrial flutter/atrial fibrillation (36.21%), frequent atrial premature beats (17.86%), and frequent ventricular premature beats (16.75%) (Figure 23). Atrial arrhythmias accounted for 54.1% of diagnoses. Atrial fibrillation was diagnosed in 5.116 million hospitalizations, and 82.7% of these patients were aged ≥ 65 years (≥ 65 years), reflecting China's demographic aging.
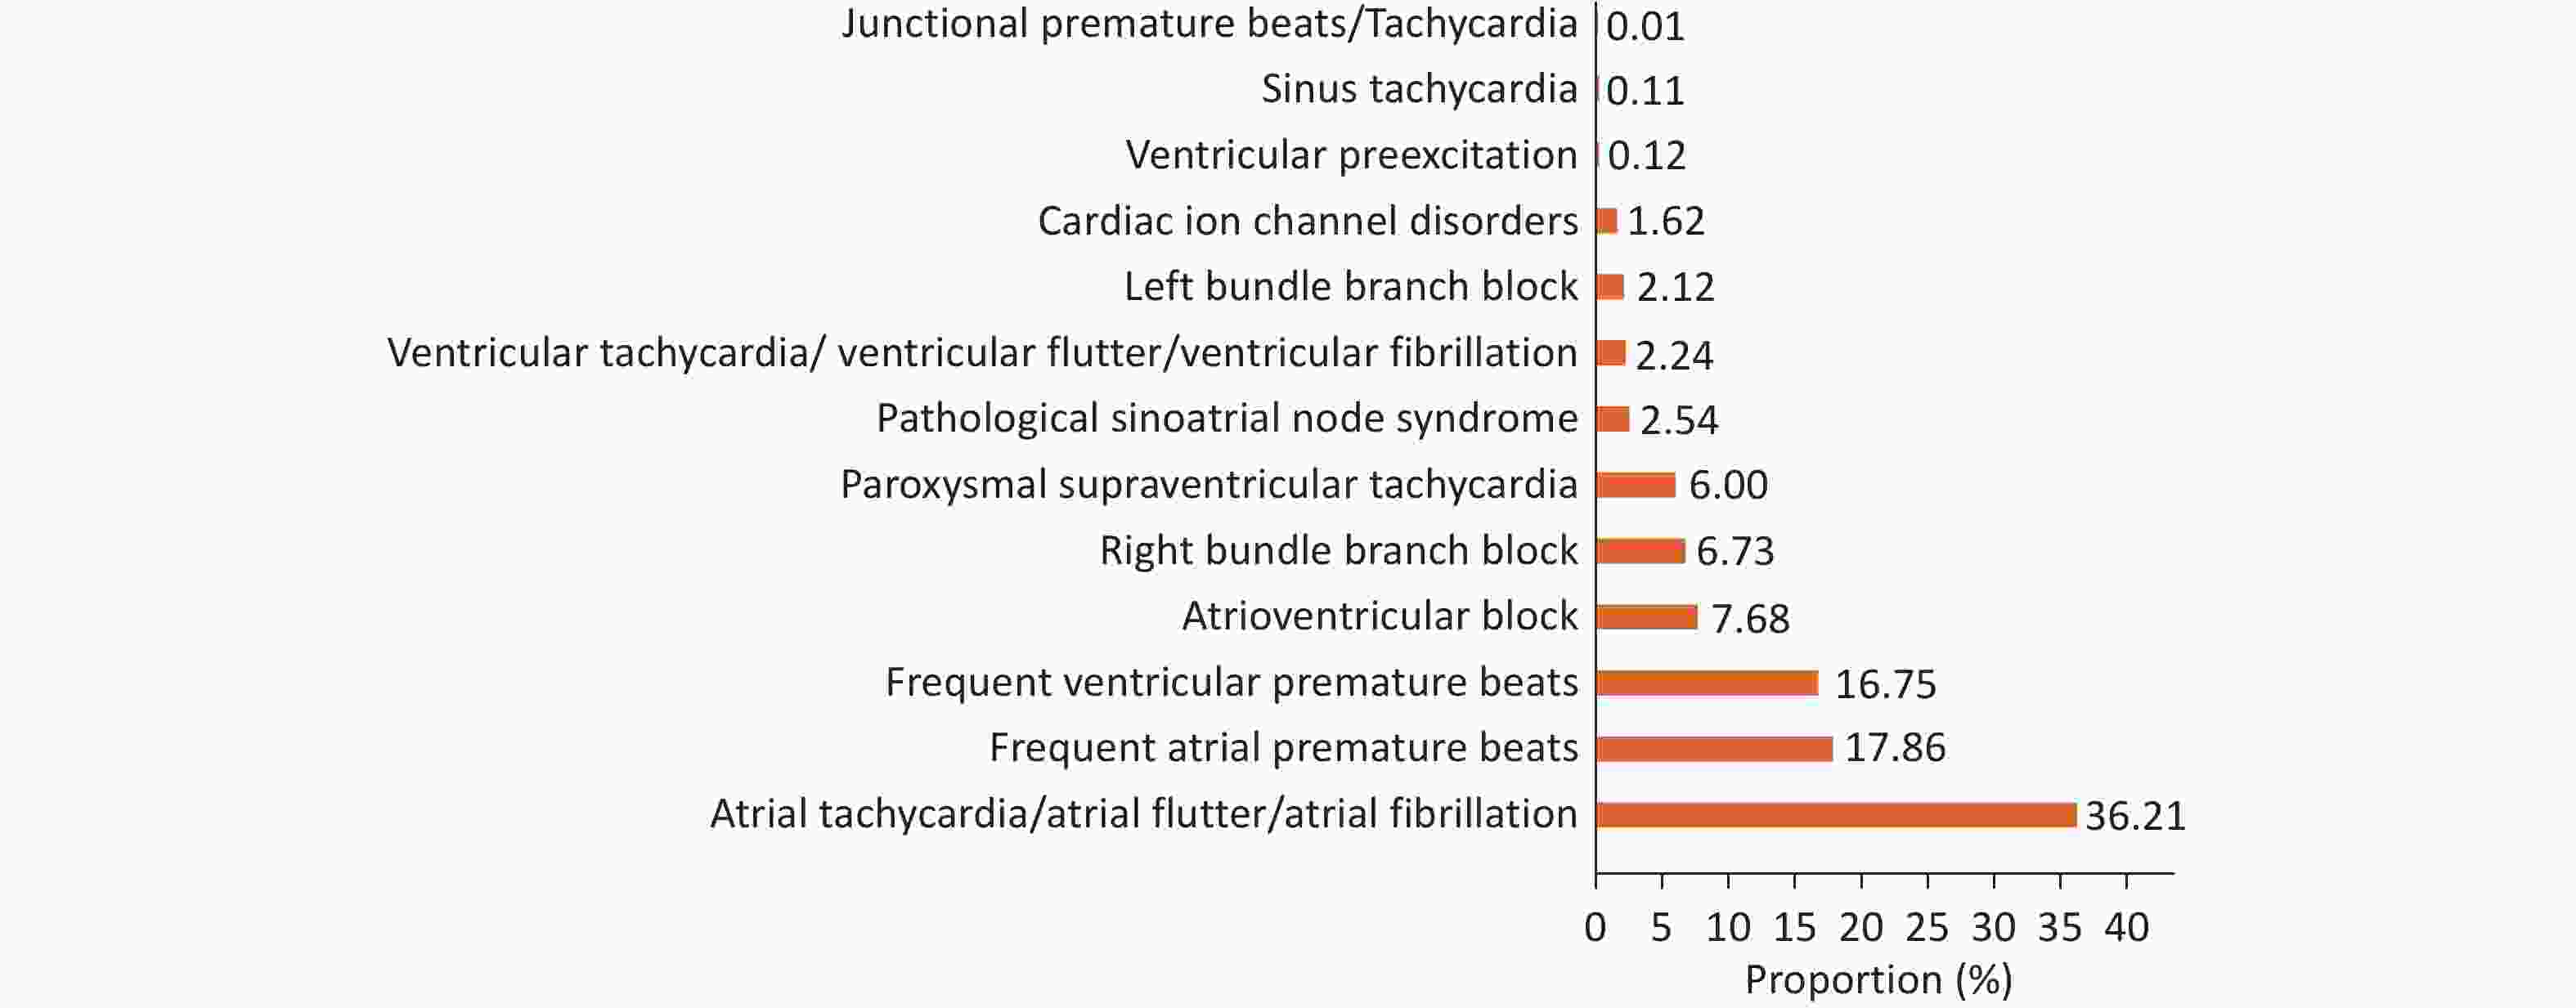
Figure 23. Proportion of arrhythmia diagnoses among hospitalized patients with arrhythmias in 2024.
In 2024, approximately 388,000 ablation procedures were performed in hospitalized patients with arrhythmias, accounting for 3.1% of total arrhythmia admissions. Additionally, > 23,000 left atrial appendage closure procedures and 174,000 device implantations were performed. Cardiac catheter ablation accounted for 380,000 cases (97.6%), and surgical ablation for 9,293 (2.4%). Among catheter ablations, percutaneous catheter radiofrequency ablation accounted for 368,000 cases, percutaneous catheter cryoballoon ablation for 12,000, and others (e.g., pulsed field ablation) for 46 cases. Radiofrequency remains the dominant modality, but the use of pulsed field ablation was emerging.
In 2024, one-stop procedures combining catheter ablation and left atrial appendage closure (the "ablation plus closure" strategy) accounted for 62.6% of all relevant surgeries. In 90.3% (28/31) of regions, one-stop procedures exceeded 50%, and some regions even exceeded 90%, with significant regional variation (Figure 24). Compared with 2023, one-stop procedure proportions increased in 70% (21/30) of regions, indicating a need for more rigorous assessment of indications.
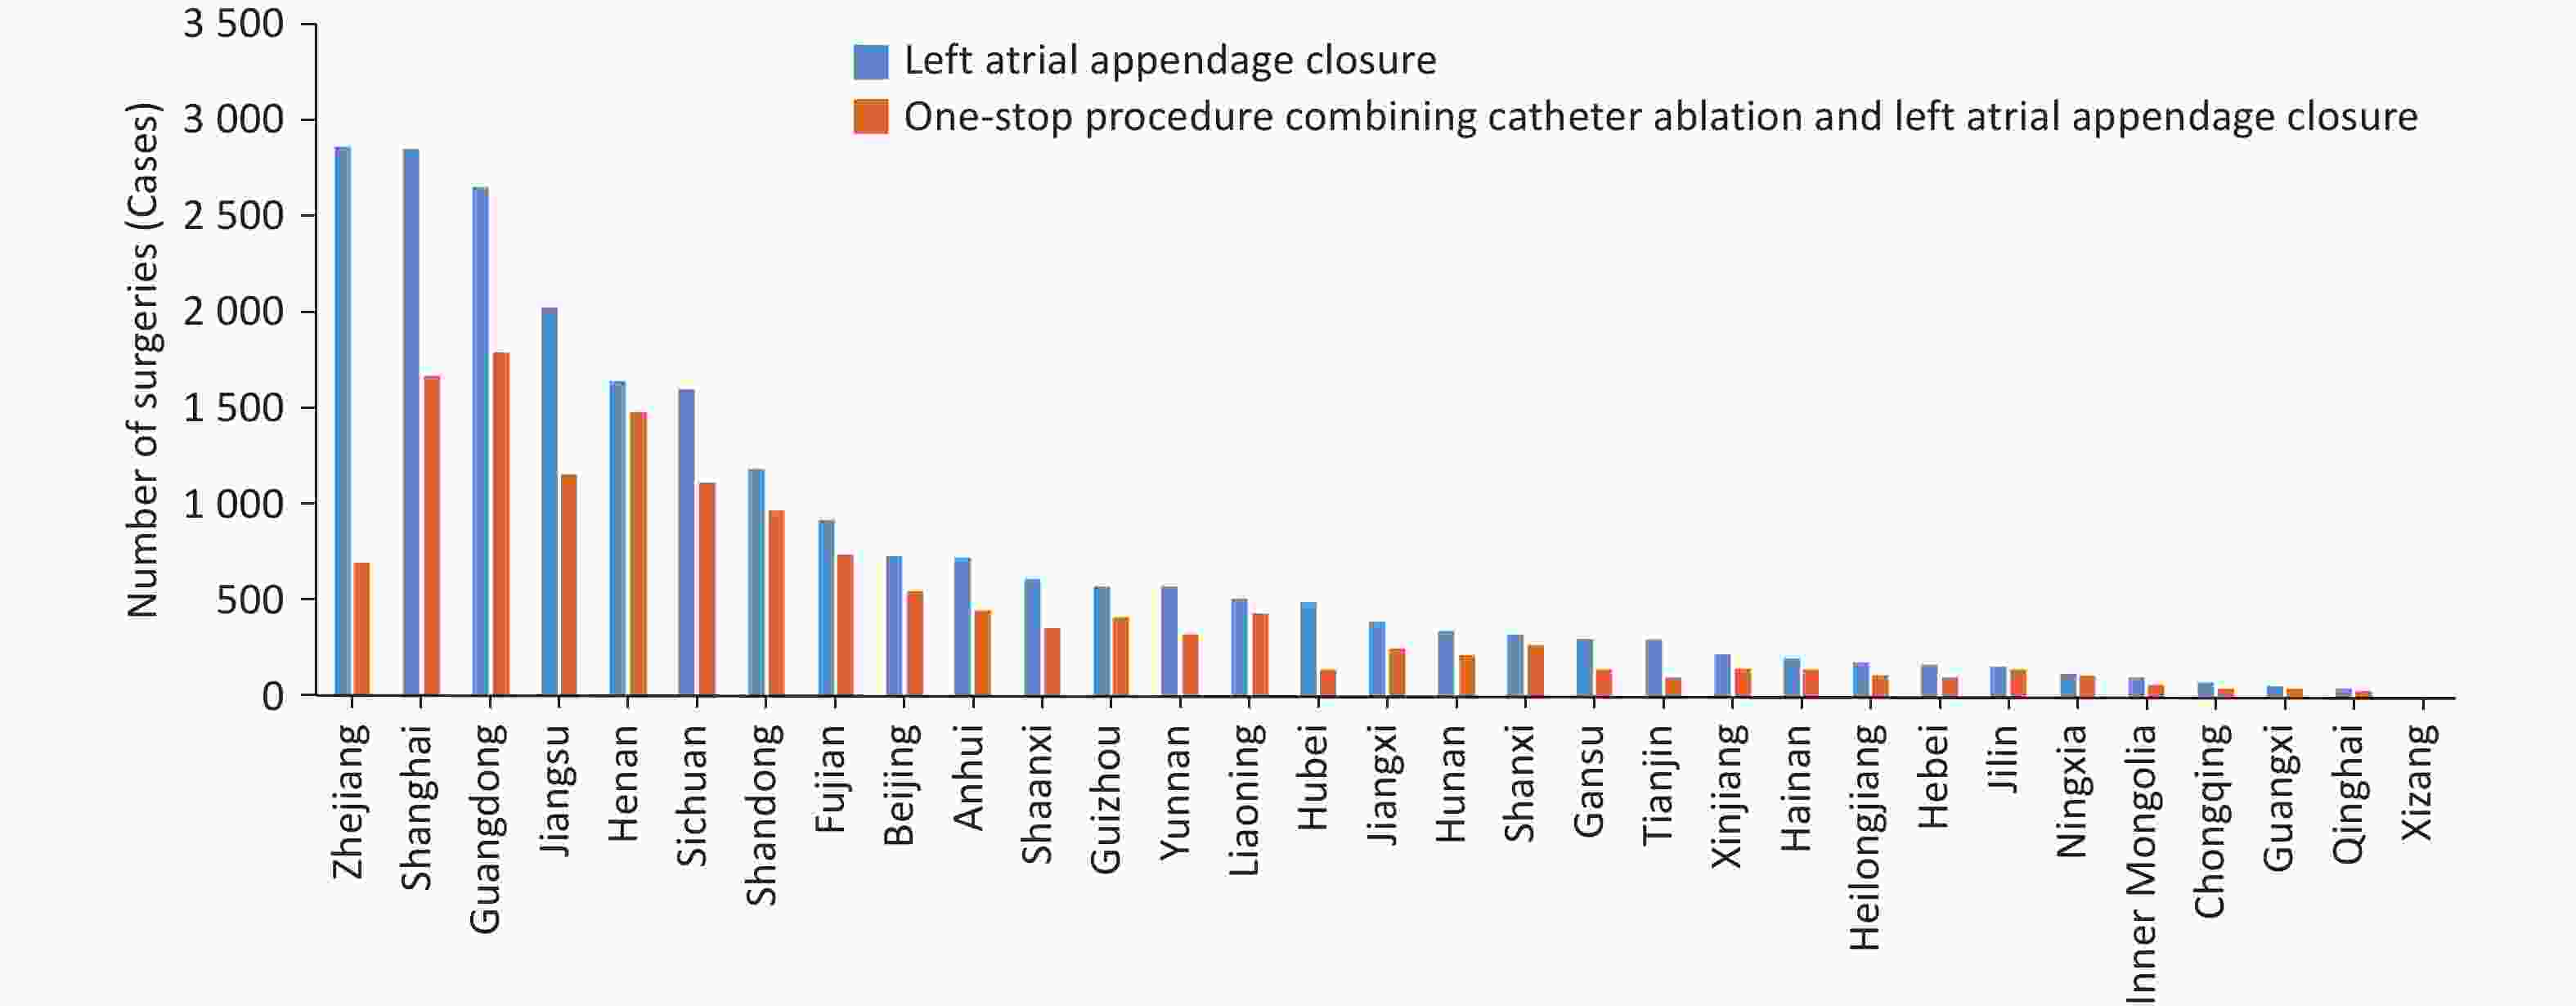
Figure 24. In 2024, the number of one-stop procedures combining catheter ablation with left atrial appendage closure in 31 provinces, autonomous regions, and municipalities directly under China's central government.
Regarding in-hospital mortality, non-recovery discharge, and 30-day readmission rates, the combined ablation and closure procedure demonstrated the worst outcomes, followed by isolated left atrial appendage closure, while catheter ablation yielded the lowest risk values; radiofrequency ablation and cryoballoon ablation had similar outcomes (Figure 25).
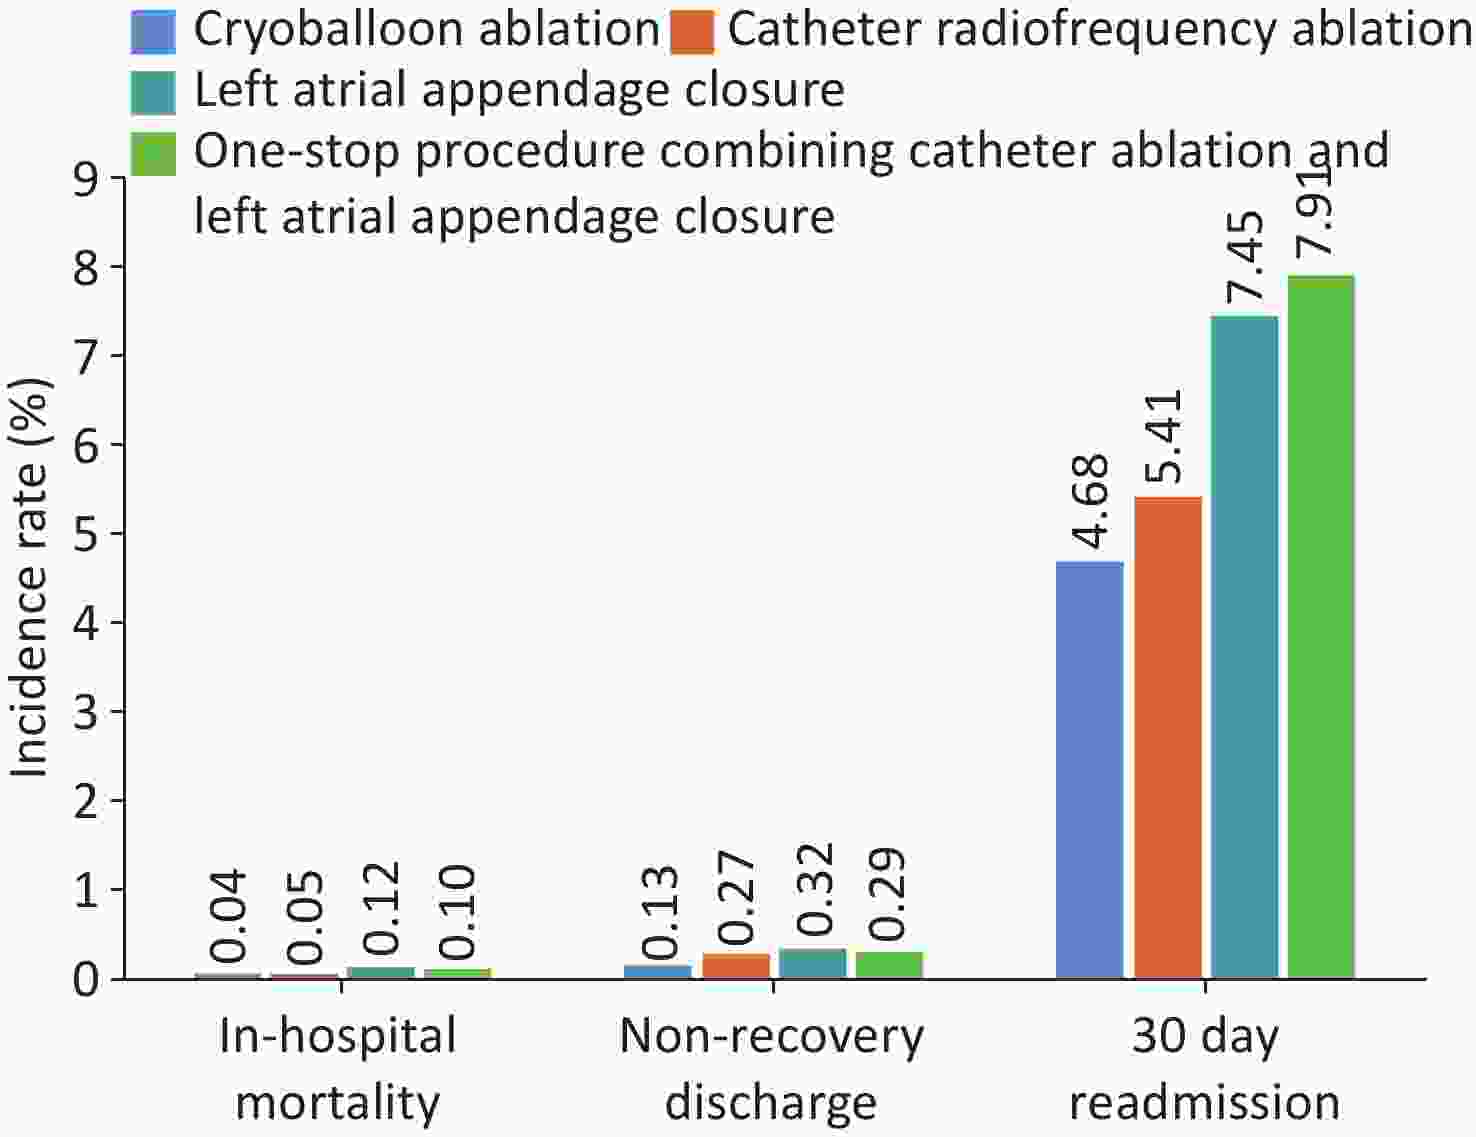
Figure 25. Comparison of clinical outcomes among different procedural approaches for hospitalized patients with atrial fibrillation in 2024.
In 2024, a total of 174,000 device implantations were performed, including dual-chamber pacemakers (110,000), single-chamber pacemakers (21,000), unspecified pacemakers (21,000), implantable cardioverter-defibrillators (ICD, 11,000), cardiac resynchronization therapy defibrillators (CRT-D, 6,587), and cardiac resynchronization therapy pacemakers (CRT, 3,595). Conventional pacemakers comprised over three-quarters of implantations. Compared with 2023, implantations of conventional pacemakers increased by 8.2%, CRT-P/D by 7.4%, and ICD by 15.5% (Figure 26).
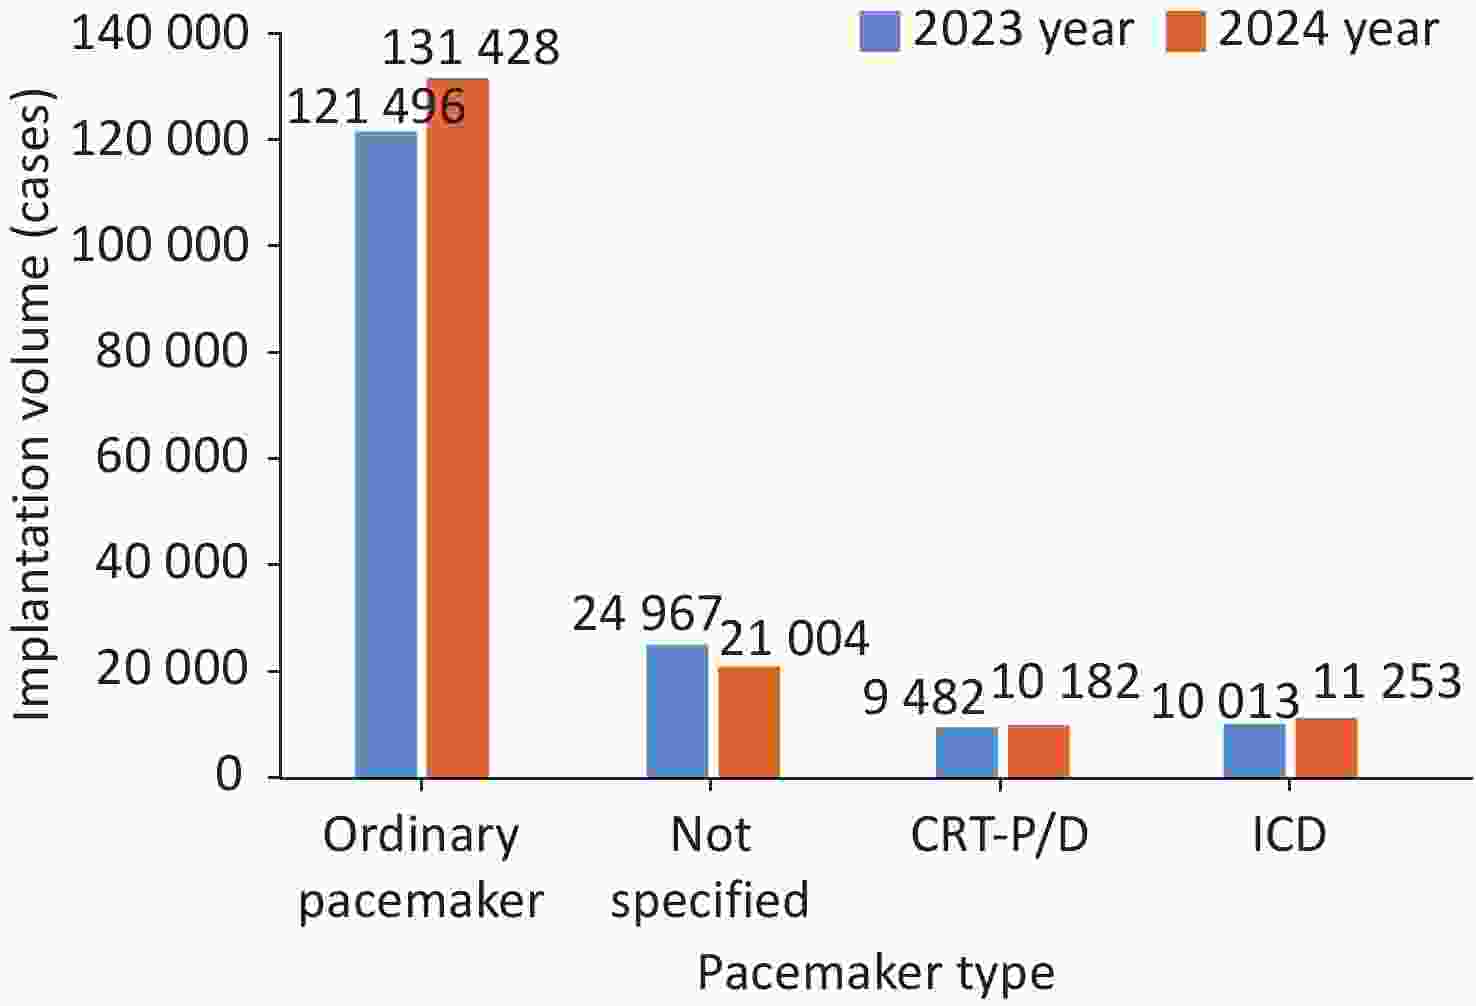
Figure 26. Number of different types of medical device implants in 2023 and 2024. CRT-P/D: cardiac resynchronization therapy pacemaker/defibrillator; ICD: Implantable cardioverter-defibrillator.
Patients who underwent device implantation had low in-hospital mortality (0.30%), non-recovery discharge (0.90%), and 30-day readmission rates (6.27%). There were 2,933 cases of device infection and 1,686 lead extractions. On one hand, the low incidence of post-implantation infection reflects effective infection control during implantation procedures. On the other hand, there exists a numerical mismatch between the volume of device infections and lead extractions, with disproportionately fewer lead extractions performed, indicating that proficiency in managing device-related infections needs to be improved.
There were 252,000 hospitalizations for syncope in 2024; 49.69% remained undiagnosed. Numerous nonstandard diagnostic labels (e.g., cerebral syncope, febrile syncope, syncope and collapse, organic syncope) were noted, indicating a need for improved diagnostic proficiency and coding (Figure 27).
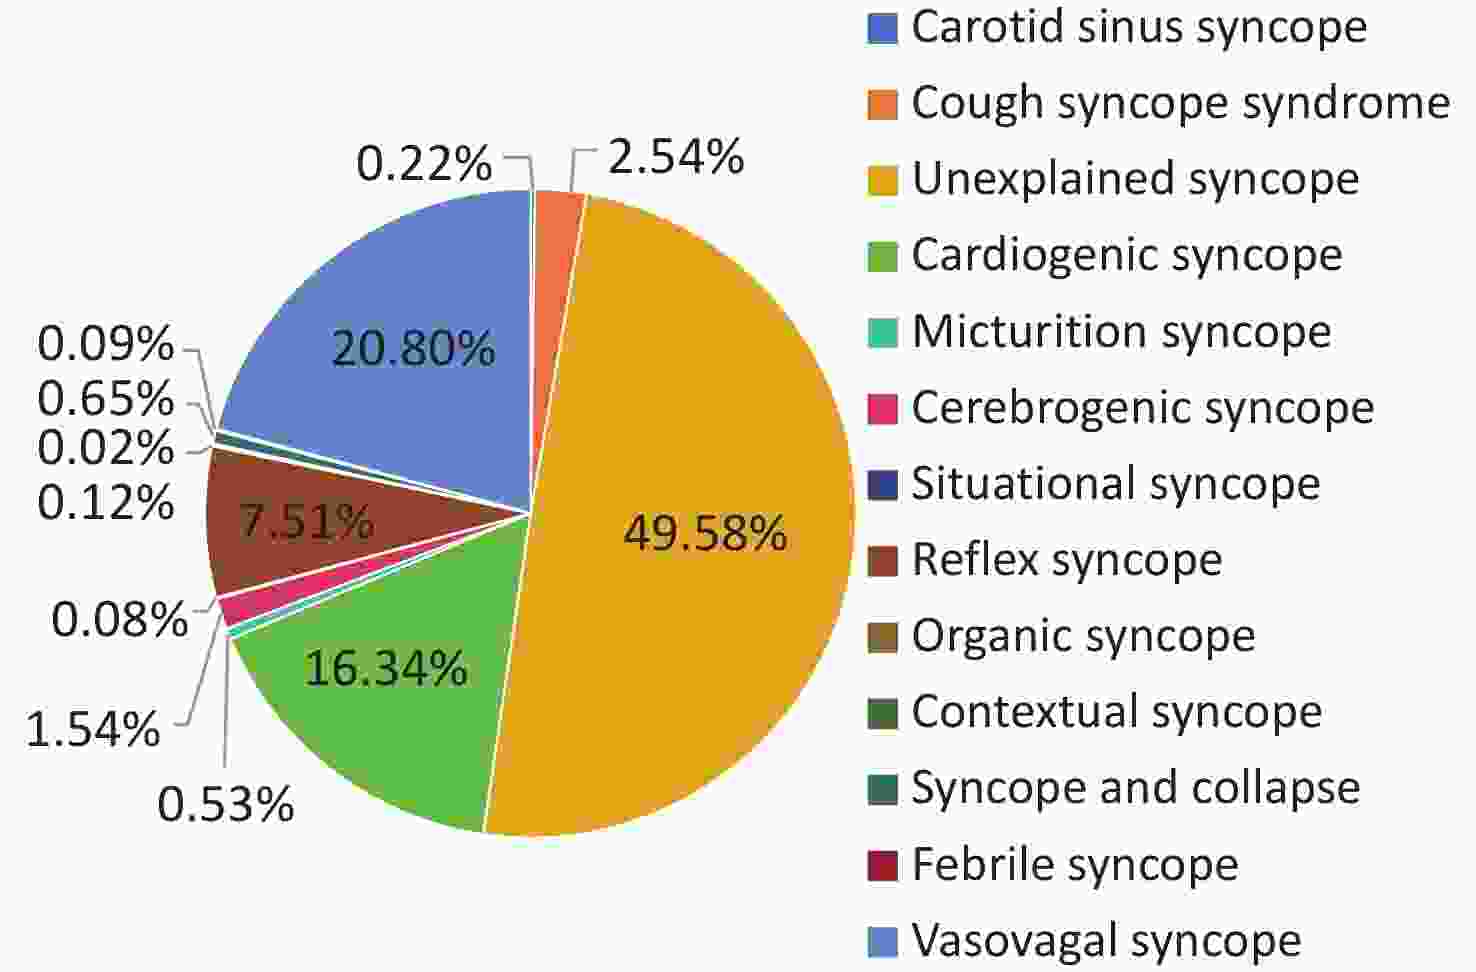
Figure 27. Distribution of etiologic diagnoses of syncope.
-
HQMS data for 2024 showed that, 6,996 hospitals were included in the surveillance system for the admission and treatment of hospitalized patients with valvular heart disease (2,534 tertiary hospitals and 4,462 secondary hospitals). 3.09 million hospitalizations with a primary or secondary diagnosis of valvular heart disease. Mitral valve disease was most common (1.549 million, 50.1%), followed by tricuspid (22.3%), aortic (25.7%), and pulmonary valve disease (1.9%). The top three comorbidities were heart failure (43.7%), coronary heart disease (34.5%), and atrial fibrillation/flutter (23.5%).
-
In 2024, 10,580 isolated surgical aortic valve replacement (SAVR) procedures were performed, with bioprosthetic valves used in 47.1%, and their use was more common among patients > 65 years (Figure 28). SAVR patients had an in-hospital mortality of 1.0% and a non-recovery discharge rate of 2.3%.
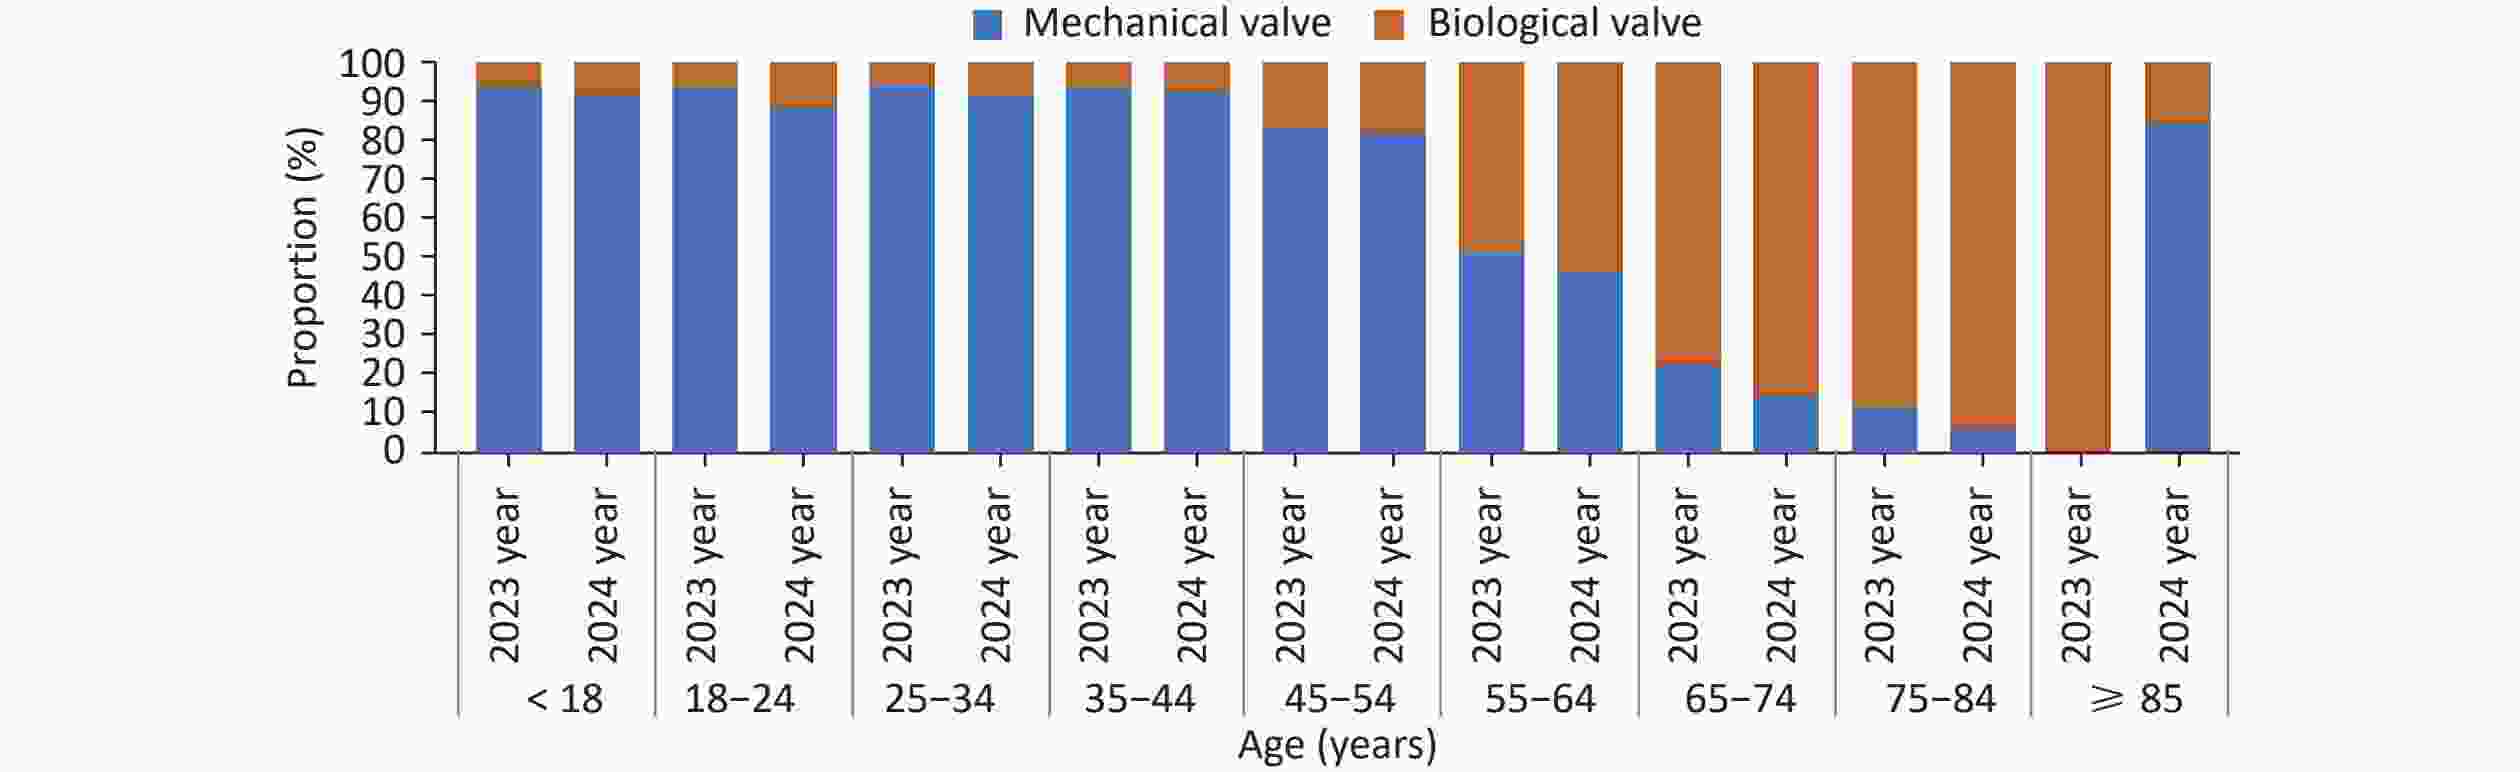
Figure 28. Proportion of valve types used in isolated surgical aortic valve replacement among patients of different age groups in 2023 and 2024.
Transcatheter aortic valve replacement (TAVR) was performed in 11,090 cases, exceeding SAVR (10,580) (Figure 29A), with females accounting for 39.1%. The age distribution of TAVR patients is shown in Figure 29B. The in-hospital mortality for TAVR was 1.4%, and the non-recovery discharge rate was 2.7%.
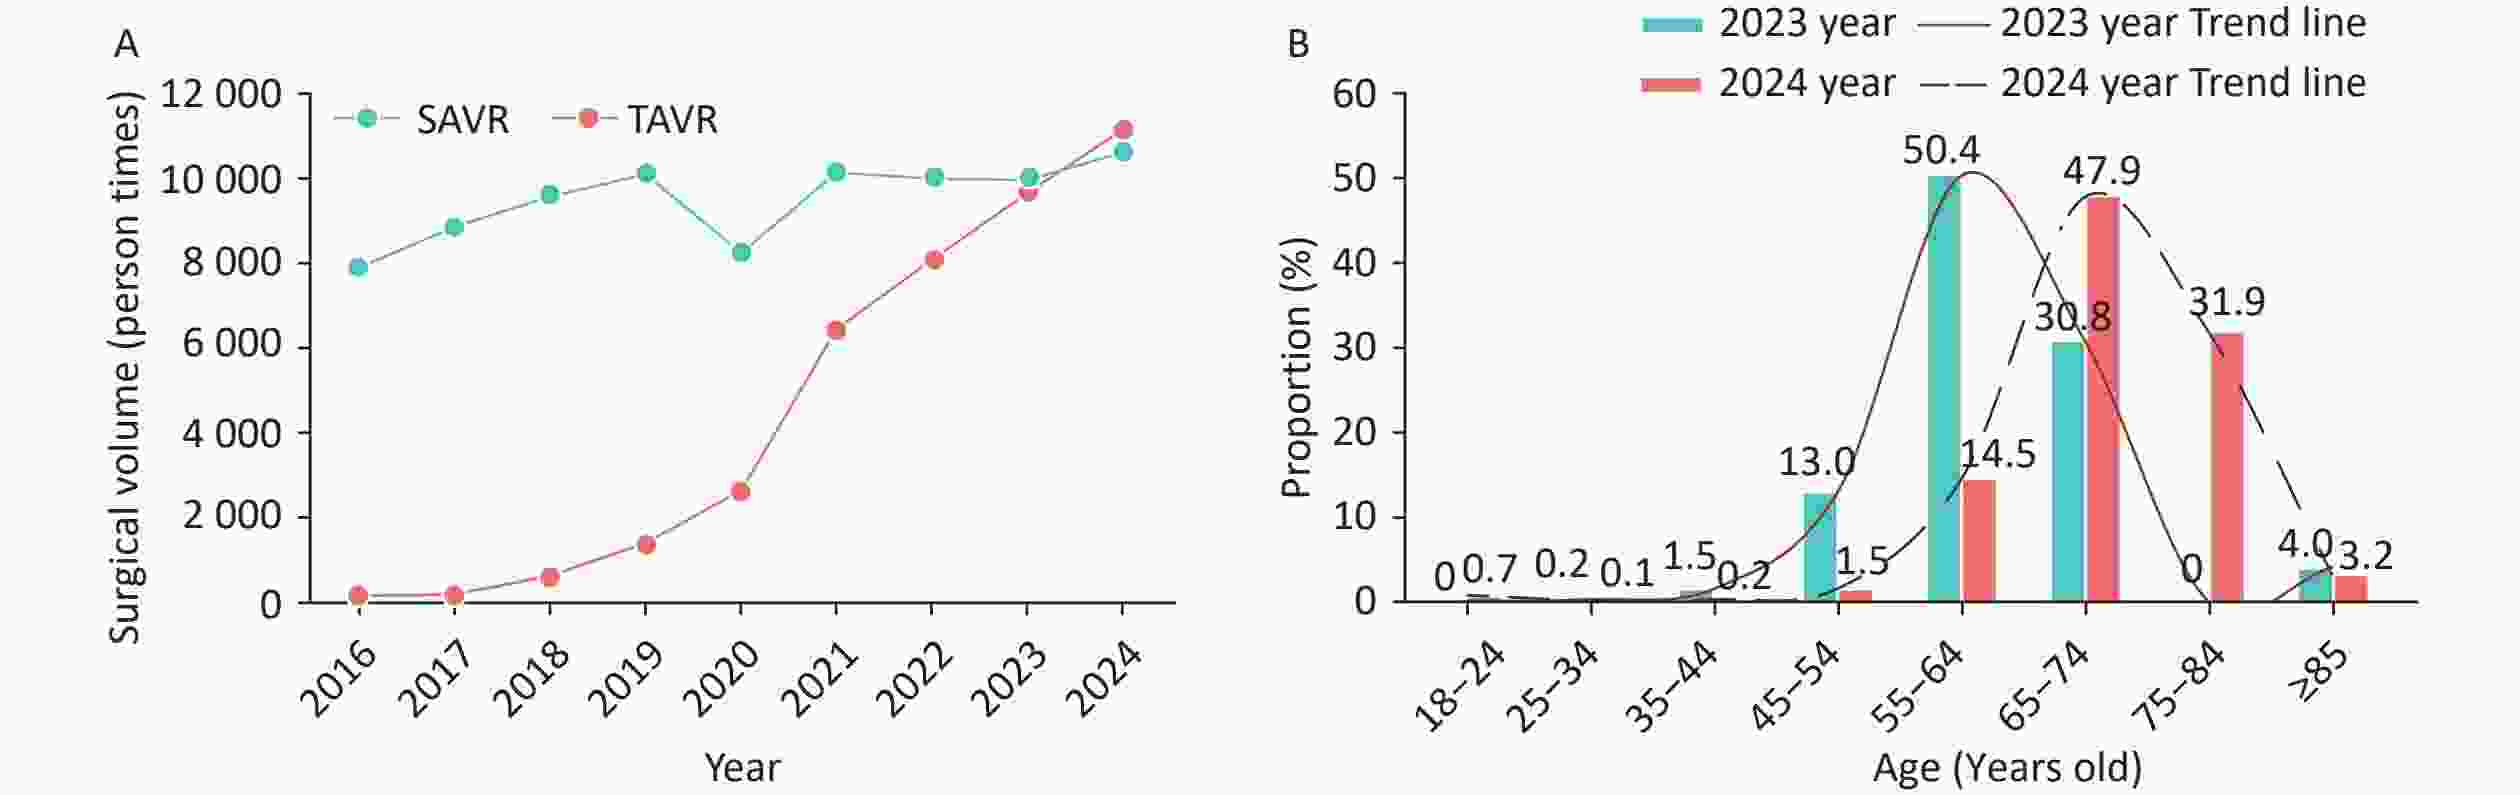
Figure 29. Growth trends of SAVR and TAVR from 2016 to 2024 (A) and age distribution of patients undergoing TAVR in 2023 and 2024 (B). SAVR: Surgical aortic valve replacement; TAVR: Transcatheter aortic valve replacement.
-
In 2024, 29,000 isolated mitral valve surgeries were performed, of which 34.8% were repairs and 65.2% were replacements. The proportion of valvuloplasty decreased with age, while replacement increased. The proportions of patients aged < 18 years and < 65 years undergoing valvuloplasty were 77.2% and 36.4%, respectively (Figure 30A). Among patients undergoing simple mitral valve replacement, bioprosthetic valves were used in 49.2%. The proportion of patients opting for mechanical valves declined with increasing age, whereas the proportion of biological valves increased (the rates of mechanical valve selection were 89.6% and 15.4%, respectively, in patients aged < 18 years and ≥ 85 years; Figure 30B). The in-hospital mortality for isolated mitral surgery was 0.8%, and the non-recovery discharge rate was 2.1%. Additionally, 3,788 mitral interventions were performed, with mitral clip procedures being the most common (61.3%).
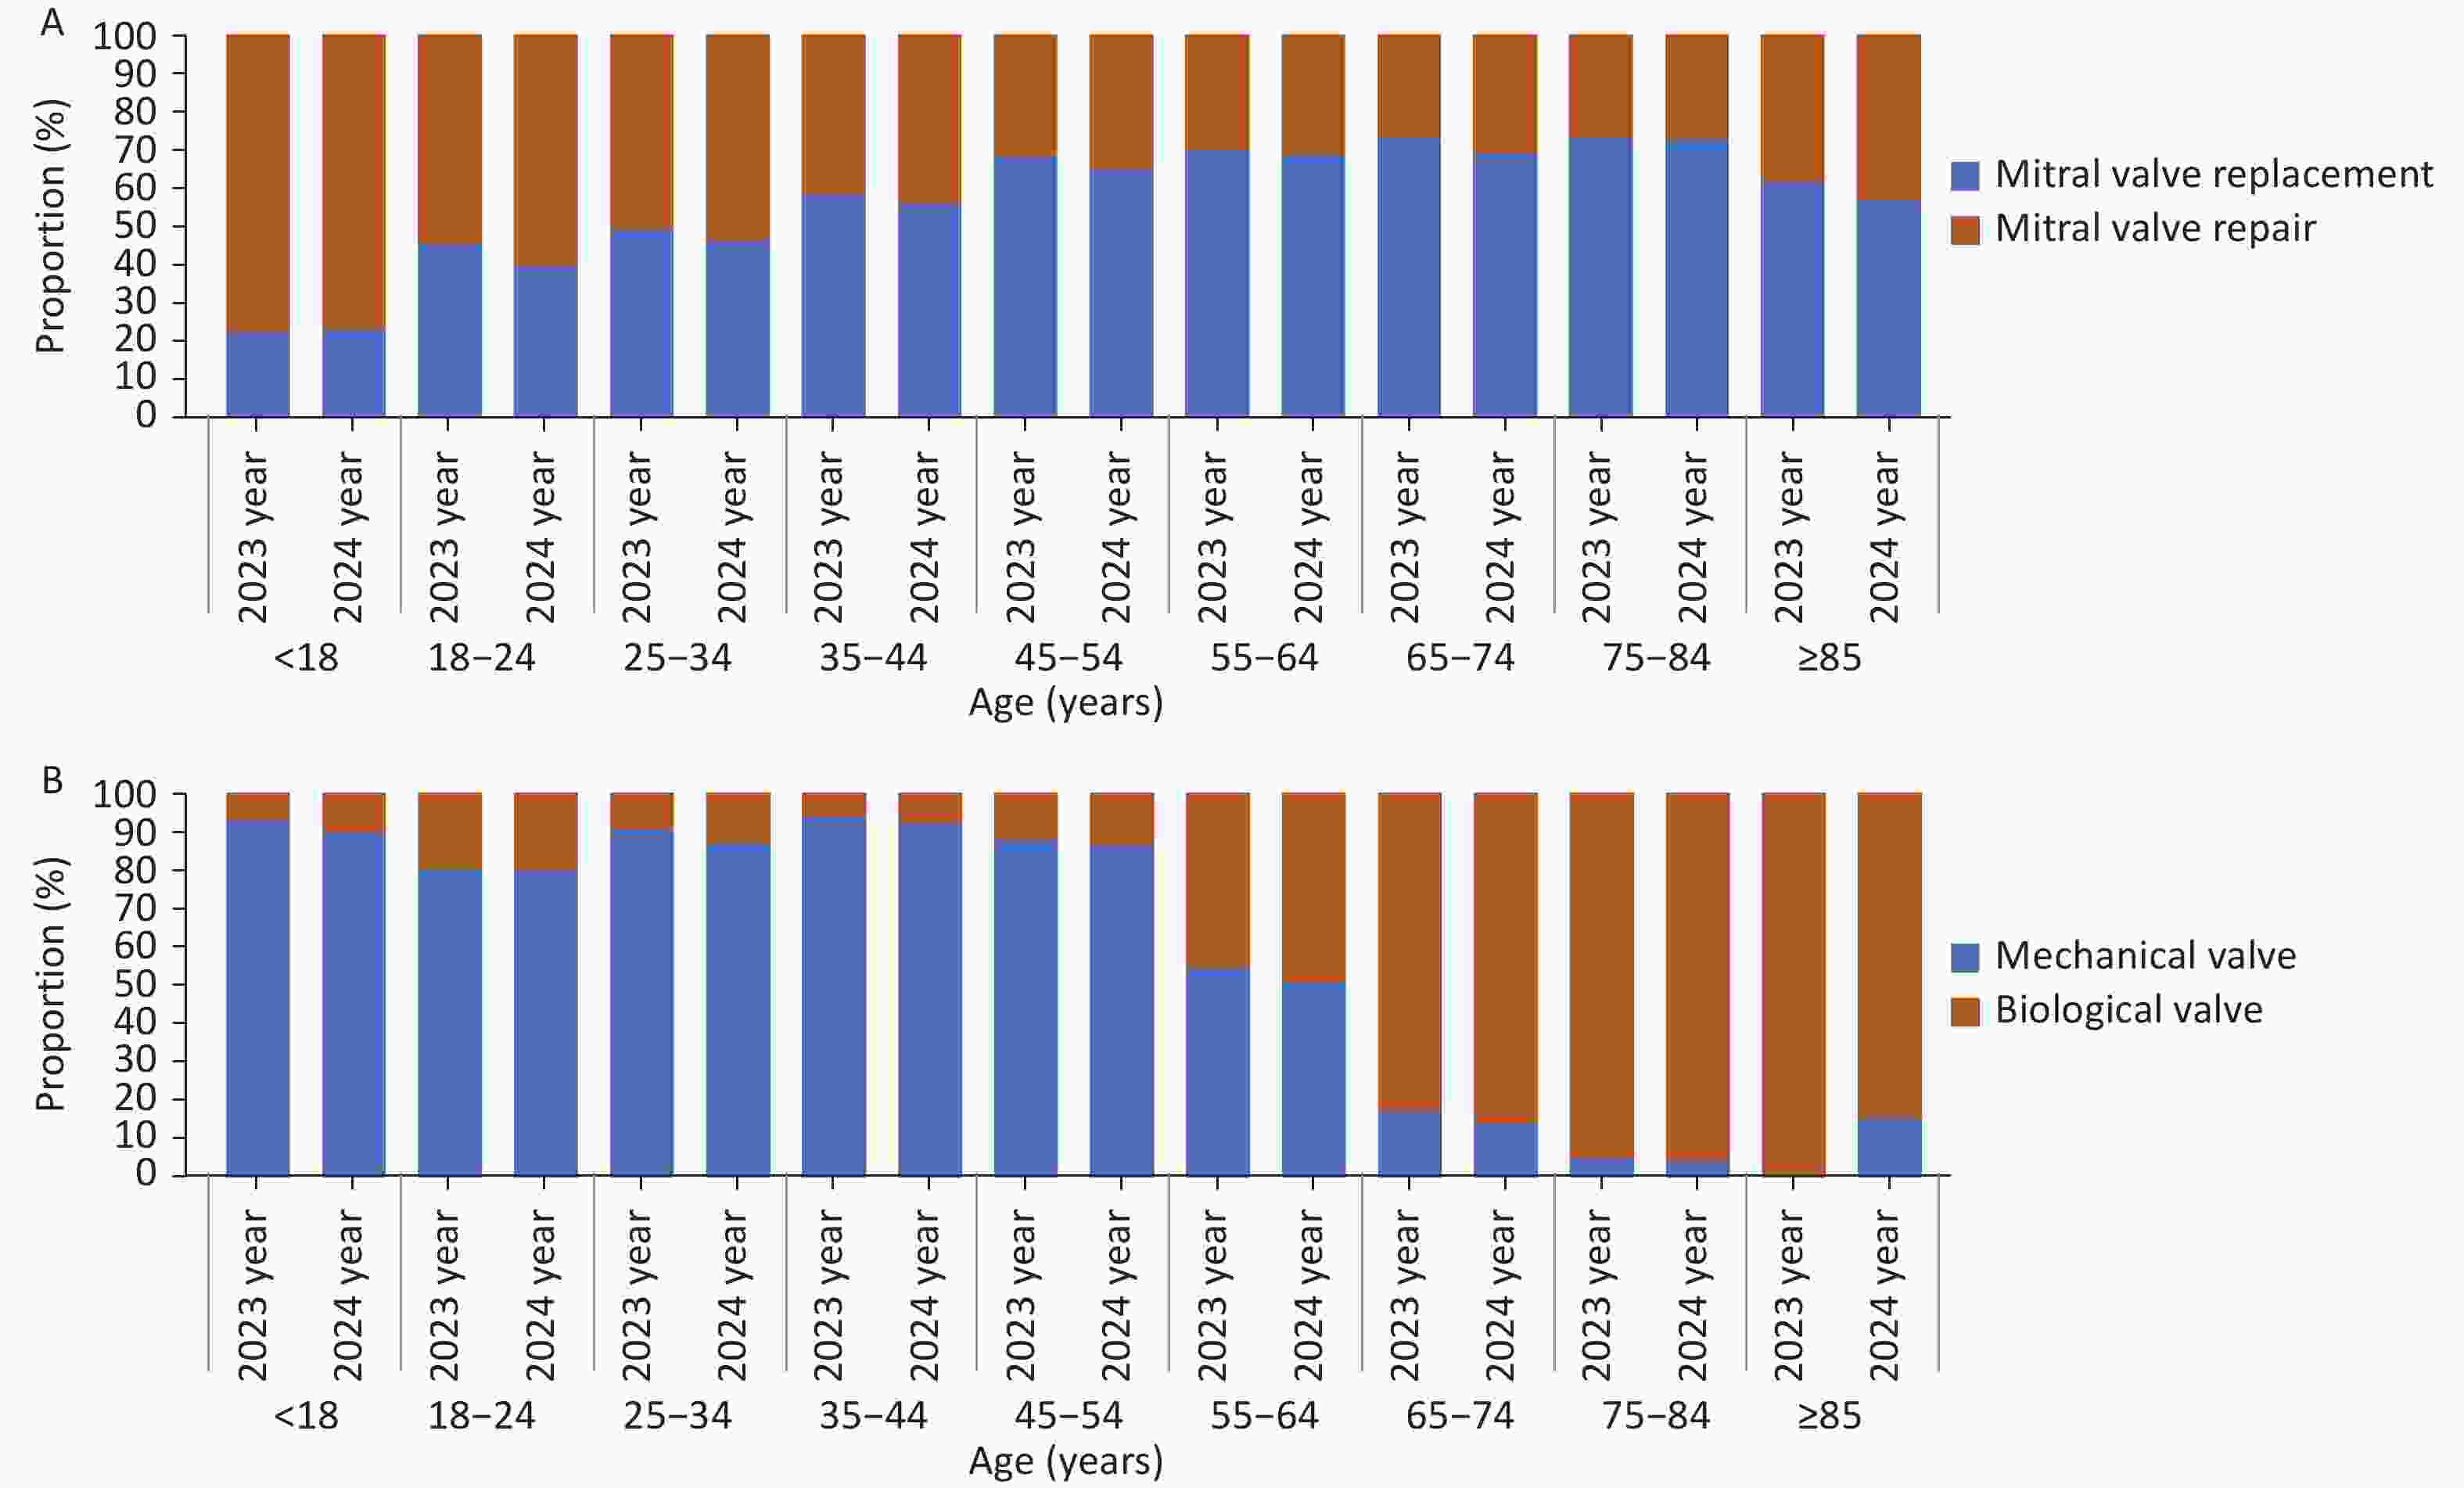
Figure 30. Proportion of mitral valve replacement and repair procedures by age group (A) and distribution of valve types (B) in 2023 and 2024.
-
In 2024, 46,000 tricuspid valve replacement or repair surgeries were performed, mostly combined procedures; 77.5% of patients were > 45 years, and 45.8% were male. The non-recovery discharge rate was 2.5%, declined from 3.1% in 2023. Additionally, 97 tricuspid interventions were performed (47.4% female), with a 2.1% in-hospital mortality and 4.1% non-recovery discharge rate.
-
In 2024, 1,365 pulmonary valve replacement or repair surgeries were performed; 51.5% were in patients aged < 18 years, and 49.4% were male. The non-recovery discharge rate was 2.2%. Additionally, 824 pulmonary interventions were performed (54.7% female), with a 0.4% non-recovery discharge rate.
To address aortic regurgitation, the HAVEAR study evaluated the early efficacy and safety of TAVR using the novel Hanchor valve system in patients at high surgical risk with severe pure native aortic regurgitation (PNAR) across 13 Chinese centers (n = 128)[91]. At 30-day follow-up, the technical success rate was 96.09%, mortality was 2.34%, permanent pacemaker implantation was 12.00%, and major bleeding occurred in 0.78%. No intravalvular or moderate/severe paravalvular regurgitation was observed, and significant improvements were seen in New York Heart Association (NYHA) class, quality of life, and LV function, indicating favorable short-term safety and valve stability for this non-calcified cohort. The Hanchor system may provide a new treatment option for patients with noncalcified aortic regurgitation.
Once overlooked, tricuspid regurgitation (TR) is now recognized as common and associated with substantial morbidity, with limited drug therapy and high-risk surgical options. Transcatheter tricuspid interventions are emerging. Internationally, TriClip (edge-to-edge repair) and EVOQUE (replacement system) have received Food and Drug Administration (FDA) approval. China has kept pace with global developments and is leading in transcatheter tricuspid replacement. The domestically developed LuX-Valve system employs a non-radial-force-dependent design. The TRAVEL multicenter study of its first-generation (transatrial) system in 126 patients at high surgical risk with severe TR showed a 1-year all-cause mortality of 10.3%, heart failure rehospitalization of 4.0%, 95.2% achieving ≤ mild TR, and significant improvements in right heart structure and function[92]. Its second-generation transjugular system is undergoing clinical registration studies, and may provide a safe and effective option for minimally invasive treatment of high-risk severe TR.
-
According to HQMS data, in 2024, 7,627 hospitals treated patients hospitalized with heart failure (those whose primary discharge diagnosis or other diagnoses included heart failure and who were aged ≥ 18 years), accounting for 91.2% of all hospitals treating cardiovascular disease (CVD) patients in HQMS. Among these, 2,562 were tertiary hospitals and 5,065 were secondary hospitals. Collectively, these hospitals treated 14.891 million hospitalized patients with heart failure, representing 18.6% of all CVD-related hospitalizations in HQMS. Specifically, tertiary and secondary hospitals treated 9.144 million and 5.747 million patients with heart failure, respectively (61.4% and 38.6%). Of these, 27.2% were admitted through emergency departments, 70.2% through outpatient clinics, and 2.6% via other routes. The top three etiologies or major comorbidities were coronary heart disease (68.3%), hypertension (59.8%), and stroke (34.0%) (Figure 31A).
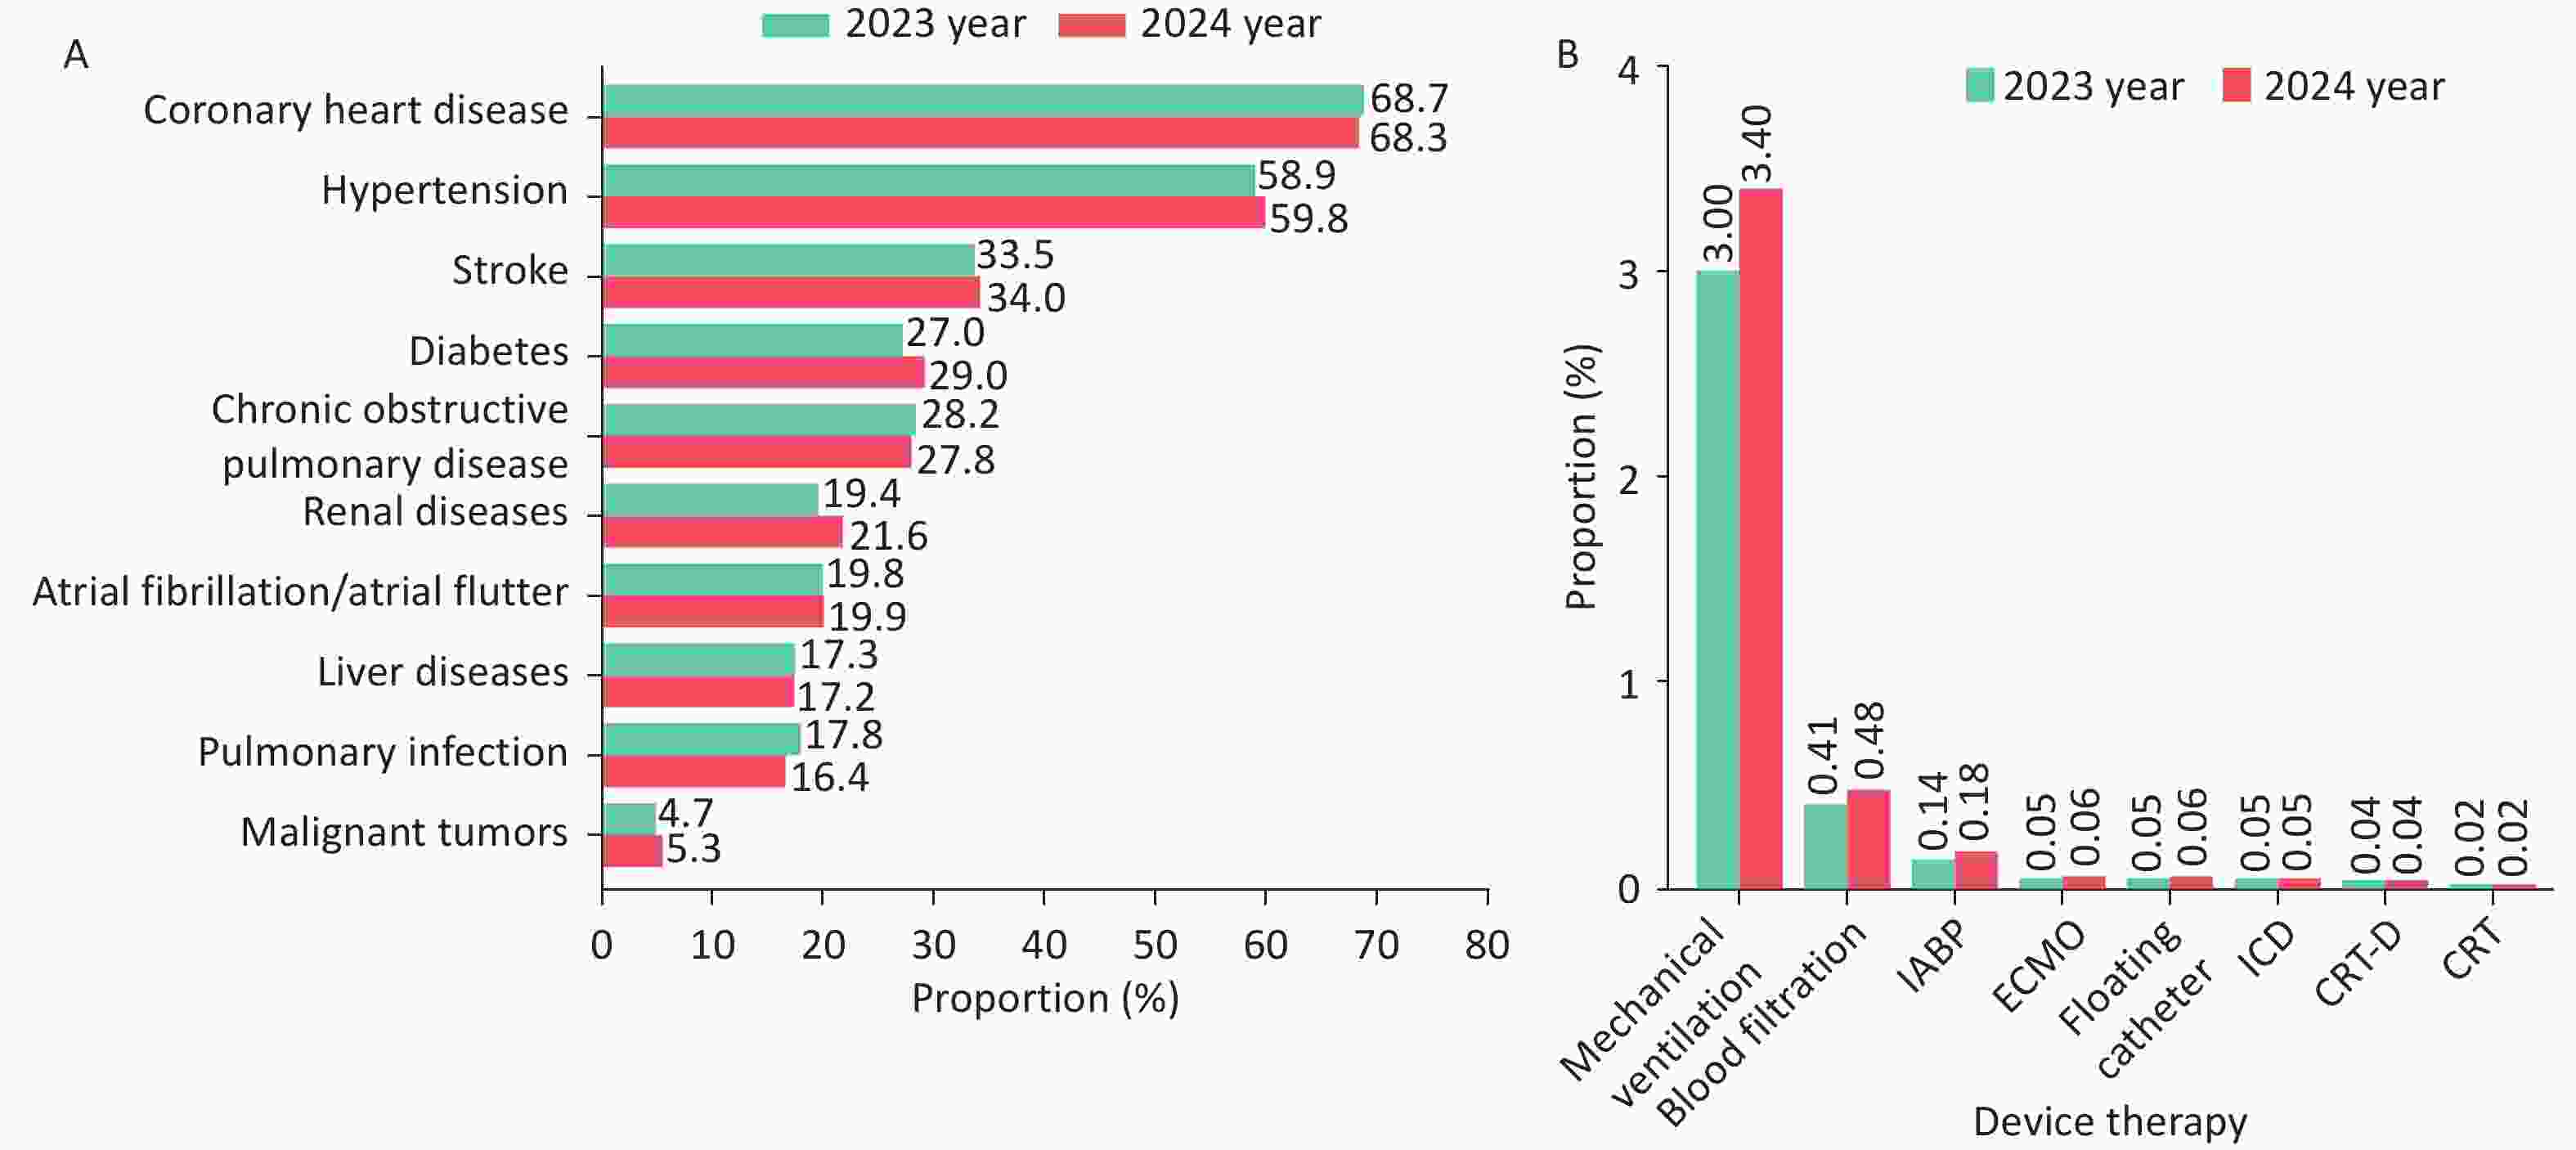
Figure 31. Proportion of etiologies or major comorbidities among hospitalized patients with heart failure in 2023 and 2024 (31A) and proportion receiving device-based treatments (31B). IABP: Intra-aortic balloon pump; ECMO: Extracorporeal membrane oxygenation; ICD: Implantable cardioverter-defibrillator; CRT-D: Cardiac resynchronization therapy defibrillator; CRT: Cardiac resynchronization therapy.
Among heart failure inpatients, 3.40% received mechanical ventilation, 0.48% received hemofiltration, 0.18% received intra-aortic balloon pump (IABP), 0.06% received extracorporeal membrane oxygenation (ECMO), 0.05% received ICD, 0.04% received CRT-D, and 0.02% received CRT. Compared with 2023, the proportion of hospitalized patients with heart failure receiving mechanical ventilation, hemofiltration, or IABP therapy increased during hospitalization, while the proportion receiving other device-based therapies showed no significant change (Figure 31B). In 2024, the crude mortality and non-rehabilitation discharge rates (discharge due to in-hospital death or non-medically ordered discharge) among hospitalized heart failure patients were 2.1% and 7.1%, respectively. The 30-day all-cause readmission rate post-discharge was 11.8%, and the 90-day all-cause readmission rate was 22.7%.
Since the first long-term (left ventricular assist device) LVAD implantation in June 2017, as of August 2025, 2,186 LVAD procedures had been performed in 209 Chinese hospitals. CH-VAD is the first domestically produced fully magnetically levitated LVAD. A study published in October 2025, including 181 patients with advanced heart failure who received CH-VAD across 9 centers (June 2017–October 2024), with a median follow-up of 1.6 years (maximum, 7 years), showed that only 11.0% (20/181) experienced driveline infections (26 total events), with cumulative infection incidences at 6, 12, and 24 months of only 2.8%, 5.6%, and 8.5%, respectively[93]. These findings demonstrate that CH-VAD provides high survival rates and low complication rates, offering safe and effective long-term support for patients with advanced heart failure.
-
HQMS data for 2024 showed that 4,348 hospitals (52.0% of those providing CVD services) admitted patients with a primary diagnosis of CHD. There were 2,097 tertiary hospitals (77.1%) and 2,251 secondary hospitals (39.9%), totaling 363,000 admissions. The top three CHD types were atrial septal defect (ASD, 41.1%), ventricular septal defect (VSD, 8.4%), and patent ductus arteriosus (PDA, 4.4%). Of CHD inpatients, 5.6% were neonates and infants (< 1 year), 17.9% were children aged 1–17 years, and 76.5% were adults (≥ 18 years) (Figure 32A).
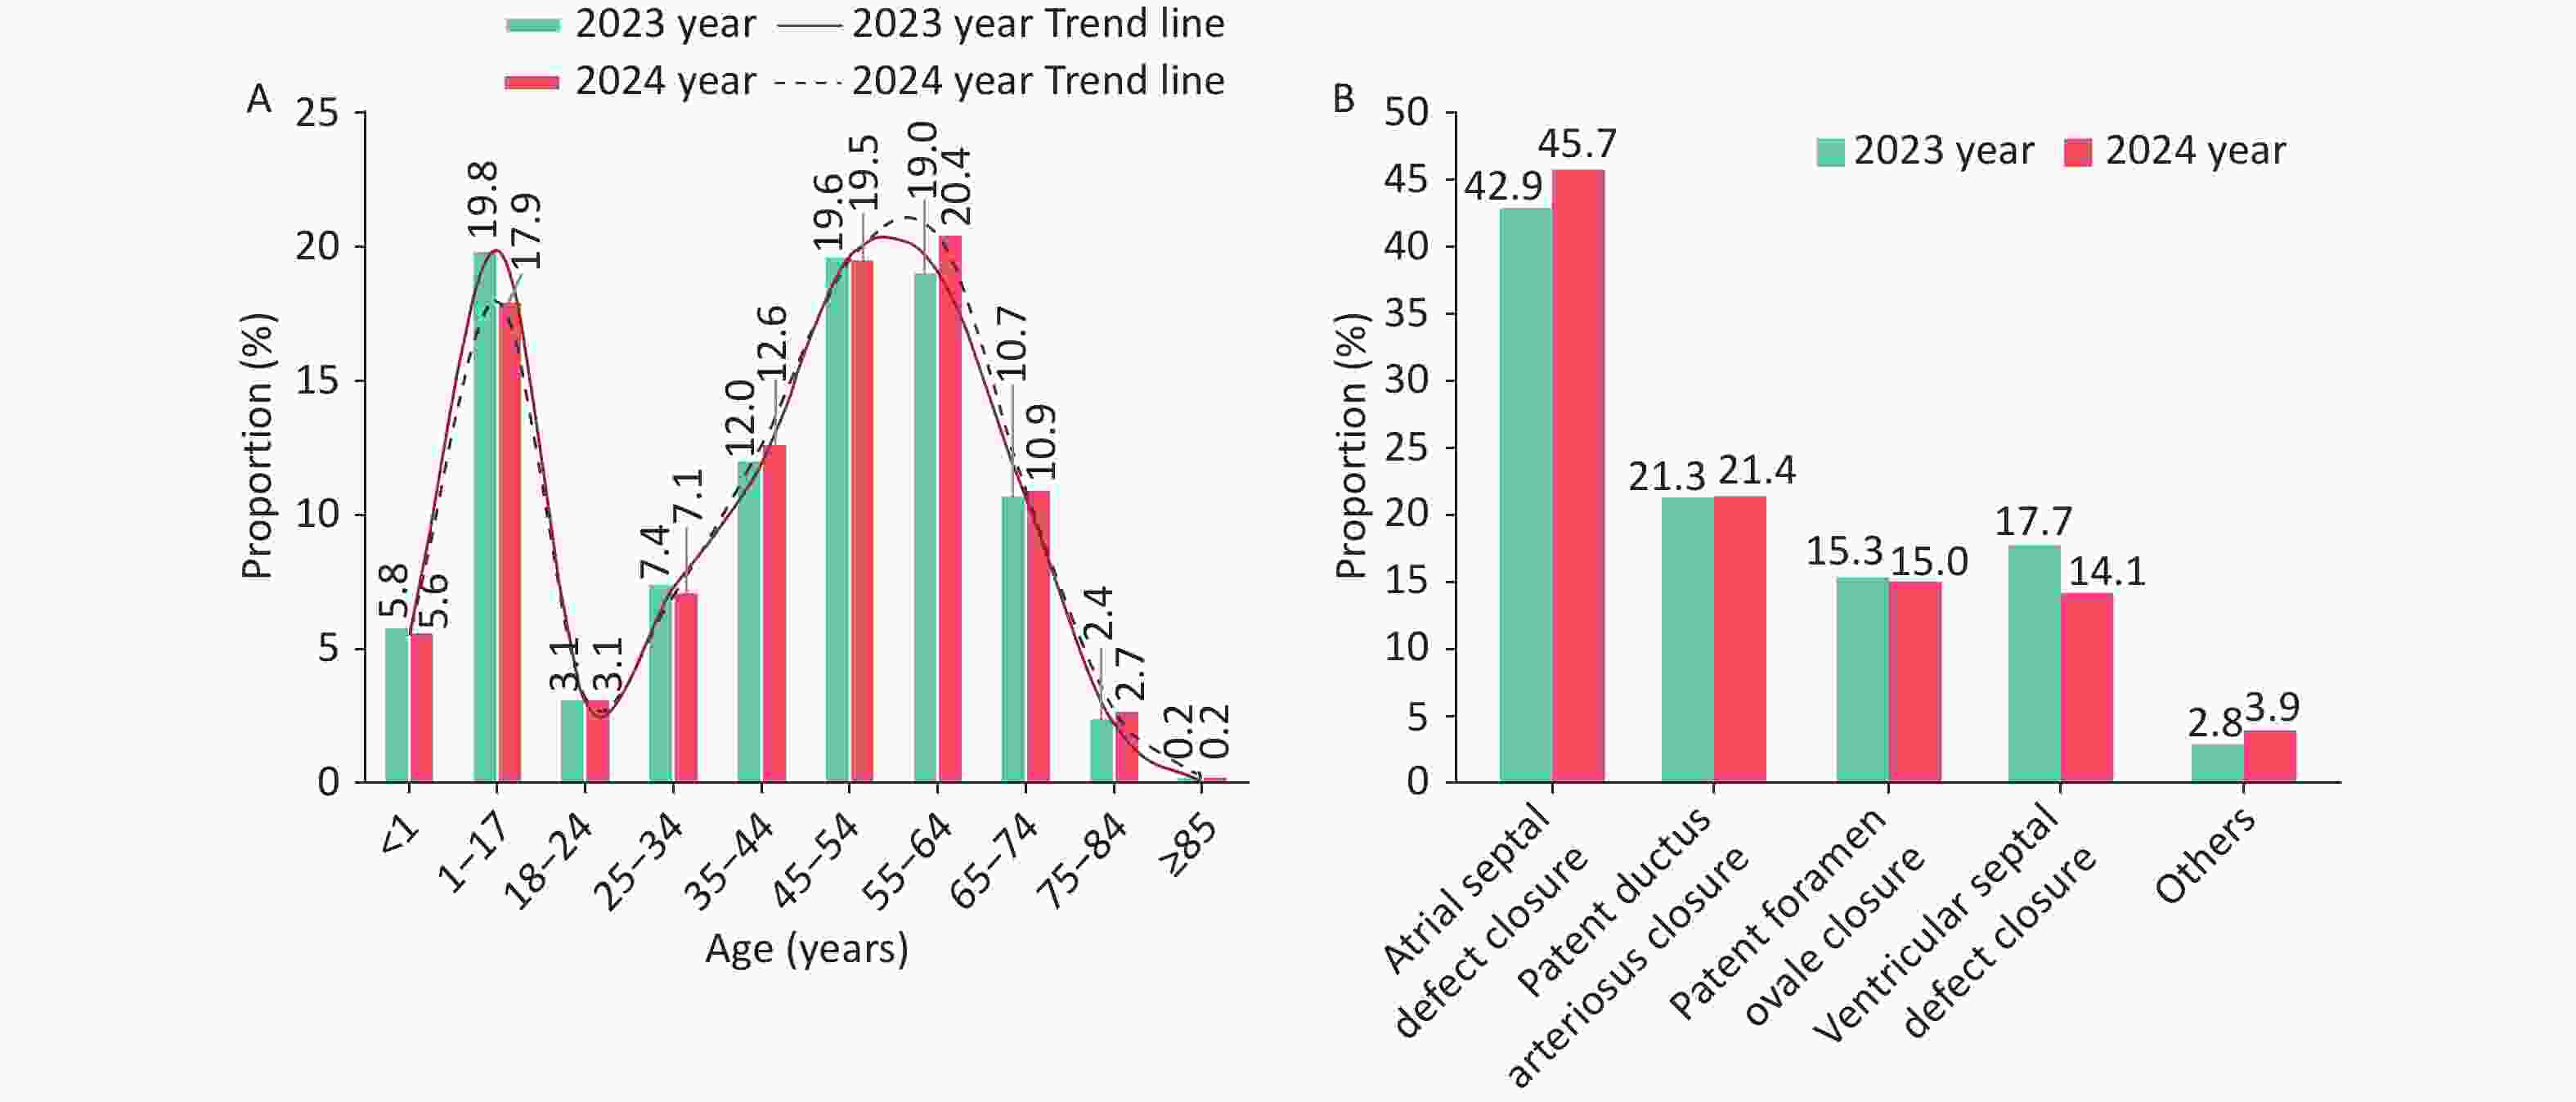
Figure 32. Age distribution of hospitalized patients with congenital heart disease in 2023 and 2024 (32A) and types of interventions among pediatric patients (32B). *: Includes pulmonary valve, mitral valve, aortic valve, tricuspid valve, pulmonary veins, and transcatheter pulmonary interventions.
Among those receiving surgery or intervention (182,000 cases), simple CHD accounted for 90.7% (165,000) and complex CHD for 9.3% (17,000). Surgical treatment was provided to 61,000 patients (33.5%), of whom 26.6% had complex CHD.
Interventional treatment was provided to 121,000 CHD patients (25.8% aged < 18 years). Among patients aged < 18 years, ASD closure was the most common intervention (45.7%), followed by PDA closure, patent foramen ovale (PFO) closure, VSD closure, and others (Figure 32B). Among adults, PFO closure was most common (61.6%), followed by ASD closure (34.1%), PDA closure (4.3%), and VSD closure (1.9%).
The in-hospital mortality for CHD surgery was 0.8%, with a non-recovery discharge rate of 1.5% (simple: 0.3% mortality, 0.7% non-recovery; complex: 2.0% mortality, 3.6% non-recovery). For interventions, in-hospital mortality was 0.02%, and non-recovery discharge was 0.3% (aged < 18 years: 0.02% mortality, 0.4% non-recovery; adult: 0.01% mortality, 0.2% non-recovery). Among patients undergoing CHD surgery, 45.4% were aged 1–17 years, and 33.6% were adults.
Additionally, 1,797 neonatal (≤ 28 days) surgeries were performed, an increase of 419 from 2023 (Figure 33), and coarctation or interruption of the aorta was the most common (26.4%, an increase of 3 percentage points compared to 2023), followed by conotruncal defects other than tetralogy of Fallot (21.0%, a decrease of 1.9 percentage points compared to 2023). Among 12,000 infants (29 days–1 year) undergoing surgery, VSD repair was most frequent (54.9%), followed by ASD surgery (8.5%), PDA surgery (8.1%), and tetralogy of Fallot surgery (7.2%).
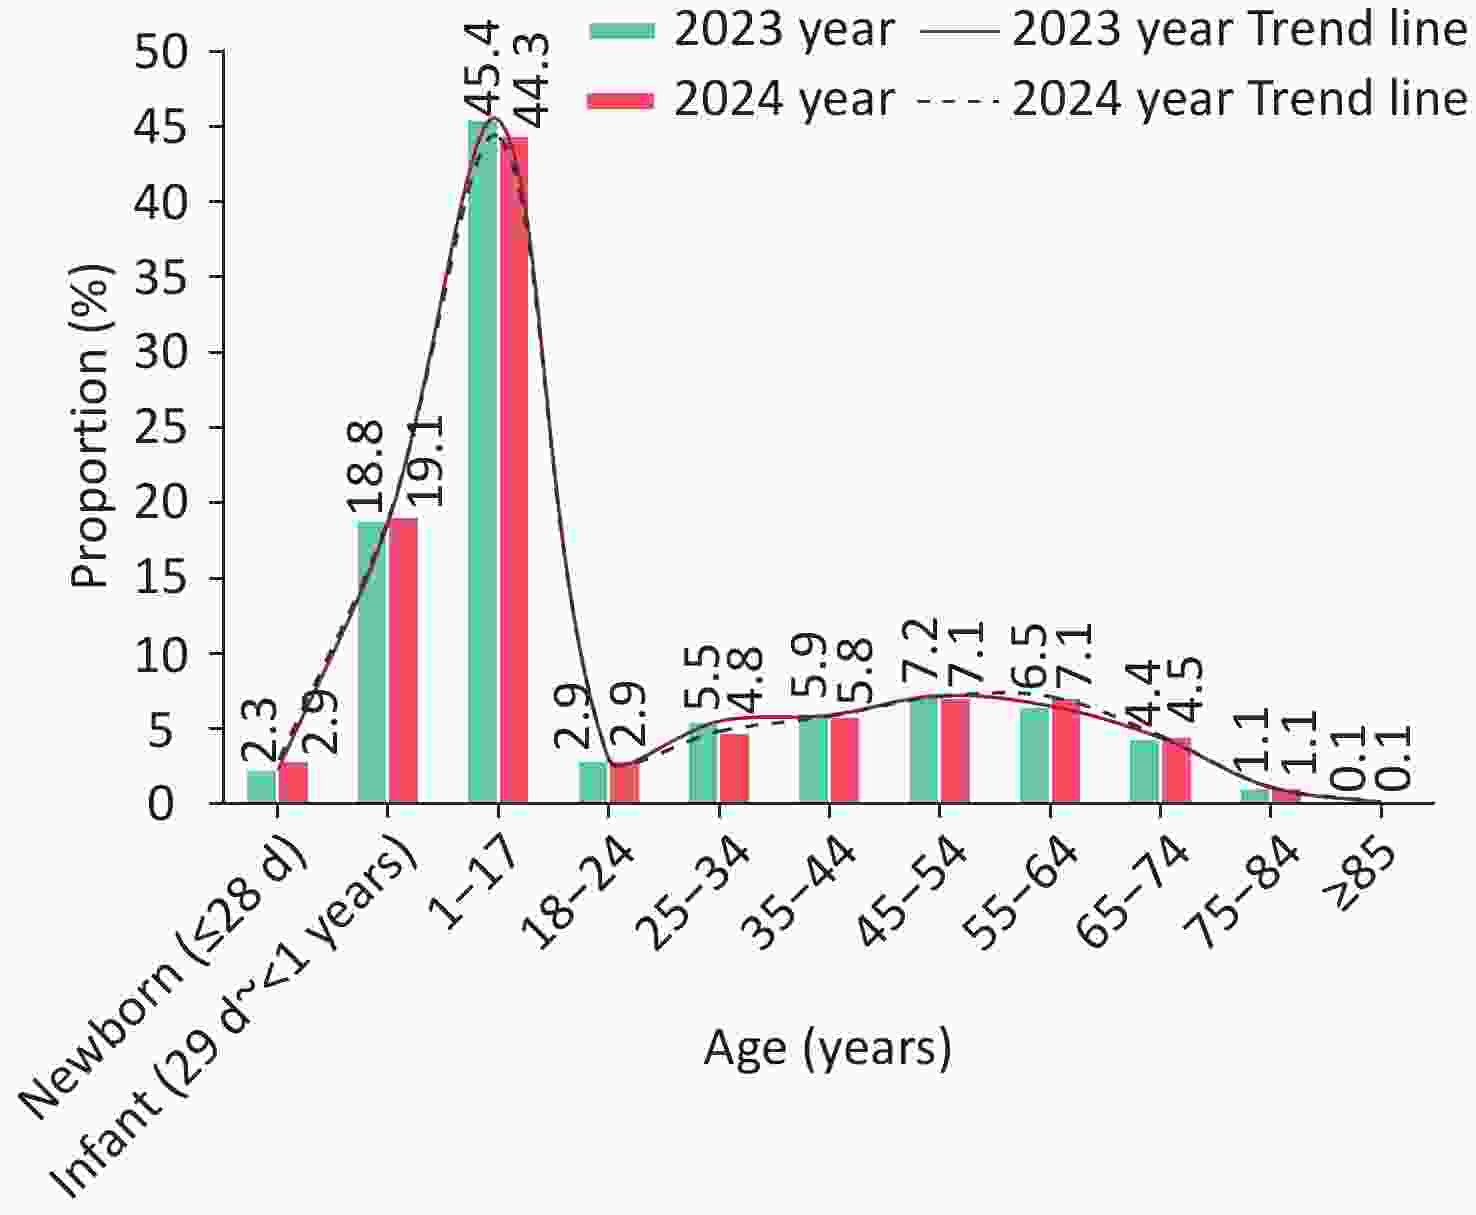
Figure 33. Age distribution of patients with congenital heart disease undergoing surgical treatment.
A multicenter Chinese study demonstrated that the "national-local hospital" ASSIST collaborative model, based on the National Center for Children's Medical Care, effectively improved CHD care in resource-limited areas[94]. Among 11,895 patients, the proportion of complex cases increased from 7.3% to 35.5%, the proportion of neonatal surgery from 1.5% to 9.1%, the proportion of delayed treatment decreased from 43.2% to 23.3%, and postoperative mortality declined from 10.2% to 4.4%, with outcomes comparable to Shanghai Children's Medical Center.
A study based on the Chinese CHD Surgery Database (6,568 patients) showed a median hospitalization cost of 65,000 RMB, ranging from 57,000 RMB for STAT category 1 to 195,000 RMB for category 5 surgeries[95], according to the surgical risk classification by the American Society of Thoracic Surgeons-European Society of Cardiothoracic Surgery (STAT), providing the first systematic evidence on CHD surgery costs in China.
-
According to HQMS data, in 2024, 4,396 hospitals participated in monitoring and provided active diagnosis and treatment services for aortic disease, accounting for 52.5% of all hospitals offering CVD-related diagnostic and therapeutic services, and recorded 159,000 hospitalizations (primary diagnosis, aged ≥18 years). Aortic dissection was the most common (47.2%), followed by aortic aneurysm (27.2%) (Figure 34A).
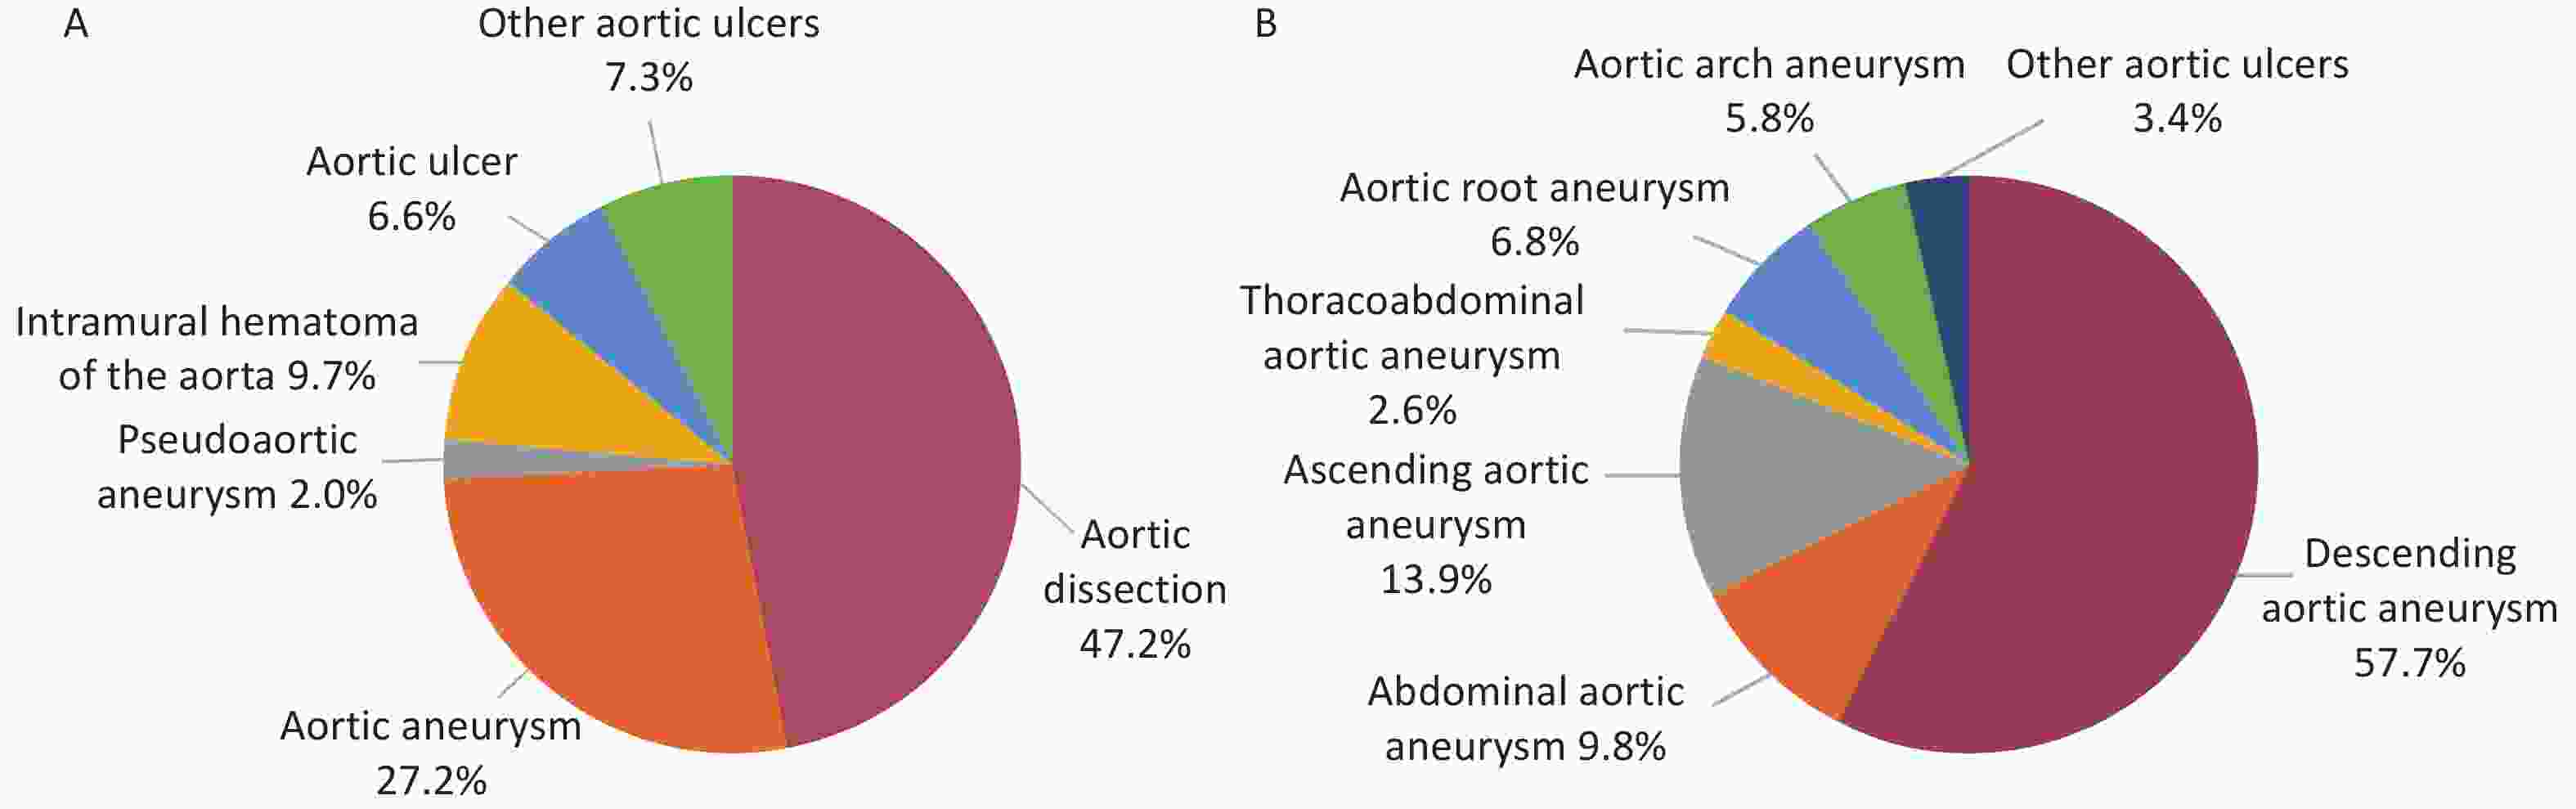
Figure 34. Distribution of aortic disease types in 2024 (34A) and distribution of aortic aneurysm types (34B). *: Including aortitis, aortic coarctation, aortic embolism, and traumatic aortic aneurysm/dissection. △: Patients whose aortic aneurysm type cannot be determined from the initial medical record entry.
In 2024, 81,000 patients were hospitalized with aortic dissection (the primary discharge diagnosis included aortic dissection, with age ≥ 18 years; this included patients diagnosed with intramural hematoma or aortic dissection rupture). Among them, type A and type B aortic dissection accounted for 27,000 and 43,000 cases, respectively, while 11,000 cases could not be definitively classified. Emergency admission was observed in 59.3% of hospitalized aortic dissection patients. The most common comorbid condition was hypertension (77.7%), followed by liver diseases (17.9%). Intravascular surgery was performed in 34.7% of patients, open surgery in 18.5%, and did not undergo surgery in 46.8%. The hospital mortality rate for aortic dissection patients in 2024 was 5.0%, while the non-rehabilitated discharge rate (including in-hospital death or discharge without medical orders) was 14.9%. For type A and type B aortic dissections, hospital mortality rates were 8.4% and 1.7%, respectively, with non-rehabilitated discharge rates of 21.5% and 8.4%, respectively.
In 2024, 2,838 hospitals provided aortic aneurysm monitoring and management services, accounting for 33.9% of all cardiovascular disease (CVD) treatment facilities, and admitted 52,000 patients with a primary diagnosis of aortic aneurysm. Patients discharged with the primary diagnosis of abdominal aortic aneurysm accounted for the highest proportion (57.7%), followed by ascending aortic aneurysm (13.9%) (Figure 34B). The prevalence of hypertension among hospitalized patients with aortic aneurysms was 61.6%, followed by stroke (19.7%). Among hospitalized patients with aortic aneurysms, 47.8% underwent endovascular surgery, 14.6% underwent open surgery, and 37.6% did not receive surgical treatment. In 2024, the inpatient mortality rate for hospitalized patients with aortic aneurysms was 2.8%, while the non-rehabilitated discharge rate was 8.4%.
-
In 2024, hospitals providing services for carotid atherosclerotic stenosis/occlusion, lower extremity arterial disease (LEAD), varicose veins, and deep vein thrombosis (DVT) numbered 4,251, 4,469, 5,540, and 5,208, respectively, accounting for 50.8%, 53.4%, 66.2%, and 62.2% of the total number of hospitals providing cardiovascular disease (CVD) diagnosis and treatment services, respectively. Hospitalizations for these conditions numbered 234,000, 146,000, 431,000, and 219,000, respectively.
In 2024, among hospitalized patients with carotid atherosclerotic stenosis and occlusive disease in China, 68,000 patients (29.1%) underwent surgical treatment. Of these, 56,000 cases (23.9%) received carotid endovascular therapy, while 12,000 cases (5.1%) underwent carotid endarterectomy (CEA). Additionally, 4,752 cases (2.0%) underwent intracranial carotid surgery. Among hospitalized patients with lower extremity arteriosclerosis obliterans, 82,000 cases (56.2%) received endovascular treatment for lower extremity arteries, 1,131 cases (0.8%) underwent open surgery for lower extremity arteries, and 62,000 cases (42.5%) did not receive surgical treatment.
Among hospitalized patients with carotid atherosclerotic stenosis and occlusive disease in 2024, the inpatient mortality rate for those receiving carotid endovascular therapy was 0.14%, with a non-rehabilitation discharge rate of 1.00%; for those undergoing carotid endarterectomy, the inpatient mortality rate was 0.17%, with a non-rehabilitation discharge rate of 1.06%; and for those undergoing intracranial carotid surgery, the inpatient mortality rate was 0.16%, with a non-rehabilitation discharge rate of 1.64%. Among hospitalized patients with lower extremity arteriosclerosis obliterans in 2024, the inpatient mortality rate for those receiving endovascular surgery was 0.21%, with a non-rehabilitation discharge rate of 1.36%; for those undergoing open surgery, it was 0.44%, with a non-rehabilitation discharge rate of 3.89%; and for those who did not undergo surgery, the inpatient mortality rate was 0.31%, with a non-rehabilitation discharge rate of 5.86%.
-
According to HQMS data, 6,483 hospitals admitted patients with pulmonary arterial hypertension (PAH) in 2024, including 2,454 tertiary hospitals and 4,029 secondary hospitals. A total of 1.899 million PAH-related hospitalizations were recorded (patients discharged with PAH as the primary or other diagnosis and aged ≥ 18 years), of which 26.5% were admitted via emergency departments and 71.2% via outpatient clinics. The proportions of patients classified into the first to fifth major categories of PAH [arterial PAH, PAH due to left heart disease, PAH caused by pulmonary diseases and/or hypoxia, PAH due to pulmonary obstruction, and PAH of unknown or multifactorial etiology] were 6.2%, 31.9%, 25.2%, 1.9%, and 4.7%, respectively, indicating that groups 2 and 3 remained the predominant types of PAH cases (Figure 35).
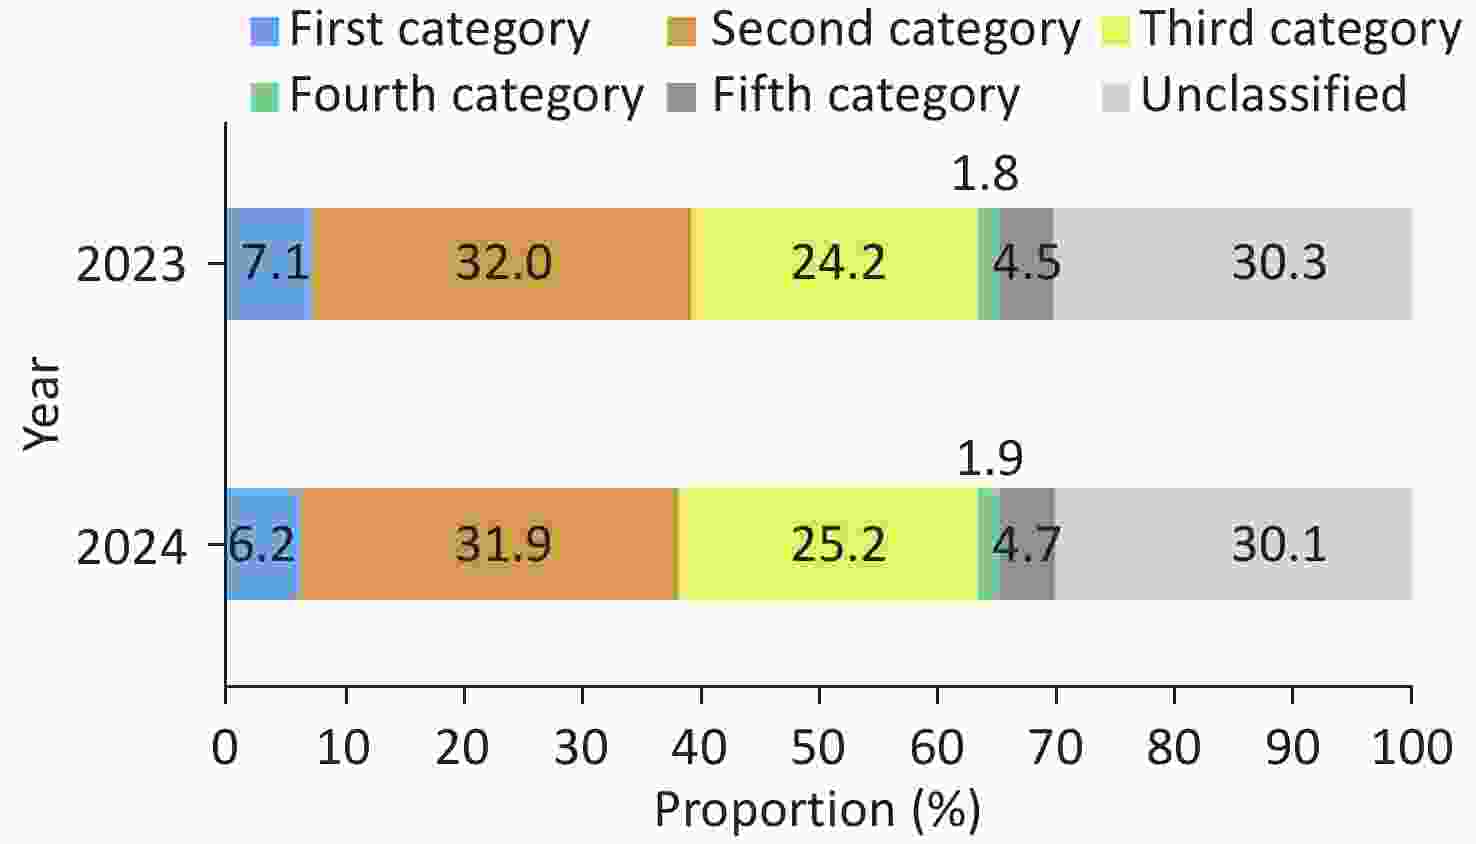
Figure 35. Clinical classification of pulmonary hypertension in 2023 and 2024.
Cardiac catheterization, as the gold standard for PAH diagnosis, is essential for confirming the diagnosis, characterizing the disease, assessing severity, and guiding treatment and is therefore a core component of the PAH management workflow. In 2024, the right heart catheterization rate among the overall PAH population was only 1.2%, while the rates for patients in the first to fifth categories were 8.2%, 0.7%, 0.4%, 10.9%, and 0.2%, respectively, reflecting significant disparities.
In 2024, 117,000 patients with group 1 pulmonary hypertension were admitted, and patients with congenital heart disease-related pulmonary hypertension remained the largest subgroup with pulmonary arterial hypertension. Among these, pulmonary hypertension associated with atrial septal defects accounted for 35.1%, that related to ventricular septal defects accounted for 13.0%, and that linked to patent ductus arteriosus accounted for 10.8%. The proportions of patients with atrial septal defect-related pulmonary hypertension who underwent surgical repair or interventional closure of the defect were 19.6%; those with ventricular septal defect-related pulmonary hypertension who received surgical repair or interventional closure were 8.8%; and those with patent ductus arteriosus-related pulmonary hypertension who underwent surgical ligation or interventional closure were 5.3%. Only a minority of patients with congenital heart disease-related pulmonary hypertension received surgical or interventional treatment.
In 2024, a total of 35,000 cases of chronic thromboembolic pulmonary hypertension were diagnosed, of whom 0.4% underwent pulmonary endarterectomy and 7.9% received balloon pulmonary angioplasty. The hospital mortality rate for patients with pulmonary hypertension in 2024 was 1.4%, while the non-rehabilitated discharge rate (including inpatient deaths or discharges without medical orders) was 6.7%. Compared with 2023, these indicators decreased by 0.2 and 3.0 percentage points, respectively.
-
Venous thromboembolism (VTE) comprises pulmonary embolism and deep vein thrombosis (DVT). HQMS data indicate that in 2024, there were 5,852 hospitals admitting patients with pulmonary embolism, with a total of 390,000 such admissions (patients aged ≥18 years with pulmonary embolism as the primary or secondary discharge diagnosis), accounting for 0.5% of all hospitalized patients with cardiovascular disease (CVD)-related diagnoses. The in-hospital mortality rate among pulmonary embolism patients was 4.7%, while the non-rehabilitated discharge rate was 11.6%. Among these patients, 59.8% had a history of surgical procedures, 37.5% presented with DVT, and 14.9% had malignancies (Figure 36A). Additionally, 3.4% of pulmonary embolism patients received catheter thrombolysis during hospitalization, 1.0% underwent percutaneous catheter intervention, and 1.6% underwent pulmonary artery thrombectomy.
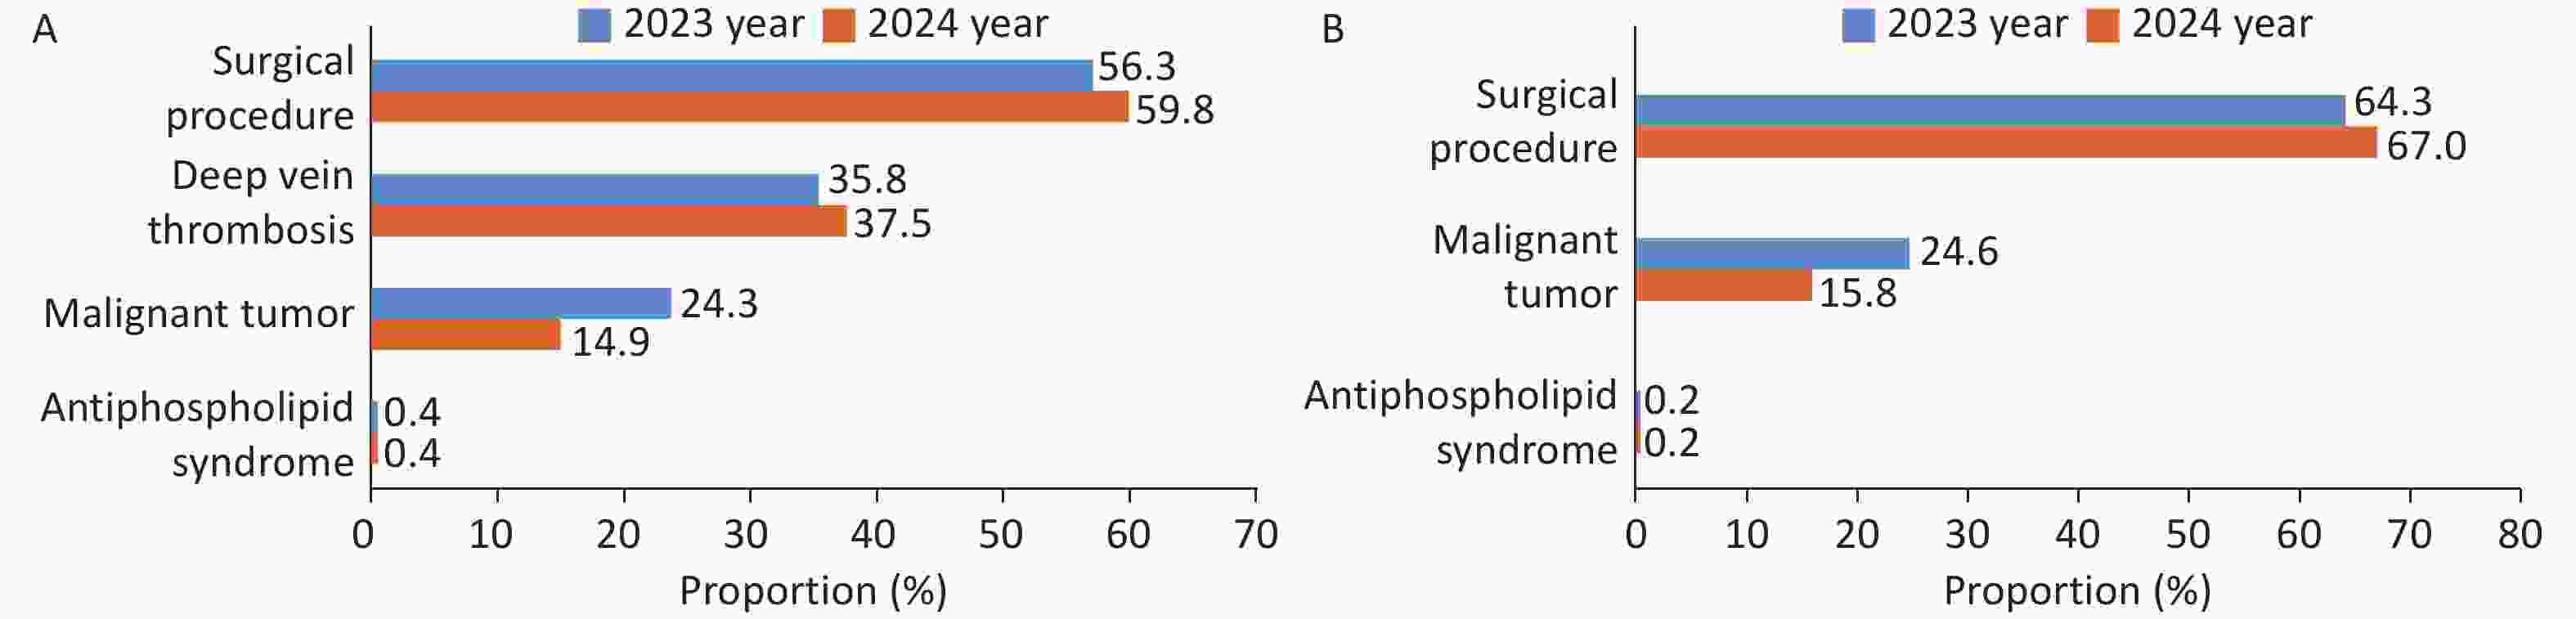
Figure 36. Coexisting conditions and risk factors in patients with pulmonary embolism (36A) and deep vein thrombosis (36B) in 2023 and 2024.
In 2024, a total of 7,004 hospitals admitted patients with deep vein thrombosis (DVT), treating 2.212 million adult hospitalized DVT cases (those with DVT as the primary discharge diagnosis or among other diagnoses and aged ≥ 18 years). The diagnosis accounted for 2.7% of hospitalized patients with CVD. The hospital mortality rate among hospitalized patients with DVT was 2.0%, and the non-rehabilitated discharge rate was 7.1%. 67.0% of hospitalized patients with DVT had a history of surgical intervention, and 15.8% had malignant tumors (Figure 36B). During hospitalization, 1.6% of patients received catheter thrombolysis, 1.3% underwent interventional thrombectomy, 0.2% underwent surgical thrombectomy, and 7.6% received venous filters.
-
According to HQMS data, in 2024 a total of 6,602 hospitals admitted patients with cardiomyopathy (with cardiomyopathy as the primary or other discharge diagnosis), accounting for 78.9% of all hospitals treating CVD patients hospitalized under HQMS. During the year, 887,000 patients with cardiomyopathy were admitted, among whom 189,000 had cardiomyopathy as the primary diagnosis. Among all cardiomyopathy cases, dilated cardiomyopathy (DCM) accounted for the highest proportion (65.9%), followed by hypertrophic cardiomyopathy (HCM) at 17.4% (Figure 37).

Figure 37. Distribution of cardiomyopathy types in 2024.
Among hospitalized patients with cardiomyopathy in 2024, women accounted for 36.7%. The sex distribution varied by cardiomyopathy type: women accounted for 35.2%, 39.4%, 44.7%, 46.9%, 39.3%, 12.7%, 36.8%, and 39.3% of patients with DCM, HCM, restrictive cardiomyopathy, arrhythmia-related cardiomyopathy, metabolic cardiomyopathy, syndromic cardiomyopathy, amyloid cardiomyopathy, and other myocardial involvement disorders, respectively.
In 2024, there were 222,000 hospitalizations for non-genetic or idiopathic DCM, with uremic cardiomyopathy accounting for the highest proportion (37.1%), followed by anemic heart disease (21.7%). Among hospitalizations for non-HCM myocardial hypertrophy, 44,000 cases involved amyloid cardiomyopathy (43.6%), followed by Fabry disease (26.4%) (Figure 38).
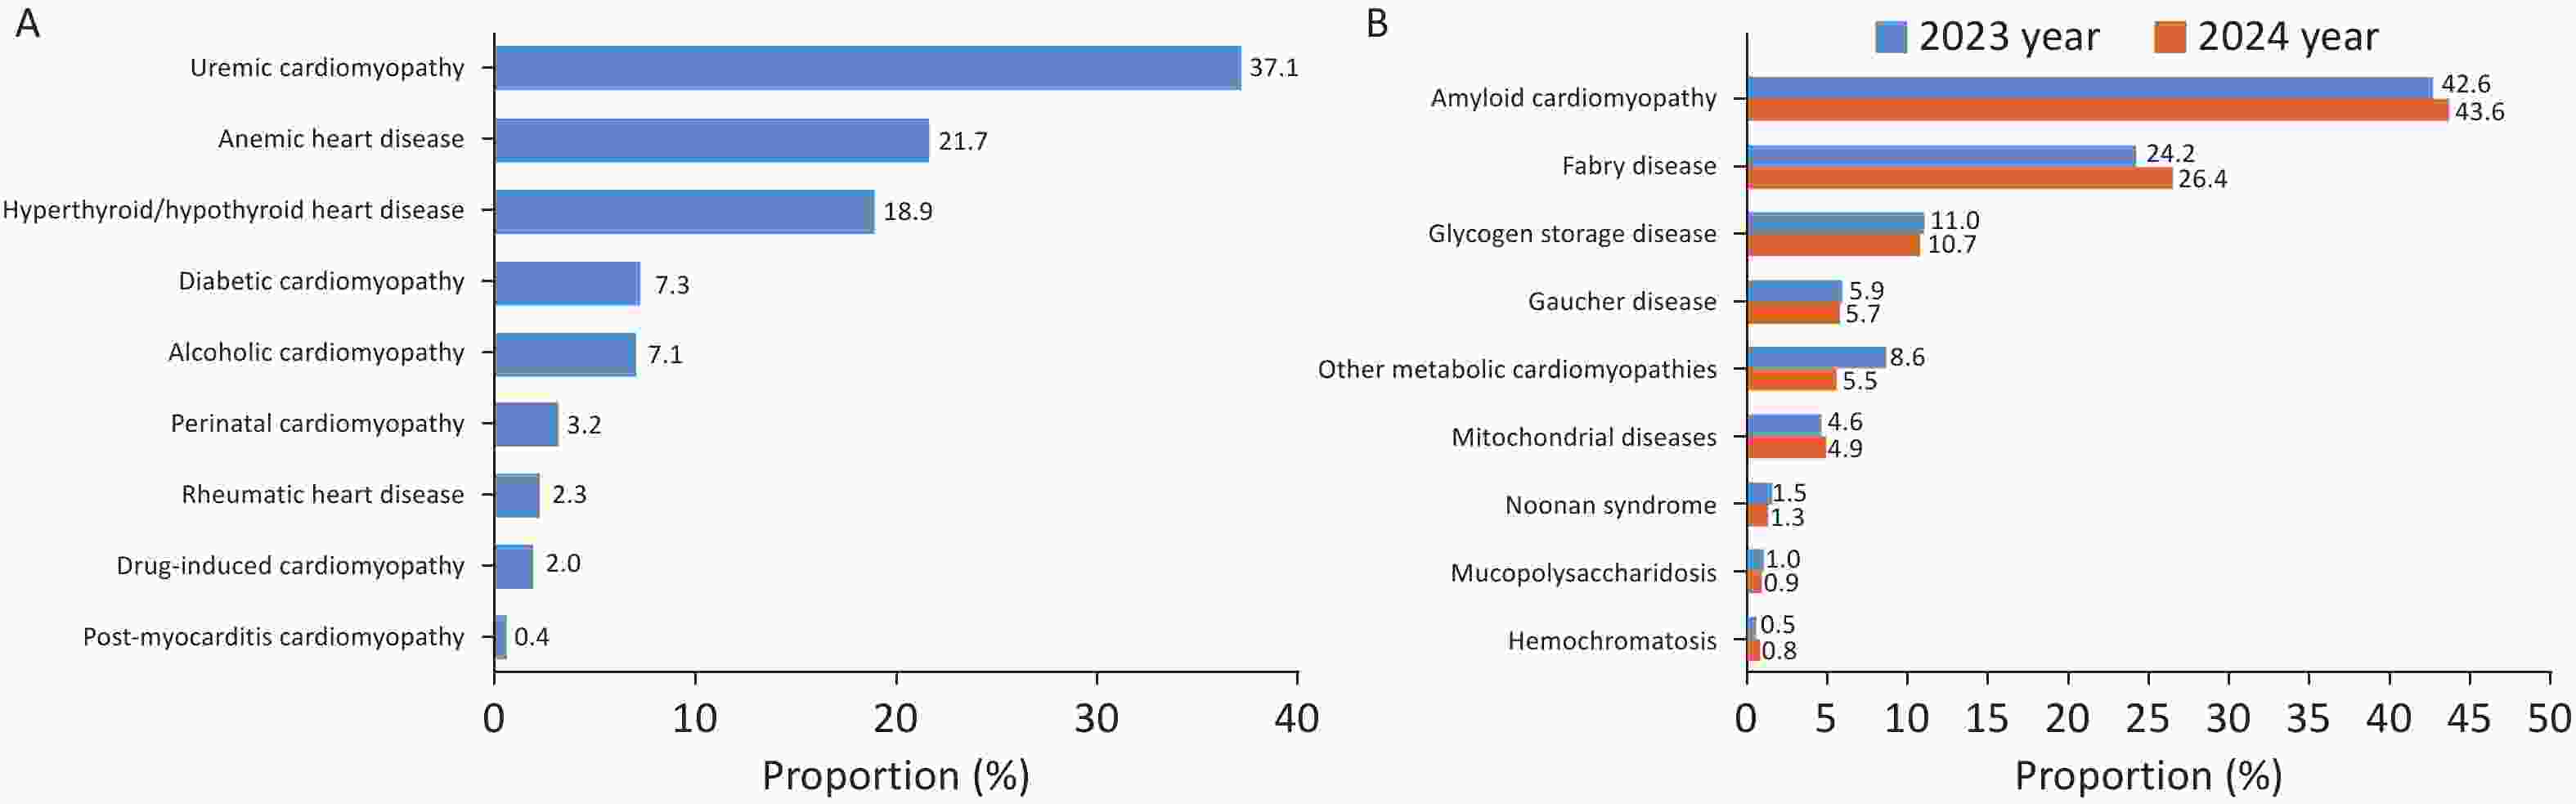
Figure 38. Distribution of primary etiologies among hospitalizations for non-genetic or idiopathic dilated cardiomyopathy (38A) and non-HCM myocardial hypertrophy (38B). Hyperthyroidism: Overactivity of the thyroid gland; Hypothyroidism: Underactivity of the thyroid gland.
Among patients with a primary diagnosis of cardiomyopathy, 70.6% had heart failure, 22.7% had atrial fibrillation/flutter, 8.9% had PH, 7.1% had ventricular tachycardia, and sudden death occurred in 0.8%. In-hospital mortality was 0.9%, and the non-rehabilitated discharge rate was 4.5%.
Regarding diagnostic and therapeutic capacity, a total of 85 hospitals performed myocardial biopsies, accounting for 1.3% of all hospitals treating cardiomyopathies. Throughout the year, only 569 myocardial biopsies were performed, a decrease from 608 cases in 2023. Among patients primarily diagnosed with cardiomyopathy, the proportion undergoing myocardial biopsy was only 0.3%. By annual biopsy volume, the numbers of hospitals performing < 10, 10–19, and ≥ 20 biopsies were 73, 8, and 4, respectively.
In 2024, 0.51% of cardiomyopathy patients received ICD therapy, while 0.62% received CRT/CRT-D therapy. Among cardiomyopathy patients with atrial fibrillation/atrial flutter, 3.89% underwent radiofrequency ablation, representing 0.16% of all patients treated with radiofrequency ablation for atrial fibrillation/atrial flutter.
Among hospitalized HCM patients, 2.02% underwent the Morrow or modified Morrow procedure, 0.76% received ventricular septal ablation, 0.51% received ICD therapy, and 0.08% received CRT/CRT-D therapy. Among HCM patients, 23.8% had concomitant atrial fibrillation/atrial flutter, of whom 8.3% received catheter ablation for atrial fibrillation and 0.4% received surgical ablation for atrial fibrillation. The inpatient mortality rate for the Morrow or modified extended Morrow procedure in HCM patients was 1.0%, with a non-rehabilitated discharge rate of 1.9%. The inpatient mortality rate for ventricular septal ablation therapy was 0.1%, and the non-rehabilitated discharge rate was 0.8%.
An international multicenter study led by Chinese investigators focused on carriers of desmosomal gene DSG2/DSC2 variants, revealing that their phenotypes are more prone to right ventricular/biventricular dysfunction; multiple genetic variants are not uncommon and, compared with single variants, are associated with higher penetrance, earlier onset, and a significantly increased risk of adverse events such as end-stage heart failure. The risk of end-stage heart failure among individuals carrying DSG2/DSC2 variants is even higher than the risk among those with classic PKP2 mutations, suggesting that refined genotyping (particularly for identifying multi-locus/complex variants) should be a core component in the risk stratification of arrhythmogenic cardiomyopathy/desmosome-related cardiomyopathy[96].
A national sampling survey conducted across 66 hospitals, randomly selected based on geographic and economic stratification, showed that the proportions of cardiomyopathy cases in outpatient and inpatient settings increased by 38.6% and 33.0%, respectively, from 2017 to 2021, indicating a continued rise in disease burden. Although most hospitals have basic assessment capabilities, advanced and complex diagnostic and therapeutic approaches remain limited, and comprehensive management remains inadequate; only four hospitals (6.1%) met the criteria for comprehensive cardiomyopathy centers (all located in provincial hospitals in developed cities), while another 29 hospitals (43.9%) met the standards for primary centers, with diagnostic and treatment capabilities showing significant disparities across administrative and economic tiers[97].
-
According to HQMS data, in 2024, the number of patients undergoing PCI was 4.183 million, with 448,000 receiving cardiac rehabilitation, accounting for 10.7% of the total. The numbers of patients receiving cardiac rehabilitation after CABG, valvular heart disease surgery, and heart failure were 40,000, 51,000, and 1.199 million, respectively, with rehabilitation participation rates of 16.5% (40,000 cases/243,000 cases), 19.0% (51,000 cases/269,000 cases), and 9.6% (1.199 million cases/12.483 million cases).
A survey of the current status of cardiac prevention and rehabilitation services in China's hospitals showed that among 20,000 patients with cardiovascular disease across 159 hospitals in 33 provincial-level administrative regions (excluding Qinghai Province) from February 2012 to December 2021, 73.12% opted for hospital-based rehabilitation, 8.01% chose home-based rehabilitation, and 18.87% selected a hybrid rehabilitation model[98].
-
According to HQMS data, in 2024, 5,239 hospitals provided OSA diagnosis and treatment services, of which 1,421 could perform overnight sleep apnea monitoring, and 2,527 offered non-invasive positive airway pressure therapy, accounting for 62.6%, 17.0%, and 30.2% of the total hospitals providing CVD-related diagnostic and treatment services in HQMS, respectively. That year, a total of 406,000 hospitalized patients with comorbid OSA (those with an OSA diagnosis at discharge and aged ≥ 18 years) were treated, representing 0.5% of all CVD hospitalizations. Among these patients, 32,000 (7.8%) received non-invasive positive airway pressure therapy during hospitalization. The top four comorbid conditions among hospitalized patients with OSA in 2024 were hypertension (80.9%), coronary heart disease (34.9%), cardiac arrhythmia (20.8%), and heart failure (20.1%). The rate of non-rehabilitated discharge (including death during hospitalization or discharge without medical orders) among CVD patients with OSA was 2.1%, while the mortality rate was 0.28%.
-
HQMS data indicate that in 2024, the numbers of hospitals providing monitoring and treatment for CVD (excluding cerebrovascular diseases) complicated by CKD or acute kidney injury (AKI), or providing hemodialysis, peritoneal dialysis, or continuous renal replacement therapy (CRRT), were 7,703, 6,120, 4,314, 1,982, and 3,708, respectively, accounting for 92.1%, 73.1%, 51.6%, 23.7%, and 44.3% of the total hospitals treating CVD patients (8,367).
Among hospitalized CVD patients in 2024, 10.918 million cases (13.3%) had comorbid CKD; 535,000 cases (0.65%) had AKI; 1,248,000 cases (1.51%) underwent hemodialysis; 225,000 cases (0.27%) received peritoneal dialysis; and 338,000 cases (0.41%) received CRRT. Among patients with cardiomyopathy, heart failure, or pulmonary hypertension, the prevalence of comorbid CKD was highest, accounting for 30.6%, 23.5%, and 20.5%, respectively. Patients undergoing PCI, endovascular aortic surgery, open aortic surgery, CABG, or valvular procedures accounted for 9.1%, 12.7%, 13.8%, 8.8%, and 8.5% of cases, respectively.
Among patients with CKD, 64.5% were diagnosed with chronic renal insufficiency or chronic renal failure. The prevalences of comorbid hypertension, diabetes mellitus, and renal artery stenosis among CKD patients were 77.0%, 41.2%, and 0.6%, respectively.
Among hospitalized patients with CVD in 2024, those with concurrent CKD had higher rates of inpatient mortality, non-rehabilitated discharge (discharge due to inpatient death or non-medical reasons), and AKI: 1.9%, 6.9%, and 3.7%, respectively, all significantly higher than those without CKD (0.6%, 3.7%, and 0.5%). However, the length of hospital stay was comparable between the two groups, at 7 days.
-
According to HQMS data, in 2024, 7,858 hospitals admitted stroke patients (with discharge diagnoses primarily including cerebral infarction, intracerebral hemorrhage, or subarachnoid hemorrhage), comprising 2,612 tertiary hospitals and 5,246 secondary hospitals. In 2024, a total of 16.92 million stroke patients were admitted, of whom 93.7% had cerebral infarction. The mean age of stroke patients was (68.9 ± 11.7) years, and the mean ages for patients with cerebral infarction, intracerebral hemorrhage, and subarachnoid hemorrhage being (69.4 ± 11.3), (63.1 ± 14.3), and (61.4 ± 15.2) years, respectively. Hypertension, coronary heart disease, and diabetes were the most common comorbidities among hospitalized stroke patients, accounting for 67.7%, 30.2%, and 28.5% of cases, respectively. The in-hospital mortality rate among hospitalized stroke patients was 1.0%, while the non-rehabilitated discharge rate was 5.3%.
Among the 25.772 million hospitalized patients with coronary heart disease as a discharge diagnosis in 2024, the prevalence of concomitant cerebrovascular disease was 20.5%. Among the 5.116 million patients with atrial fibrillation or atrial flutter as a discharge diagnosis, the prevalence of concomitant cerebrovascular disease was 21.0%. Among the 2.244 million patients undergoing PCI, the prevalence of concomitant cerebrovascular disease was 6.3%. Among the 82,000 patients undergoing CABG, the prevalence of concomitant cerebrovascular disease was 11.7%.
-
High-level basic CVD research in China began to gain momentum after 2005. In recent years, an increasing number of influential papers have been published in top international and domestic journals such as Nature, Cell, Circulation, Eur Heart J, Circ Res, and Signal Transduct Target Ther. A search of influential journals indicates rapid growth in both the quality and quantity of cardiovascular basic research in China in recent years.
From 2024 to 2025, a total of 251 high-level basic research papers were identified with first and corresponding author affiliations in China (excluding Taiwan), including 158 with impact factor (IF) >15 (published in Nature and its affiliated journals, Cell and its affiliated journals, Circulation, Eur Heart J, Circ Res, etc.) and 93 with IF 10–15 (published in Adv Sci, Cardiovasc Res, Nat Cardiovasc Res, etc.) (Figure 39). Research topics included MI, heart failure, ischemia-reperfusion injury, arrhythmia, atrial fibrillation, cardiomyopathies (HCM, DCM, diabetic cardiomyopathy), aneurysm, atherosclerosis, hypertension, PH, and cardio-oncology. Mechanistic studies covered cardiac remodeling, myocardial injury, regeneration, aging, vascular aging and remodeling, and metabolic abnormalities. Cardiac protection and regeneration, gene therapy, and nanomaterial drug remained prominent active areas of research.
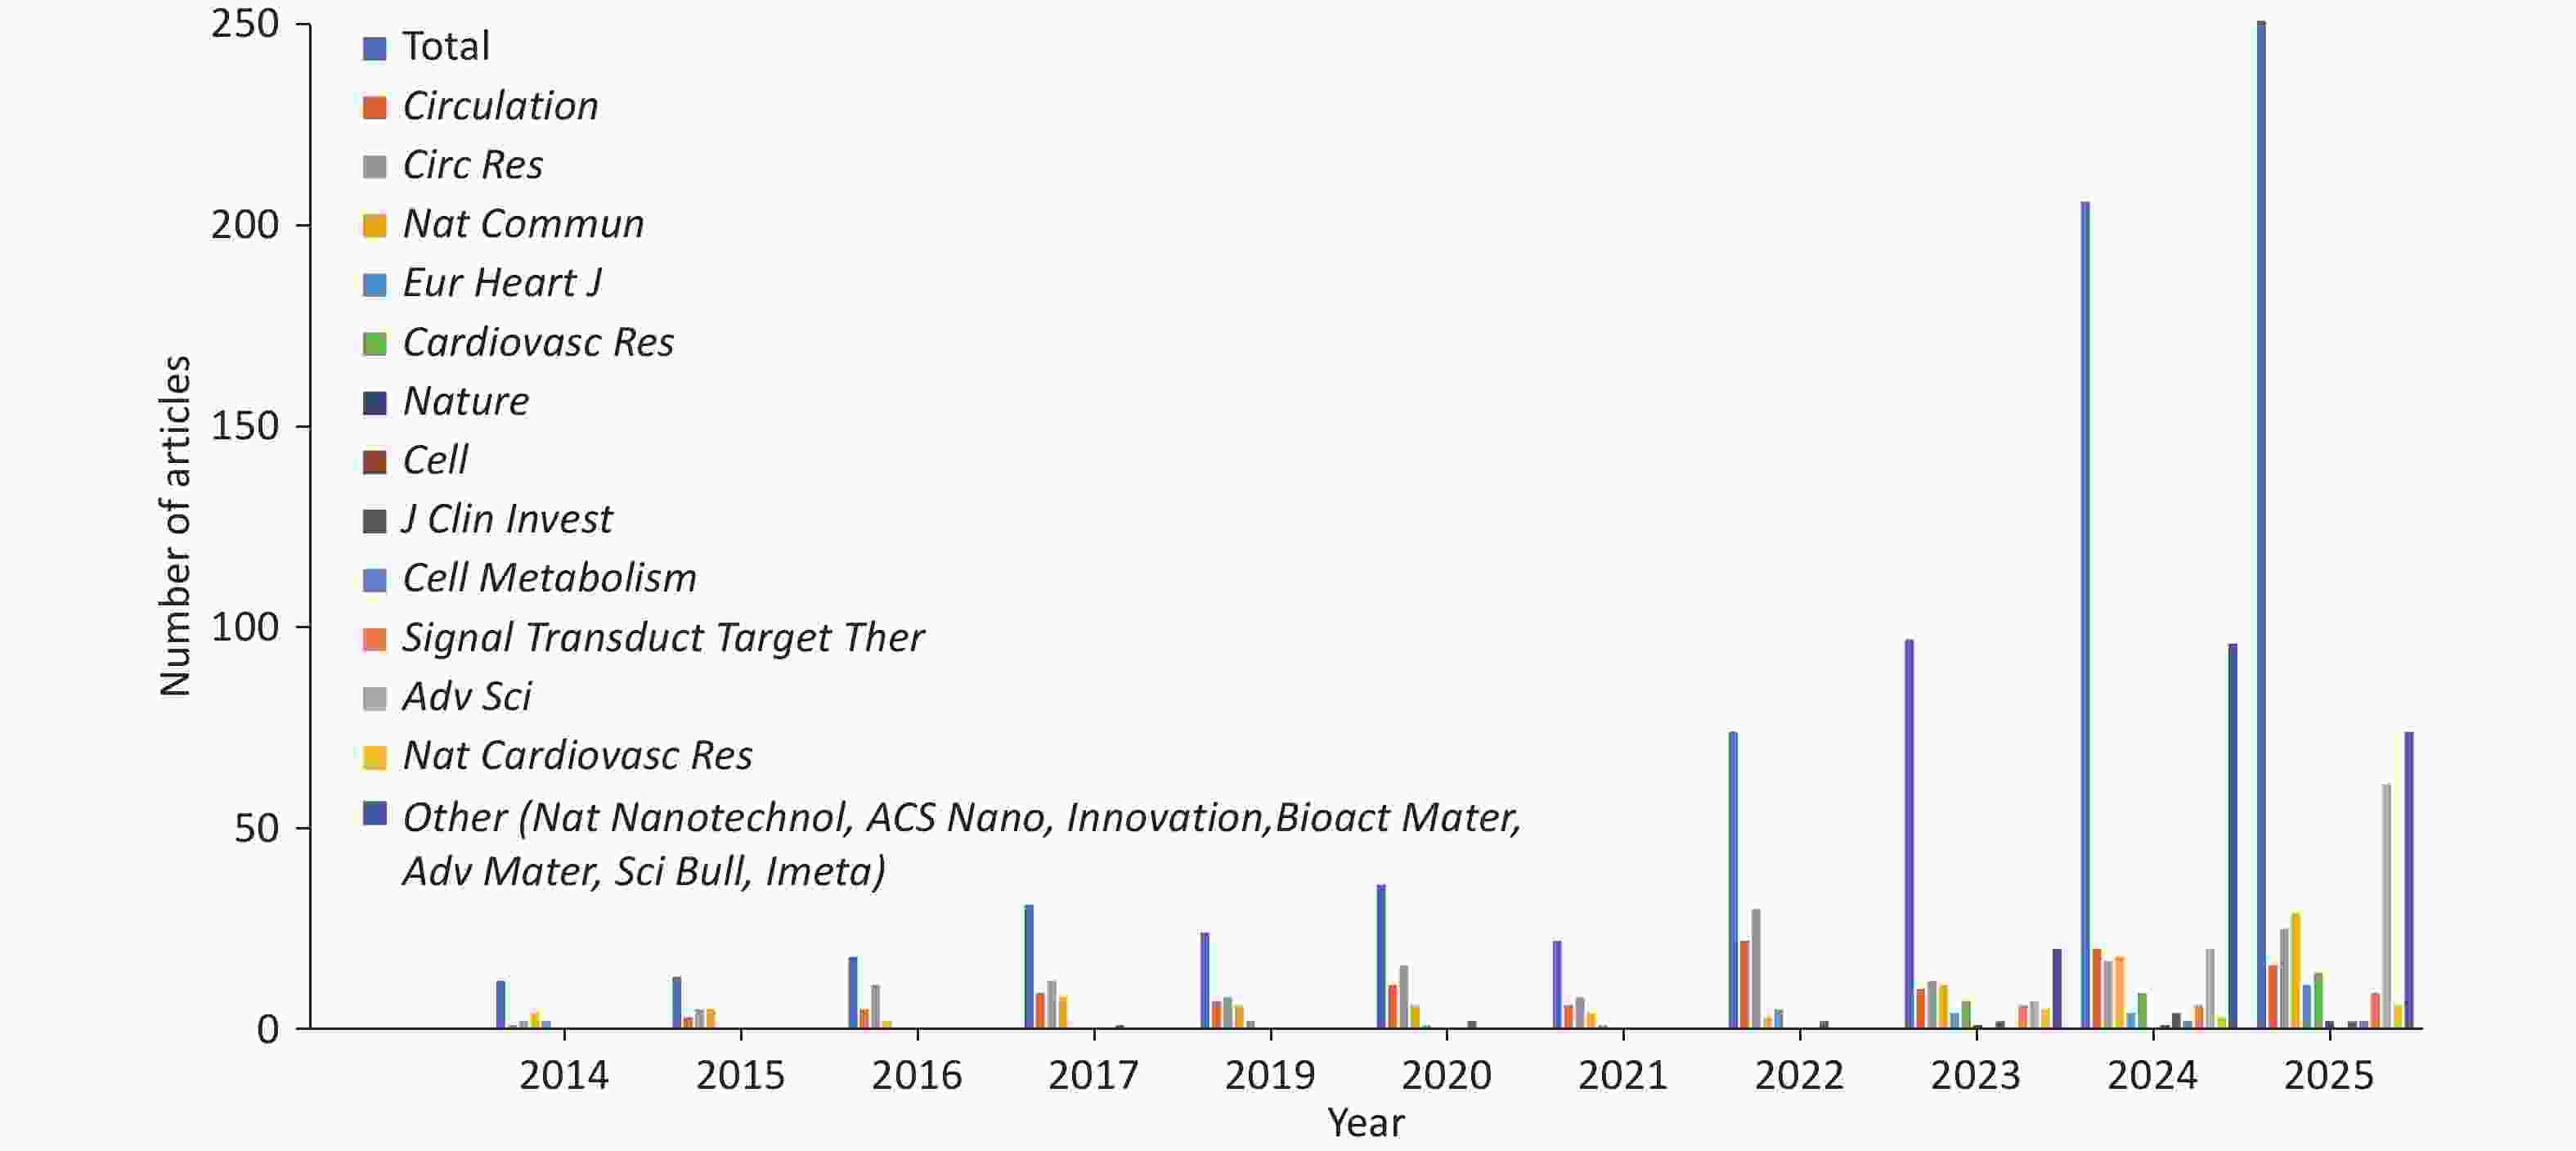
Figure 39. Number of high-quality cardiovascular basic research papers published by leading institutions and corresponding author institutions in China from 2014 to 2025.
-
In recent years, CVD research in China has shown vigorous growth in both quantity and quality. China now ranks second globally, behind the United States, in the number of CVD publications. Since 2018, the growth rate has been consistently higher than that in the United States, and annual publication volume approached that of the United States by 2024. Using the Cardiovascular Academic Performance Evaluation (CAPE) system[99], a search for 2024 papers published by Chinese authors (excluding Hong Kong, Macao, and Taiwan, China) in Journal Citation Reports (JCR) Q1 journals yielded 6,359 papers; manual screening identified 3,342 clinical research papers. Among these, > 60% had IF < 5, 32% had IF 5–10, 6% had IF 10–20, and 2% had IF ≥ 20. The top five research areas were coronary heart disease, hypertension, arrhythmia, heart failure, and aortic/peripheral vascular disease, together accounting for > 70% (Figure 40A).
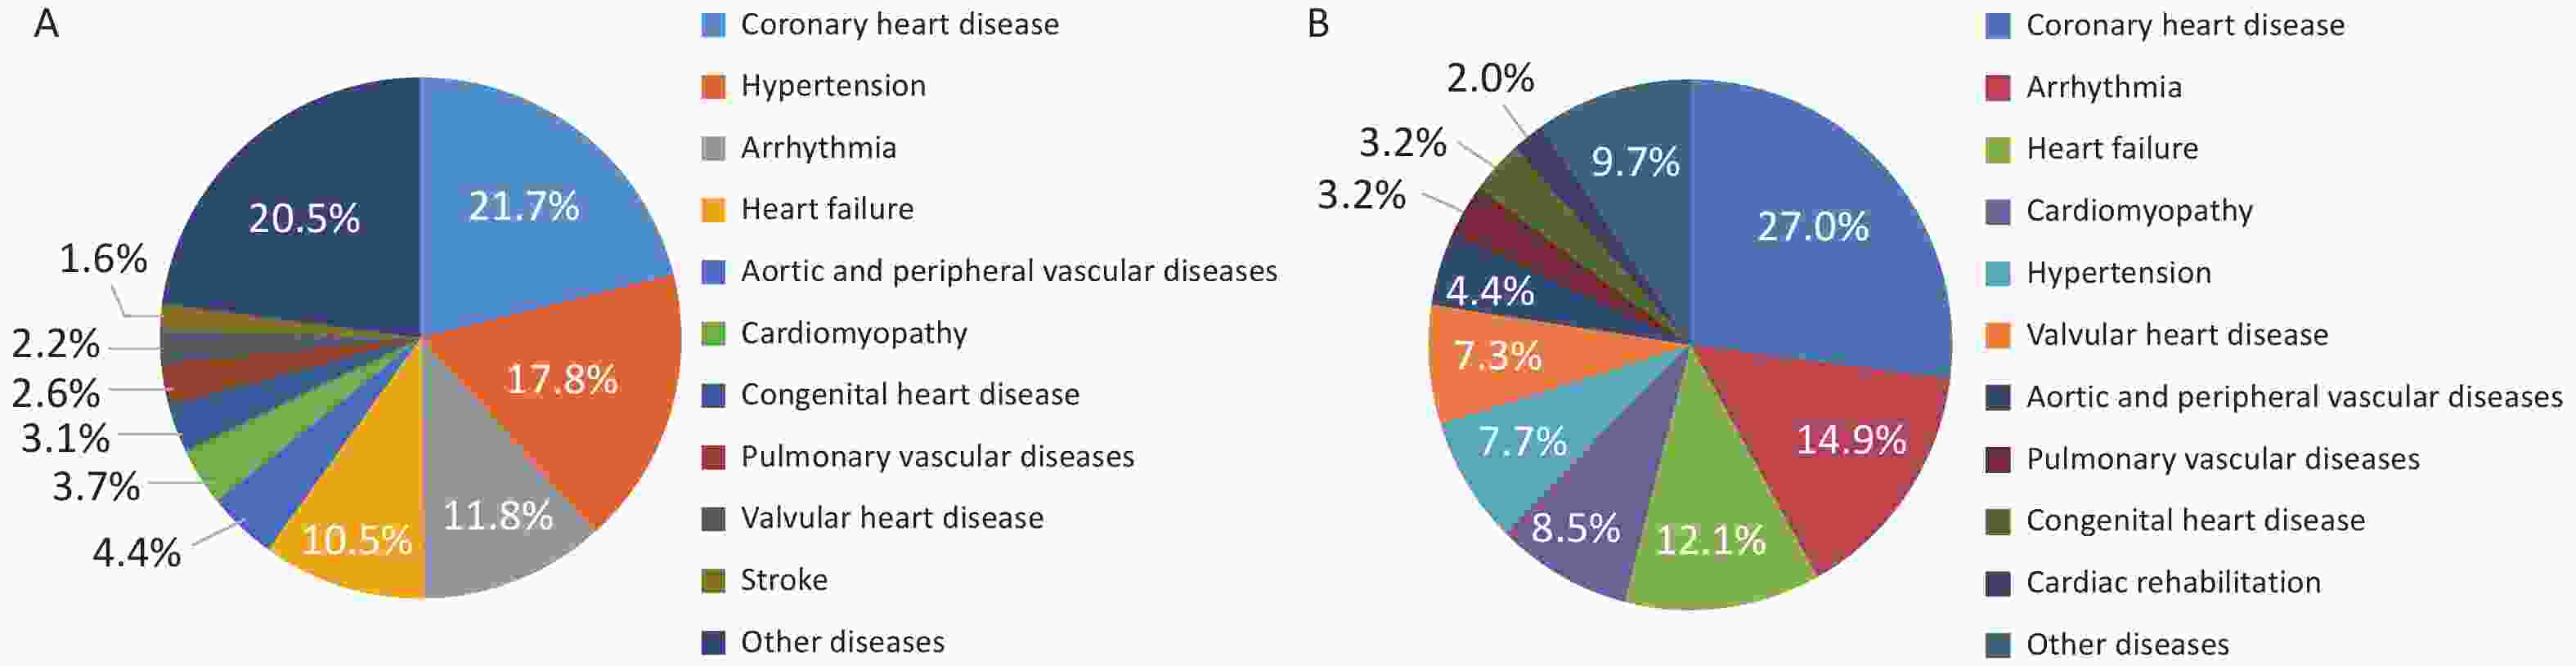
Figure 40. In 2024, cardiovascular clinical research papers by Chinese authors published in journals classified as Zone 1 in the Journal Citation Reports (40A) and China-led cardiovascular clinical studies registered on ClinicalTrials.gov (40B) were identified.
Chinese authors (excluding Hong Kong, Macao, and Taiwan, China) published 22 high-level clinical research articles in the top four general medical journals (NEJM, Lancet, JAMA, BMJ), the top five cardiovascular journals (Eur Heart J, Circulation, JACC, JAMA Cardiol, Circ Res), and three leading multidisciplinary journals (Cell, Nature, Science). Among these, 15 were randomized controlled trials, with coronary heart disease and hypertension as the predominant topics. The number of articles in top-tier journals increased by 10% compared to the previous year.
ClinicalTrials.gov data for 2024 showed 362 clinical trial registrations led by Chinese investigators in the cardiovascular and cerebrovascular fields. In the cardiovascular field (248 registrations), the top five areas were coronary heart disease (27.0%), arrhythmia (14.9%), heart failure (12.1%), cardiomyopathy (8.5%), and hypertension (7.7%), together exceeding 70% (Figure 40B).
The Center for Drug Evaluation (CDE) of the National Medical Products Administration (NMPA) registration platform recorded 596 trials led by Chinese investigators in 2024; after excluding bioequivalence studies, 94 cardiovascular clinical trial registrations were identified, primarily phase I and phase III trials, together exceeding 80%, involving hypertension, heart failure, and dyslipidemia (Figure 41).
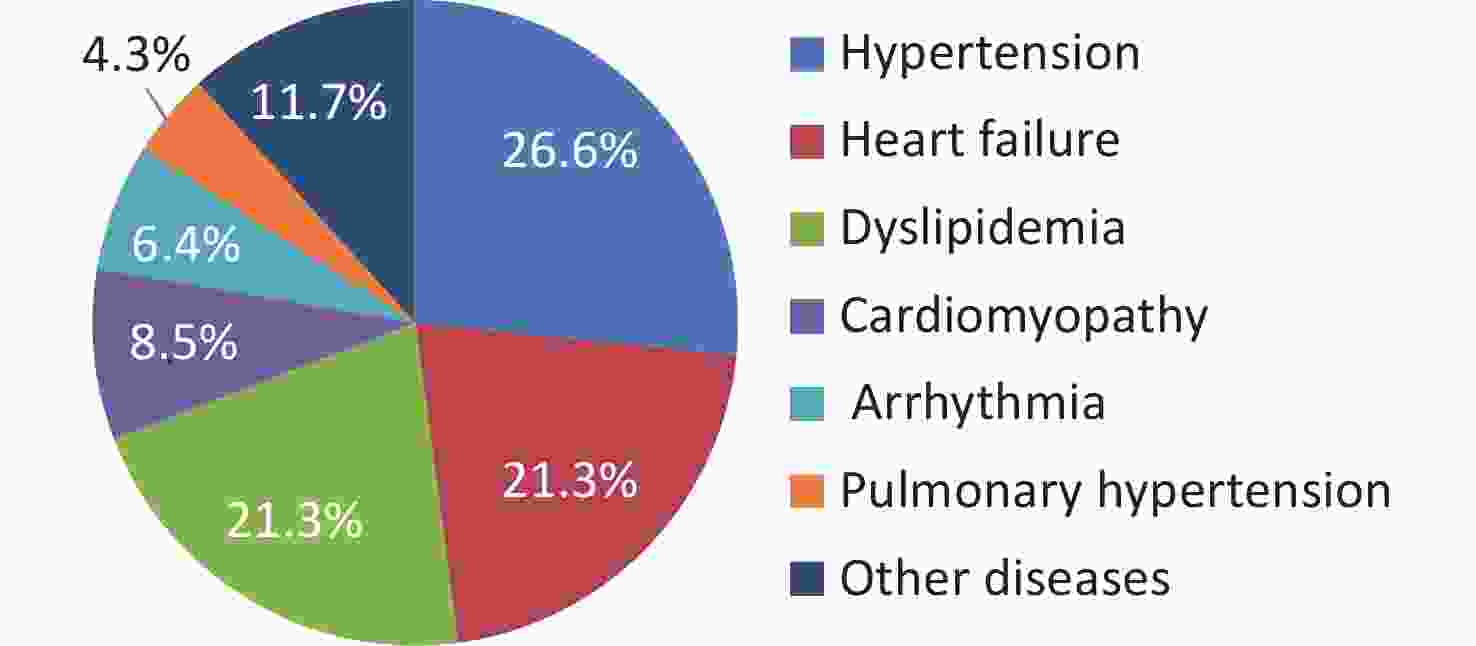
Figure 41. China-led clinical trials registered with the Center for Drug Evaluation of the National Medical Products Administration in 2024.
-
From August 1, 2024, to June 30, 2025, the NMPA accepted 81 medical devices into the Innovative Device review pathway, of which 19 (23.5%) were cardiovascular products, and 72 (88.9%) were original products developed domestically, underscoring the pivotal role of cardiovascular innovation in China's medical device sector. Among the 19 cardiovascular products, the group included 2 stent-related products (e.g., branched intraoperative stent systems, thoracic endoprostheses), 2 valve products (interventional valves), 6 products for arrhythmia treatment, 1 coronary flow assessment product, and 8 other cardiovascular products (Table 6).
Product Name Applicant Institution Product Name Applicant Institution Stent Category Cardiac Pulsed Field Ablation Generator Jianhu Medical Technology (Suzhou) Co., Ltd. Branched Intraoperative Stent System Jiangsu Baiyouda Life Technology Co., Ltd. Coronary Blood Flow Evaluation Category Thoracic Aortic Multi-branched Covered Stent System Shanghai MicroPort Endovascular MedTech (Group) Co., Ltd. Intravascular Ultrasound Diagnostic System Shenzhen Haoying Medical Technology Co., Ltd. Valve Category Others Transcatheter Self-expanding Aortic Valve System Kokai (Nantong) Life Sciences Co., Ltd. Percutaneous Left Ventricular Assist System Abiomed Transcatheter Pulmonary Valve and Delivery System Beijing Balance Medical Technology Co., Ltd. Implantable Ventricular Assist System Shenzhen Core Medical Technology Co., Ltd. Arrhythmia Category Biodegradable Patent Foramen Ovale Occluder Worry-free Beat Medical Technology (Shenzhen) Co., Ltd. Magnetoelectric Positioning Balloon Pulse Ablation Device St. Jude Medical (Shanghai) Co., Ltd. Disposable Intracardiac Ultrasound Imaging Catheter Shanghai MicroPort EP MedTech Co., Ltd. Cryoablation System XinNuoPu Medical Technology (Beijing) Co., Ltd. Coronary Intervention Surgery Control System Beijing Zhongke Hongtai Medical Technology Co., Ltd. Cardiac Pulsed Field Ablation Catheter Shenzhen Maiwei Medical Technology Co., Ltd. Percutaneous Left Ventricular Assist System Suzhou Hengrui Hongyuan Medical Devices Co., Ltd. Disposable Cardiac Pulsed Field Ablation Catheter Shanghai MicroPort EP MedTech Co., Ltd. Transcatheter Patent Foramen Ovale Suture Device System Hanxin Medical Technology (Shenzhen) Co., Ltd. Magnetically Navigated Multi-channel Pulsed Field Radiofrequency Ablation System Biosense Webster (Israel) Ltd. Transcatheter Implantable Leadless Cardiac Pacemaker Xi’an Dunbo Medical Devices Co., Ltd. Table 6. Cardiovascular products entering the National Innovative Medical Device Review Channel
From August 1, 2024 to June 30, 2025, the NMPA granted priority medical device review channel qualification to 26 medical devices, among which one was a cardiovascular product, namely the endovascular arterial stent developed by Shanghai Qigong Medical Technology Co., Ltd. During the same period, a total of 171 Class III medical device registration certificates in the cardiovascular field were approved, including 141 domestic products, one of which had previously entered the National Innovative Medical Device Review Channel. Among these 141 domestic products, there were 105 interventional devices, 5 imaging devices, 1 blood flow measurement system, 0 open surgical devices, 12 active surgical devices, 4 artificial intelligence (AI) software products, and 14 diagnostic devices. In comparison with the data from July 20, 2023 to July 31, 2024 (206 registration certificates approved, including 178 domestic products, 2 of which entered the National Innovative Medical Device Review Channel), the review speed of cardiovascular medical devices by the National Medical Products Administration has slightly slowed down, and the proportion of approved innovative medical devices has declined. Nevertheless, the rapid industrial development trend of cardiovascular medical devices in China remains unchanged.
-
According to the China Health Statistics Yearbook 2024, in 2023, CVD accounted for 32.1654 million hospital discharges in China, representing 14.69% of all discharges (all causes). This included 17.9163 million for heart disease (8.18%) and 14.2491 million for cerebrovascular disease (6.51%) (Figure 42)[100].
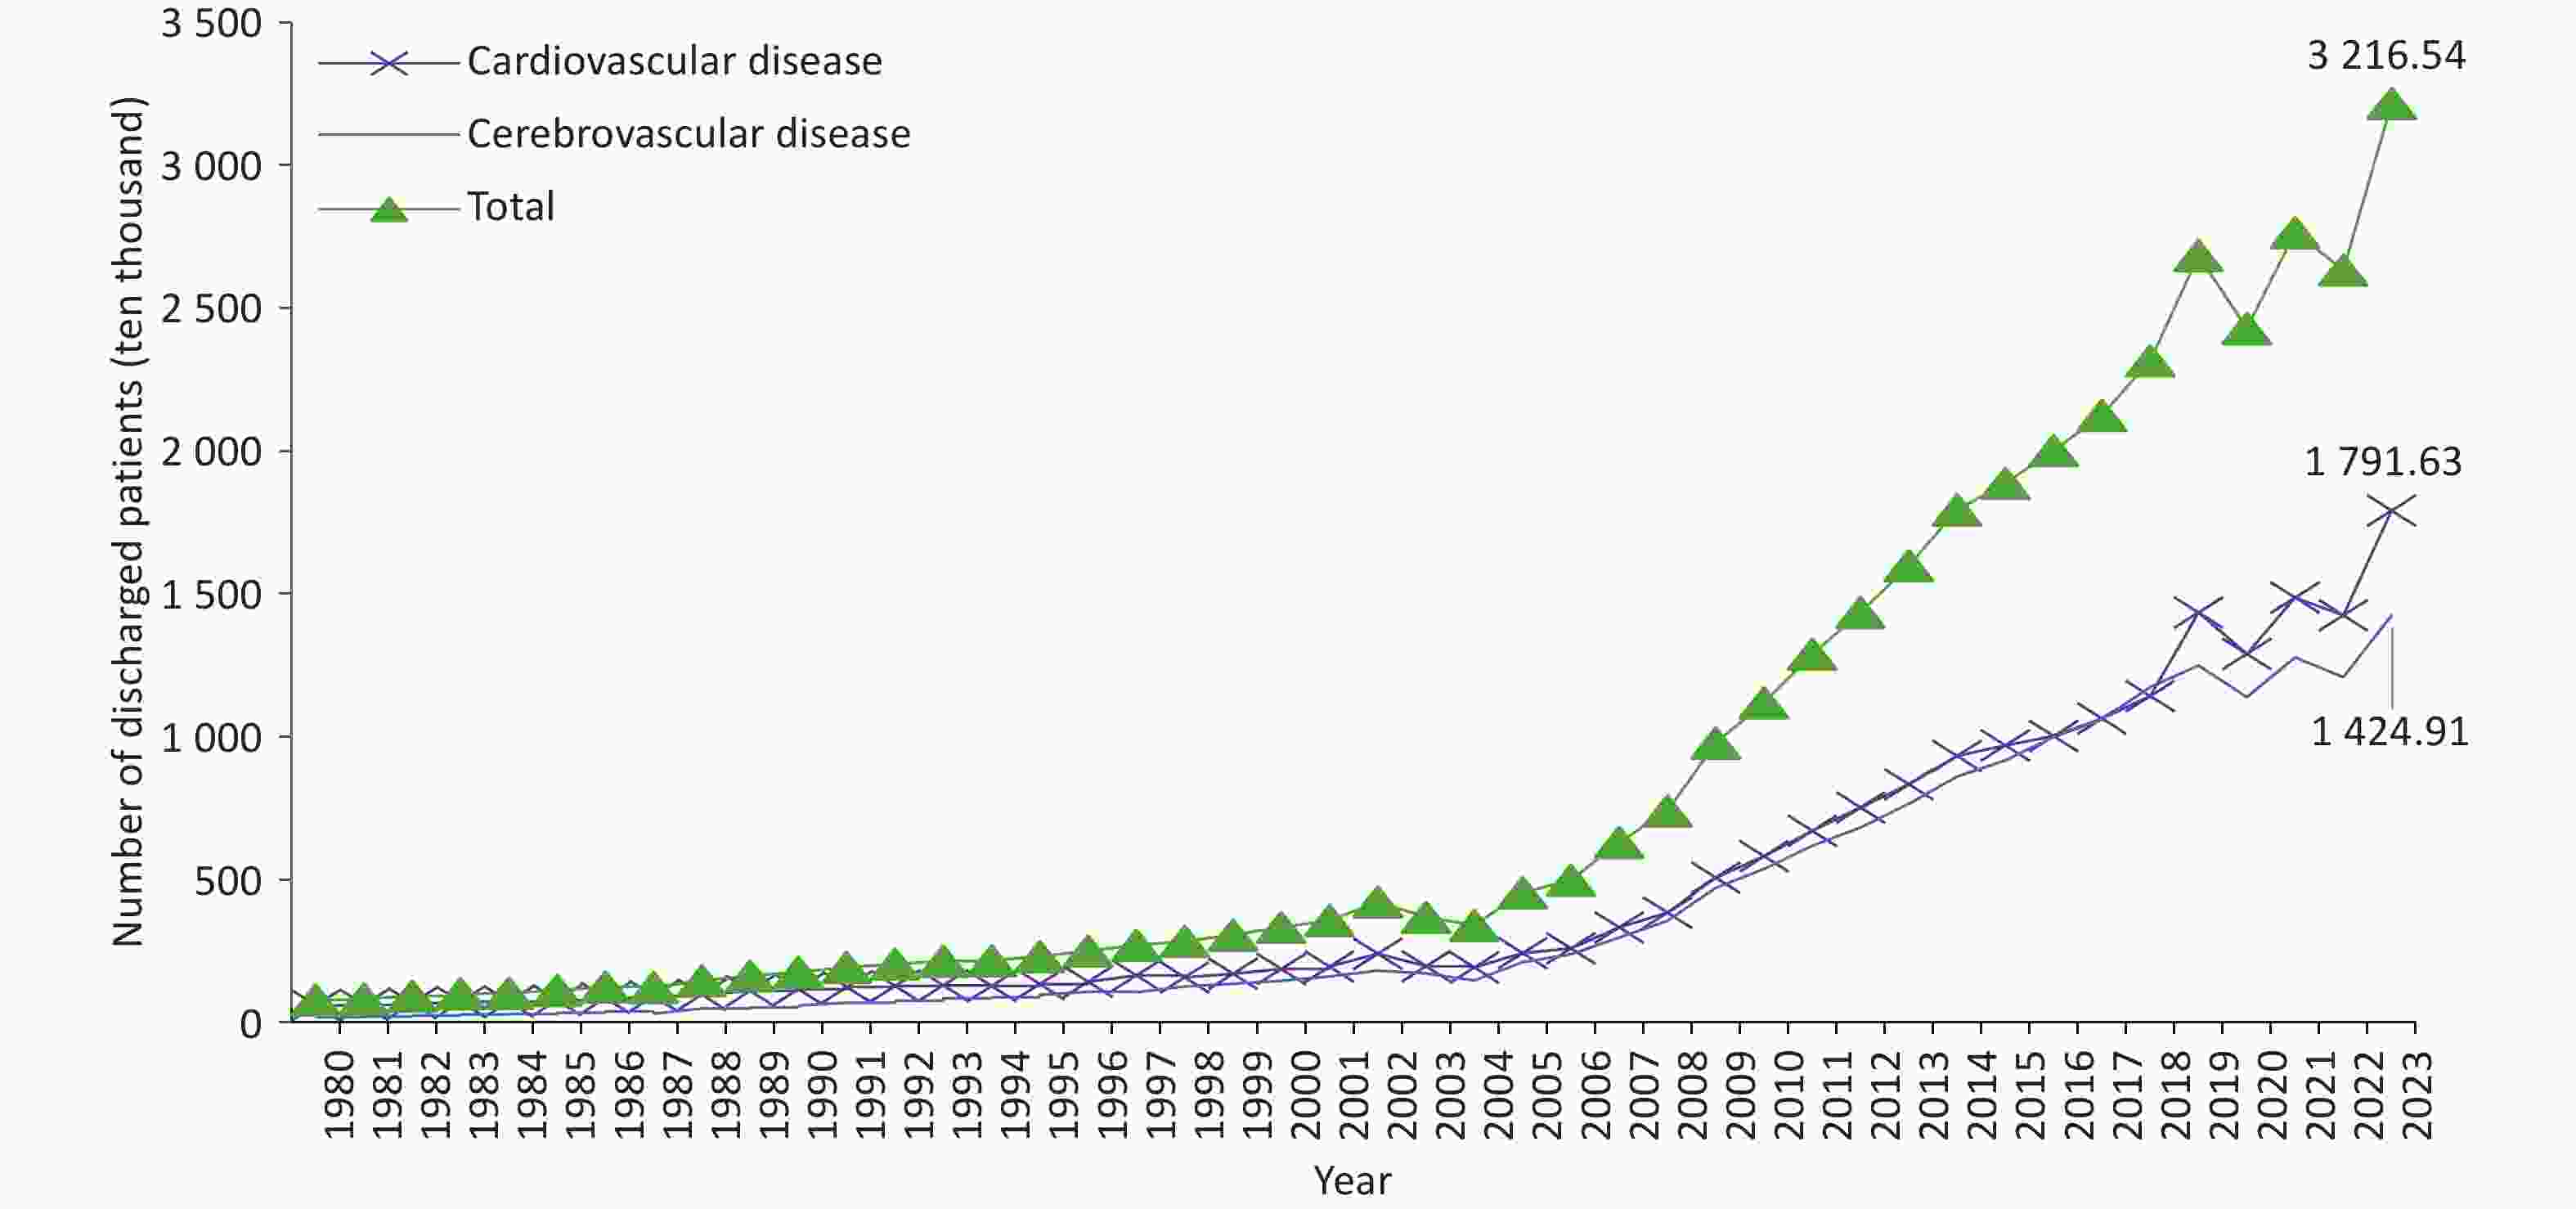
Figure 42. Numbers of hospital discharges for cardiovascular diseases in China from 1980 to 2023. Cardiovascular diseases include ischemic heart disease (angina pectoris, acute myocardial infarction, and others), chronic rheumatic heart disease, acute rheumatic fever, pulmonary embolism, arrhythmias, heart failure, hypertension (including hypertensive heart disease and renal disease), and cerebrovascular diseases (intracerebral hemorrhage and cerebral infarction). Before 2002, ischemic heart disease was referred to as coronary heart disease in the annual health statistics reports; by 2021, chronic rheumatic heart disease was excluded from this classification.
Among these, IHD (10.9876 million, including 5.7253 million for angina and 1.646 million for AMI) and cerebral infarction (9.5852 million) were the predominant subtypes, accounting for 34.16% and 29.80%, respectively (Figure 43).
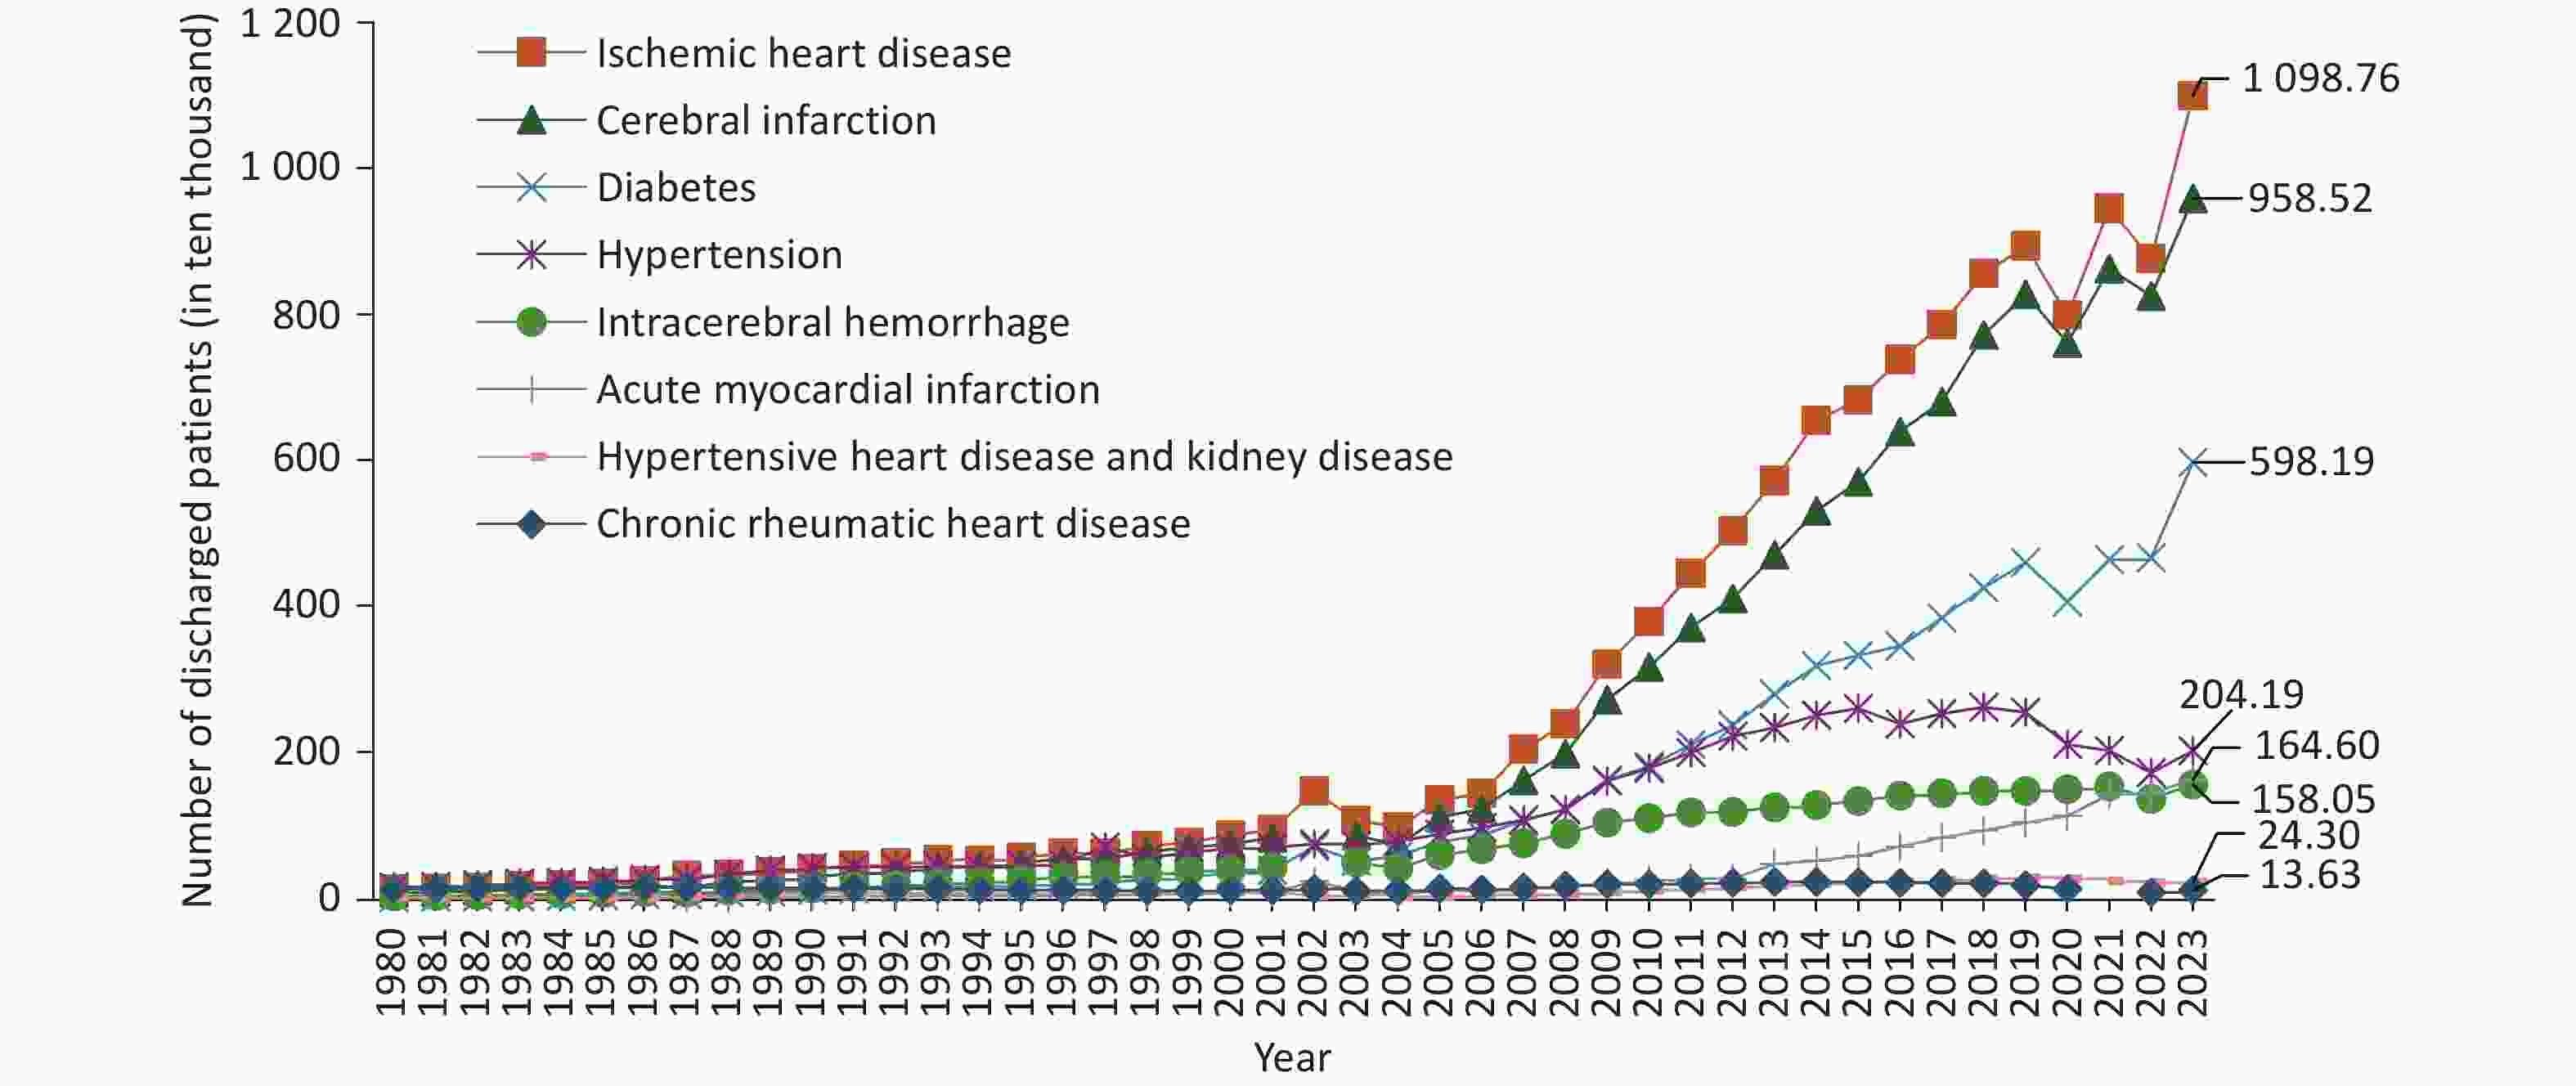
Figure 43. Discharge rates of patients with cardiovascular diseases and diabetes in China from 1980 to 2023. No cases of chronic rheumatic heart disease were reported in 2021.
According to HQMS data, total costs of hospitalizations with a primary CVD diagnosis in 2024 amounted to 296.2 billion RMB. Coronary heart disease accounted for the largest share at 40.9% (121.18 billion), followed by arrhythmia at 10.2% (30.10 billion). The average cost per hospitalization for a primary CVD diagnosis was 16,378.5 RMB, and material costs comprised the largest proportion (38.1%, 6,245.4 RMB). Surgical treatment costs were significantly higher than non-surgical treatment costs (1,861.8 vs. 600.5 RMB), and Western medicine costs exceeded traditional Chinese medicine costs (1,801.6 vs. 287.7 RMB). Valvular heart disease had the highest average cost per hospitalization (76,355.7 RMB), followed by arrhythmia, coronary heart disease, heart failure, and hypertension. Material costs accounted for a higher proportion of total costs in coronary heart disease, arrhythmia, and valvular disease, while diagnostic costs accounted for a higher proportion in heart failure and hypertension (Figure 44B).
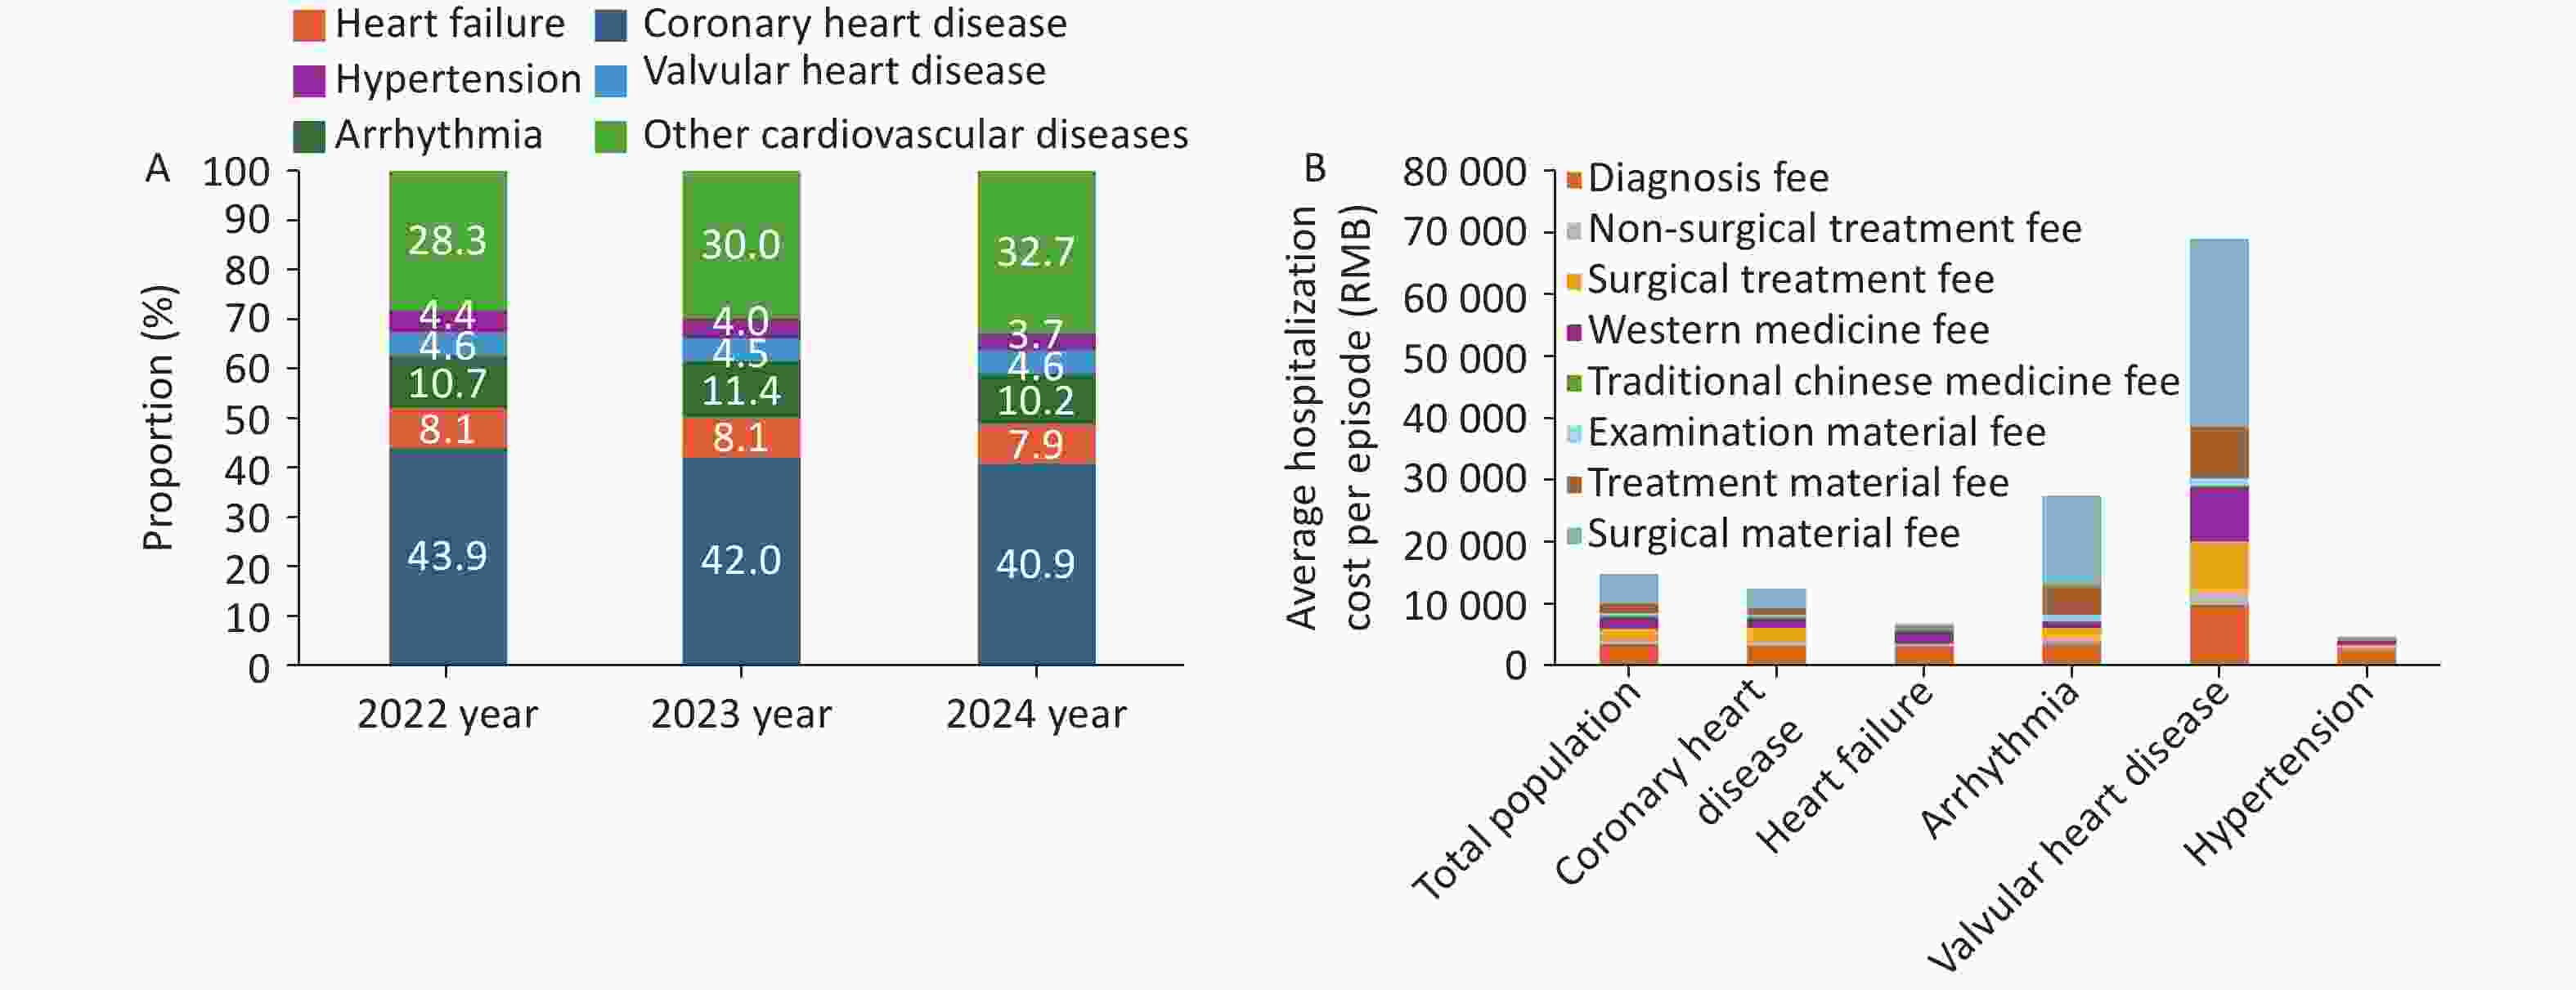
Figure 44. Distribution of total hospitalization costs for cardiovascular diseases from 2022 to 2024 (44A) and average hospitalization cost by disease in 2024 (44B).
In 2024, CVD treatment costs were concentrated among older adults, with those aged ≥60 years accounting for 66.2% of expenses. Based on the 7th census population composition, the share of CVD treatment costs exceeded the corresponding population share beginning at age 50, with the largest gap in the 70–79 age group (5.0% of population vs. 26.5% of CVD costs) (Figure 45). Among CVD patients aged ≥ 30 years, coronary heart disease treatment costs accounted for the highest proportion (61.7%); in patients aged < 30 years, arrhythmia treatment costs were proportionally higher (41.7%) (Figure 46). CVD treatment costs were higher for males than for females across major subtypes (coronary heart disease, heart failure, arrhythmia, valvular heart disease), suggesting a greater economic burden in males.
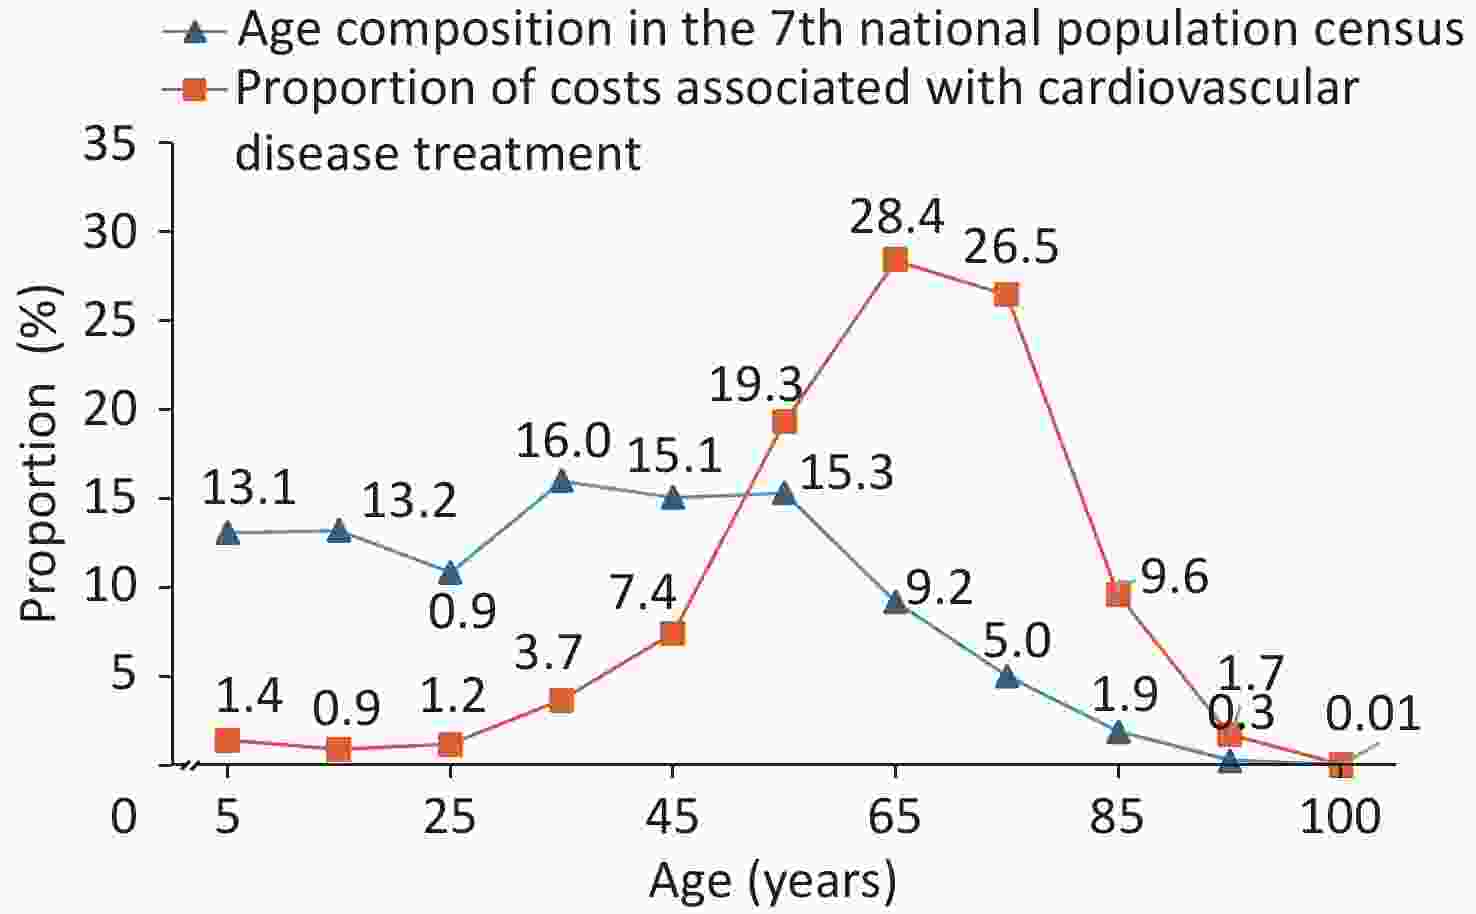
Figure 45. Age distribution of cardiovascular disease treatment costs in 2024.
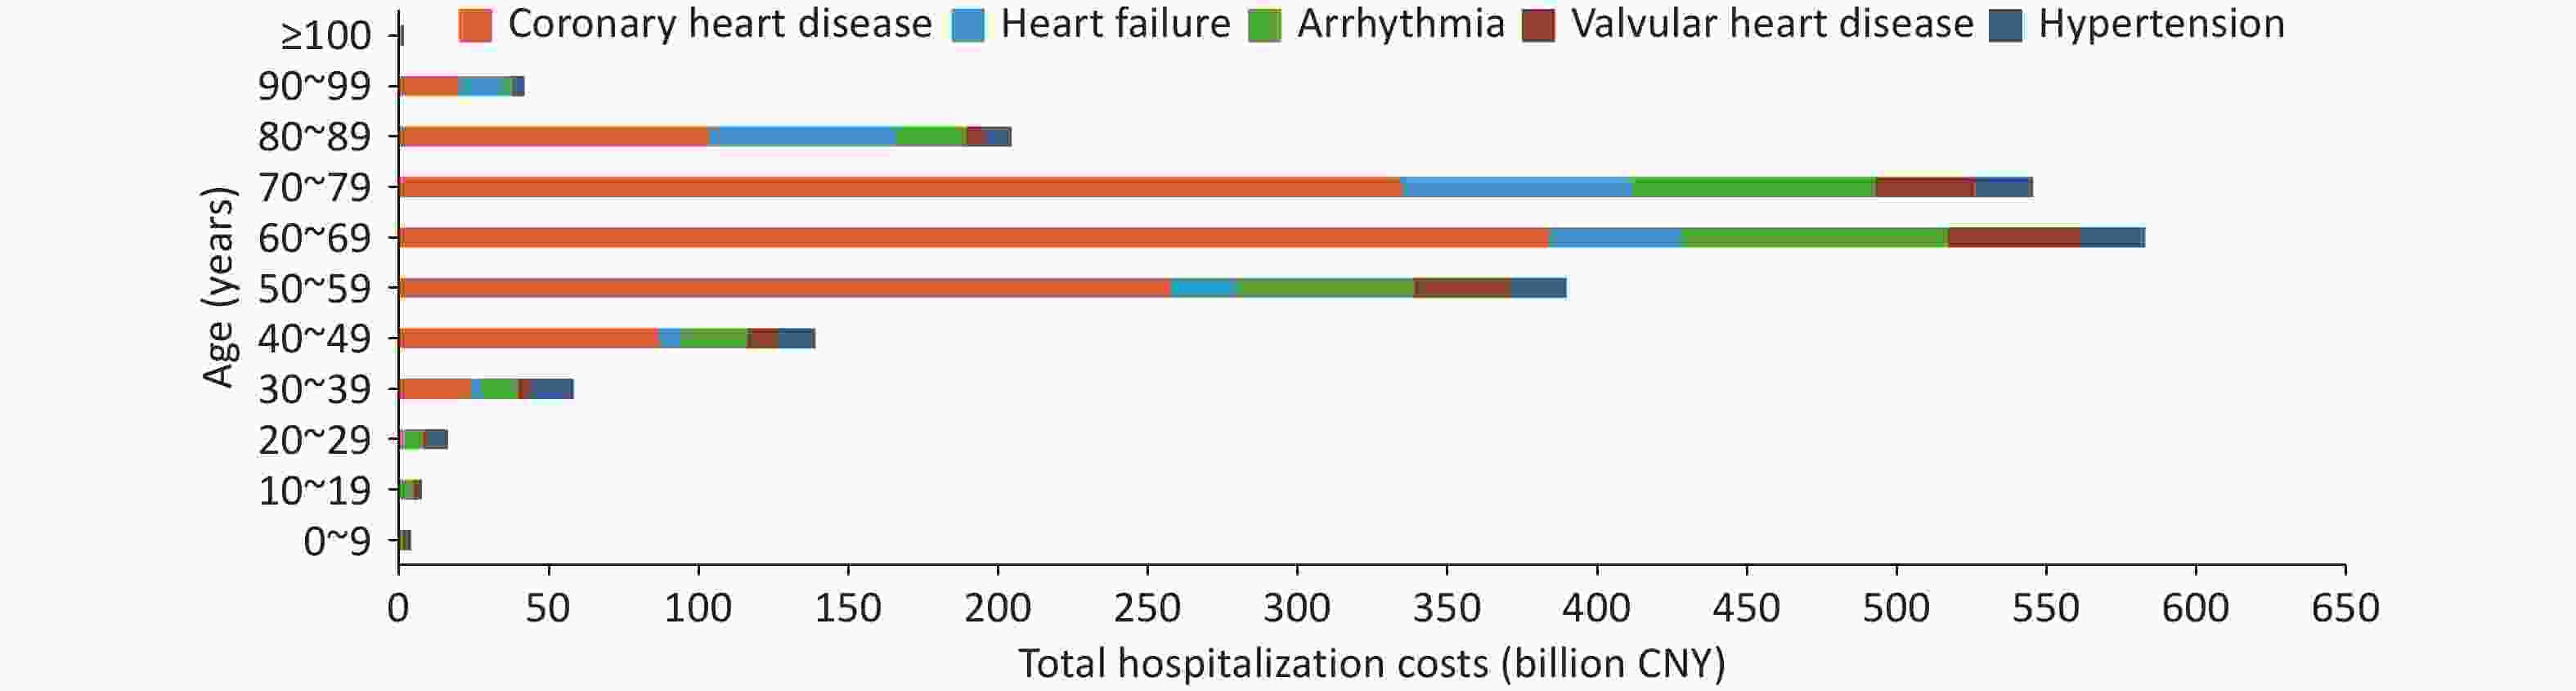
Figure 46. Total hospitalization costs for various cardiovascular diseases by age group in 2024.
The average length of stay for CVD in 2024 was 6.9 days, and valvular heart disease had the longest average stay (12.6 days), followed by heart failure (8.2 days), coronary heart disease (6.4 days), hypertension (6.3 days), and arrhythmia (5.6 days).
Report on Cardiovascular Health and Diseases in China 2025: An Updated Summary
doi: 10.3967/bes2026.000
-
Key words:
- Cardiovascular disease /
- Risk factor /
- Prevalence /
- Mortality /
- Rehabilitation /
- Basic research /
- Medical device development /
- Health economics
Abstract: The “Report on Cardiovascular Health and Diseases in China 2025”, guided by the National Health Commission and compiled under the auspices of the National Center for Cardiovascular Diseases, systematically integrates multi-dimensional data on cardiovascular diseases (CVD) trends, the evolution of risk factors, advances in diagnosis and treatment, rehabilitation management, medical device innovation, and health economics evaluations in China, providing a scientific basis for policy formulation, resource allocation, and intervention prioritization. According to the data, CVD remains the leading cause of death among urban and rural residents in China, accounting for 48.98% of rural deaths and 47.35% of urban deaths in 2021, approximately 2 in every 5 deaths were attributable to CVD. Although the age-standardized mortality rate has declined, the absolute number of CVD cases and deaths continues to rise due to accelerated population aging and the high prevalence of risk factors. In 2024, the crude incidence rate of CVD among Chinese residents aged 18 years and above was 639.46 per 100 000 population, with rates higher in males than in females. The mortality rate in rural areas has consistently remained higher than in urban areas. The Healthy China Action Plan (2019-2030) sets a target to reduce the mortality rate of cardiovascular and cerebrovascular diseases to below 190.7 per 100 000 population by 2030. To achieve this goal, the report calls for a refined monitoring system to continuously track key health indicators, including tobacco use, dietary patterns, physical activity, sleep quality, body mass index, blood pressure, blood lipids, blood glucose, and environmental exposures. This effort aims to facilitate the transition from a “treatment-centered” to a “health-centered” approach.
All authors declare no conflicts of interest.| Citation: | ? ?. Report on Cardiovascular Health and Diseases in China 2025: An Updated Summary[J]. Biomedical and Environmental Sciences. doi: 10.3967/bes2026.000

|

 Quick Links
 DownLoad: