
-
Hand, foot, and mouth disease (HFMD) is highly prevalent worldwide, particularly in China[1-3]. The associated complications and mortality underscore the need for a comprehensive assessment of the overall health impact of HFMD, commonly measured using disability-adjusted life years (DALYs). This metric integrates disease severity and incidence and has been widely applied in the Global Burden of Disease study to inform decision-making and optimize prevention policies[4-6]. Across eight Asia-Pacific countries, HFMD accounts for an average of 96,900 weighted DALYs annually[7]. The considerable economic costs, including medical expenses and productivity losses due to school absenteeism and home care, further emphasize the need for effective prevention strategies[8]. However, the disability burden imposed by HFMD, particularly on children and healthcare systems, has not been sufficiently examined[9].
Moreover, although meteorological factors may affect HFMD transmission, their potential impact on disease burden remains incompletely understood[10]. Establishing an early warning system based on weather conditions could enhance preventative measures. While the joint effect of temperature and humidity on HFMD incidence has been extensively studied, the potential modifying role of wind speed has been largely overlooked[11,12]. Wind speed, a common meteorological factor, is linked to increased risk of other infectious diseases[13,14]. Moreover, interactions among temperature, humidity, and wind speed can generate extreme environmental conditions that acutely influence HFMD incidence[15-17]. We hypothesized that wind speed alters the route of pathogen transmission or human behavior by interacting with temperature and humidity at specific thresholds, thereby increasing HFMD risk[18,19]. However, the specific thresholds at which these primary meteorological factors interact to create high-risk conditions remain unclear. Additionally, while previous studies have often assessed interactions using multiplicative models, this approach may not clearly reveal whether the combined meteorological effects exceed the sum of individual risks[20-22]. This limitation constrains public health authorities from issuing timely warnings to susceptible populations. Therefore, a more detailed understanding of how temperature, humidity, and wind speed interact to influence HFMD burden is essential.
This need is particularly acute in high-burden regions such as Guizhou Province, China, which continues to report high rates of severe HFMD despite standardized nationwide control measures[23]. This pattern may reflect shifts in pathogen distribution following widespread use of the monovalent EV-A71 vaccine in the absence of multivalent alternatives, which may have facilitated the increasing predominance of other serotypes such as CV-A16 and CV-A6[23,24]. Furthermore, HFMD transmission in Guizhou shows strong seasonality and pronounced sensitivity to meteorological variation[25,26]. These complex etiological and environmental dynamics underscore the lack of understanding of the key drivers of HFMD in Guizhou, particularly the effects of complex interactions among meteorological factors. Thus, investigating the joint meteorological effects in this context is crucial for developing targeted interventions.
Accordingly, this study leveraged provincial data from Guizhou to quantify the combined effects of temperature, humidity, and wind speed on the HFMD burden. Specifically, this study examined whether wind speed acts as an effect modifier that intensifies the effects of temperature and humidity. By using years lived with disability (YLDs) and assessing additive rather than multiplicative interaction, our approach provides novel insights to clarify the comprehensive health burden and public health significance of this meteorological synergy.
-
Guizhou, located in western China, lies within a subtropical humid monsoon climate zone. In 2012, children under 5 years of age in Guizhou constituted 3.23% of the national total in this age group, corresponding to approximately 2.44 million individuals.
The data collected in this study covered 88 counties in Guizhou. We obtained data on 524,100 daily HFMD cases in children aged 0–5 years from these counties from the Chinese Disease Prevention and Control Information System between January 1, 2012, and December 31, 2019. Each case contained details on patient age, current county code, and time of onset.
Meteorological data were obtained from the China Meteorological Data Sharing Service and included mean temperature (°C), relative humidity (%), wind speed (m/s), sunshine duration (hours), and air pressure (hPa) from 31 national meteorological stations in Guizhou[27]. Each county was matched to its nearest meteorological station based on geographic proximity using latitude and longitude coordinates. For counties without meteorological stations, data were obtained from the nearest available stations. Missing values were imputed using the average of the two preceding and two subsequent days to ensure temporal continuity and minimize bias (Supplementary Figure S1).
-
To account for HFMD severity, we used YLD as the main indicator of HFMD burden. YLD quantifies the total years of healthy life lost due to morbidity, reflecting the population-level burden of nonfatal disease[28].
Daily YLDs were calculated as the sum of YLDs from mild and severe HFMD cases according to the following formula:
$$ DailyYLD=\sum \left({I}_{mild}\times {D}_{mild}\times {L}_{mild}\right)+\left({I}_{sever}\times {D}_{sever}\times {L}_{sever}\right) $$ where $ I $ is the number of incident cases for a given severity. $ D $ is the weight used to measure the health impacts of different severity levels, which was set at 0.0285 and 0.1330 for mild and severe cases, respectively[9]. $ L $ is the duration of disability due to HFMD, which was set to 0.0252 and 0.0361 for mild and severe cases, respectively[9].
-
To identify high-risk thresholds for the meteorological factors, we applied distributed lag nonlinear models (DLNMs) to investigate the exposure-lag-response associations between each meteorological factor (mean temperature, relative humidity, or wind speed) and daily HFMD-related YLDs[18,26,29,30]. The general model structure was as follows:
$$ \begin{split} DailyYLD= & \alpha+\text{cb}\left(M,L\right)+s_1\left(T,df\right)+s_n\left(C,df\right)+ \\ & WEEK+HOLIDAY+GDP+DPI \end{split} $$ where $ \alpha $ is the intercept and $ cb\left(M,L\right) $ is the cross-basis function used to fit the association between mean temperature, relative humidity, wind speed, and YLD, as well as the variation in the association over the lag week. The lag week was used to estimate the incubation period from infection to the onset of HFMD symptoms, which is usually 14 days. To capture the shape of the overall cumulative effect during the lag period, we set the maximum lag day to 14 days. $ {s}_{1}\left(T,df\right) $ controls long-term and seasonal trends. $ {s}_{n}\left(C,df\right) $ controls for potential confounding factors, which are: sunshine duration, air pressure, and the two meteorological variables not used in the cross-basis function. For instance, when the cross-basis function $ cb\left(M,L\right) $ models mean temperature, this term controls for relative humidity and wind speed. WEEK is introduced as an indicator variable to eliminate weekly fluctuations in YLD over the course of one year. HOLIDAY is the indicator variable for holidays. GDP and DPI are the average annual gross domestic product and disposable personal income, respectively. Each DLNM used the Akaike and Bayesian information criteria to determine the optimal combination of relative risk (RR) lag weeks and degrees of freedom (df) of the natural cubic spline function. Random-effects multivariate meta-regression fitted with restricted maximum likelihood was used to pool the risk curves from the 88 counties into an overall association for the entire province.
The high-risk thresholds for meteorological factors were determined based on the pooled exposure-response curves derived from the DLNM. To ensure a transparent and objective criterion, we pre-specified the following strategy for threshold selection, which was contingent upon the shape of the exposure-response relationship: (1) For exposure-response curves exhibiting a peak or plateau, we planned to select a higher RR threshold to define the core high-risk interval. This approach aims to identify the range of exposure levels associated with a substantial and public health-relevant increase in disease burden, which is crucial for delineating periods of unequivocal high risk. (2) For exposure-response curves exhibiting a monotonic increase or decrease, we planned to select a lower RR threshold to define the high-risk threshold. This approach aimed to identify the critical point at which exposure begins to confer a significant and sustained increase in risk. This approach is particularly suitable for identifying effect modifiers where the goal is to pinpoint the level at which a factor begins to meaningfully amplify risk.
-
Based on the high-risk thresholds defined in the previous step, the mean temperature, relative humidity, and wind speed were categorized as either high-risk or low-risk binary variables[18,29]. A two-stage analytical strategy was used. The initial stage quantified the combined effects of mean temperature and relative humidity on HFMD burden. Specifically, mean temperature (T) and relative humidity (R) were stratified according to the following combinations: (1) high-risk T and high-risk R, (2) low-risk T and high-risk R, (3) high-risk T and low-risk R, and (4) low-risk T and low-risk R.
The model was expressed as:
$$ \begin{split} DailyYLD=&\alpha+cb\left(T\amp;R,L\right)+s_1\left(T,df\right)+s_n\left(C,df\right)+ \\ & WEEK+HOLIDAY+GDP+DPI \end{split} $$ where $ cb\left(T\& R,L\right) $ represents the cross-basis function used to fit the association between combinations of risk stratification of T and R with YLD, as well as the variation in the association over the lag week. The reference condition was the combination of low-risk T and low-risk R.
The second stage of the analysis stratified the combinations of T and R as follows: (1) high-risk T and R, and (2) meteorological conditions other than high-risk T and R. The combined effects of the above combination of high- and low-risk wind speeds (W) were evaluated using meteorological conditions with low-risk T, low-risk R, and low-risk W as references.
The model was specified as:
$$ \begin{split} DailyYLD=&\alpha+cb\left(T \& R\ \ W,L\right)+s_1\left(T,df\right)+s_n\left(C,df\right)+ \\ & WEEK+HOLIDAY+GDP+DPI \end{split} $$ where $ cb\left(T\& R\& W,L\right) $ is the cross-basis function used to fit the association between combinations of risk stratification of T, R, and W with YLD, as well as the variation in the association over the lag week.
Subsequently, we pooled the RR of the county-level risk thresholds into an overall RR to represent the overall risk at the provincial level using random-effects multivariate meta-regression. In addition, we estimated the YLDs attributable to the combined effects of the meteorological factors of interest, based on the risk stratification developed in the previous step. The attributable YLD was estimated as follows[29]:
$$ AttributableYLD=\sum \left(RR-1\right)/RR\times DailyYLD $$ We also conducted stratified analyses by sex, ethnic group, and urban agglomeration, following previous studies[26].
-
Interactive effects were quantified using three indices[20]: (1) Relative excess risk due to interaction (RERI), (2) Proportion attributable to interaction (AP), and (3) Synergy index (S).
$$ RERI={RR}_{A+B+}-{RR}_{A+B-}-{RR}_{A-B+}+1 $$ $$ AP=RERI/{RR}_{A+B+} $$ $$ S=\left({RR}_{A+B+}-1\right)/\left[\left({RR}_{A+B-}-1\right)+\left({RR}_{A-B+}-1\right)\right] $$ where A and B are two meteorological factors of interest and $ + $ and $ - $ are indicator variables for high and low risk, respectively. RERI represents a part of the total effect of the interaction. AP represents the proportion of the joint effect owing to the interaction. S represents the ratio between the combined and individual effects. If an additive interaction exists between the two meteorological factors of interest, the confidence interval (CI) of RERI and AP should not contain 0, and the CI of S should not contain 1.
-
To evaluate the robustness of our modeling framework, we conducted several sensitivity analyses, including (1) changing the df from three to six for meteorological factors, (2) sequentially excluding socioeconomic single covariates, such as average annual gross domestic product and disposable personal income, and (3) applying a leave-one-out approach by iteratively excluding one county at a time from the dataset to determine whether results were disproportionately influenced by any specific subregion.
-
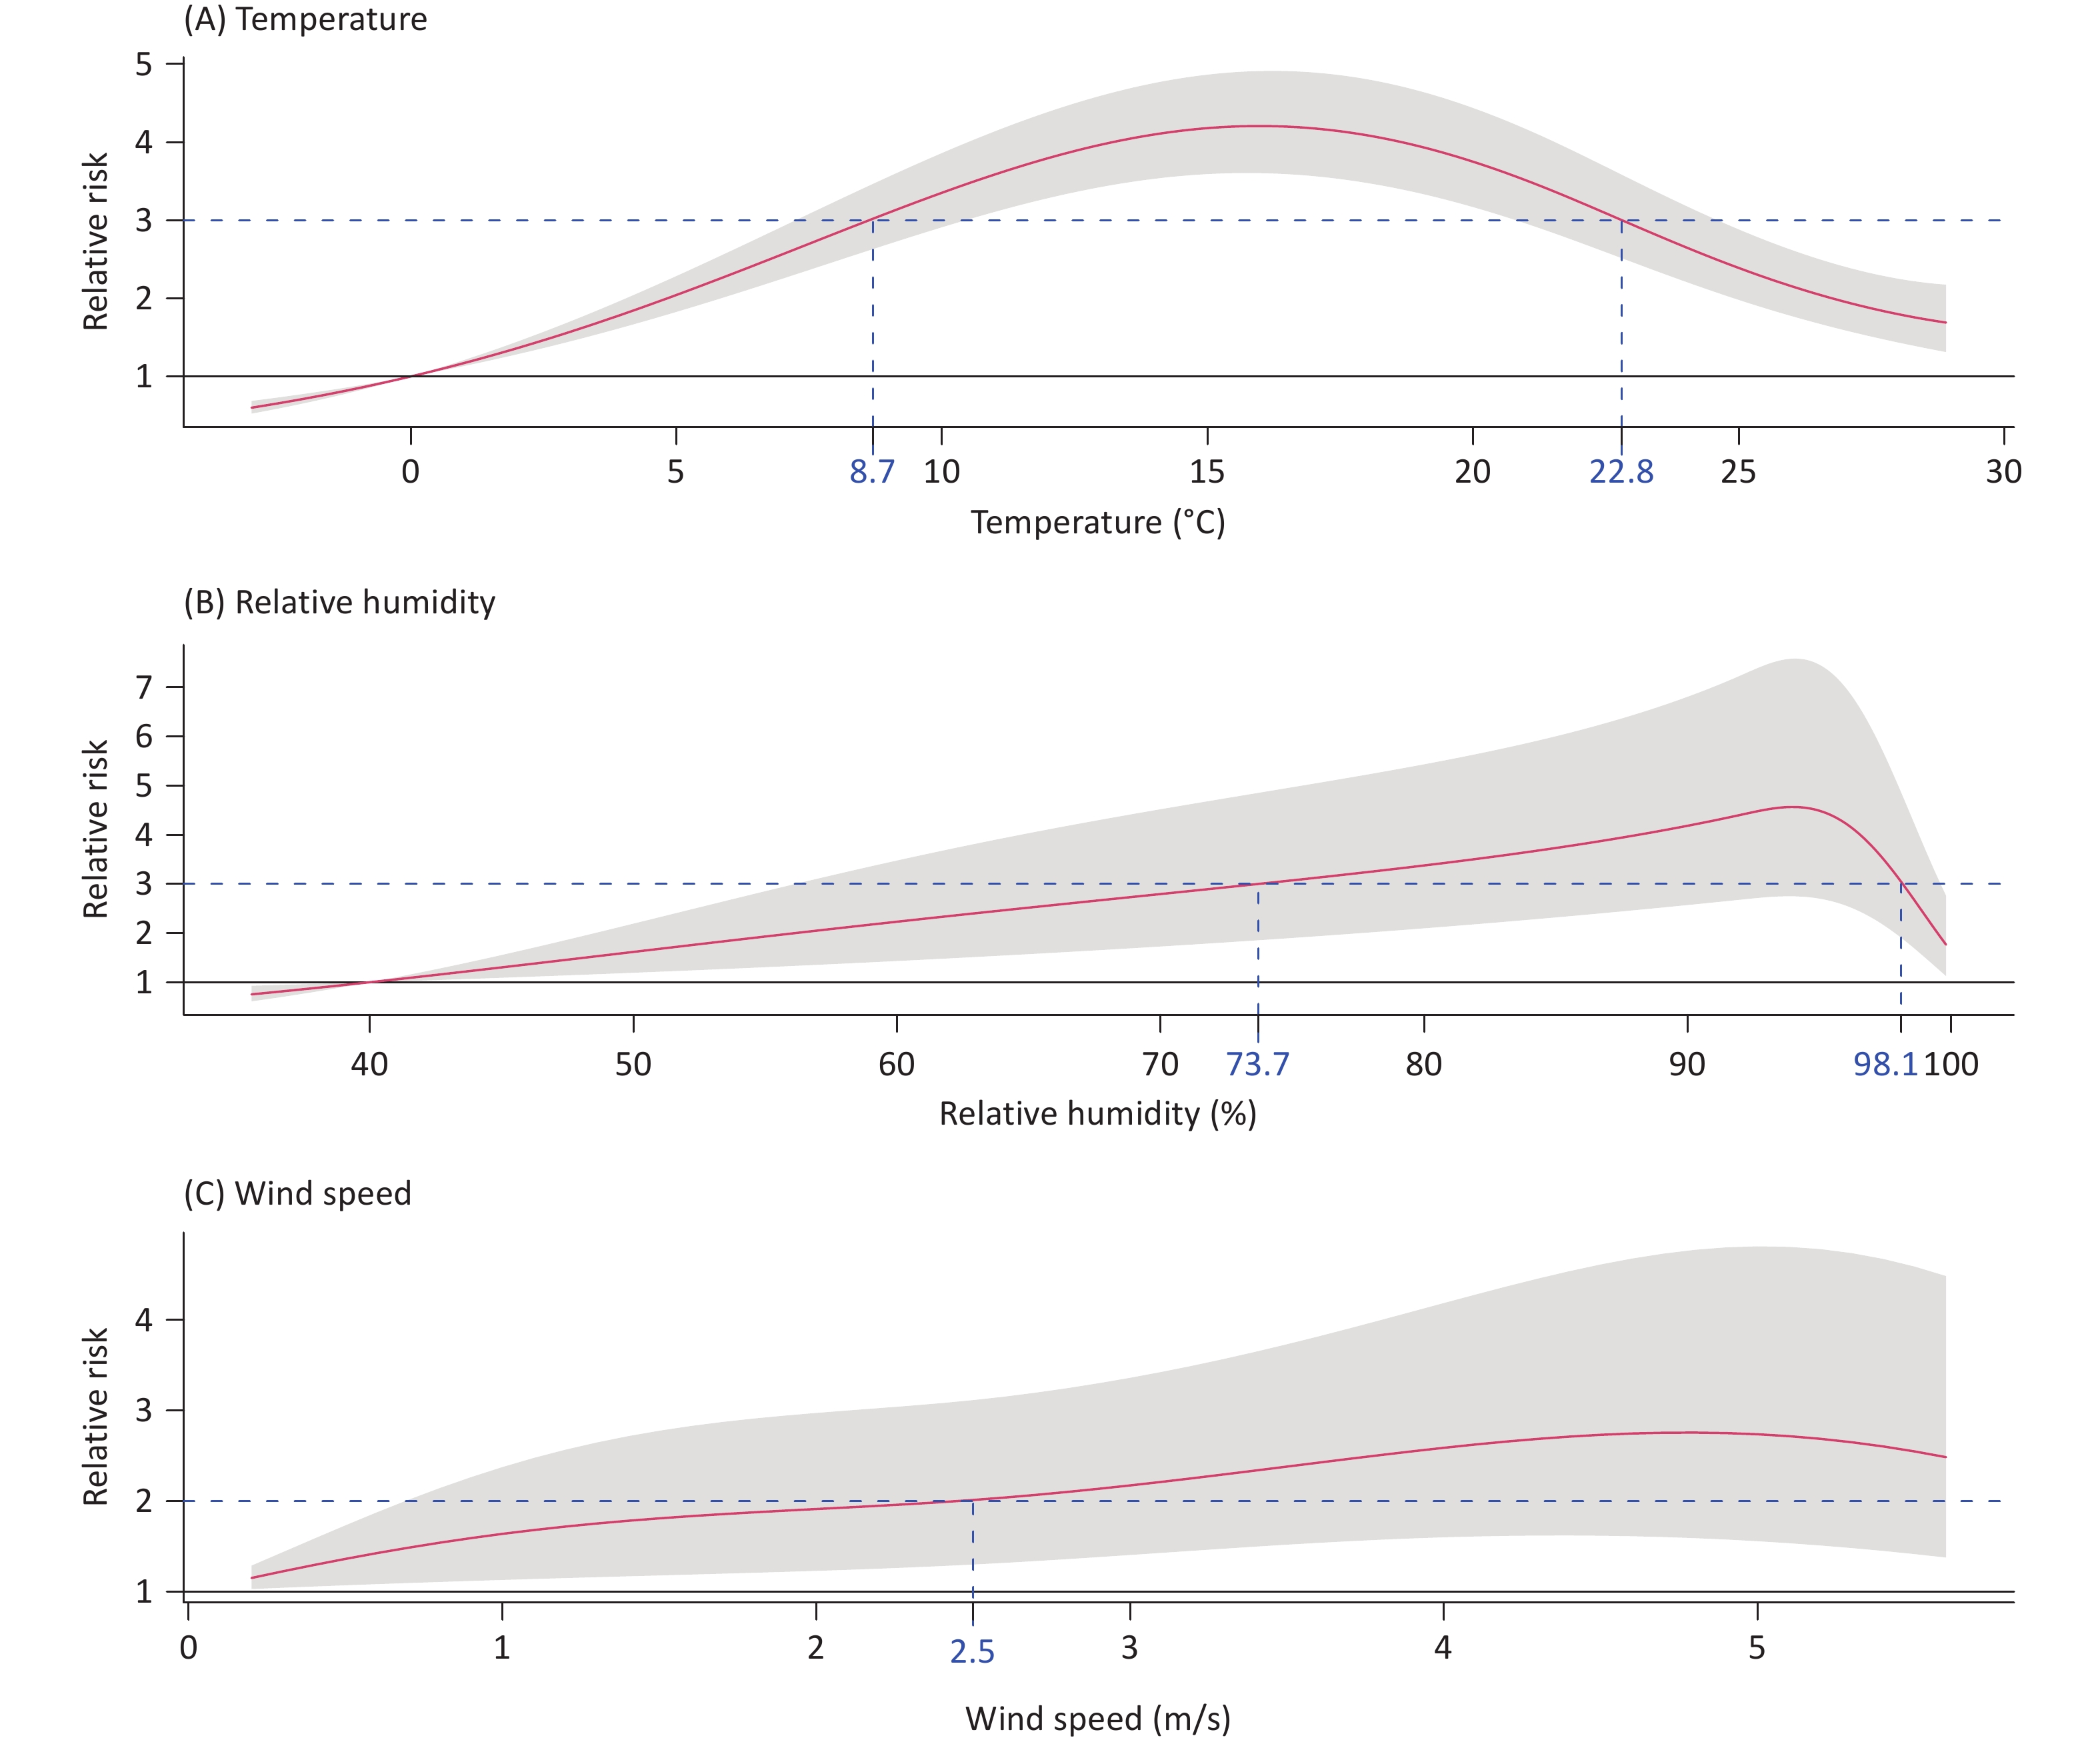
As shown in Figure 1, the cumulative effects of mean temperature and relative humidity on HFMD-related YLDs peaked at a lag of 14 days. Both exposure-response curves exhibited inverted V-shaped relationships.
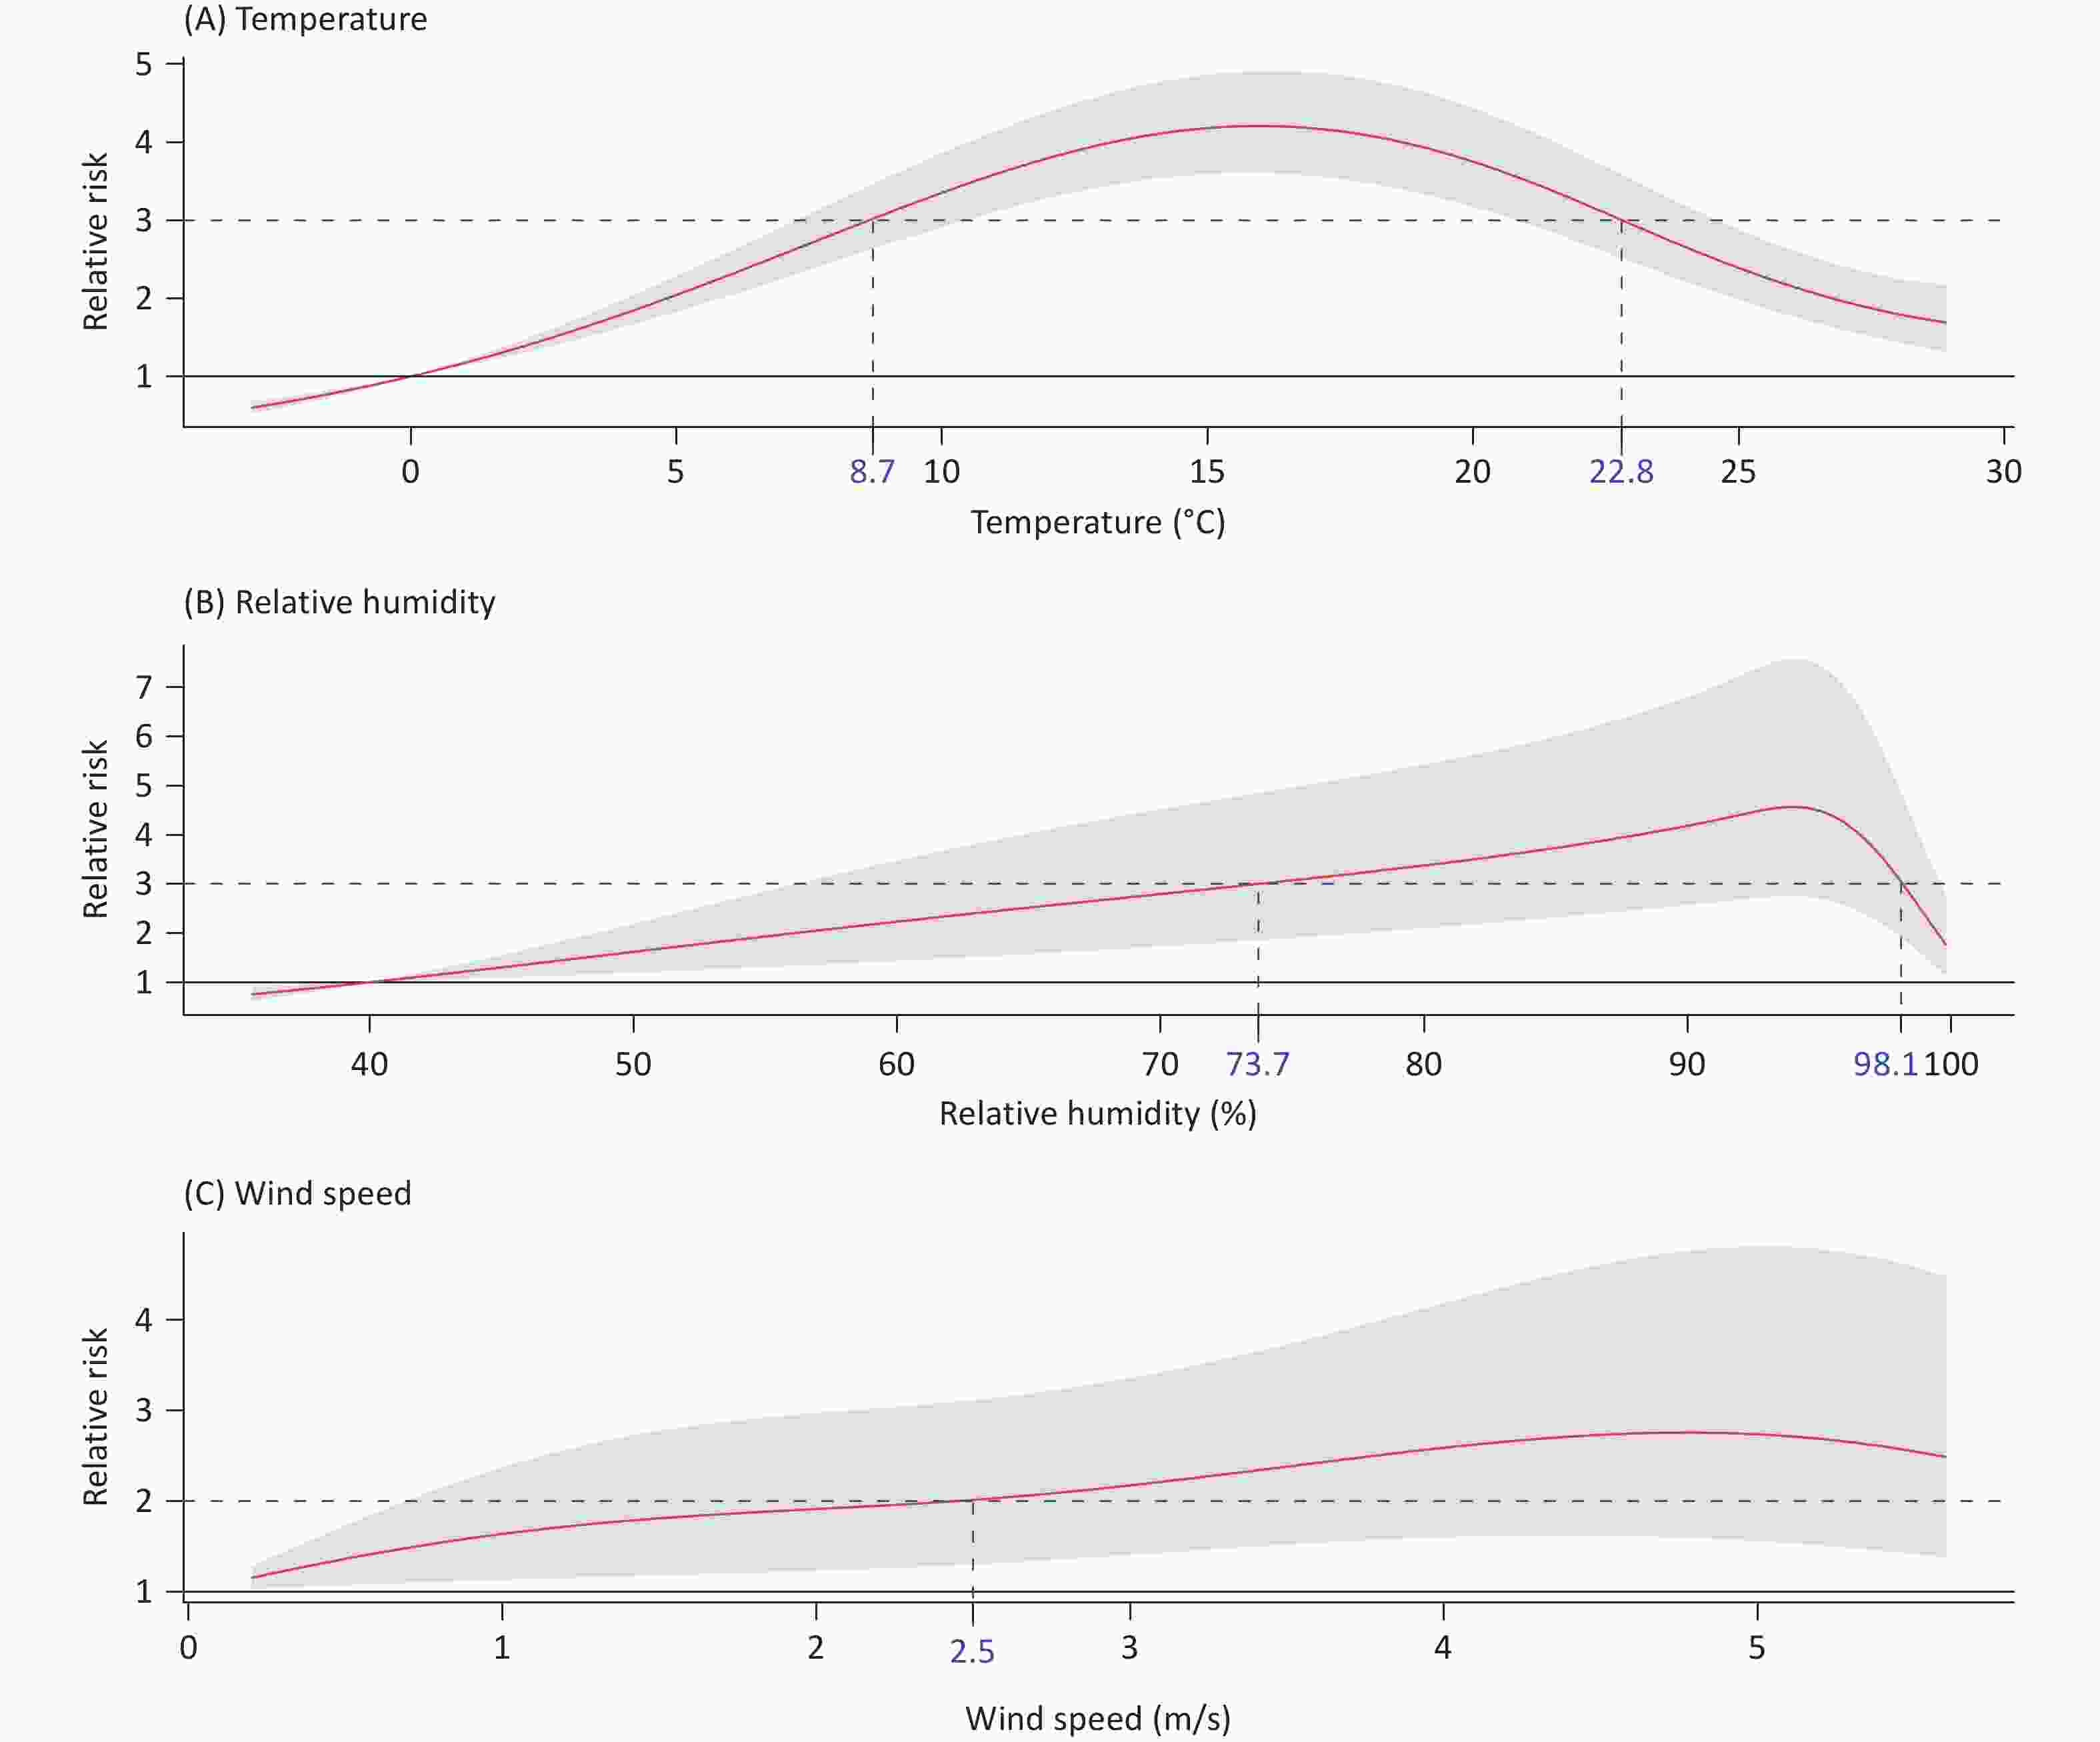
Figure 1. Pooled exposure-response relationship between the meteorological factors of interest and the years lived with disability of hand, foot, and mouth disease. The red curve and shading represent the provincial level with the highest pooled cumulative risk and 95% CI, respectively. The blue dotted line represents the high-risk threshold, and the number on the x-axis corresponds to this value. CI, confidence interval.
Following the prespecified threshold selection strategy for peaked curves, the high-risk threshold was defined as an RR value of 3 for both mean temperature and relative humidity. The corresponding high-risk intervals were 8.7 °C (RR = 3.020, 95% CI: 2.631–3.466) to 22.8°C (RR = 3.000, 95% CI: 2.513–3.581) for mean temperature, and 73.7% (RR = 3.000, 95% CI: 1.854–4.853) to 98.1% (RR = 3.040, 95% CI: 1.903–4.856) for relative humidity.
The RR curves exhibited an upward trend as the wind speed increased. Following the pre-specified strategy for monotonic curves, the high-risk threshold was defined as RR > 2, which corresponded to a wind speed of 2.5 m/s (RR = 2.013, 95% CI: 1.301–3.116) for HFMD burden. Additional descriptive statistics for the HFMD YLDs and the relevant meteorological variables are provided in Supplementary Text S1 and Figure S2.
-
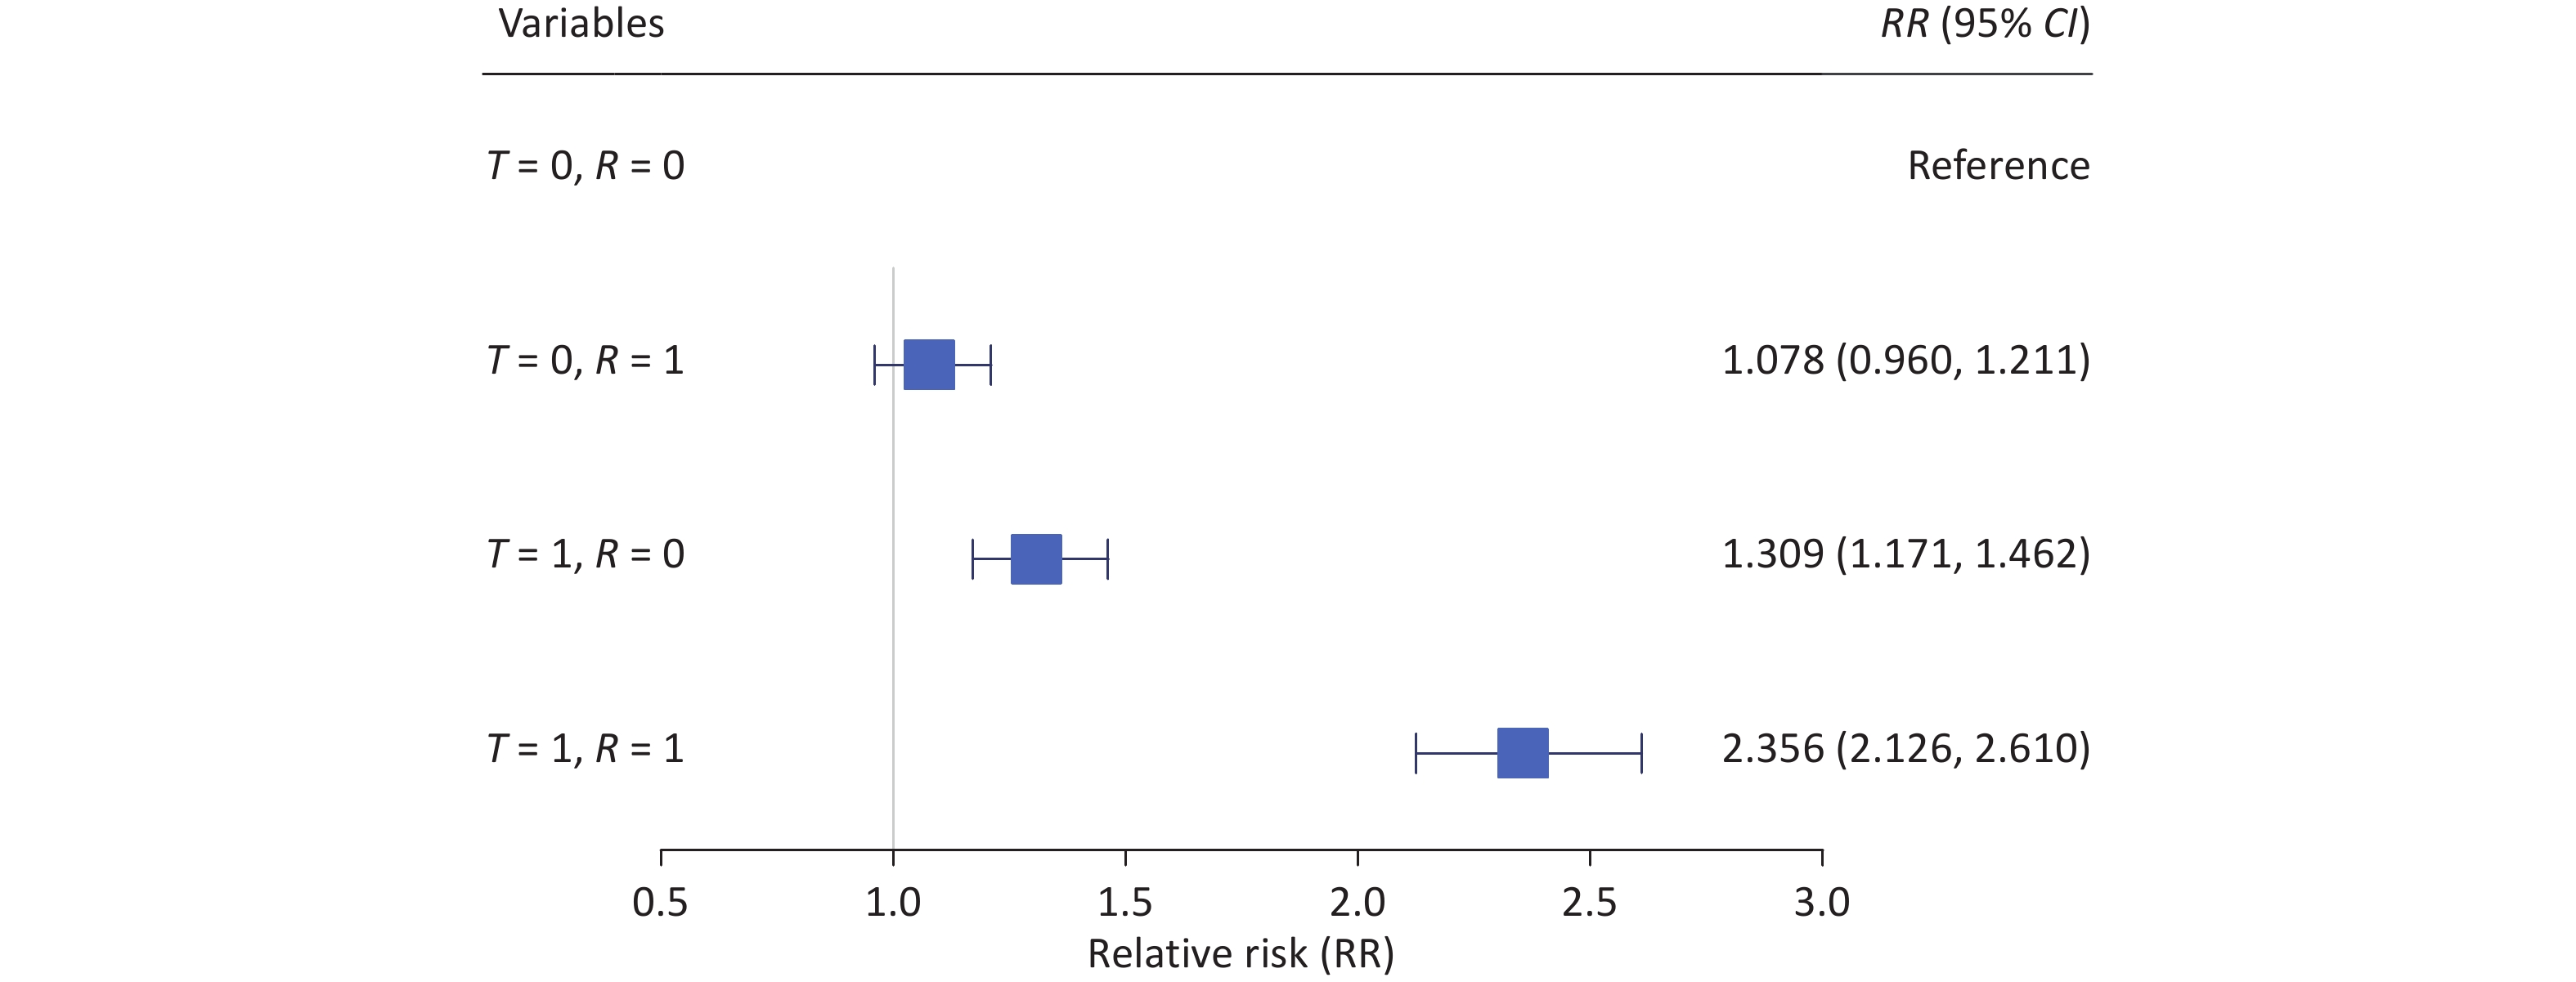
Figure 2 illustrates the combined effects of mean temperature and relative humidity on the YLDs of HFMD. Using the combination of low-risk mean temperature and relative humidity as the reference point, the RR of the combination of high-risk factors increased significantly, reaching 2.356 (95% CI: 2.126–2.610) (Supplementary Figure S3). The RERI was 0.969 (95% CI: 0.937–0.995), indicating a greater risk of HFMD burden for the combination of high-risk mean temperature and relative humidity than that for no interaction between these two factors. The synergy index (S) was > 1 (3.505, 95% CI: 2.392–8.590), further supporting the presence of a positive additive interaction. Additionally, 41.1% of the joint effect was attributable to the interaction between high-risk mean temperature and relative humidity, as reflected by the attributable proportion (AP = 0.411, 95% CI: 0.359–0.468). Regarding the HFMD burden, the combined effect of high-risk relative humidity and high-risk mean temperature yielded an attributable YLD of 232.15 (95% CI: 213.65–248.85) person-years (Supplementary Text S2 and Table S1). The sensitivity analyses indicated the reliability of the primary results (Supplementary Tables S2 and S3).
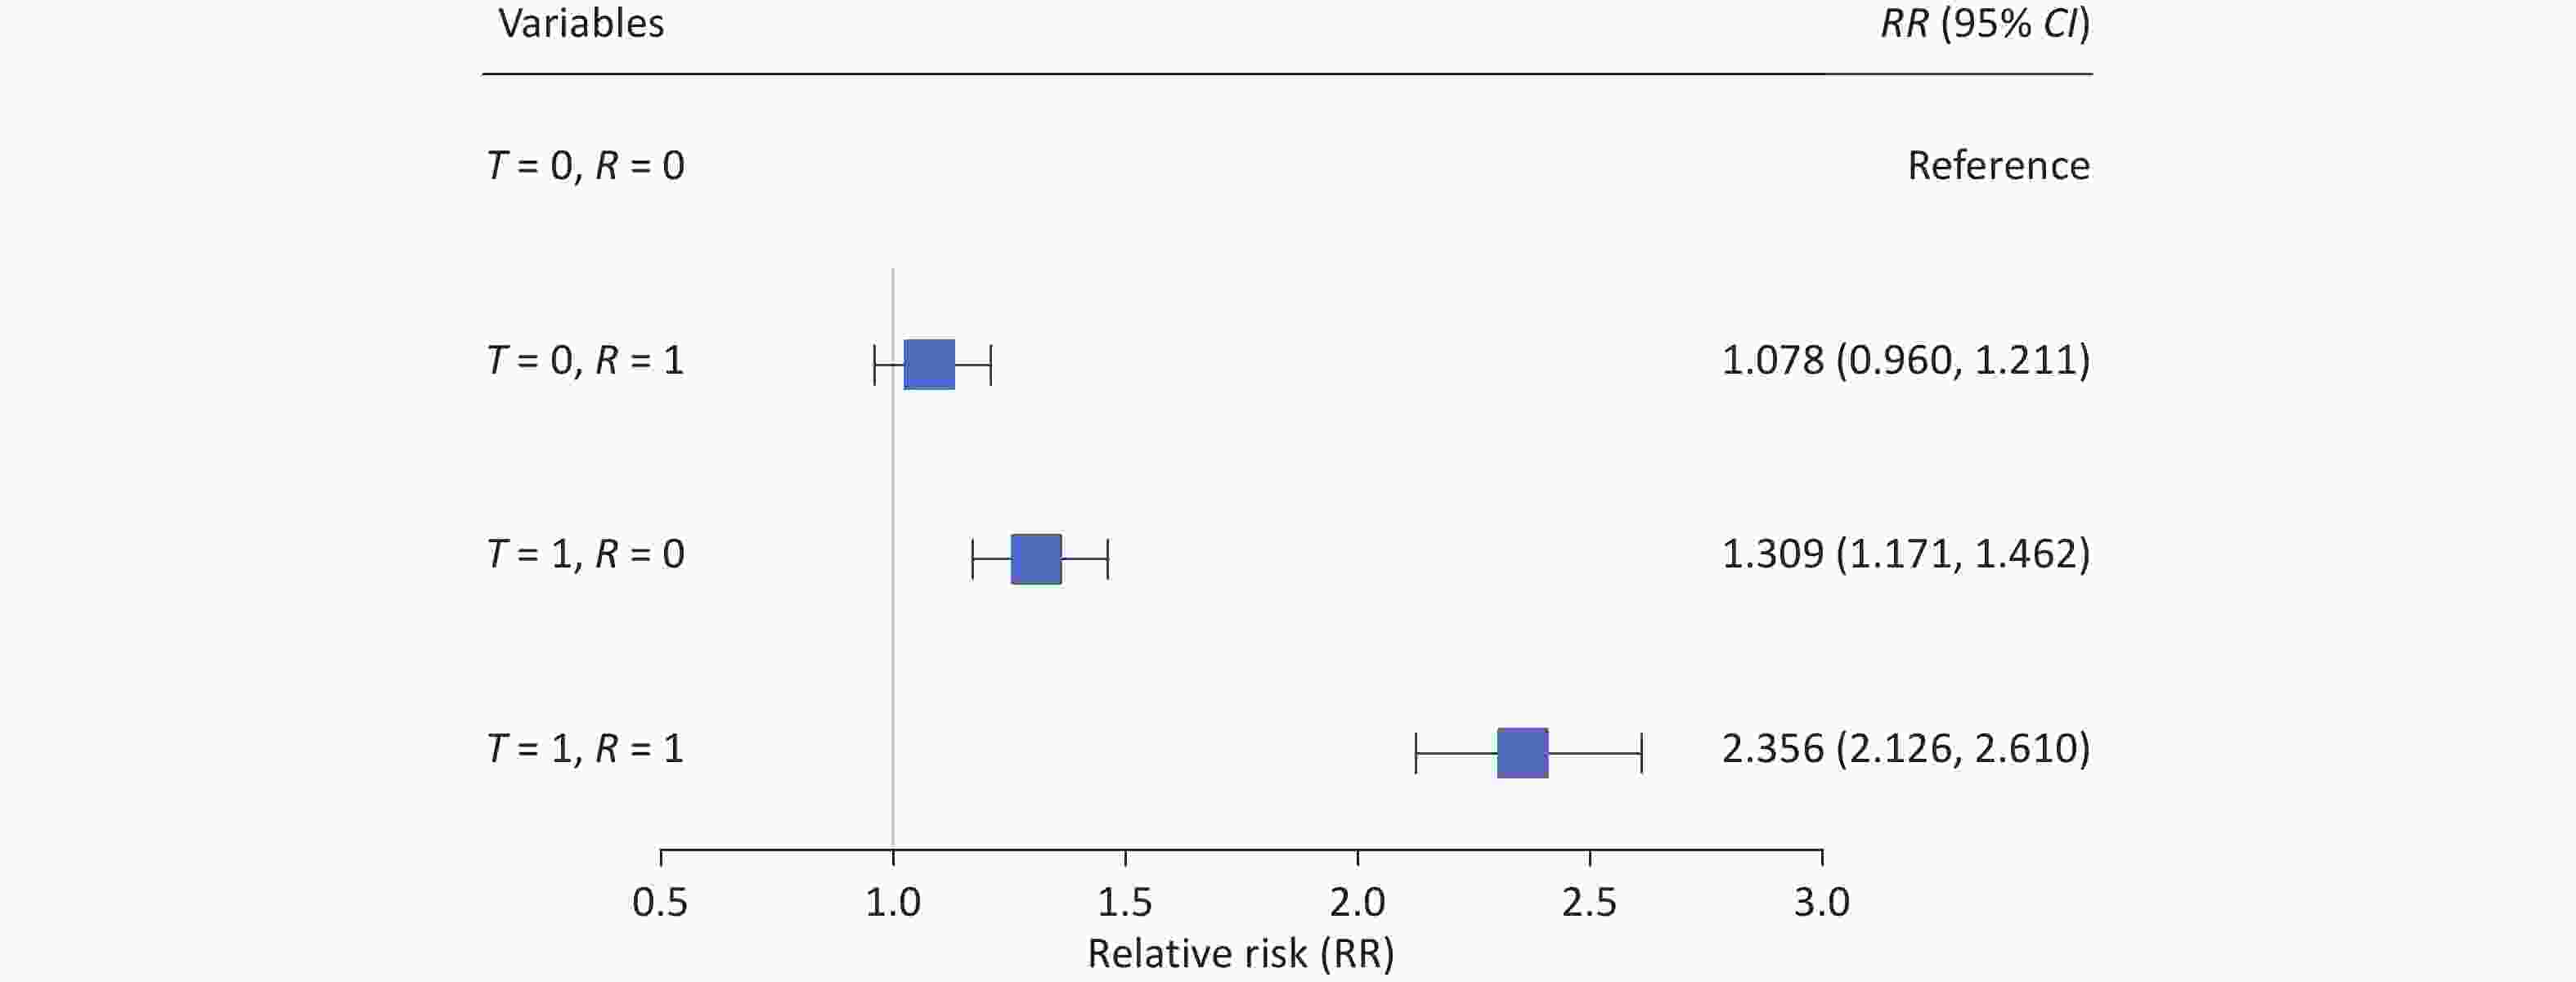
Figure 2. Combined effects of different mean temperature and relative humidity thresholds on the years lived with disability of hand, foot, and mouth disease. T represents mean temperature, denoting high risk (T = 1) for values between 8.7–22.8 °C and low risk (T = 0) otherwise. R represents relative humidity, denoting high risk (R = 1) for values > 73.7% and low risk (R = 0) otherwise.
-
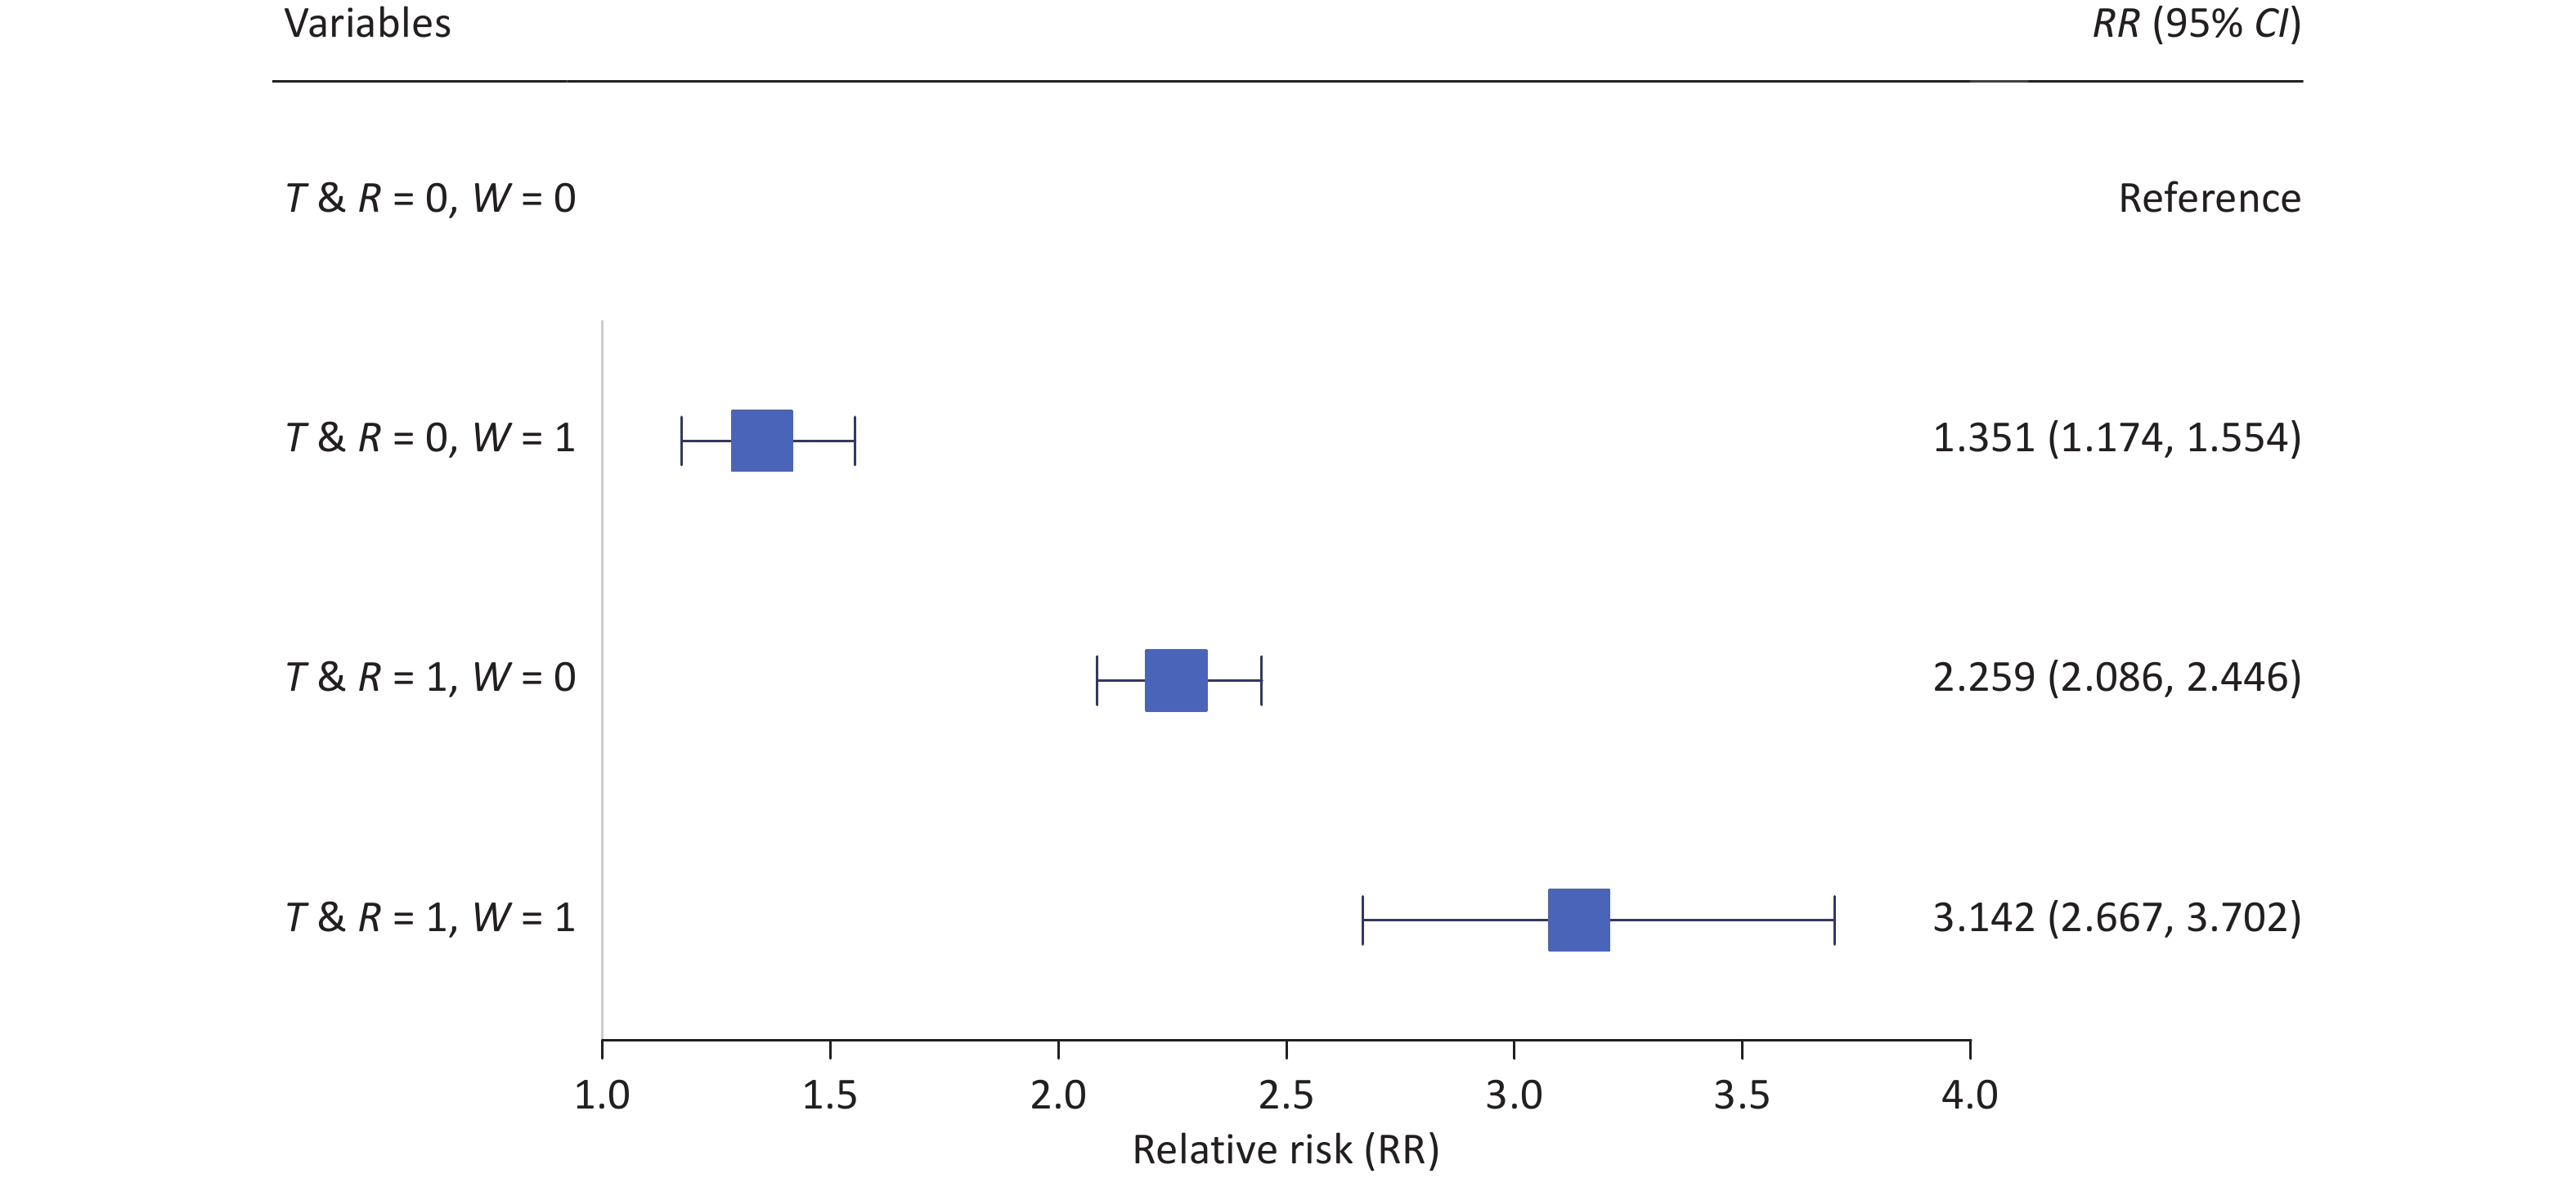
Figure 3 illustrates the combined effects of mean temperature, relative humidity, and wind speed on the YLDs of HFMD. We defined a new high-risk group as the combination of high-risk mean temperature and relative humidity. Using the combination of the low-risk group and low-risk wind speed as the reference point, the RR for the combination of high-risk group and high-risk wind speed increased significantly, reaching 3.142 (95% CI: 2.667–3.702) (Supplementary Figure S3). The RERI (RERI = 0.533, 95% CI: 0.408–0.702) showed that the risk of HFMD burden on the combination of the high-risk group and high-risk wind speed was greater than that of those with no interaction between these two factors. The ratio between the combined effect and the sum of the individual effects was > 1 (S = 1.331, 95% CI: 1.324–1.351). In addition, 17.0% (AP = 0.170, 95% CI: 0.153–0.190) of the combined effect was attributed to the interaction between the combination of high-risk group and high-risk wind speed. Regarding HFMD burden, the combined effect of high-risk wind speed and high-risk group yielded an attributable YLD of 275.02 (95% CI: 252.16–294.43) person-years (Supplementary Text S2 and Table S1). The sensitivity analyses indicate the reliability of the primary results (Supplementary Tables S4 and S5).
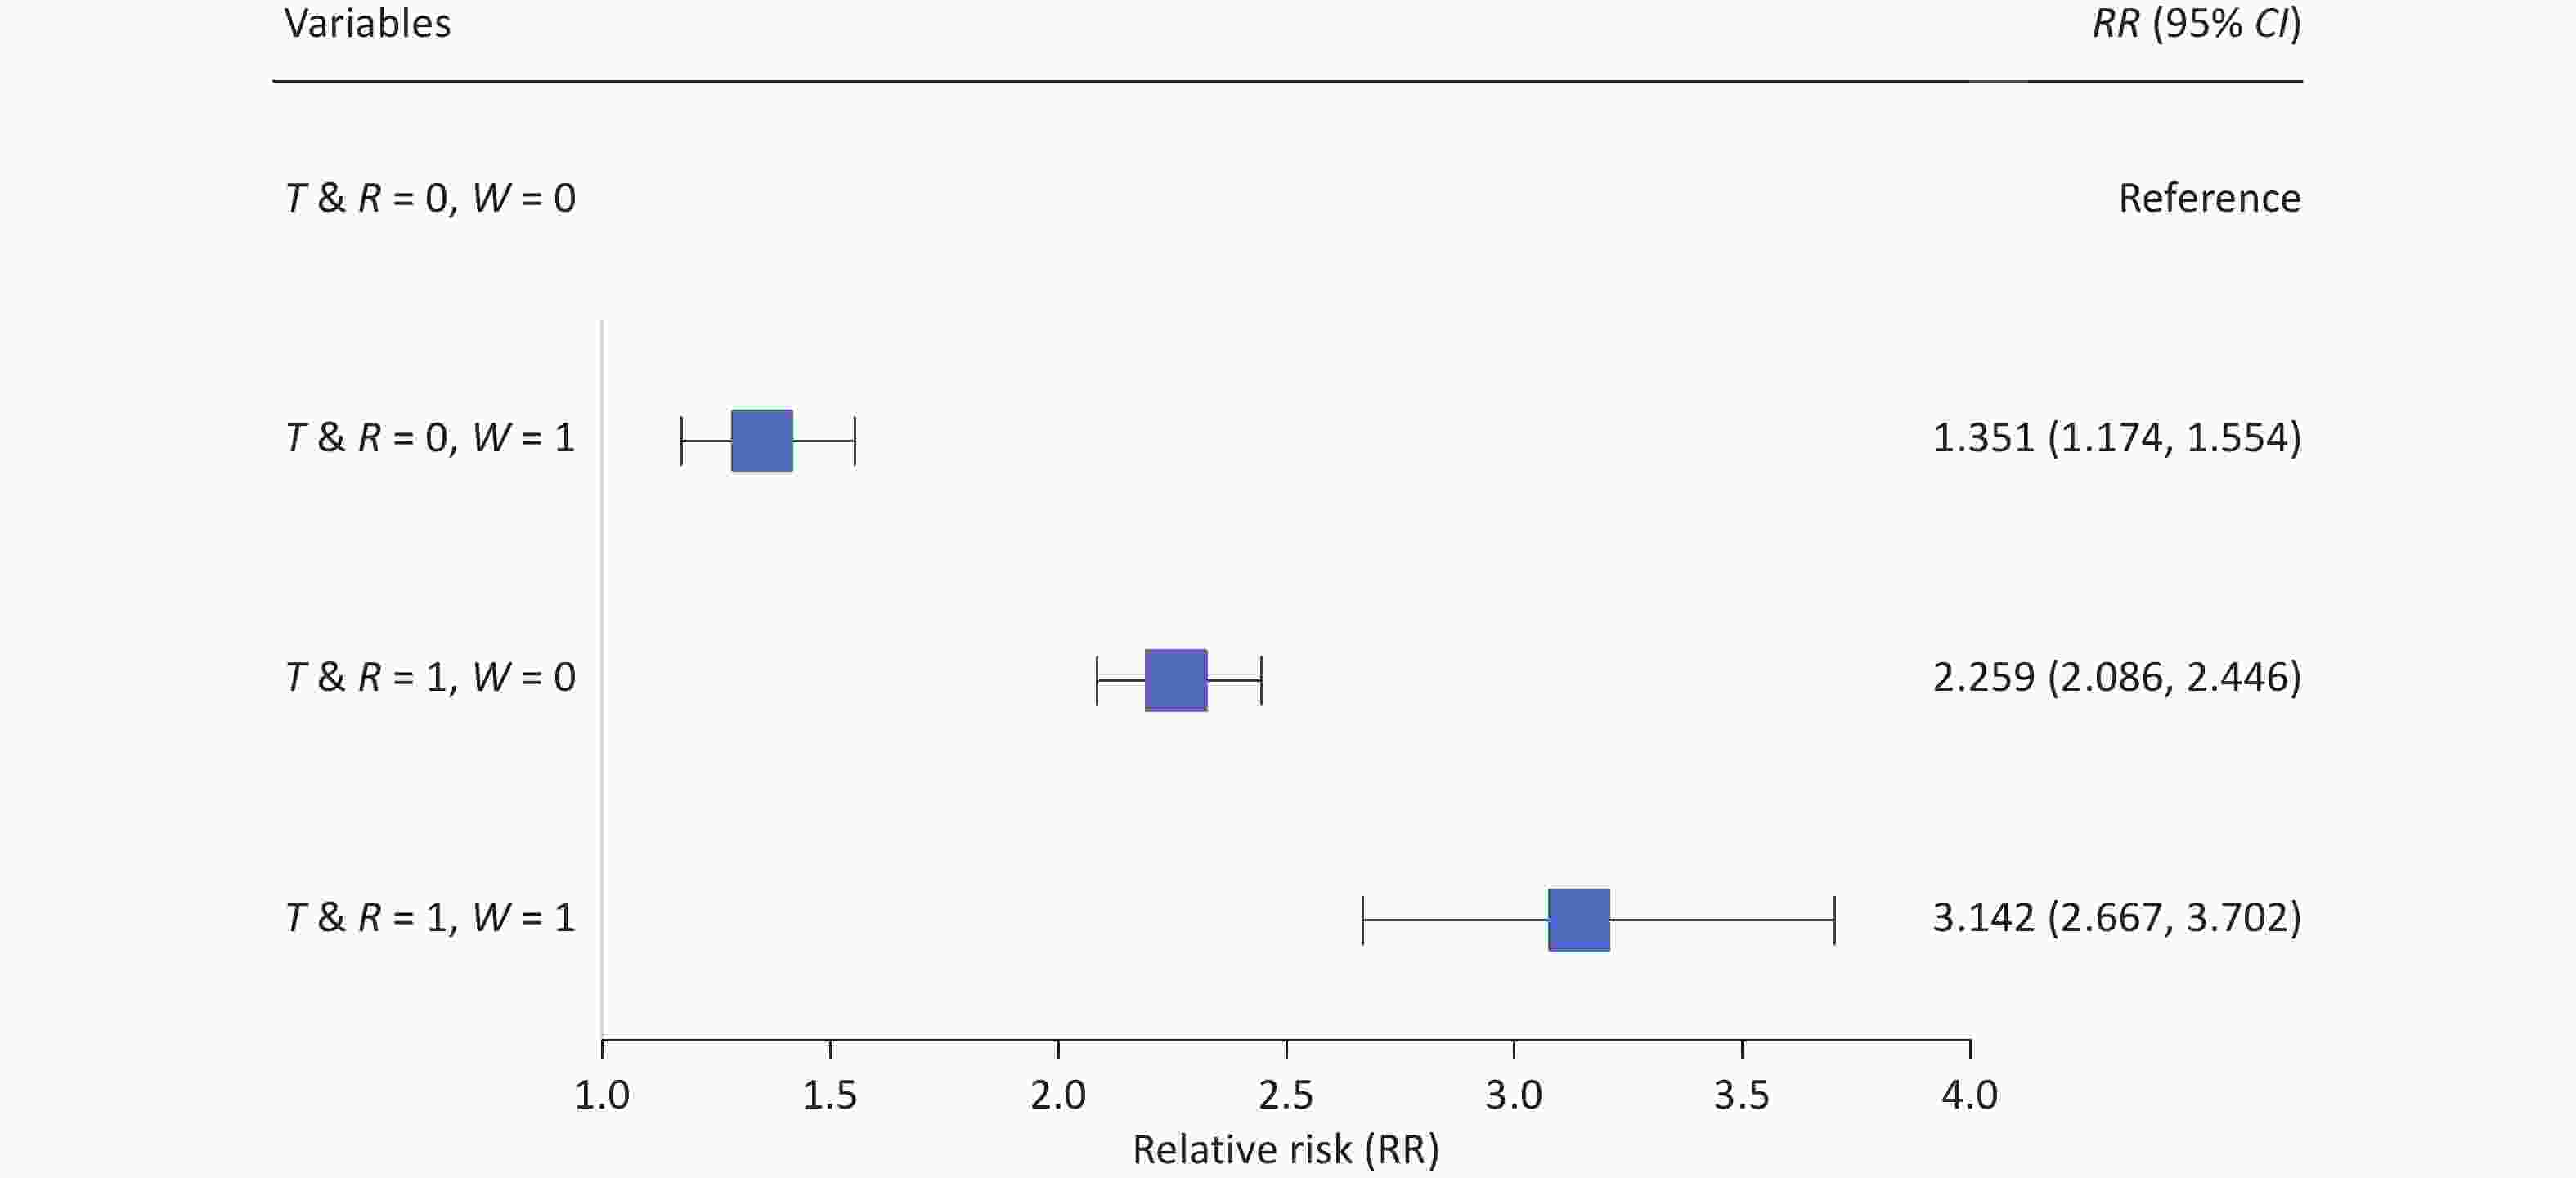
Figure 3. Joint effects of different mean temperature, relative humidity, and wind speed thresholds on the years lived with disability of hand, foot, and mouth disease. T represents the mean temperature. R represents the relative humidity. T & R represents the combination of mean temperature and relative humidity, where 1 denotes the concurrent high-risk condition (mean temperature between 8.7–22.8 °C and relative humidity > 73.7%) and 0 denotes all other combinations. W represents the wind speed, where 1 denotes high risk (> 2.5 m/s) and 0 denotes low risk. CI, confidence interval.
-
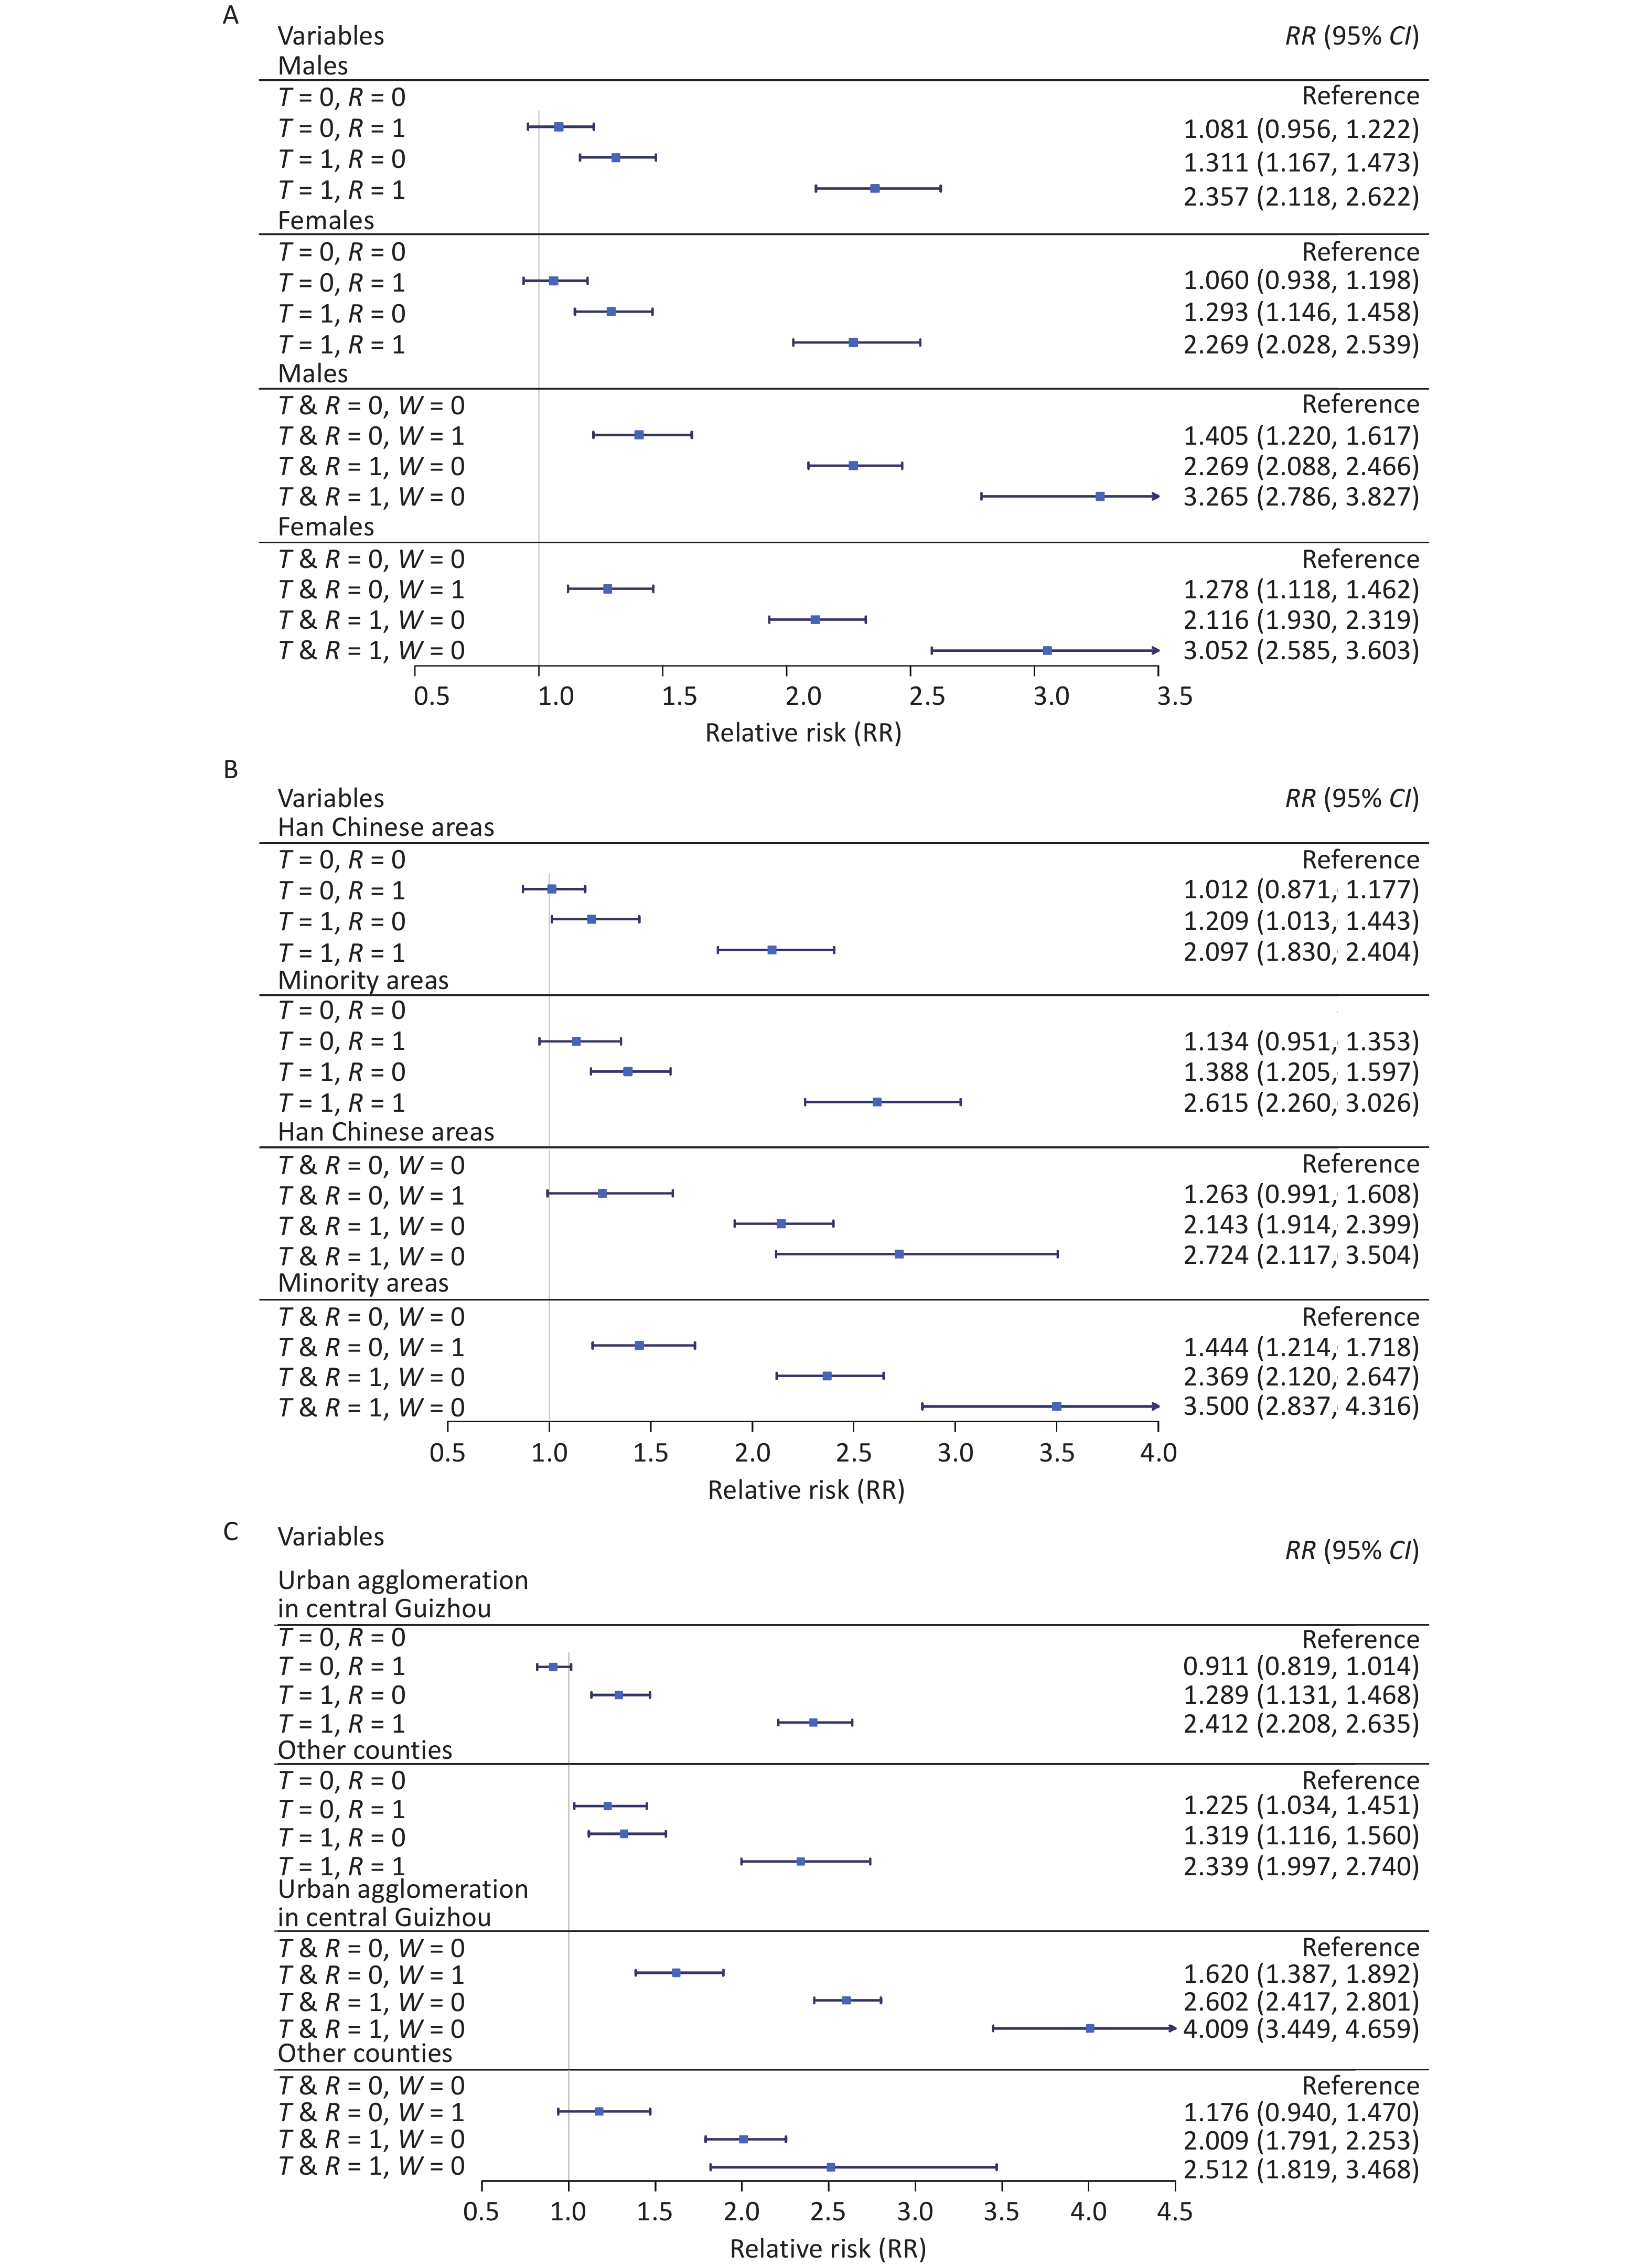
Figure 4 shows the results of the stratified analysis based on sex, ethnic group, and urban agglomeration. Using the combination of low-risk mean temperature and relative humidity as the reference point, the RRs of the combination of high-risk mean temperature and relative humidity for males (RR: 2.357, 95% CI: 2.118–2.622), minority areas (RR: 2.615, 95% CI: 2.260–3.026), and urban agglomeration in central Guizhou (RR: 2.412, 95% CI: 2.208–2.635) were higher than those observed in females (RR: 2.269, 95% CI: 2.028–2.539), Han Chinese areas (RR: 2.339, 95% CI: 1.997–2.740), and other counties (RR: 2.412, 95% CI: 2.208–2.635), respectively. A similar pattern was observed for the combined effects of mean temperature, relative humidity, and wind speed on the YLD of HFMD.
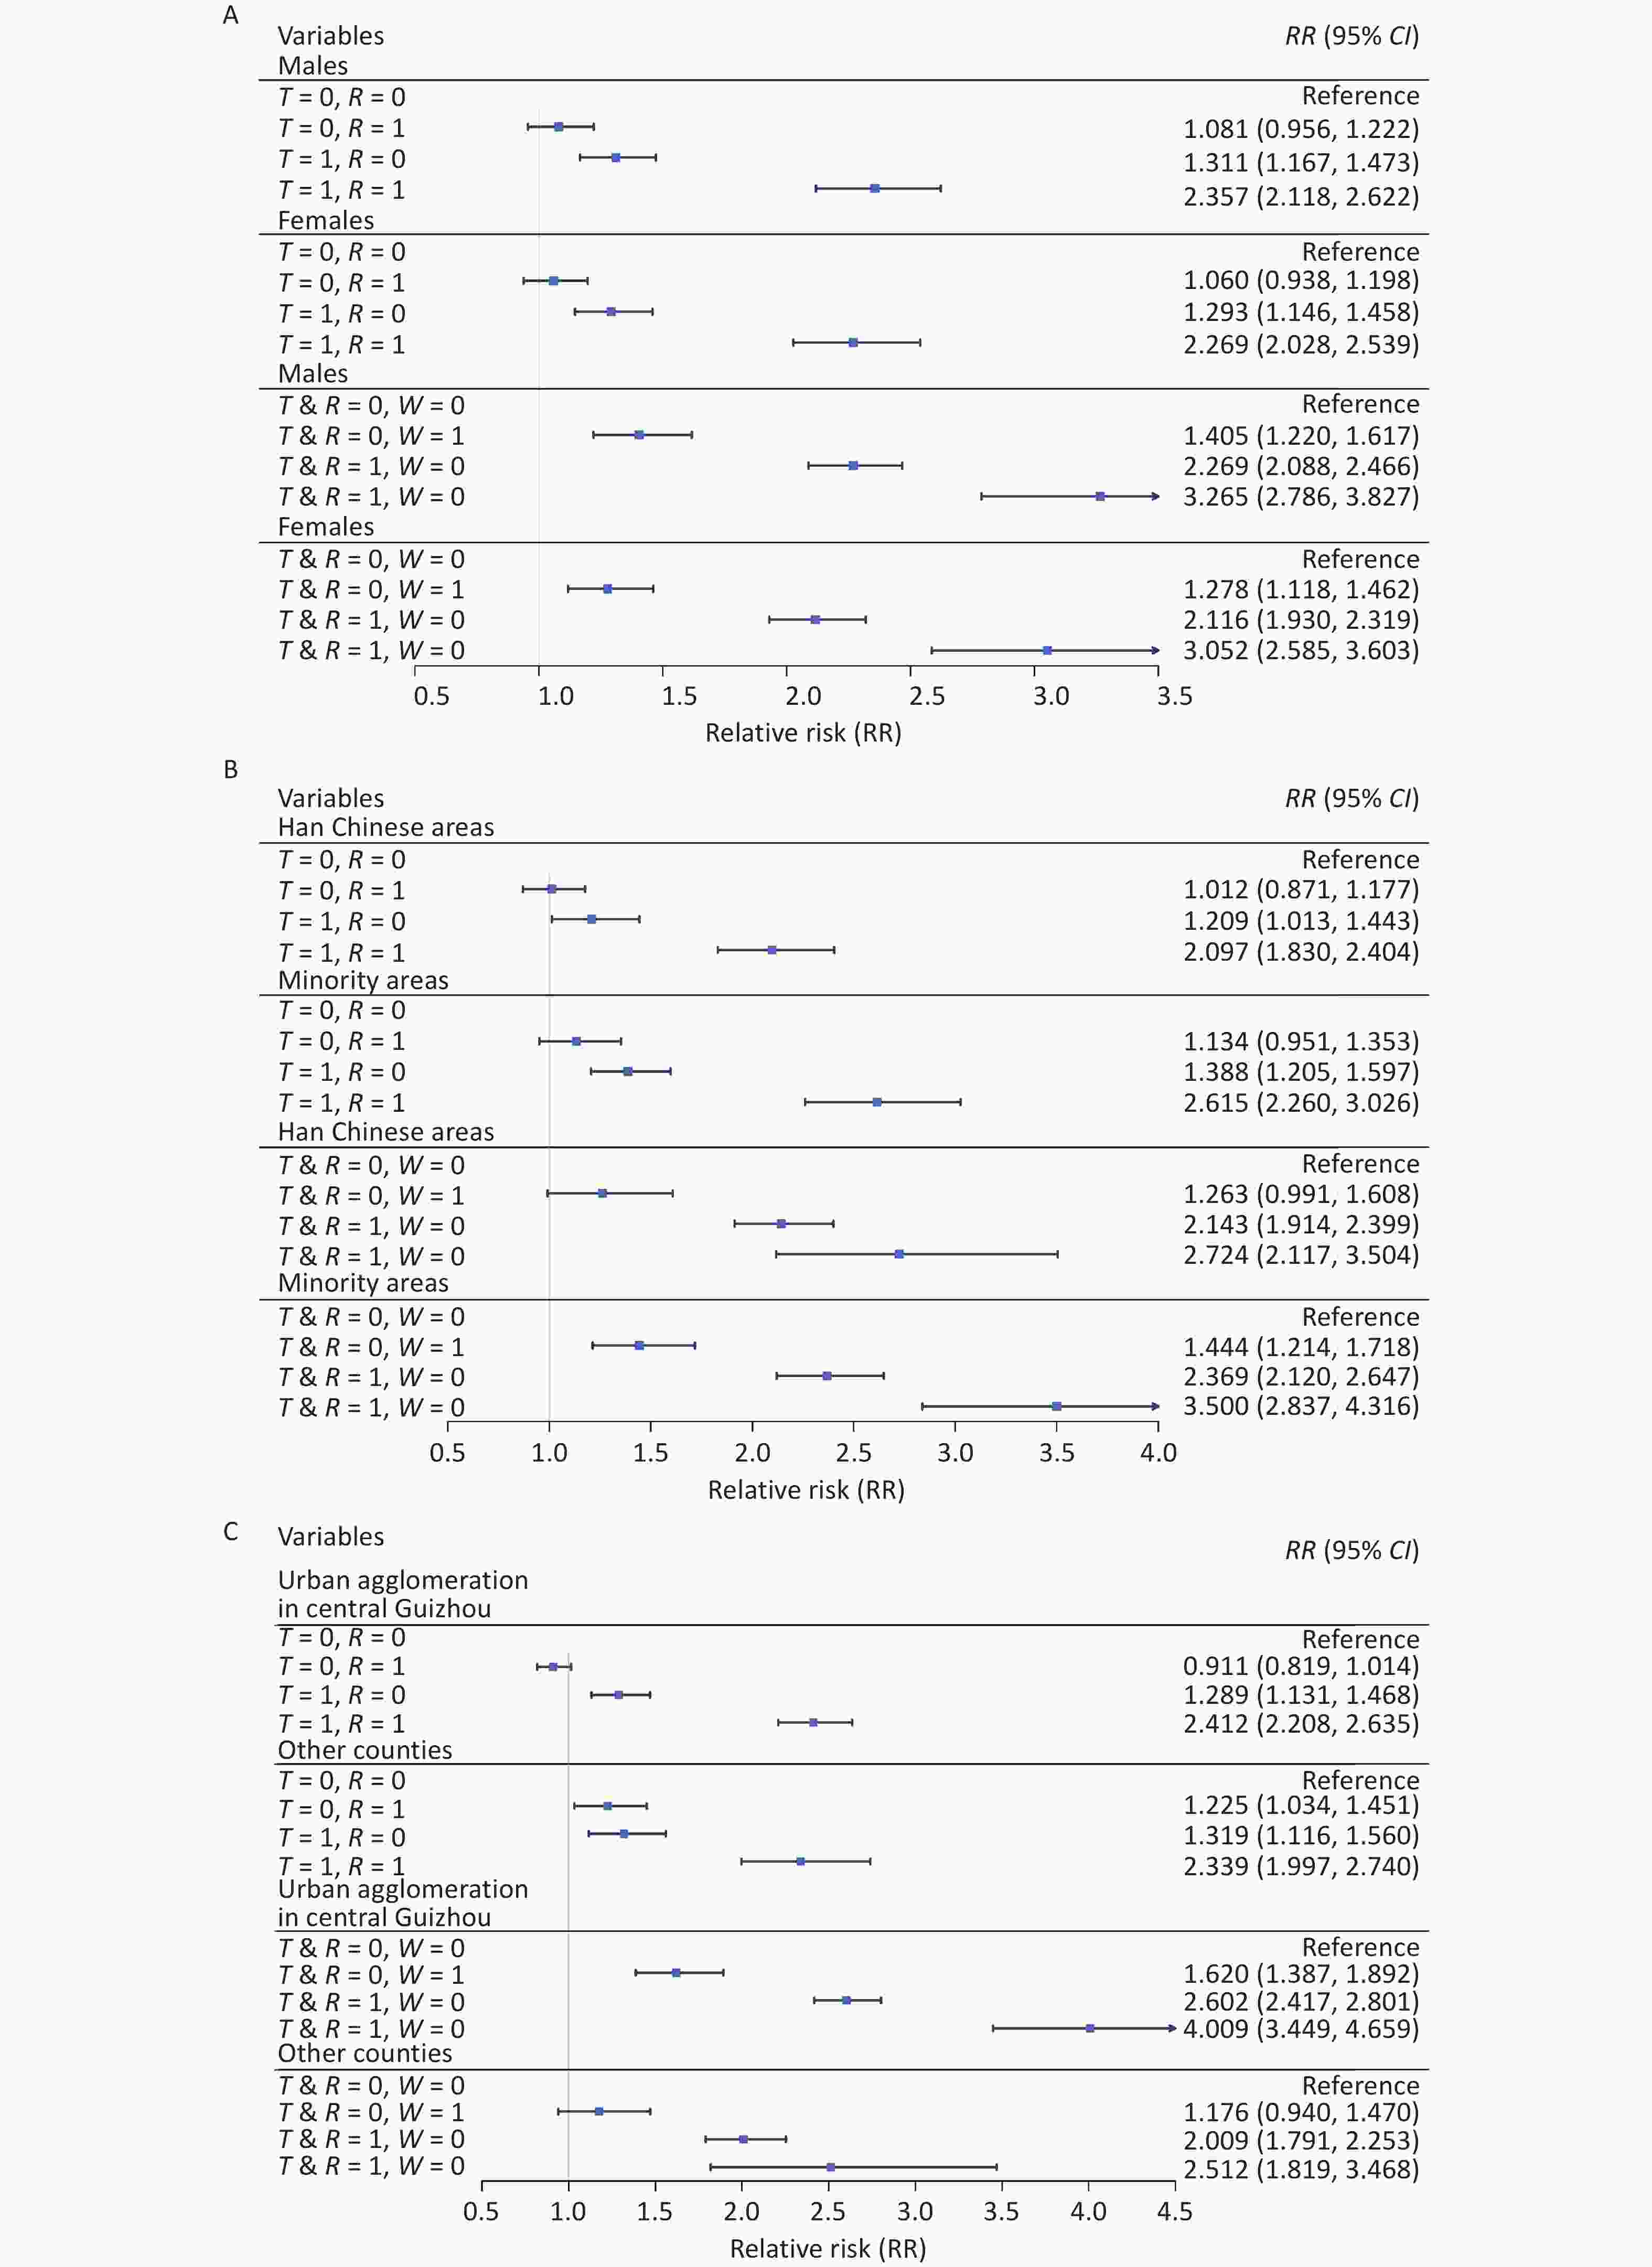
Figure 4. Stratified analysis based on sex (A), ethnic group (B), and urban agglomeration (C).
T represents the mean temperature, denoting high-risk (T = 1) for values between 8.7–22.8 °C and low-risk (T = 0) otherwise. R the represents relative humidity, denoting high risk (R = 1) when > 73.7% and low risk (R = 0) otherwise. T & R represents the combination of mean temperature and relative humidity, where 1 denotes the concurrent high-risk condition (mean temperature between 8.7–22.8 °C and relative humidity > 73.7%) and 0 denotes all other combinations. W represents the wind speed, where 1 denotes high risk (> 2.5 m/s) and 0 denotes low risk. CI, confidence interval.
-
This analysis of > 0.5 million HFMD cases in Guizhou, China, between 2012 and 2019 offers several key advances. First, it employed YLDs to quantify the HFMD burden, a metric that incorporates case severity to provide a more comprehensive assessment of disease impact than incidence alone. Second, wind speed was identified as a significant modifier that amplified the HFMD burden associated with warm and humid conditions, revealing a novel three-way meteorological interaction. When moderate mean temperatures (8.7–22.8 °C), high relative humidity (> 73.7%), and high wind speed (> 2.5 m/s) coincided, the HFMD burden increased more than threefold, with 17.0% of this effect directly attributable to their interaction. These findings highlight the importance of public health measures such as limiting outdoor activities during HFMD epidemics, especially when favorable temperature and humidity conditions coincide with elevated wind speed.
-
The independent effects of temperature and humidity on HFMD burden remain controversial. Several studies have shown that both low and high temperatures may increase HFMD risk[31-35]. Du et al. described an inverted V-shaped exposure-response curve between temperature and HFMD incidence and DALYs in Guangdong, China[9,19], suggesting that optimal temperatures can increase HFMD burden, consistent with the results of the present study. One potential explanation is that moderate weather encourages outdoor activity among children, increasing exposure to infected individuals or contaminated surfaces[36]. The findings of the present study are consistent with those of previous studies reporting increased HFMD risk under humid conditions[37-40]. Additionally, temperature and humidity may jointly increase HFMD risk by enhancing viral stability and transmission efficiency[11,12,41]. In the present study, the combined effect of mean temperature (8.7–22.8 °C) and relative humidity (73.7%–98.1% significantly elevated HFMD risk, with 41.1% of the effect attributable to additive interactions. Favorable temperature and humidity may enhance pathogen activity and facilitate transmission, potentially in combination with airborne pollutants[19,41-43].
-
Wind speed significantly intensified the combined effect of optimal temperature and humidity on HFMD burden. The enhanced effect was particularly evident under cloudy conditions. Because HFMD is transmitted primarily through respiratory droplets[44], wind may facilitate pathogen transmission, potentially increasing infection risk. While previous studies typically considered wind speed as an independent covariate[10,45-48], few have examined its combined influence on disease occurrence and disease severity with other meteorological factors[39]. According to Liao et al., wind conditions on most days in Shandong, China, were favorable for outdoor activities[49], potentially leading to increased exposure. The co-occurrence of optimal temperature, humid air, and wind conditions likely increases HFMD transmission by enhancing pathogen adherence, potentially extending the range and distance of droplets and airborne pollutants attached to pathogens[38,39,50]. In this study, wind speeds above 2.5 m/s interacting with favorable temperature and humidity contributed 17.0% of the HFMD burden through additive effects.
-
Stratified analysis revealed that boys exhibited a greater increase in HFMD YLD under high-risk meteorological conditions than girls, consistent with prior findings on sex-related differences in HFMD incidence and susceptibility[26]. This disparity may reflect behavioral differences, as boys are more inclined than girls to engage in outdoor activities, potentially increasing their exposure during high-risk weather conditions[51]. Under the same conditions, minority areas also faced a higher HFMD burden than Han-majority areas, likely due to differences in cultural practices, hygiene practices, and living conditions[52].
Additionally, the HFMD burden was higher in urban agglomerations than in other regions during high-risk weather conditions, possibly because of higher population density, which could facilitate human-to-human transmission of HFMD pathogens[53], as well as increased air pollution, which increases viral persistence[54].
-
The quantification of specific meteorological thresholds in this study provides an evidence base for the development of targeted and operational public health interventions. We propose the establishment of a tiered early warning system to effectively mitigate the burden of HFMD associated with synergistic weather conditions. This system requires the concurrent measurement of mean temperature, relative humidity, and wind speed. Under high-risk conditions, public health advisories should be issued recommending modifications to children’s outdoor activities, including shifting play to well-ventilated indoor spaces or, if outdoors, shortening activity duration and intensity to minimize exposure and droplet transmission, as well as increased environmental hygiene, including increased disinfection of high-contact surfaces in kindergartens, schools, and public playgrounds.
Beyond immediate behavioral and hygiene measures, our findings advocate the integration of wind speed into existing weather-HFMD early warning frameworks. For long-term planning, urban managers in high-risk areas should consider constructing windbreak green belts in open recreational areas to attenuate ground-level wind speeds and reduce pathogen dispersal. Additionally, public education campaigns should be tailored to communicate risks in specific, actionable terms. Instead of broad warnings, messages should explicitly refer to hazardous meteorological triads. In minority regions, such communications must be culturally adapted and delivered through trusted local channels.
Finally, intervention strategies should prioritize vulnerable subgroups. For boys with a higher burden, targeted hygiene promotion in educational settings is key. In minority-concentrated areas, efforts should focus on enhancing local healthcare capacity and community-led prevention initiatives. Within dense urban agglomerations, a coordinated cross-sectoral approach is essential to manage large gatherings and maintain stringent environmental disinfection during forecasted high-risk periods. This evidence-based, multipronged strategy, triggered by clearly defined meteorological thresholds, has significant potential for reducing HFMD burden in susceptible populations.
-
This study has several strengths. First, it is the first to quantify additive interactions among temperature, humidity, and wind speed on the burden of HFMD. Unlike multiplicative interaction, which is assessed by including product terms in regression models, our approach using additive interaction is more directly informative for public health decision-making[20-22]. This is because additive interaction examines whether the combined effect of multiple exposures exceeds the sum of their individual effects, thereby directly identifying high-risk scenarios in which targeted interventions would yield the greatest benefit. For instance, a specific combination of weather conditions leading to a case surge greater than the sum of the risks from each condition alone signals a synergistic effect that demands targeted public health action. In contrast, multiplicative interaction examines whether the combined effect is greater than the product of the individual effects. While statistically valid, this may not always correspond to a substantial increase in absolute disease burden, making it less intuitive to quantify excess cases specifically attributable to the interaction. Second, this study is one of a limited number to use YLD to account for HFMD severity and quantify the population-level burden of HFMD. YLD can be used to comprehensively evaluate the severity of disability and sequelae caused by HFMD in children, thus avoiding underestimating the disease burden. Finally, the study area was a representative provincial unit in western China. The large sample size provided by the comprehensive HFMD surveillance and registration system may contribute to the reliability of the data source and robustness of the findings.
However, this study has some limitations. As an ecological analysis based on population-level data, causal inferences at the individual level cannot be established, and ecological fallacies cannot be ruled out. However, the large sample size, long-term time series, and consistent findings across multiple sensitivity analyses collectively enhance the credibility and robustness of the observed associations. Second, the use of surveillance data constrained our ability to investigate the underlying pathophysiological mechanisms linking meteorological factors to HFMD burden. Third, the spatial resolution of the meteorological data represents a potential limitation. Using data from 31 stations in 88 counties may have led to exposure misclassification for areas without a station, where data were imputed from the nearest station. However, this was unlikely to substantially alter the conclusions, for several reasons. For instance, the meteorological stations were evenly distributed across the study area (Supplementary Figure S1), minimizing large data gaps. Furthermore, the primary exposures of interest were synoptic-scale meteorological conditions that exhibit greater spatial homogeneity than hyperlocal factors, such as air pollution. Most critically, any exposure misclassification introduced by this approach was likely nondifferential, which would generally bias the effect estimates toward the null hypothesis. Therefore, the statistically significant associations we report are likely to be conservative and robust against false positives arising from this specific limitation.
-
This study demonstrated a significantly higher YLD burden of HFMD associated with the joint and interactive effects of temperature, relative humidity, and wind speed. Additive interactions, particularly at mean temperatures of 8.7–22.8 °C, relative humidity > 73.7%, and wind speeds > 2.5 m/s, may substantially increase the risk of HFMD in children. These findings provide evidence to support targeted strategies aimed at reducing HFMD burden under specific meteorological conditions characterized by moderate mean temperatures, high relative humidity, and elevated wind speeds. The potential role of wind in facilitating both environmental and human-to-human transmission of pathogens should be considered. Furthermore, boys, minority regions, and urban agglomerations should be recognized as susceptible subgroups in the development of climate-sensitive HFMD prevention strategies.
HTML
Study Area and Data Sources
Estimating Daily YLDs Attributable to HFMD
Defining High-risk Thresholds for Meteorological Factors
Evaluating the Combined Effects of High-risk Meteorological Thresholds
Quantifying the Interactive Effects of the Meteorological Factors
Sensitivity Analysis
Pooled Exposure-response Relationship Between Meteorological Factors and YLDs of HFMD
Combined Effects of Temperature and Humidity Thresholds on YLDs of HFMD
Combined Effects of Temperature, Humidity, and Wind Thresholds on YLDs of HFMD
Stratification Analysis
Favorable Temperature and Humidity Conditions May Increase HFMD Burden
Increased Wind Speed Exacerbates Temperature and Humidity Effects on HFMD Burden
Higher HFMD Burdens During High-risk Meteorological Conditions among Subgroups
Translating Evidence into Health Policy and Practice
Strengths and Limitations
Competing Interests The authors declare that they have no competing interests.
Ethics The requirement for ethical board approval was waived by the Institutional Review Board (IRB) at Sun Yat-sen University because this study was a secondary analysis of surveillance data. All data were aggregated and did not contain any information at the individual level. Therefore, no specific ethical issues warrant special attention.
Date Sharing Climate data were obtained from an open-source database, which can be accessed at http://data.cma.cn/. The HFMD data were obtained from the Chinese Center for Disease Control and Prevention and are not publicly available. However, researchers interested in these data may contact the Chinese Center for Disease Control and Prevention via telephone (86-10-58900412) or email (data@chinacdc.cn). The supplementary materials will be available in www.besjournal.com.
&These authors contributed equally to this work.

 Quick Links
 DownLoad: