
-
Chronic kidney disease (CKD), characterized by persistent abnormalities in kidney structure and function, has become a major global public health concern and one of the leading causes of death in the 21st century. According to the Global Burden of Disease study, CKD ranked as the 12th leading cause of death in 2017, affecting nearly 697.5 million people worldwide. Of these, China accounted for approximately 170,000 deaths, ranking second globally after India[1,2]. A nationwide survey estimated a CKD prevalence of 10.8% in China, with approximately 132 million cases representing one-fifth of global CKD cases.
Although the primary risk factors for CKD are well established, identifying novel risk factors remains essential for advancing kidney disease prevention and control. Recently, the emerging field of green nephrology has highlighted environmental factors, including high temperatures, as significant contributors to CKD. Heat can impair the kidneys through various mechanisms, such as dehydration, reduced renal blood flow, inflammation, and activation of the renin-angiotensin-aldosterone system (RAAS), all of which accelerate CKD progression and increase mortality risk[3,4]. During heat waves, cumulative heat stress on the body’s thermoregulatory system exacerbates kidney dysfunction by activating the sympathetic nervous system and triggering systemic inflammation[5].
Previous studies have investigated the association between heat waves and CKD incidence and found that short-term exposure to heat waves increases the risk of CKD in countries such as Australia[6], Vietnam[7], and China[8]. Heat waves also significantly increase the risk of kidney-related complications and mortality in older adults[9]. However, evidence on the impact of heat waves on CKD mortality remains limited, particularly at the national level and in low- and middle-income countries. Therefore, it is necessary to provide evidence on the association between heat waves and CKD mortality based on a large-scale sample from multiple centers at the national level. Such data will be helpful in understanding the effect of ambient temperature on CKD and its spatial heterogeneity in the context of climate change.
With global warming, the frequency, intensity, and duration of heat waves are projected to increase dramatically, which may threaten kidney health. For instance, a study revealed that the susceptibility of patients with acute kidney injury (AKI) to high temperatures increased from 1995 to 2016, a trend that underscores the growing threat under global warming scenarios[10]. To date, few studies have projected the impacts of future climate change on the incidence of CKD. For instance, one study projected that rising temperatures would significantly increase the incidence of heat-related kidney disease in Australia, especially under high-emission scenarios (RCP8.5)[11]. However, no studies have assessed the impact of future climate change on CKD mortality. In this study, we aimed to investigate whether heat waves significantly increased the risk of mortality related to CKD and whether this association varies across different regions and population groups.
To achieve this aim, we conducted a large-scale, individual-level case-crossover analysis using data from 2,790 counties and districts across China from 2004 to 2022 to investigate the association between heat waves and CKD mortality. Additionally, we quantified the future CKD mortality burden attributable to heat waves under climate change and future population scenarios. Our findings provide valuable information to better understand the impact of climate change on kidney health and to develop clinical management strategies for CKD.
-
This study employed an individual-level, time-stratified, case-crossover design to examine the association between heat waves and CKD mortality. This design, analogous to a classical matched case-control study, minimizes confounding from individual-level, time-invariant risk factors through self-matching and automatically accounts for temporal trends[12,13]. Specifically, for each CKD death, temperature exposure on the day of death (case day) was compared with temperature exposure on control days, defined as the same day of the week within the same calendar month. Therefore, each case day had 3–4 matched control days.
-
We extracted anonymized, individual-level CKD death records from China’s Vital Registration System from January 1, 2004, to December 31, 2022. This system adheres to strict protocols, standardized procedures, and rigorous quality control measures. In our previous study[14], we presented mortality data for 2,844 counties and districts across China. Certified physicians verified the dates and causes of death to ensure the reliability of the dataset.
The underlying causes of death were coded according to the ninth (ICD-9-CM) and tenth (ICD-10-CM) editions of the International Classification of Diseases, Clinical Modification. Based on previous literature[15-18], CKD included N00–N08 and N18 in ICD-10 as well as 580–583 and 585 in ICD-9. Data on death dates, demographics (sex, age, and occupation), and addresses were also obtained. Based on the characteristics of occupational heat exposure, we classified occupations into three groups: indoor, outdoor, and other. Indoor occupations include office workers and teachers, whereas outdoor occupations include construction workers, farmers, and similar roles. The “other occupations” category mainly refers to jobs that are difficult to classify or involve mixed exposure environments, such as drivers, delivery workers, and self-employed workers.
-
Hourly maximum temperature (°C) and relative humidity (%) from 2004 to 2022 were obtained from the fifth-generation European Reanalysis Land dataset (ERA5-Land) with a spatial resolution of 0.1° × 0.1°[19], which has been widely used for climate change and human health in previous studies. Hourly meteorological data were extracted from the corresponding interpolation grid according to the latitude, longitude, and mortality data for each study site. The 24-hour values were then averaged to obtain the daily maximum temperature and relative humidity. Considering that meteorological monitoring stations do not cover all study locations, we applied the Anusplin spatial interpolation method to daily maximum temperature data from climate stations, generating nationwide daily temperature raster data with a resolution of 0.01° × 0.01°. For mortality data, as they were sourced from official statistics with minimal overall missingness, we excluded records corresponding to dates with missing data from the analysis.
The projected daily maximum temperatures for 2020–2100 were derived from the Inter-Sectoral Impact Model Intercomparison Project within the sixth phase of the Coupled Model Intercomparison Project (CMIP6). The CMIP6 scenarios were based on Shared Socioeconomic Pathways (SSPs). We selected three SSP scenarios in this study: SSP1-2.6, low greenhouse gas emissions representing sustainable development; SSP3-7.0, medium-to-high emissions representing intermediate development; and SSP5-8.5, high emissions representing fossil fuel-driven development[20]. Daily maximum temperature projections for each SSP scenario were obtained using five major global circulation models (GFDL-ESM4, IPSL-CM6A-LR, MPI-ESM1-2-HR, MRI-ESM2-0, and UKESM1-0-LL). Details are provided in the Supplementary Materials (Supplementary Tables S1 and S2).
-
To examine the association between heat waves and CKD mortality, PM2.5 concentrations were included as covariates in the model. Daily PM2.5 concentrations at 1 km × 1 km resolution were obtained from the China High Air Pollution dataset (http://www.geodata.cn), which was validated in a previous study (R2 = 0.92, Root Mean Squared Error [RMSE] = 10.76 µg/m3)[21].
For future projections, provincial population estimates for 2020–2099 under the SSP scenarios were extracted from the CMIP6 model outputs (https://esgf-node.llnl.gov/projects/cmip6/). Additionally, the 2019 China CKD mortality rate of 13.56 deaths per 100,000 population (95% CI: 11.67–15.83) was obtained from the Global Burden of Disease study 2019.
-
Given the diverse climate zones and adaptation capacities in China, we defined heat waves based on temperature distributions, as suggested by previous studies[22,23]. Heat waves were identified as ≥ 3 consecutive days with daily maximum temperatures exceeding the 92.5th percentile of the local temperature distributions during the study period (2004–2022). Specifically, we compared model performance under various combinations of temperature thresholds and duration days using both the Akaike Information Criterion (AIC) and Bayesian Information Criterion (BIC) as evaluation metrics. The results (Supplementary Table S3) showed that the definition HW925.3 (temperature ≥ 92.5th percentile lasting for ≥ 3 consecutive days) performed best in terms of both AIC and BIC values. Therefore, we adopted this definition in our main analysis[24].
Heat wave intensity was defined as the temperature difference between the maximum temperature and heat wave threshold, with non–heat wave days assigned an intensity of 0 °C. Because heat waves typically occur in warm months, we included the period from May to September of each year to assess the impact of heat waves on CKD mortality[25].
-
We used conditional logistic regression combined with a distributed lag nonlinear model (DLNM) to examine the association between heat wave exposure and CKD mortality in China. Three lag days were selected based on preliminary findings (Supplementary Figure S1). The model was adjusted for several confounders, including relative humidity (RH), ambient PM2.5, and holidays. The model equation is as follows:
$$ \begin{matrix}Logit\left(P\left(Case=1in{Strata}_{i}\right)\right)=cb\left(CHEs,lag=3\right)+\\ns\left(RH,3\right)+ ns\left({PM}_{2.5},3\right)+Holiday+{Strata}_{i}+\alpha \end{matrix} $$ (1) Where $ P\left(Case=1in{Strata}_{i}\right) $ is the probability of a case occurring in stratum i. Case is a binary variable, with 1 indicating the case and 0 for the control. Stratai is a time-stratification variable comprising one case and three to four matched controls. cb(CHEs, lag = 3) is a cross-basis matrix for heat wave exposure and lag, using an integer function for exposure and a natural spline (ns) function with three degrees of freedom for lag. RH and PM2.5 are the relative humidity and daily mean PM2.5, respectively, and were modeled with ns functions with three degrees of freedom[26]. Holiday is a binary variable for weekends and public holidays in China that controls for the holiday effect. α is the intercept.
The association between heat wave intensity and CKD mortality was also investigated. First, we modeled the nonlinear relationship between heat wave intensity and CKD mortality using a B-spline (bs) function with three degrees of freedom for exposure and an ns function with three degrees of freedom for lag days. The exposure-response relationship showed an approximately monotonic increase; therefore, we used a linear function to estimate the cumulative effect of heat wave intensity over 0–3 lag days.
The results are reported as Excess Risk (ER) with 95% confidence intervals (CI), representing the percentage change in mortality risk during heat wave days relative to non–heat wave days. The ER formula is as follows:
$$ \begin{matrix}ER=\left[exp\left(\beta \right)-1\right]\times 100\mathrm{\% } \end{matrix} $$ (2) Where β represents the coefficient of cb(CHEs, lag) in the model.
Subgroup analyses stratified according to sex, age, region, and occupation were performed to identify vulnerable populations. Differences between subgroups were tested using the following equation[27]:
$$ \begin{matrix}\left(\widehat{{Q}_{1}}-\widehat{{Q}_{2}}\right)\pm 1.96\sqrt{{\widehat{{SE}_{1}}}^{2}+{\widehat{{SE}_{2}}}^{2}} \end{matrix} $$ (3) Where Q1 and Q2 are the effect estimates for the two subgroups, and $ \widehat{{SE}_{1}} $ and $ \widehat{{SE}_{2}} $ are their respective standard errors.
-
To assess CKD mortality attributable to heat waves during the study period, we calculated the attributable fraction (AF) using the following formula:
$$ AF=\frac{AN\sum \left(Death\times \dfrac{\left(\text{RR}-1\right)}{RR}\times {Freq}_{CHEs}\right)}{\sum {Death}_{CHEs}} $$ (4) Where Death is the average number of deaths per day, and RR is the relative risk of CKD mortality due to heat waves. FreqCHEs is the number of heat wave days. DeathCHEs represents the total CKD deaths during heat wave days.
For future projections of heat wave–related CKD mortality, we applied the national exposure-response association derived from the above model to estimate attributable CKD deaths under different climate scenarios (SSP1-2.6, SSP3-7.0, and SSP5-8.5). The calculations were performed using the following equations:
$$ {AN}_{x,y,i}=\frac{\sum \limits_{n=1}^{{N}_{GCM}}{pop}_{i}\times M\times \dfrac{\left(RR-1\right)}{RR}\times {Freq}_{CHEs,x,y,i}}{{N}_{GCM}} $$ (5) Where ANx,y,i means CKD deaths attributable to heat waves for decade x, RCP y, and province i. NGCM is the number of global circulation models (five in this study). Popi means the projected population of province i, and M is the CKD mortality rate in 2019. We assumed constant CKD mortality rates across provinces and during 2020–2099 due to data inaccessibility, where FreqCHEs, i is the frequency of heat waves in province i under scenarios y and x. The AF for each scenario was calculated as follows:
$$ {AF}_{x,y,i}=\frac{{AN}_{x,y,i}}{{pop}_{x,y,i}\times M}\times 100\% $$ (6) In this formula, all parameters are consistent with those in Equation 5. For detailed definitions, please refer to the explanations above.
Monte Carlo simulations were used to compute the 95% CIs for AN and AF. The results were averaged across the five General Circulation Models (GCMs) for each climate scenario.
-
We conducted several sensitivity analyses to test the robustness of our findings. First, we excluded PM2.5 from the model as a covariate to assess the potential influence of air pollution on the estimated associations. Second, we included other air pollutants, such as PM10, NO2, and O3, and additionally incorporated minimum and mean temperatures into the model as spline variables to examine the impact of temperature metric selection on the results. Third, we performed alternative analyses using different GCM datasets to validate the stability of future scenario projections. Fourth, we repeated the analysis using multiple heat wave definitions, including varying temperature thresholds and durations, to assess the influence of heat wave definition on the results.
Mortality data were derived from the China Cause of Death Reporting System, managed by the Chinese Center for Disease Control and Prevention (China CDC). This system follows standardized procedures for data collection and reporting, with causes of death coded according to the ICD-10. To ensure accuracy, the data underwent multiple levels of quality control, including logical checks, duplicate record removal, verification against hospital records and household registrations, and routine sampling audits conducted by local and national CDC offices. Meteorological variables were obtained from the ERA5-Land, developed by the European Centre for Medium-Range Weather Forecasts. ERA5-Land integrates satellite retrievals, in situ observations, and model outputs through advanced data assimilation techniques, providing consistent and spatially continuous hourly data at a resolution of 0.1 ° × 0.1 °.
All analyses were performed using R software (version 4.2.2). DLNM were conducted using the “dlnm” package, and visualizations were generated using “ggplot2”.
-
This study included 236,260 CKD deaths. Of these, 135,132 (57.20%) were men, and 150,831 (63.84%) were aged 65 years or older. Outdoor occupations accounted for 162,171 deaths (68.64%). Regarding climate zones, the highest number of deaths was observed in the tropical and subtropical regions (155,787; 65.94%), whereas the lowest number of deaths occurred in the mesic and cold zones (31,391; 13.29%) (Table 1). Compared with control days, case days had higher daily maximum temperatures and lower relative humidity (Supplementary Table S4).
Type Number Proportion (%) Total 236,260 100.00 Sex Male 135,132 57.20 Female 101,128 42.80 Age (years) 0-64 85,428 36.16 65+ 150,831 63.84 Occupation Indoor 14,796 6.26 Outdoor 162,171 68.63 Other 59,293 25.11 Region Warm temperature 49,082 20.77 Mesic/cold temperature 31,391 13.29 Subtropical/tropical 155,787 65.94 Table 1. The basic characteristics of CKD deaths during summer in the study
-
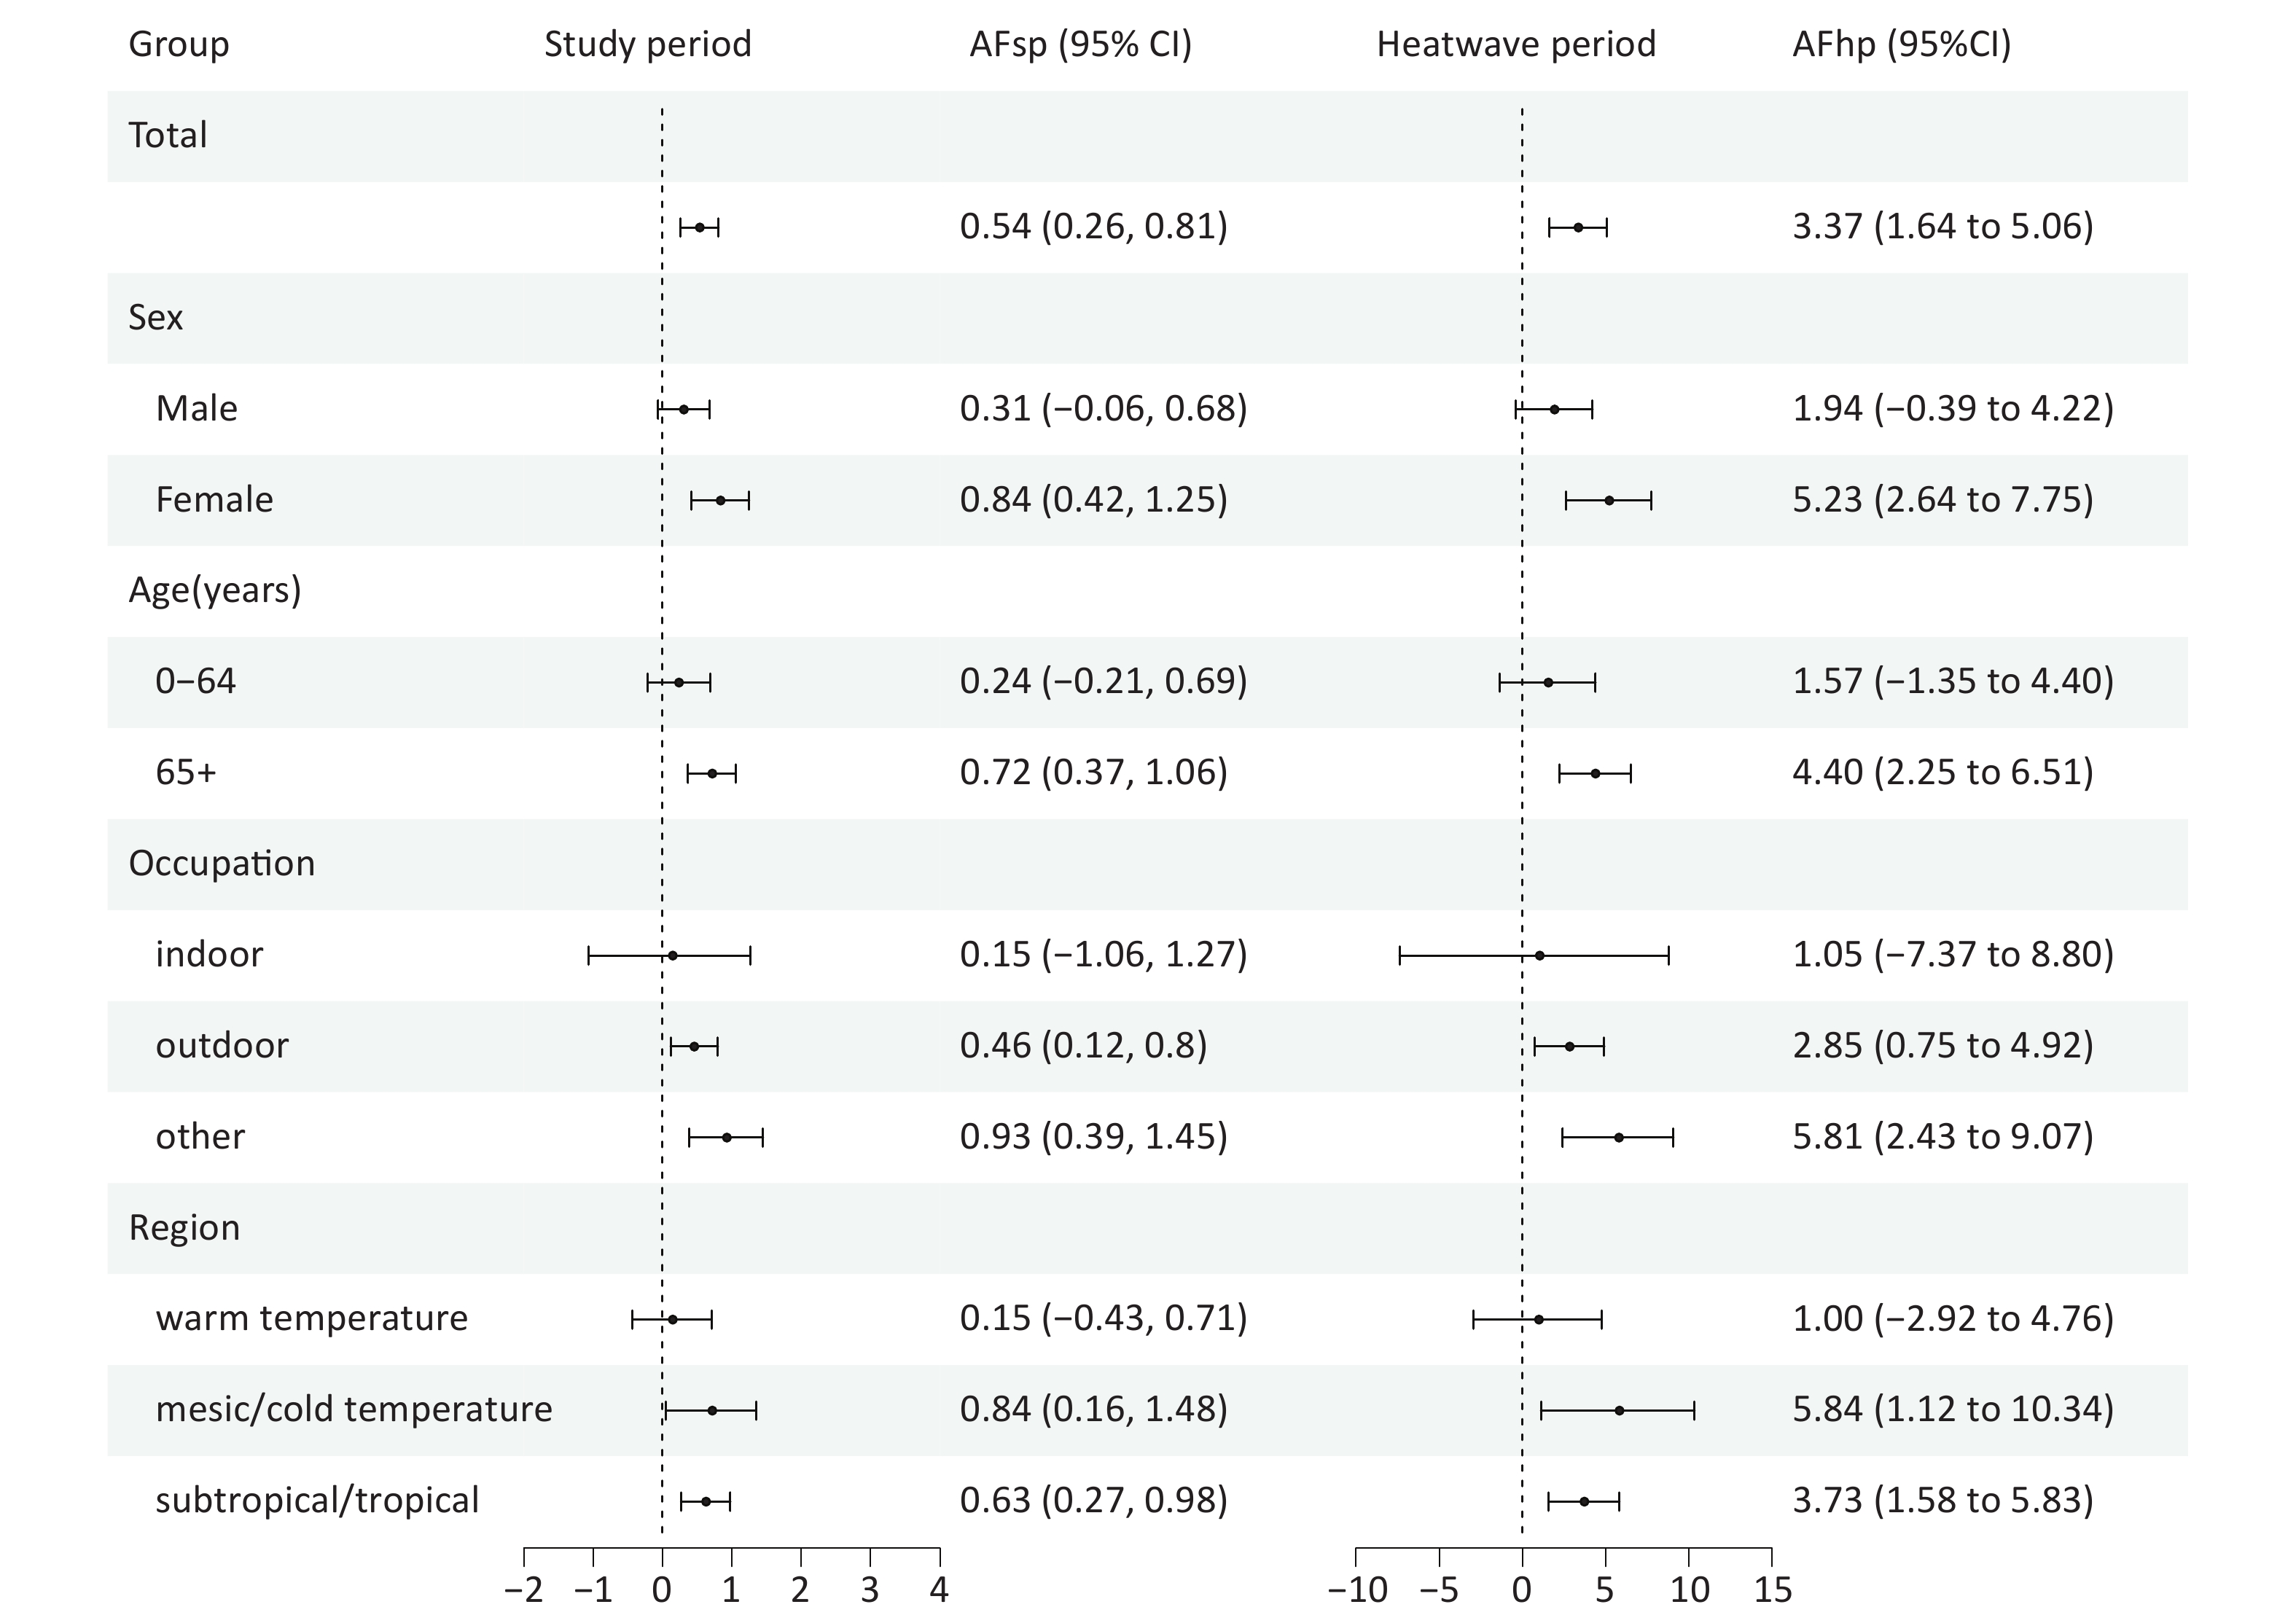
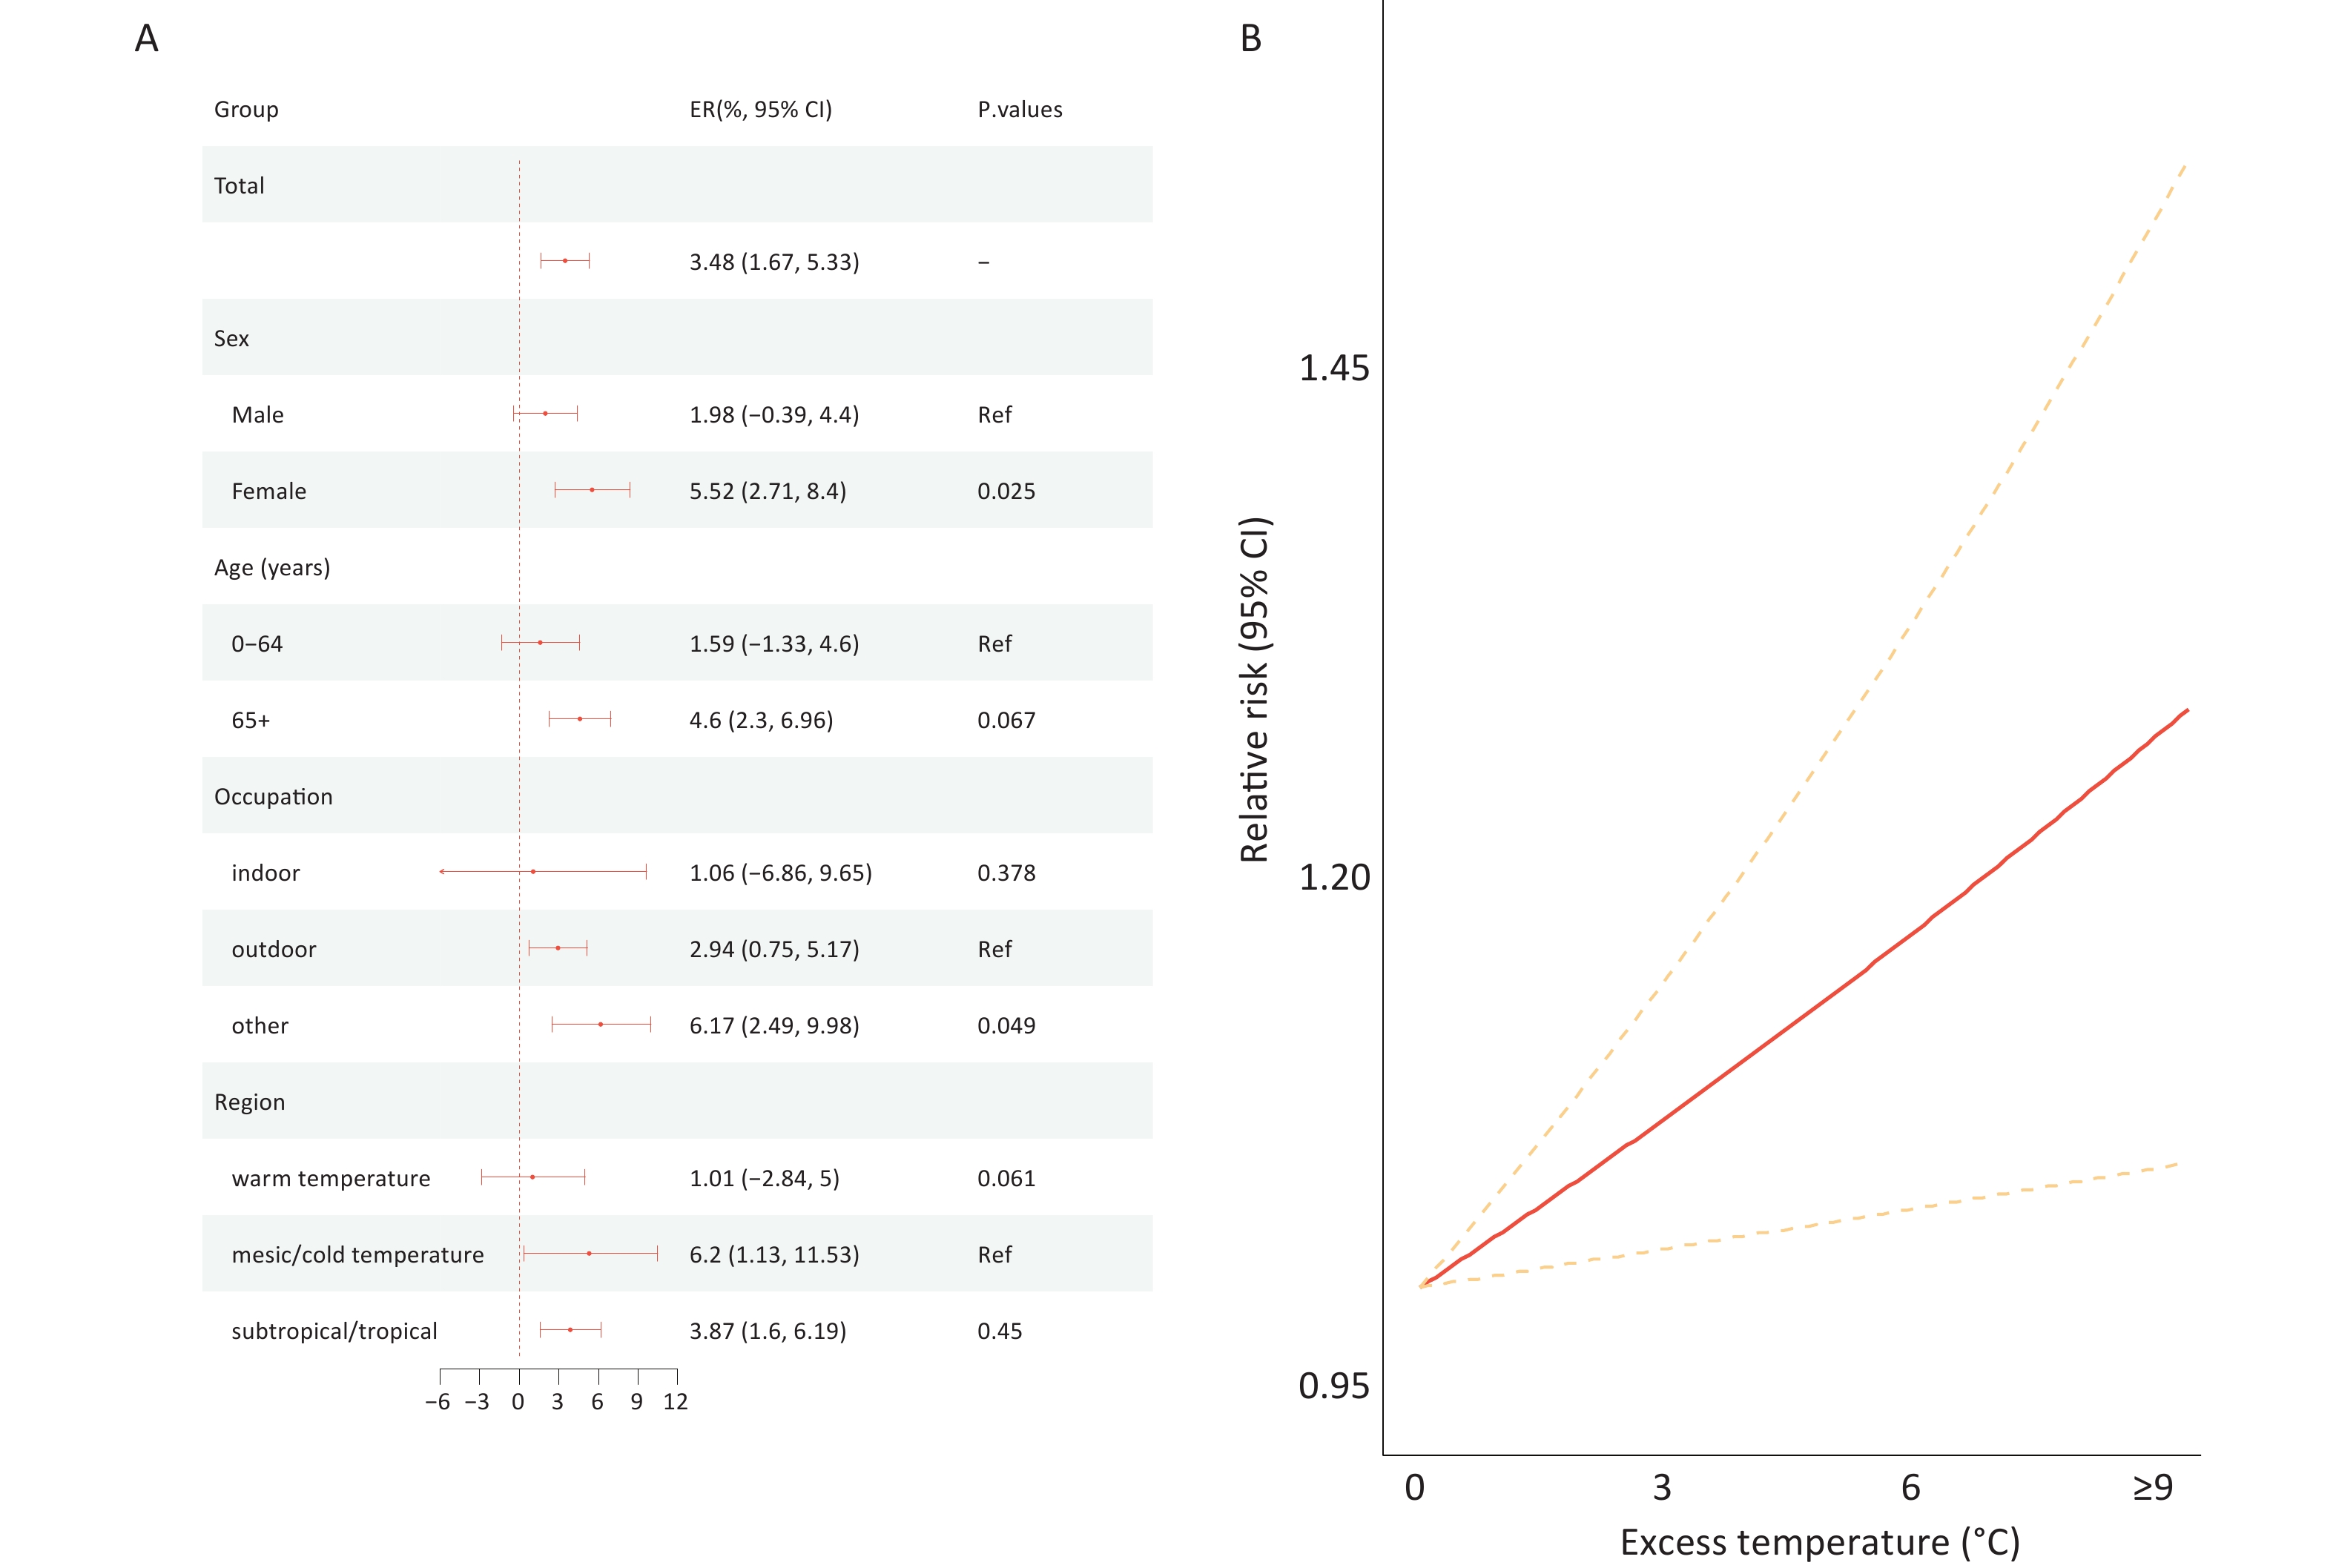
Compared with that during non–heat wave days, CKD mortality risk increased by 3.48% (95% CI: 1.67% to 5.33%) during heat waves (Figure 1A), with higher risks observed among women (ER = 5.52%, 95% CI: 2.71% to 8.40%), individuals aged 65 years or older (ER = 4.6%, 95% CI: 2.3% to 6.96%), those in other occupations (ER = 6.17%, 95% CI: 2.49% to 9.98%), and people in mesic and cold regions (ER = 6.20%, 95% CI: 1.13% to 11.53%) compared with the risks observed among their counterparts (Figure 1A). For provincial distribution, we found the highest heat wave–related mortality risks in Gansu (16.81%, 95% CI: 1.69% to 34.18%), Xinjiang (8.89%, 95% CI: –0.56% to 19.24%), and Shanghai (8.13%, 95% CI: –8.96% to 28.41%) (Supplementary Table S5).
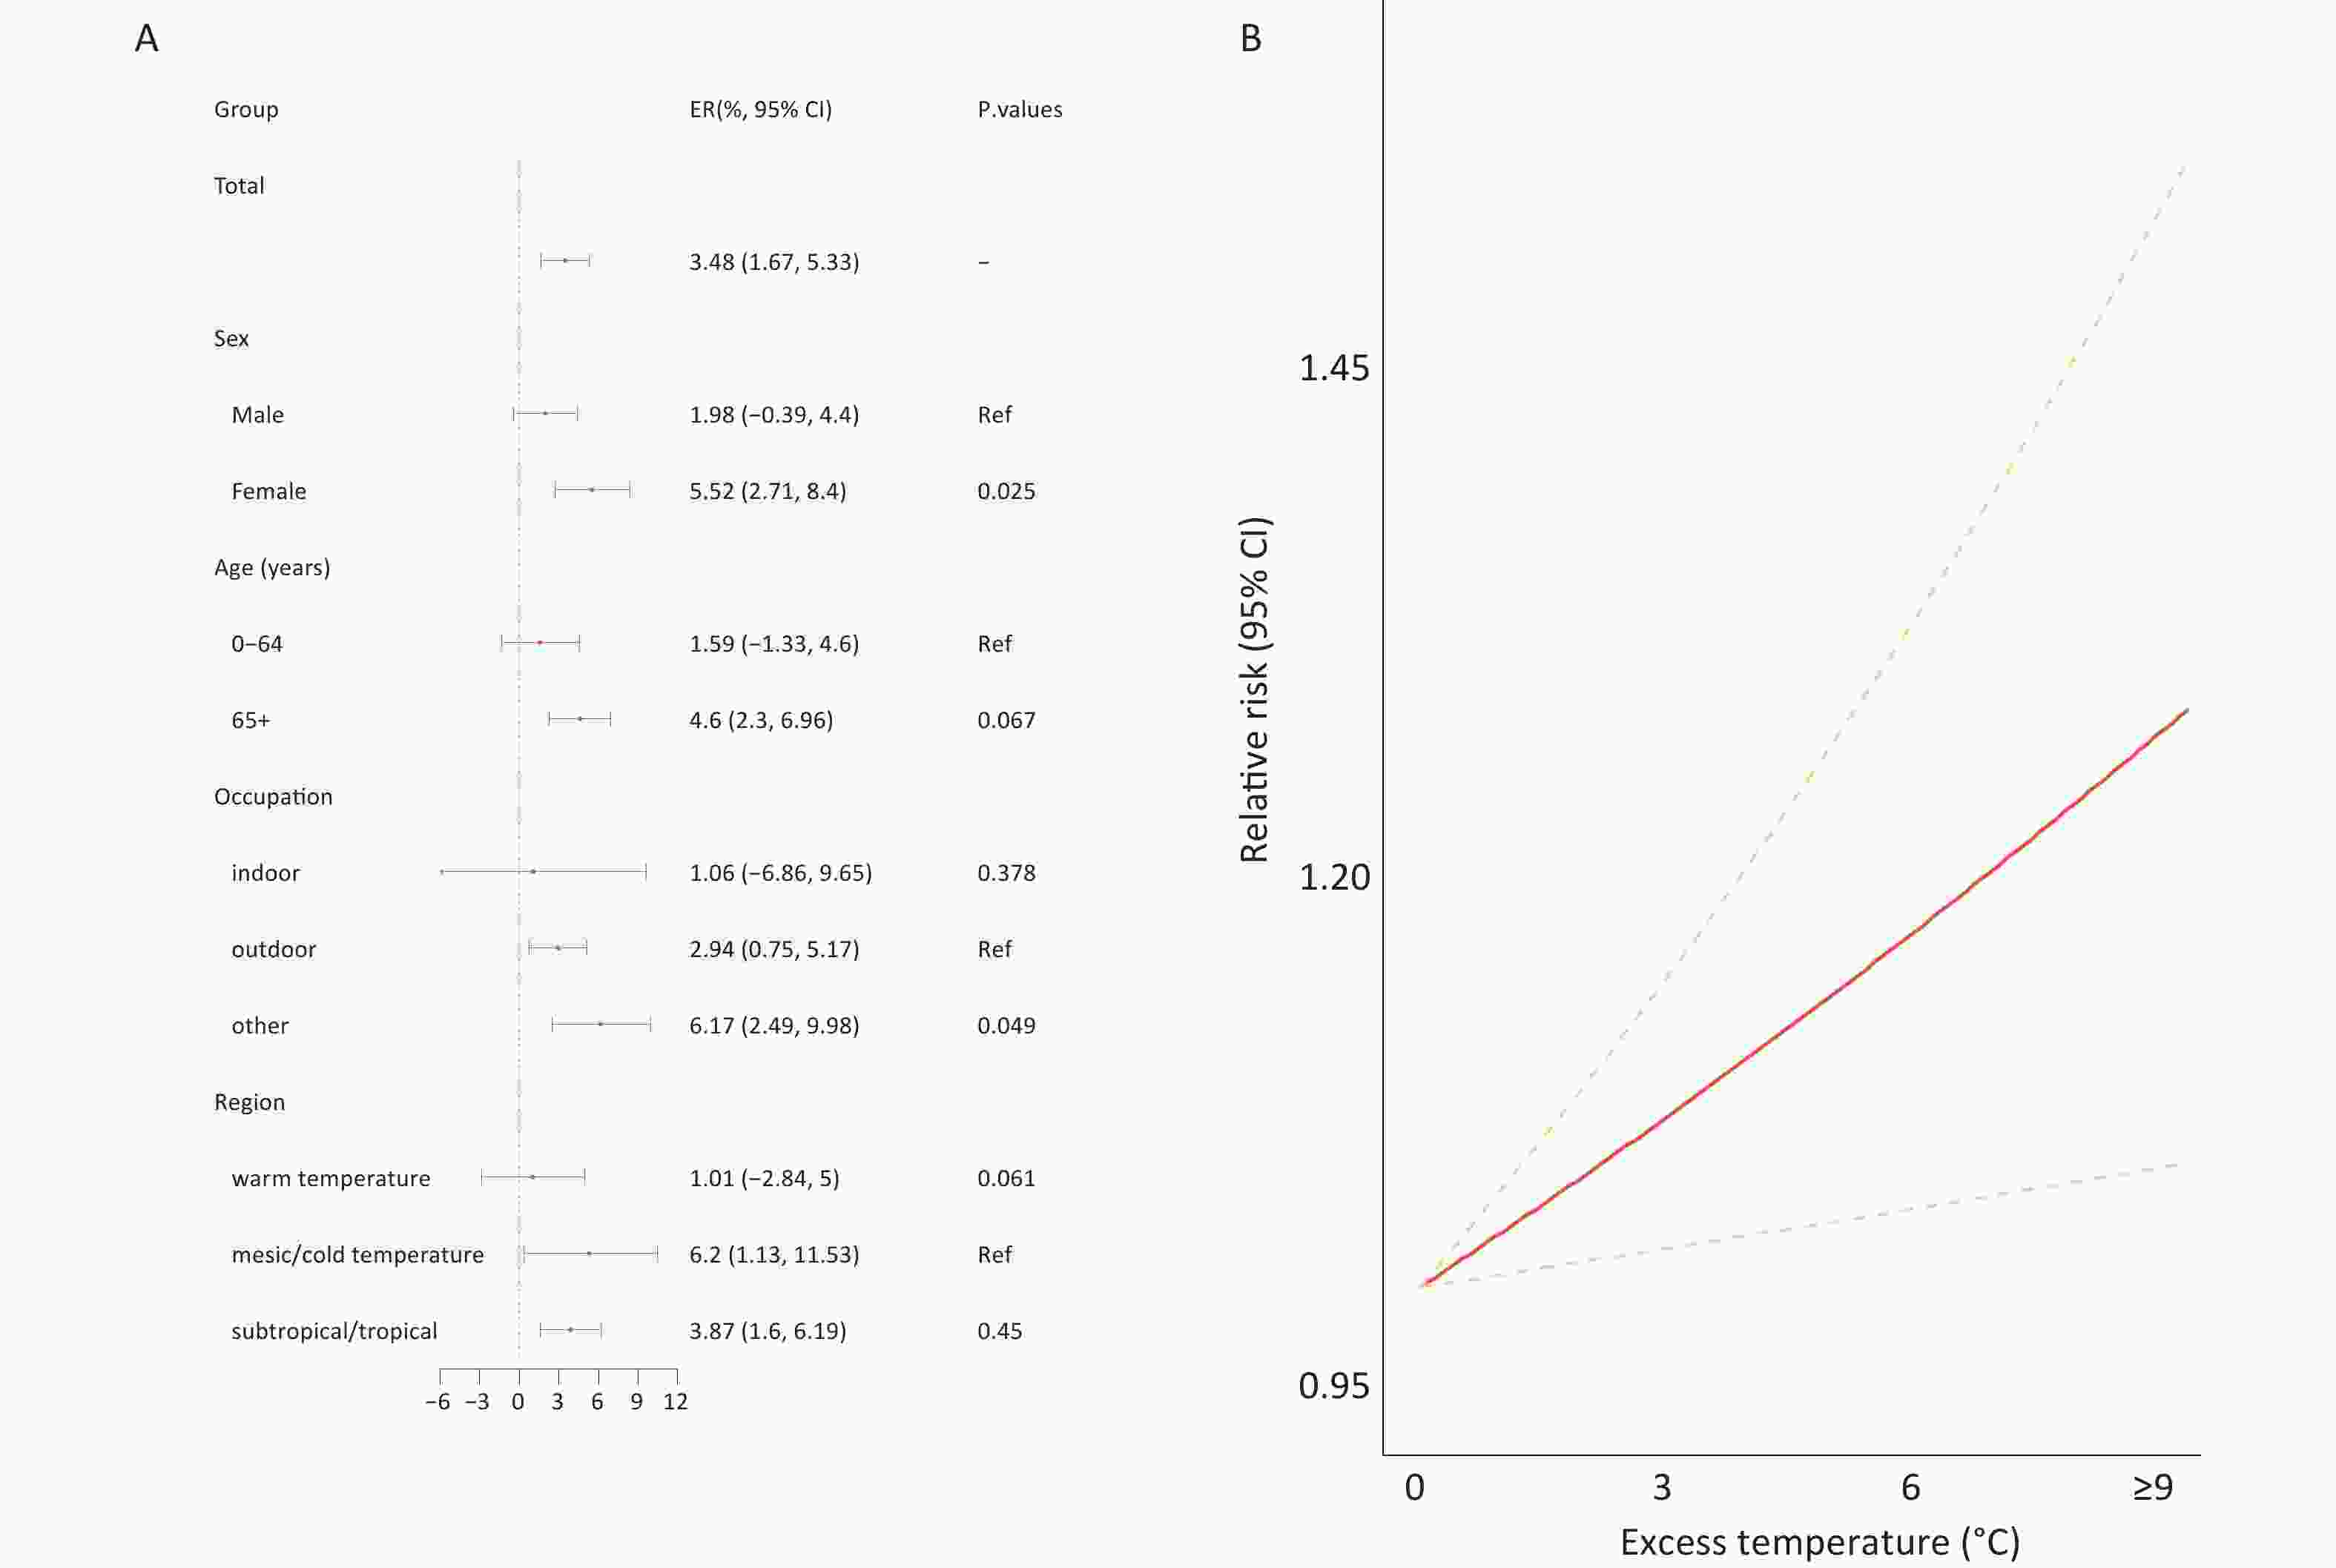
Figure 1. The excess rate (ER, %) of CKD attributed to heat wave by subpopulations (A), heat wave intensity (B), and Province (C). Note: Excess rate (ER, %). Ref (Reference).
Heat wave intensity modified the effect of heat waves. Each 1°C increase in heat wave intensity was associated with a 2.48% (95% CI: 0.12% to 4.91%) increase in CKD mortality. Subgroup analysis showed that heat wave intensity had a greater impact on women (3.87%, 95% CI: 0.29% to 7.58%), older individuals (3.63%, 95% CI: 0.65% to 6.70%), and outdoor occupations (3.33%, 95% CI: 0.46% to 6.31%) (Figure 1B,Supplementary Figure S2 and Table S6) compared with that on their counterparts.
-
Figure 2 indicates that heat waves disproportionately increased the mortality burden of CKD among older individuals, women, and residents in mesic/cold regions. During the study period, the overall AF of CKD mortality due to heat waves was 0.54% (95% CI: 0.26% to 0.81%), and the AFs were higher(0.84%, 95% CI: 0.42% to 1.25%) for women than for men (0.31%, 95% CI:–0.06% to 0.68%), and higher for older individuals aged 65 years or older(0.72%, 95% CI: 0.37% to 1.06%) than for the younger population(0.24%, 95% CI:–0.21% to 0.69%), for mesic/cold regions(0.84%, 95% CI: 0.16% to 1.48%) than other climate zones. During heat waves, the AFs of CKD mortality was higher than those during the study period, but the vulnerable populations remained the same.
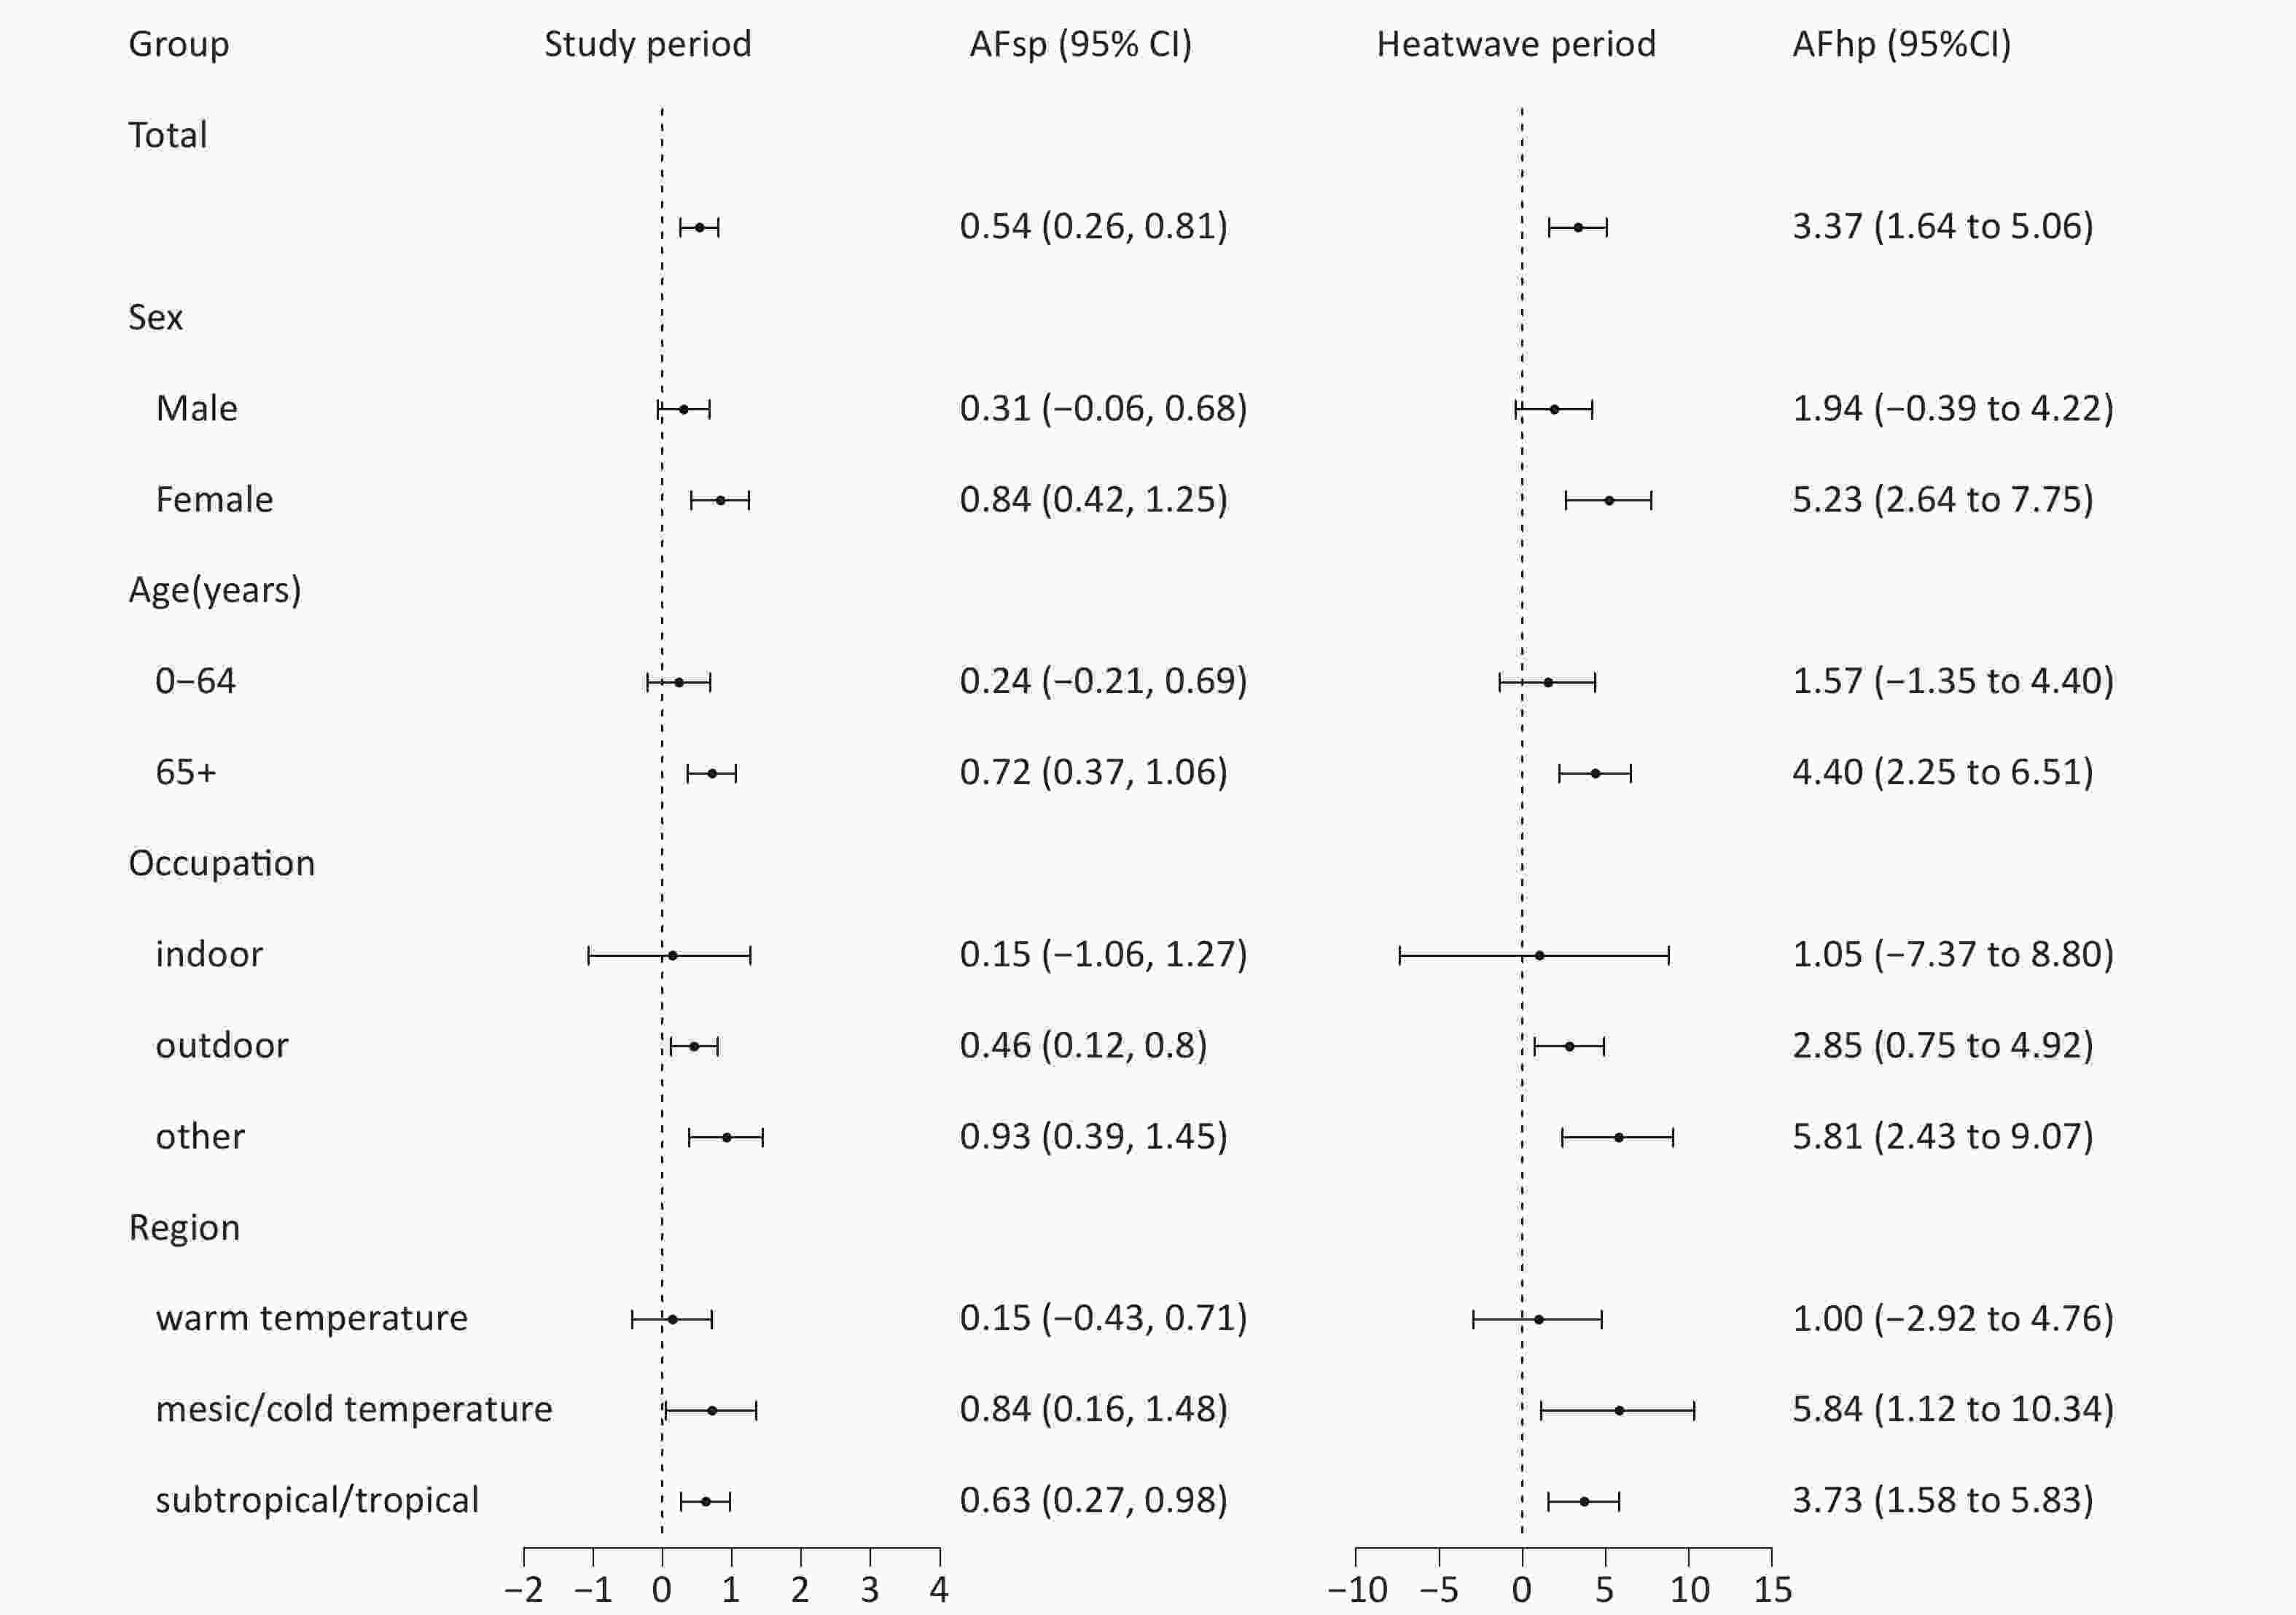
Figure 2. The attributable fraction (AF) of CKD deaths related to heat waves in China during 2004–2022. AFhp is the attributable fraction of CKD deaths due to heat waves during the heat wave period. AFsp is the attributable fraction of CKD deaths due to heat waves during the study period.
-
The frequency of heat waves in China is projected to increase, particularly under the SSP3-7.0 and SSP5-8.5 scenarios (Supplementary Figures S3, S4. Under SSP3-7.0 and SSP5-8.5, the future CKD mortality burdens attributable to heat waves (AFs) are expected to increase, whereas they are projected to stabilize under SSP1-2.6 (Supplementary Figure S5, S6). For instance, under SSP5-8.5, the AF is projected to rise from 0.64% (95% CI: 0.52% to 0.78%) in the 2020s to 2.44% (95% CI: 1.97% to 2.95%) in the 2090s. The attributable number (AN) of CKD-related deaths is projected to show varying trends under different scenarios: a decrease under SSP1-2.6, an increase under SSP3-7.0, and an initial rise followed by a decline in the latter half of the century under SSP5-8.5. For example, under SSP3-7.0, the AN is projected to increase from 5,102 deaths (95% CI: 4,127 to 6,518) in the 2020s to 12,349 deaths (95% CI: 9,960 to 14,952) in the 2090s (Table 2). The future AN and AF for each province in China in the 2020s and 2090s are presented in Supplementary Tables S7.
Scenarios Periods AN (95% CI) AF (%, 95% CI) SSP1-2.6 2020s 5136 (4153, 6199) 0.65 (0.52, 0.78) SSP1-2.6 2030s 5986 (4832, 7229) 0.77 (0.62, 0.93) SSP1-2.6 2040s 6340 (5117, 7655) 0.86 (0.69, 1.04) SSP1-2.6 2050s 6234 (5033, 7514) 0.91 (0.74, 1.1) SSP1-2.6 2060s 5727 (4619, 6917) 0.93 (0.75, 1.12) SSP1-2.6 2070s 5449 (4393, 6585) 1 (0.8, 1.2) SSP1-2.6 2080s 4542 (3661, 5481) 0.95 (0.77, 1.15) SSP1-2.6 2090s 3580 (2891, 4323) 0.87 (0.7, 1.05) SSP3-7.0 2020s 5102 (4127, 6158) 0.63 (0.51, 0.76) SSP3-7.0 2030s 6421 (5188, 7751) 0.8 (0.65, 0.96) SSP3-7.0 2040s 7901 (6374, 9550) 1.02 (0.82, 1.23) SSP3-7.0 2050s 8453 (6821, 10233) 1.15 (0.92, 1.39) SSP3-7.0 2060s 9486 (7661, 11475) 1.37 (1.1, 1.65) SSP3-7.0 2070s 10656 (8597, 12879) 1.63 (1.32, 1.97) SSP3-7.0 2080s 11113 (8976, 13456) 1.79 (1.45, 2.17) SSP3-7.0 2090s 12349 (9960, 14952) 2.05 (1.66, 2.49) SSP5-8.5 2020s 5111 (4123, 6170) 0.64 (0.52, 0.78) SSP5-8.5 2030s 6423 (5182, 7758) 0.83 (0.67, 1) SSP5-8.5 2040s 7686 (6200, 9287) 1.04 (0.84, 1.26) SSP5-8.5 2050s 9208 (7417, 11129) 1.35 (1.09, 1.63) SSP5-8.5 2060s 10260 (8269, 12414) 1.66 (1.34, 2.01) SSP5-8.5 2070s 10311 (8321, 12469) 1.88 (1.52, 2.28) SSP5-8.5 2080s 10413 (8411, 12583) 2.17 (1.76, 2.63) SSP5-8.5 2090s 10023 (8091, 12111) 2.44 (1.97, 2.95) Note. Attributable number(AN). Attributable fraction(AF). Table 2. Projected AN and AF of CKD due to heat waves at different periods at the national level
Spatial heterogeneity was observed in the future projected AF and AN. For instance, under SSP5-8.5 in the 2090s, the provinces with the highest AF were Hainan (3.31%, 95% CI: 1.66% to 5.02%), Yunnan (3.05%, 95% CI: 1.46% to 4.75%), and Guangdong (2.84%, 95% CI: 1.24% to 4.41%), whereas the provinces with the highest AN were Guangdong (1,044, 95% CI: 458 to 1,624), Shandong (686, 95% CI: 349 to 1,072), and Jiangsu (632, 95% CI: 337 to 985) (Supplementary Table S8).
-
Sensitivity analyses demonstrated the robustness of our findings across various scenarios, including changes in PM2.5, NO2, O3, relative humidity (RH), the use of alternative heat wave definitions (Supplementary Table S9), and the application of different GCMs (Supplementary Figure S7 and Table S10).
-
In this nationwide case-crossover study, we examined the association between heat waves and CKD mortality and projected future heat wave–related CKD mortality under various climate change scenarios. We found that heat waves significantly increased the risk of CKD mortality, with marked spatial and population heterogeneity. The projections showed an increase in heat wave–related CKD mortality under moderate-to-high climate change scenarios, with substantial spatial variability across China. This is the first large-scale study to investigate the mortality risk and burden of CKD attributable to heat waves in China, providing novel evidence on the impact of climate change on kidney health for policy development aimed at preventing heat wave–related CKD mortality.
Consistent with previous studies on the association between temperature and kidney disease, we observed an increased risk of CKD mortality during heat waves in China[28-30]. For instance, several studies have linked high temperatures to an elevated incidence of CKD[6-8]. A systematic review reported a 3% increase in kidney mortality for every 1°C rise in temperature[31]. However, we did not find any studies on the effect of heat waves on CKD mortality at the national level. Prolonged exposure to extreme heat can stress the body’s thermoregulatory systems, activate the sympathetic nervous system, induce systemic inflammation, and exacerbate kidney dysfunction[5]. Additionally, heat may hyperactivate the RAAS, which, although aimed at retaining sodium and water, may lead to metabolic acidosis and further kidney damage[32,33]. In recent years, multiple clinical and animal studies have demonstrated the pathological effects of heat stress on the kidneys, suggesting potential biological mechanisms linking heat exposure to CKD. These findings indicate that heat stress may accelerate CKD progression through chronic injury pathways[34]. Under high-temperature conditions, the body prioritizes heat dissipation through the skin, leading to reduced renal blood flow[35]. This redistribution can lead to renal hypoperfusion, local hypoxia, metabolic disturbances, and tissue damage. This mechanism is considered a key pathway through which heat stress induces AKI and its progression to CKD[36]. Animal studies have shown that repeated heat-induced dehydration can cause tubular atrophy, interstitial fibrosis, and inflammatory cell infiltration, which are critical processes in CKD development. Notably, even mild but recurrent dehydration may result in irreversible kidney damage. These findings suggest that the increasing frequency and intensity of heat waves driven by ongoing global warming may exacerbate the heat-related CKD burden in China. We found that 3.37% of CKD deaths and 0.54% of all CKD deaths during the study period were associated with heat waves. This shows that heat waves significantly impact CKD deaths in China, highlighting the need for more attention from the public and clinical experts.
We further found significant regional variability in heat wave–related CKD mortality risk, with western China showing particularly strong effects. Previous studies have reported a higher CKD mortality burden in western China[37]; however, the spatial heterogeneity in heat wave–related mortality risk has not been examined. Such spatial disparities could stem from variations in CKD prevalence, socioeconomic development, primary healthcare services, and adaptive capacity[38]. For example, limited access to medical resources, clean water, and cooling equipment in western China during heat waves may amplify CKD mortality risk. Heat waves can also disrupt power and water supplies, critically affecting patients with CKD who rely on dialysis. Moreover, southeastern China exhibited a notably elevated mortality burden, which could be explained by its subtropical climate with prolonged heat and excessive humidity. These conditions hinder thermoregulation through perspiration and may impose additional stress on individuals with compromised renal function.
Stratified analysis showed that heat waves disproportionately affected women and older individuals, consistent with earlier findings[28,29]. The increased vulnerability of these groups may be linked to their physiological and renal characteristics. Aging kidneys undergo structural and functional changes, such as reduced nephron number and size, lower glomerular filtration rate, and accumulation of senescent cells, making older people more susceptible to heat-related kidney damage[39,40]. The higher risk in women may be partially attributed to their lower body water content compared to that of men, which increases physiological stress under dehydration. Additionally, women tend to have fewer nephrons, which can exacerbate hyperfiltration and accelerate kidney function decline under stress[41,42]. Based on physiological susceptibility, women and older individuals are more vulnerable to the effects of heat waves, which may also relate to their social and behavioral characteristics, as well as their overall health status. First, older individuals often have multiple underlying chronic conditions (such as diabetes and hypertension) that reduce their physiological capacity to regulate body temperature in high-heat environments. Their perception of heat and behavioral responses (e.g., proactive cooling and hydration) are often inadequate. Second, women in certain social contexts may undertake more indoor heat–exposure tasks or caregiving roles, increasing their opportunities for heat exposure. Therefore, vulnerable populations, such as older individuals and women, should be prioritized for protection against heat waves.
Outdoor occupations, such as farming and construction work, have a significantly higher risk of CKD mortality related to heat waves. This aligns with findings from the U.S., where outdoor occupations had a 20-fold higher risk of heat-related deaths than other occupations[43]. CKD is particularly prevalent among manual laborers exposed to extreme heat[44]. Potential mechanisms include increased insensible water and salt loss, leading to vascular constriction and kidney damage, as well as subclinical rhabdomyolysis under chronic dehydration, causing hyperuricemia and tubular injury[45,46]. These findings highlight the urgent need for protective strategies targeting outdoor workers, such as those in construction, agriculture, and emergency services.
Although global projections of heat-related disease burdens exist, few studies have specifically assessed CKD mortality associated with temperatures driven by climate change. For example, Brikowski et al. projected an increase of 1.6 to 2.2 million lifetime kidney stone cases in the U.S. by 2050 due to climate change[47]. Similarly, an Australian study reported that under RCP4.5 and RCP8.5 scenarios, the AFs of kidney disease hospitalizations due to heat are projected to rise from 2.7% to 3.8% and 4.6% by 2050, respectively[11]. However, these studies primarily focused on the incidence of CKD, with limited literature available on CKD mortality. We further projected a substantial increase in CKD mortality attributable to heat waves under the moderate (SSP3-7.0) and high (SSP5-8.5) greenhouse gas emission scenarios, while it remained relatively stable under the SSP1-2.6 scenario. This trend aligns closely with the anticipated changes in the frequency of heat waves. Regarding attributable deaths (AN), a decline under the SSP5-8.5, potentially influenced by projected population decreases, was expected in the second half of the century[48]. Overall, the AF is projected to rise significantly, especially in southeastern China, where the frequency of heat waves is expected to increase further. Socioeconomic factors such as economic status, healthcare, population density, and urbanization may also play a role, requiring further study. Climate models have consistently projected a substantial increase in extreme heat events over the coming decades, with heat waves expected to become more frequent, prolonged, and intense. This indicates that individuals with CKD experience significantly higher levels of heat exposure, particularly in certain regions of China, leading to increased mortality among patients with kidney disease[14]. The study found that rising temperatures significantly increased mortality among patients with CKD, highlighting the need to strengthen health monitoring and interventions for patients with CKD during hot periods[14]. Enhancing the resilience and adaptive capacity of patients with CKD to extreme heat through education, access to home cooling facilities, and regular hydration is particularly important, especially among vulnerable populations such as older individuals, women, and those living in economically disadvantaged regions.
This study has several strengths. First, it is the first national study to estimate the impact of heat wave exposure on CKD mortality in China. Second, a large-scale dataset covering 2,790 counties/districts across China enabled detailed assessments of regional and population heterogeneity. Third, multiple climate change scenarios were used to project future heat wave–related CKD mortality burdens, thereby offering actionable insights for governments to design targeted adaptation measures. However, this study has several limitations. Based on extensive national data, sparsely populated areas resulted in wide CIs. Additionally, although we projected heat wave–related CKD mortality under three representative climate scenarios, other possible scenarios were not considered. Lastly, our projections assumed a constant association between heat waves and CKD mortality, as well as unchanged CKD mortality rates across provinces in the future, which may introduce bias into our results. Although the case-crossover design controls for some confounding factors, unmeasured residual confounding factors, such as PM2.5 exposure and socioeconomic status, may still exist and bias our results. Owing to the unavailability of indoor temperature data, we did not account for indoor temperature exposure in our study, even though people usually spend most of their time indoors. Our exposure assessment may have introduced bias into the results.
-
This nationwide case-crossover study provides strong evidence linking heat wave exposure to CKD mortality, highlighting the modifying effects of age, sex, occupation, and region. Heat wave–related CKD mortality is projected to increase significantly under moderate and high greenhouse gas emission scenarios. These findings emphasize the critical need for effective climate change adaptation strategies to reduce the health risks posed by global warming.
HTML
Study Design
Data Collection
CKD Mortality Data
Meteorological Data
Other Data
Heat Wave Definition
Statistical Analysis
Association between Heat Waves and CKD Mortality
Current and Future CKD Mortality Burden Associated with Heat waves
Sensitivity Analysis
Basic Characteristics of the Study Sample
Association between Heat Waves and CKD Mortality
Heat Wave–Related CKD Mortality Burden from the Study Sample
Projected CKD Mortality Burden from the 2020s to the 2090s
Sensitivity Analyses
Competing Interests We declare no competing interests.
Ethics This study was approved by the Ethics Committee of Jinan University (JNUKY-2023-0074).
Authors’ Contributions Data collection, analysis, interpretation of results, and drafting of the initial manuscript were contributed by Mengen Guo and Jiangmei Liu. Interpretation of results and manuscript revision were contributed by Jiangmei Liu, Guanhao He, Jianxiong Hu, Peng Yin, Sujuan Chen, Yulin Zhuo, Yi Lin, Jinlei Qi, Tao Liu, and Jinling You. Study design and manuscript revision were contributed by Maigeng Zhou, Fanna Liu, and Wenjun Ma (joint corresponding authors). All authors have read and approved the final manuscript.
Data Sharing All raw data can be requested through collaboration with the Corresponding Author's team (send requests to mawj@gdiph.org.cn), subject to the approval of the data management and all authors. The supplementary materials will be available in www.besjournal.com.
&These authors contributed equally to this work.

 Quick Links
 DownLoad: