
-
Acute mountain sickness (AMS) is a clinical syndrome that occurs upon rapid ascent to high altitudes (HAs) above 2,500 m, and is characterized by a series of nonspecific symptoms, including headache, dizziness, gastrointestinal symptoms, and fatigue[1]. It is typically self-limiting; however, without timely intervention, it may progress to life-threatening conditions such as high-altitude cerebral edema (HACE) or high-altitude pulmonary edema (HAPE)[2]. Epidemiological data reveal that AMS incidence varies from 10–85% at moderate altitudes (2,500–5,500 m)[3]. More than half of individuals suffer from AMS during ascent above 6,000 m[4]. The incidence and severity of AMS depend on altitude, ascent rate, and individual susceptibility[5]. Therefore, screening for susceptible individuals before their ascent is important to prevent AMS development.
As the major physiological stressor at HAs, hypobaric hypoxia may rapidly stimulate the adrenergic system and trigger a series of cardiovascular adaptive responses[6,7]. Upon acute HAs exposure, an increase in cardiac output (CO), secondary to an increase in heart rate (HR), compensates for the reduced arterial oxygen saturation. The association between CO and AMS has been widely studied as a core indicator of biventricular function and a key determinant of tissue oxygen delivery[6,8,9]. However, most studies have focused on CO upon HAs exposure or baseline CO at low altitudes (LAs), and the predictive and screening values are limited. Because elevated CO during stress reflects improved pumping capacity and could serve as an indicator of cardiac reserve, it is unknown whether CO combined with physical stress can better predict AMS.
Exercise stress echocardiography (ESE) can be used to dynamically evaluate cardiac reserve and reveal hidden subclinical limitations in pump function that are undetectable at rest[10]. In clinical populations, exercise-induced hemodynamic changes related to CO have a strong prognostic value[11]. For example, the mean pulmonary artery pressure (mPAP)–CO ratio after exercise independently predicts the outcomes in patients with pulmonary hypertension[12]. Moreover, in patients with heart failure with preserved ejection fraction (HFpEF), a blunted increase in CO during exercise is correlated with a greater risk of hospitalization for heart failure or death[13]. Existing evidence indicates that HAPE-susceptible healthy individuals exhibit impaired pulmonary vascular responses to ESE, which is valuable for assessing cardiac contractile reserve function and pre-ascent screening[14,15]. Exercise-induced changes in CO levels may reflect fundamental cardiovascular stress responses under hypoxic conditions[16]. However, whether changes in CO levels after ESE in healthy individuals are associated with AMS remains unclear.
In the current prospective cohort study, ESE testing was conducted in healthy participants at the LA before they ascended, and its association with the occurrence of AMS after HA exposure was evaluated. These results revealed impaired cardiac responses in patients with AMS, and that ESE could be a tool to identify individuals susceptible to AMS before ascent.
-
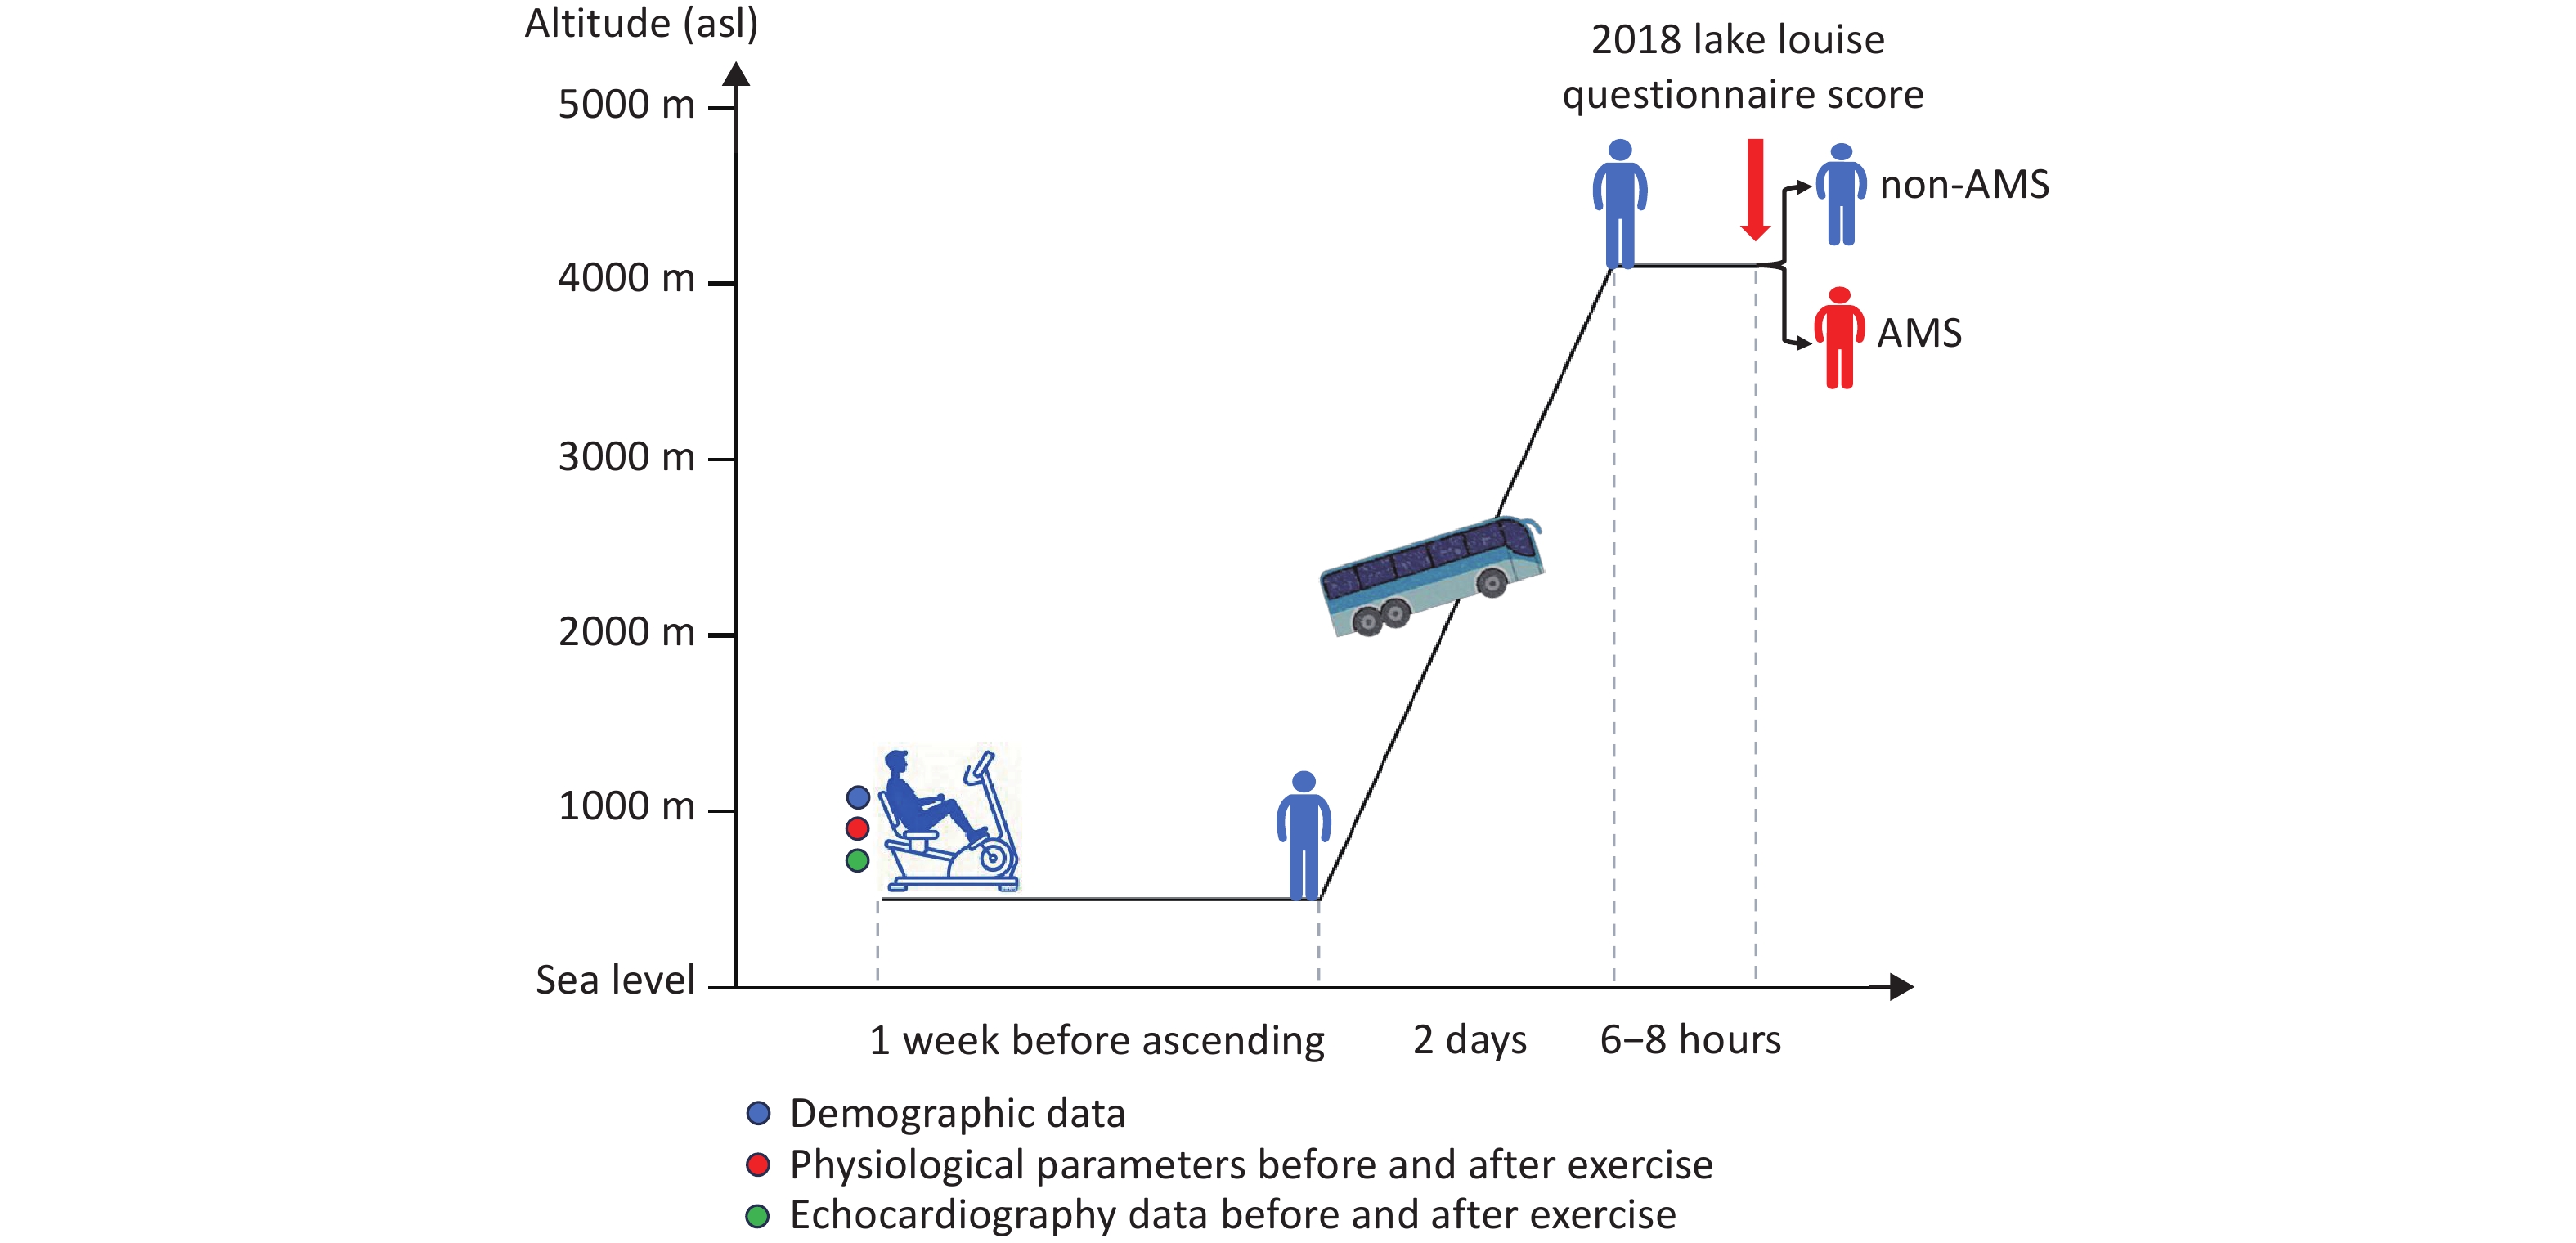
This prospective cohort study was performed in Chengdu (Sichuan, China; 500 m above sea level, ASL) and Litang (Sichuan, China, 4,100 m asl) in June 2019. Demographic data were collected, and ESE was performed in Chengdu uniformly on the same day, seven days before ascent, to ensure that ESE measurements were obtained under the same conditions. All participants ascended from Chengdu to Litang in a single group on the same day by bus, and the journey was completed within two days (Figure 1).
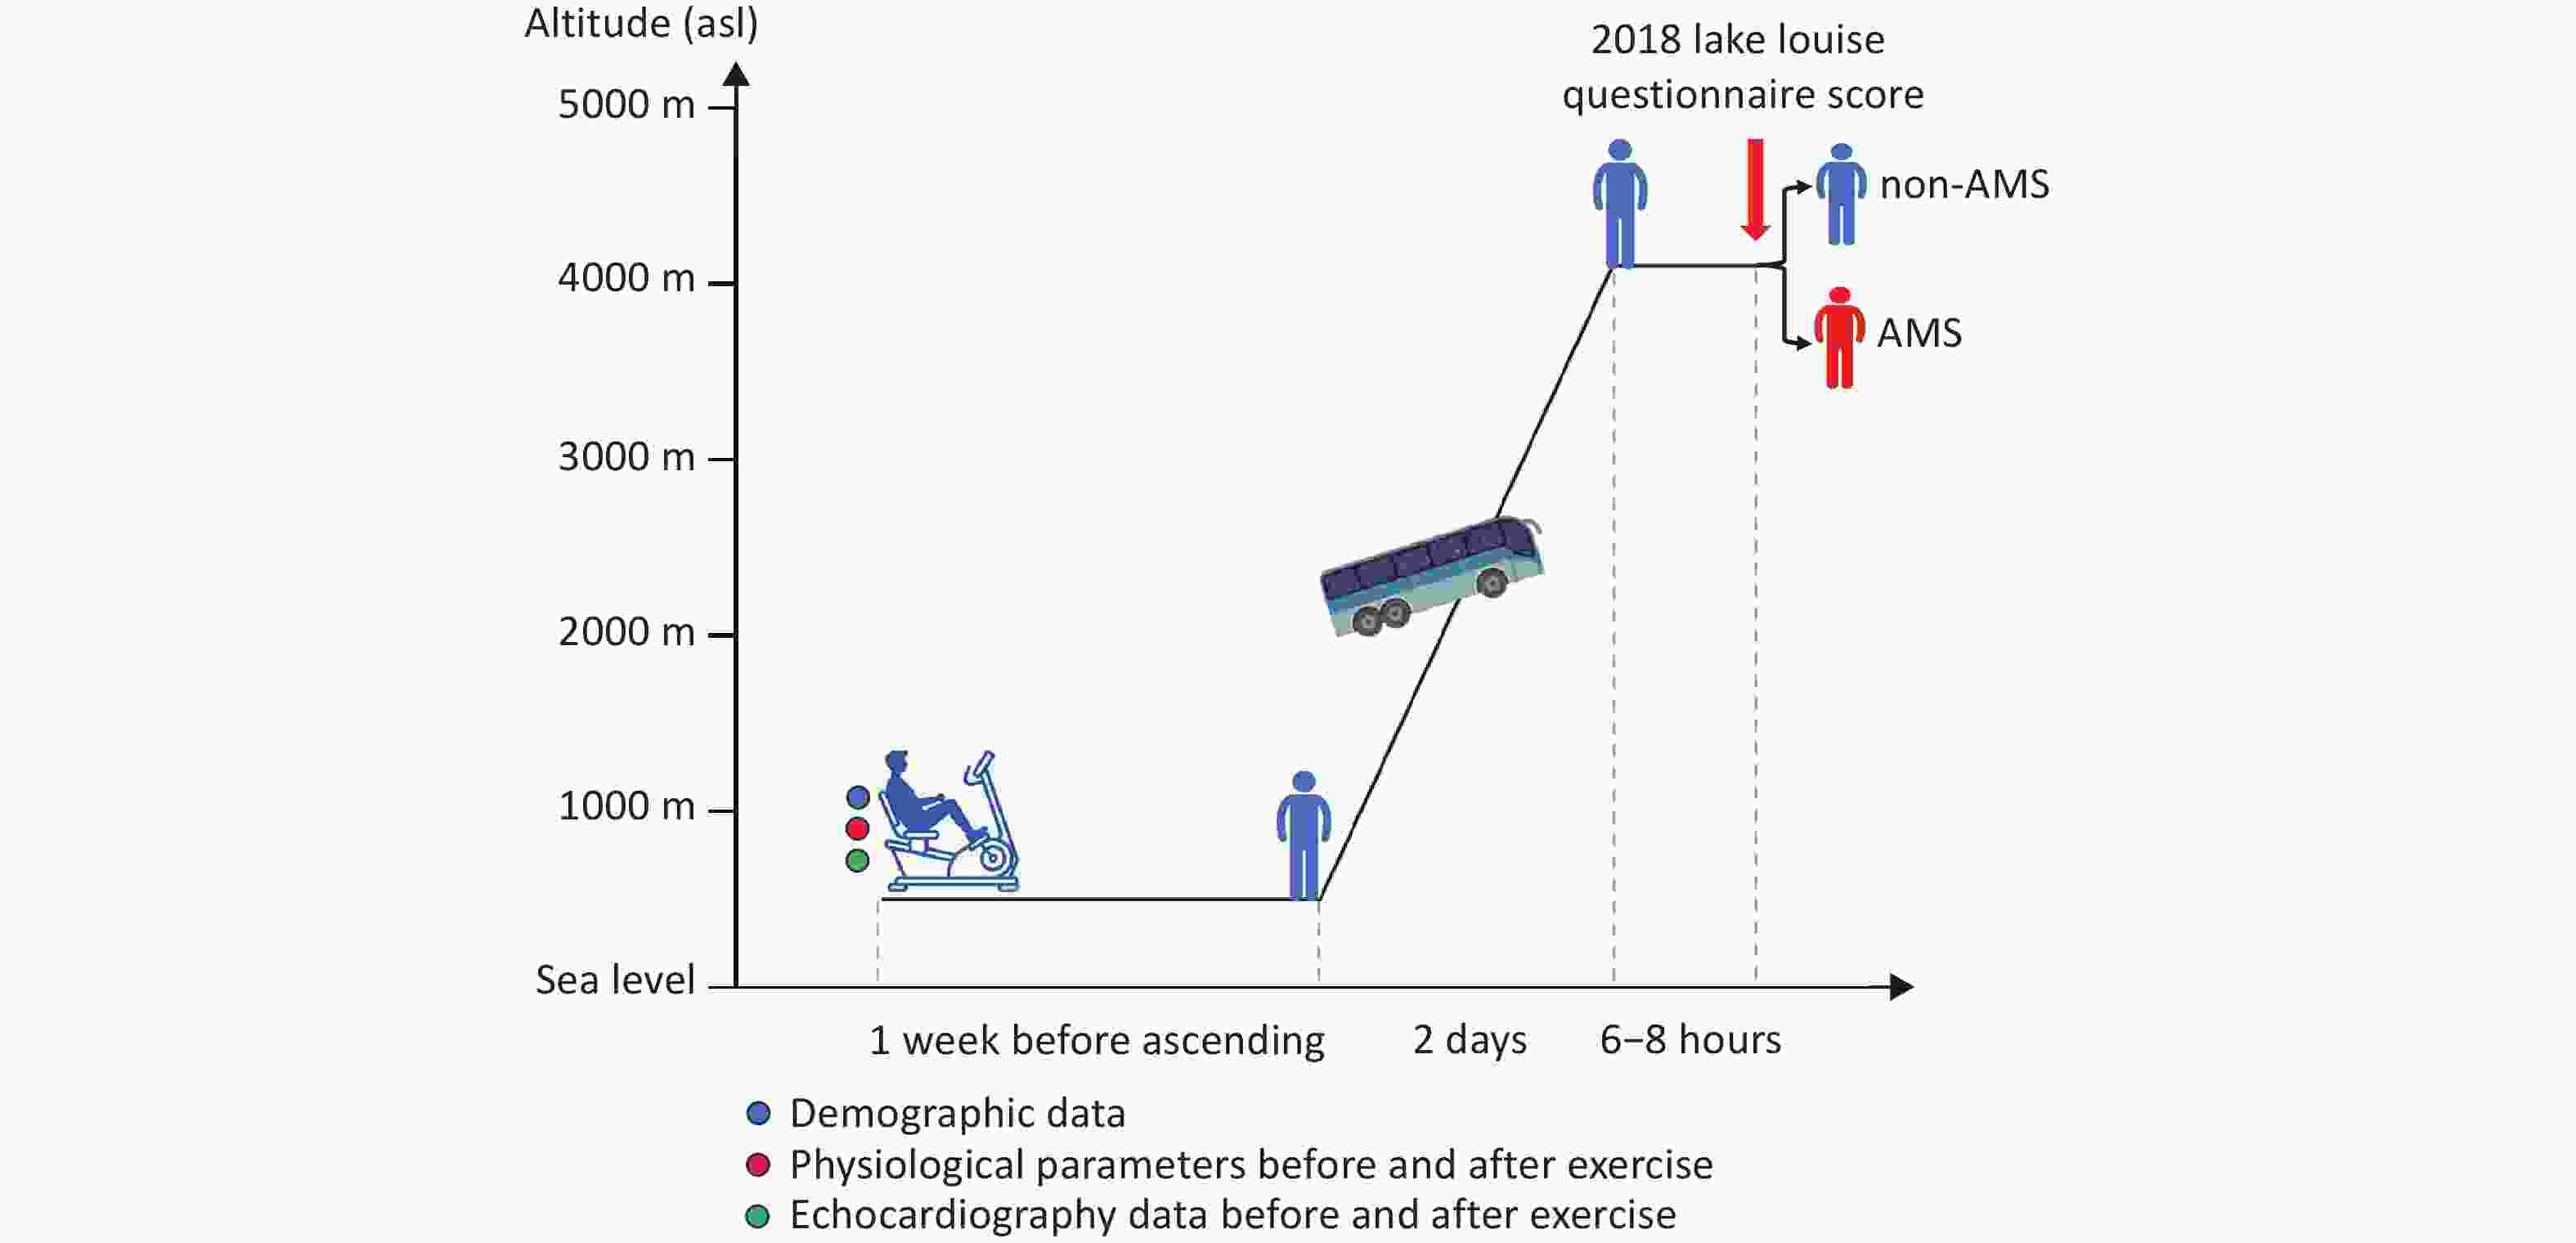
Figure 1. Outline of the study. AMS: acute mountain sickness.
-
The inclusion criteria were healthy Chinese Han adults who were born and permanently residing in LA (≤ 500 m, asl). In total, 111 unrelated volunteers were recruited from Chongqing and underwent physical examinations at Xinqiao Hospital. The exclusion criteria were a history of AMS, a history of high-altitude sojourn (≥ 2,500 m, asl) in the past 6 months, migraine, cardiovascular diseases, respiratory diseases, neurological diseases, hematologic diseases, cerebral vascular diseases, cancer, liver or kidney dysfunction, or long-term usage of any medications for chronic diseases and drugs for preventing AMS. Patients with incomplete data were excluded.
-
Echocardiographic examinations were conducted by two sonographers using a CX50 ultrasound system (Philips Ultrasound System, Andover, MA, US) with the participants in the left lateral decubitus position. Dynamic echocardiographic images were stored digitally for offline analysis using QLAB 10.5 (Philips Healthcare, Andover, MA, United States). During the data collection and analysis phases, the operators were blinded to the participants’ AMS status. The values of each echocardiographic parameter were averaged from measurements of three consecutive cardiac cycles. All examinations and measurements were performed in accordance with the American Society of Echocardiography[17]. The end-diastolic volume (EDV) and end-systolic volume (ESV) of the left ventricle (LV) were measured to determine the stroke volume (SV = EDV - ESV), CO = (SV * HR), and LV ejection fraction [LVEF = (EDV - ESV) / EDV * 100] as previously described[18]. Diastolic function was measured using mitral or tricuspid pulse-wave Doppler inflow, recording the early (E) and late (A) peak diastolic velocities. Tissue Doppler imaging was used to measure myocardial velocity, including early diastolic velocity (E’). Left atrial pressure (LAP) was estimated as follows: LAP = 1.9 + 1.24 * E / E’. Right ventricular (RV) systolic function was quantified by end-systolic area (ESA) and end-diastolic area (EDA) measurements from an RV-focused apical view, with fractional area change (FAC) calculated as FAC = (EDA - ESA) / EDA * 100. Pulmonary hemodynamics were assessed using pulsed-wave Doppler of the pulmonary artery to measure acceleration time (AT). The mPAP was calculated using validated formulas: mPAP = 79 - (0.45 * AT) for AT > 120 ms, and mPAP = 90 - (0.62 * AT) for AT ≤ 120 ms. Additionally, the systolic pulmonary arterial pressure (SPAP) was derived from the peak velocity of tricuspid regurgitation (TRV) via the modified Bernoulli equation (TRV in m/s): SPAP = 4 * TRV2 + 5. Tricuspid annular plane systolic excursion (TAPSE) was measured using M-mode echocardiography by tracking the peak excursion of the lateral tricuspid annulus. Speckle-tracking echocardiography was used to accurately determine LV and RV global longitudinal strains (GLSs).
-
A semi-supine bicycle ergometer (Ergoline 900EL, Ergoline Company, Germany), set with an approximate 30° leftward rotation, was used to perform the ESE[19]. The protocol was as follows: first, baseline echocardiography was performed with the participant in the left lateral decubitus position; second, the participant performed exercise on a semi-supine bicycle ergometer; third, to ensure optimal image quality, the participant moved from the bicycle to the examination table and assumed the left lateral decubitus position within 60 s after exercise for the immediate acquisition of the post-exercise echocardiography. The exercise session consisted of a 3-min warm-up period with no resistance, a 3-min initial exercise phase at a 25 W workload, and a 3-min maintenance exercise phase at a 50 W workload. Echocardiographic images, blood pressure (BP), and pulse oxygen saturation (SpO2) were recorded before and within 60 seconds after exercise. The BP and SpO2 were recorded using an electronic sphygmomanometer (Omron HEM-6200, Japan) and a pulse oximeter (Nonin ONYX OR9500, USA), respectively. The average of the 3 measurements was used for data analysis. Echocardiographic images were analyzed by two cardiologists who were blinded to the AMS status after the completion of the study.
-
AMS was assessed using the latest Lake Louise Questionnaire score (LLQS) within 6–8 hours after arrival at 4,100 m. The questionnaires were completed with the assistance of experienced doctors to minimize interference from subjective factors. Four AMS symptoms were assessed: headache, dizziness, light-headedness, gastrointestinal symptoms, and fatigue. Each item’s score ranged from 0–3, with 0 indicating no symptoms and 1–3 indicating mild, moderate, and severe symptoms. When the LLQS was ≥ 3 and headache was present as a core symptom, the participants were diagnosed with AMS. The severity of AMS was graded as mild (score 3–5), moderate (score 6–9), or severe (score 10–12).
-
SPSS 27.0 (Chicago, IL, USA) was used to perform the statistical analyses. Continuous variables were expressed as the mean ± standard deviation or median (25th–75th percentiles) according to the normality results following the Kolmogorov‒Smirnov test. Categorical variables are expressed as counts and percentages. The characteristics between the AMS and non-AMS groups were compared using Student’s t-test, Welch’s test, Mann-Whitney U test, chi-square test, or Fisher’s exact test, as appropriate. Univariate logistic regression analysis was performed to evaluate potential factors associated with AMS. Multivariate logistic regression analysis was conducted (variables with P values < 0.1 in univariable logistic regression for entry), and the lambda method was used for stepwise backward analysis to identify independent risk factors for AMS. One-way ANOVA was used to compare whether significant differences existed among the groups divided by the quartiles of the change rate of CO during exercise and the severity of AMS. The P for the trend was determined using logistic regression analysis to assess the predictive value of the change rate of CO after exercise across the four groups. A two-sided P < 0.05 was considered statistically significant.
-
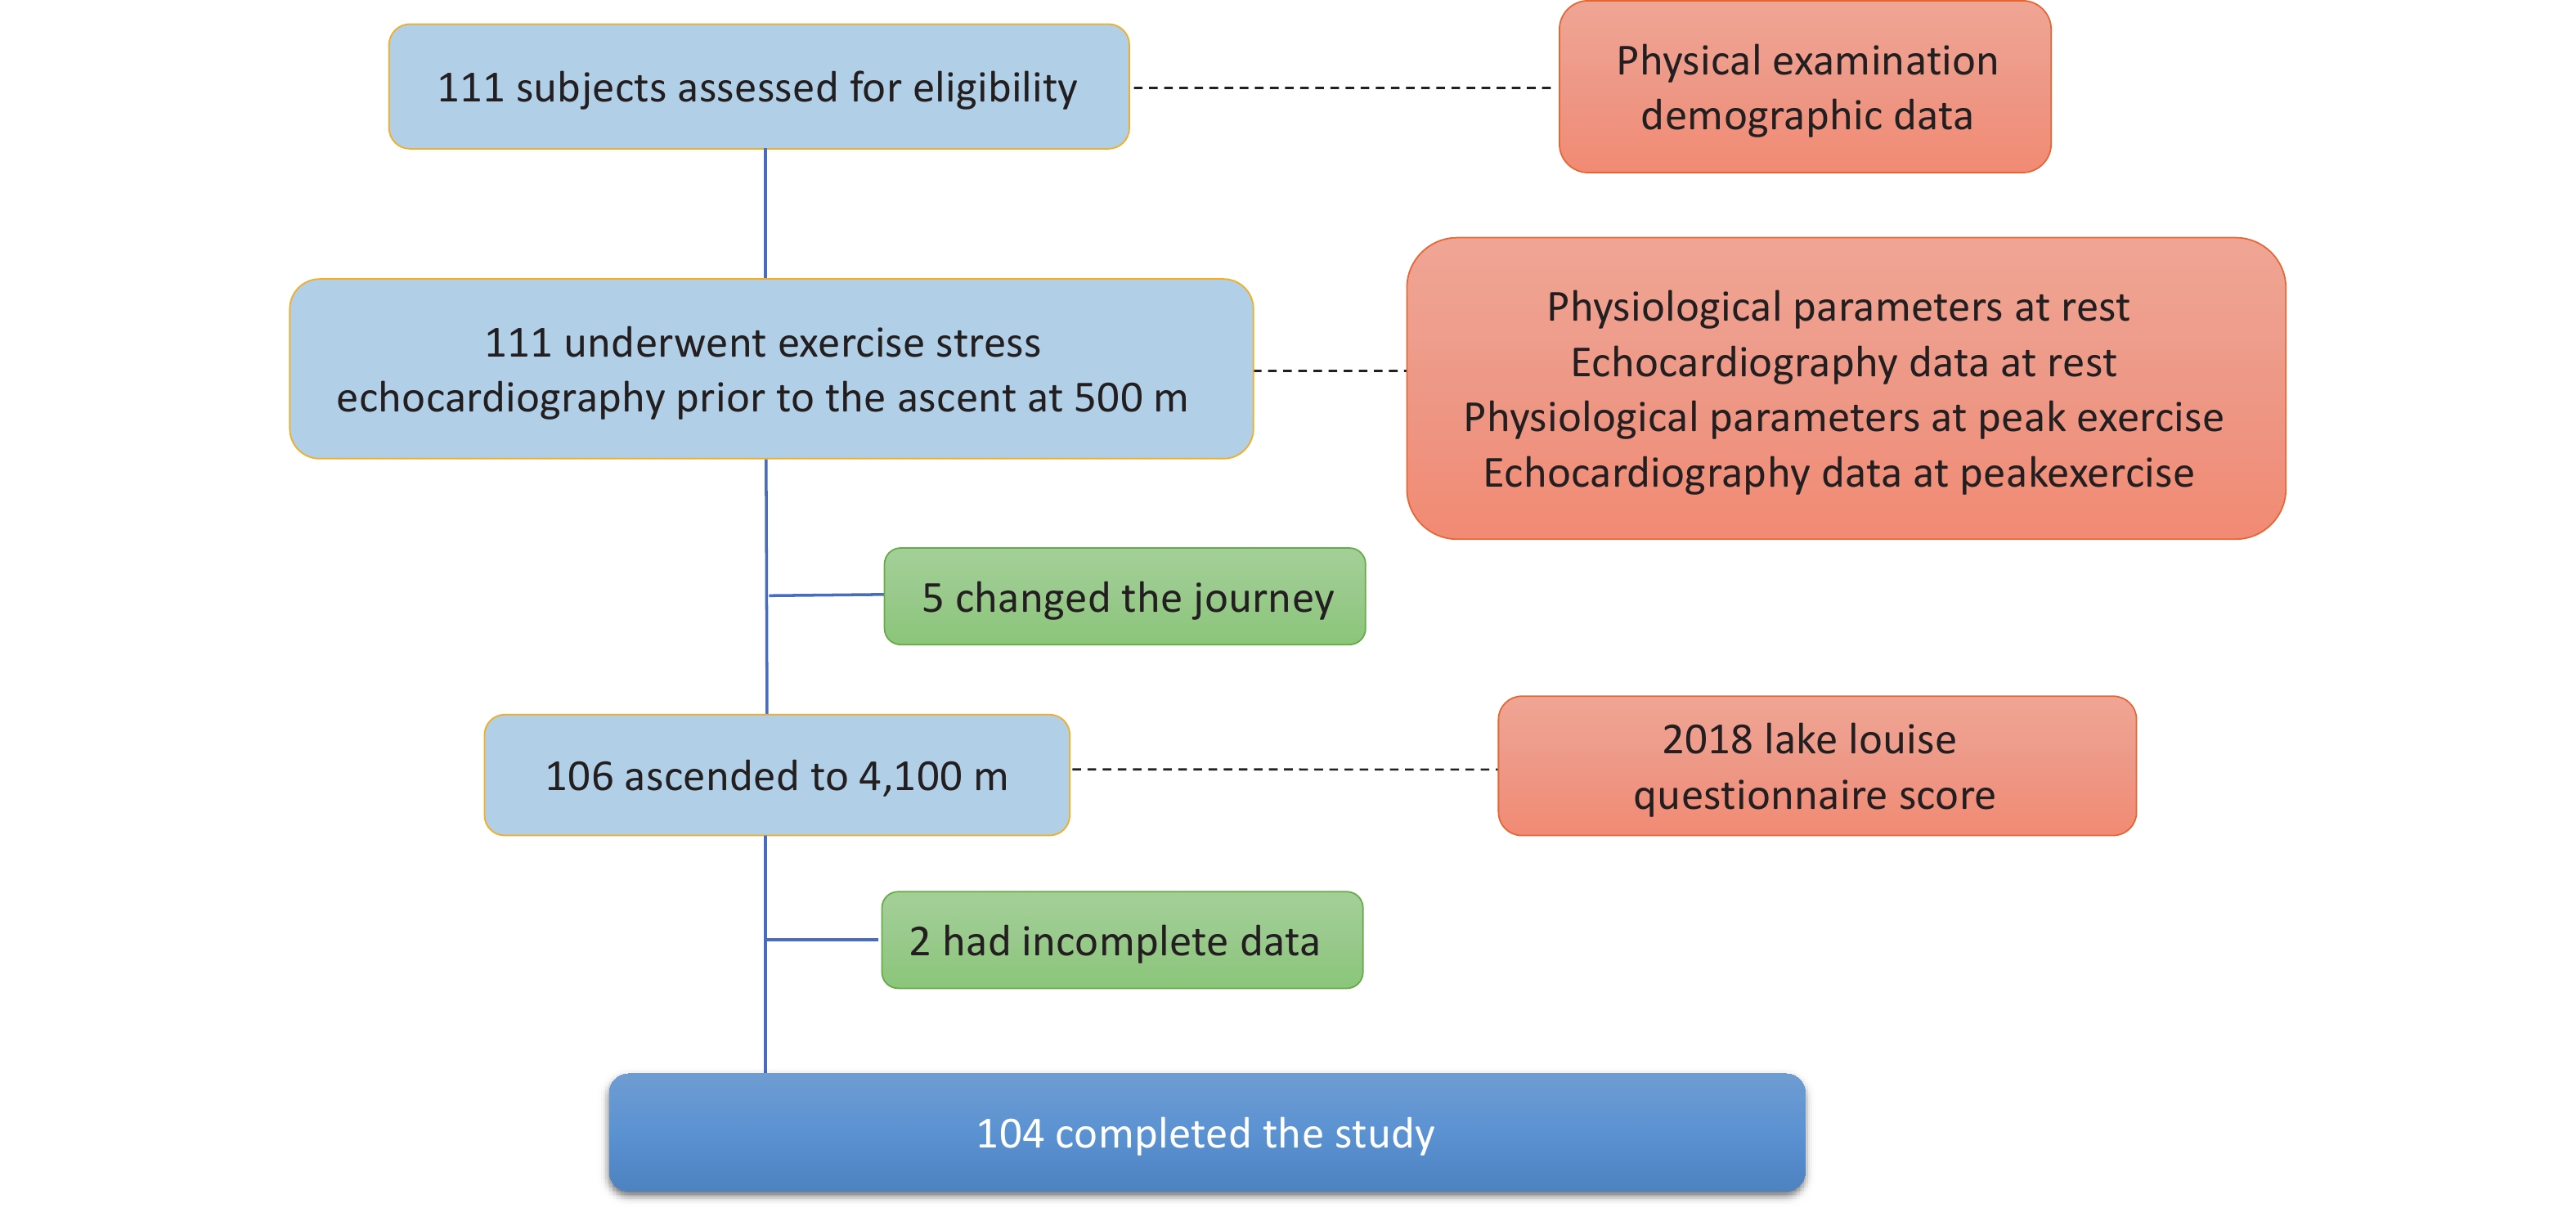
Overall, 111 healthy adult individuals were invited to participate; five changed their ascent plans owing to conflicting work arrangements and failed to arrive at the pre-planned altitude, and two had incomplete data owing to poor-quality echocardiography images (Figure 2). Among the 104 participants included in the final data analysis, 49 (47.1%) were diagnosed with AMS according to the LLQS (Table 1). None of the patients developed HACE or HAPE. Participants with and without AMS were comparable in terms of age and BMI; however, the AMS group had a significantly greater proportion of females (P < 0.001) and a lower percentage of smokers (P = 0.002).

Figure 2. Flowchart of the study.
Variables Baseline Exercise Change rate AMS group non-AMS group P value AMS group non-AMS group P value AMS group non-AMS group P value Age, y 25
(22 to 29)25
(21 to 29)0.699 The same as baseline Females, n (%) 23
(46.94)9
(16.36)< 0.001 BMI, kg/m2 21.93 ± 2.72 22.53 ± 2.23 0.222 Smokers, n (%) 11
(22.45)29
(52.73)0.002 HR, beats/
min76.92 ± 10.85 69.49 ± 10.27 < 0.001 100
(95 to 109)97
(91 to 105)0.243 33.40 ± 18.88 44.97 ± 19.64 0.003 SpO2, % 98
(96 to 98)97
(96 to 98)0.206 97
(96 to 98)97
(96 to 98)0.166 −1.01
(−1.53 to 1.03)1.02
(−1.02 to 1.05)0.033 SBP, mmHg 115
(107 to 125)120
(109 to 128)0.250 123.65 ± 12.21 124.13 ± 12.85 0.848 7.14 ± 13.03 5.27 ± 12.71 0.460 DBP, mmHg 74.29 ± 12.00 73.38 ± 11.05 0.688 75.47 ± 11.20 73.55 ± 12.14 0.405 3.69 ± 20.20 1.82 ± 18.39 0.622 CO, mL/min 3.47 ± 0.67 3.37 ± 0.69 0.479 4.27 ± 0.71 4.94 ± 0.93 < 0.001 26.47 ± 27.07 51.05 ± 37.20 < 0.001 SV, mL 45.27 ± 7.09 49.03 ± 9.66 0.027 42.71 ± 7.76 49.94 ± 9.00 < 0.001 −4.91 ± 14.40 3.60 ± 18.65 0.011 LAP, mmHg 10.05 ± 1.60 10.11 ± 1.66 0.850 9.92 ± 1.93 10.00 ± 2.16 0.835 −1.32
(−11.58 to 8.78)0.54
(−13.79 to 9.38)0.837 LVEF, % 55.48 ± 4.87 55.90 ± 4.74 0.657 53.73 ± 5.93 55.73 ± 4.61 0.057 −2.74 ± 11.44 0.31 ± 11.11 0.172 MV E/A 1.73
(1.43 to 2.20)1.69
(1.56 to 2.14)0.529 1.73 ± 0.53 1.76 ± 0.43 0.708 −3.08 ± 22.67 −3.06 ± 20.78 0.558 MV E/E' 6.57 ± 1.29 6.62 ± 1.34 0.850 6.47 ± 1.55 6.53 ± 1.74 0.835 −1.80
(−14.03 to 11.19)0.66
(−16.94 to 11.78)0.822 LVGLS, % 20.53 ± 1.74 20.94 ± 1.72 0.227 19.92 ± 2.33 20.71 ± 1.92 0.063 −4.09
(−9.48 to 3.70)−0.79
(−5.39 to 5.63)0.196 FAC, % 46.32 ± 4.68 46.74 ± 6.34 0.697 44.39 ± 4.82 43.73 ± 5.59 0.524 −4.38
(−11.44 to −0.64)−6.47
(−12.94 to −2.10)0.203 TV E/A 1.79 ± 0.55 1.96 ± 0.59 0.131 1.88 ± 0.52 1.89 ± 0.46 0.950 8.85 ± 28.07 1.07 ± 24.85 0.137 TV E/E' 4.75 ± 0.95 5.08 ± 1.75 0.236 4.91 ± 1.08 5.07 ± 1.12 0.452 5.29 ± 28.58 6.64 ± 39.74 0.842 TAPSE, mm 25.34 ± 3.46 26.60 ± 4.81 0.131 25.00
(24.19 to 27.06)25.45
(23.33 to 27.92)0.899 3.59 ± 17.17 −0.74 ± 15.87 0.185 RVGLS, % 22.07 ± 3.61 21.54 ± 3.45 0.440 22.97
(20.55 to 24.64)21.75
(20.57 to 24.30)0.236 4.41
(−6.26 to 15.06)1.27
(−9.58 to 13.07)0.517 mPAP, mmHg 15.19
(8.72 to 18.21)15.18
(8.30 to 18.68)0.971 16.40 ± 7.31 15.87 ± 6.75 0.702 20.98
(−13.88 to 68.21)14.75
(−12.10 to 35.10)0.513 SPAP, mmHg 13.80 ± 6.54 15.75 ± 7.70 0.170 12.81
(7.94 to 19.13)14.86
(8.98 to 20.59)0.298 0.00
(−9.31 to 12.98)0.00
(−12.25 to 11.29)0.940 TRV, m/s 1.54
(0.93 to 1.84)1.57
(1.02 to 2.10)0.230 1.40
(0.86 to 1.88)1.57
(1.00 to 1.97)0.298 0.00
(−8.38 to 11.37)0.00
(8.91 to 9.04)0.951 PAAT, ms 142.55 ± 15.29 142.08 ± 16.05 0.880 135.62
(117.22 to 150.64)138.48
(120.03 to 152.23)0.662 −5.13 ± 15.58 −3.59 ± 13.59 0.592 Note. Continuous data are expressed as mean ± standard deviation or median (25th, 75th percentile), and categorical data are represented as counts and percentages. AMS: acute mountain sickness, BMI: body mass index, HR: heart rate, SpO2: pulse oxygen saturation, SBP: systolic blood pressure, DBP: diastolic blood pressure, CO: cardiac output, SV: stroke volume, LAP: left atrial pressure, LVEF: left ventricular ejection fraction, MV: mitral valve, E: peak flow velocity of the early filling wave, A: peak flow velocity of late filling wave, E’: early diastolic velocity at the mitral or tricuspid annular, LVGLS: left ventricle global longitudinal strain, FAC: right ventricular fractional area of change, TV: tricuspid valve, TAPSE: tricuspid annular plane systolic excursion, RVGLS: right ventricle global longitudinal strain, mPAP: mean pulmonary artery pressure, SPAP: systolic pulmonary artery pressure, TRV: peak systolic velocity of tricuspid regurgitation flow, PAAT: pulmonary artery acceleration time. Table 1. Demographic, physiological, and stress echocardiography parameters among participants
-
No significant differences were observed in SpO2, BP, or any other echocardiographic parameters between the two groups (P > 0.05), except for a lower SV (P = 0.027) and a higher HR (P < 0.001; Table 1) at baseline in the AMS group.
-
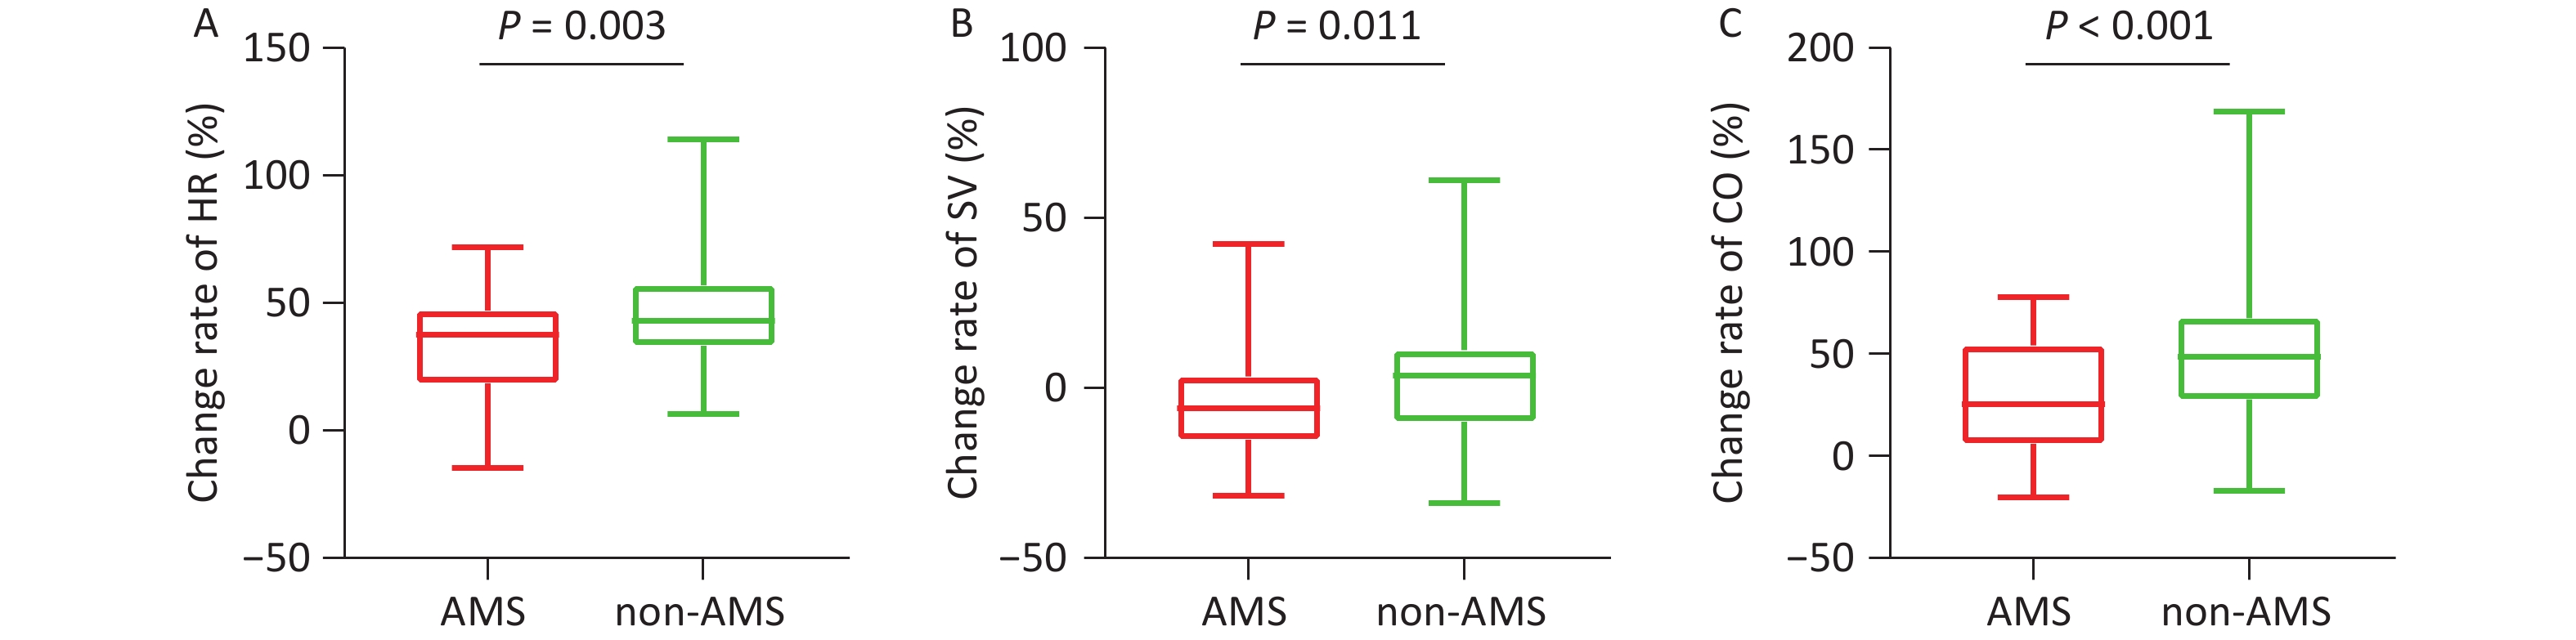
During exercise, although the absolute values did not differ between the two groups, the rates of change in HR (P = 0.003, Table 1, Figure 3A) and SpO2 (P = 0.003) were significantly attenuated in the AMS group. Both the absolute value of SV (42.71 ± 7.76 mL vs. 49.94 ± 9.00 mL, P < 0.001) at rest and its change rate (-4.91% ± 14.40% vs. 3.60% ± 18.65%, P = 0.011) (Table 1, Figure 3B) during exercise were lower in the AMS group. Similarly, both the absolute value of CO (4.27 ± 0.71 mL/min vs. 4.94 ± 0.93 mL/min, P < 0.001) and its change rate (26.47% ± 27.07% vs. 51.05% ± 37.20%, P < 0.001) during exercise were significantly lower in the AMS group (Table 1, Figure 3C). No significant differences were observed in any other echocardiographic parameters between the two groups (P > 0.05, Table 1).
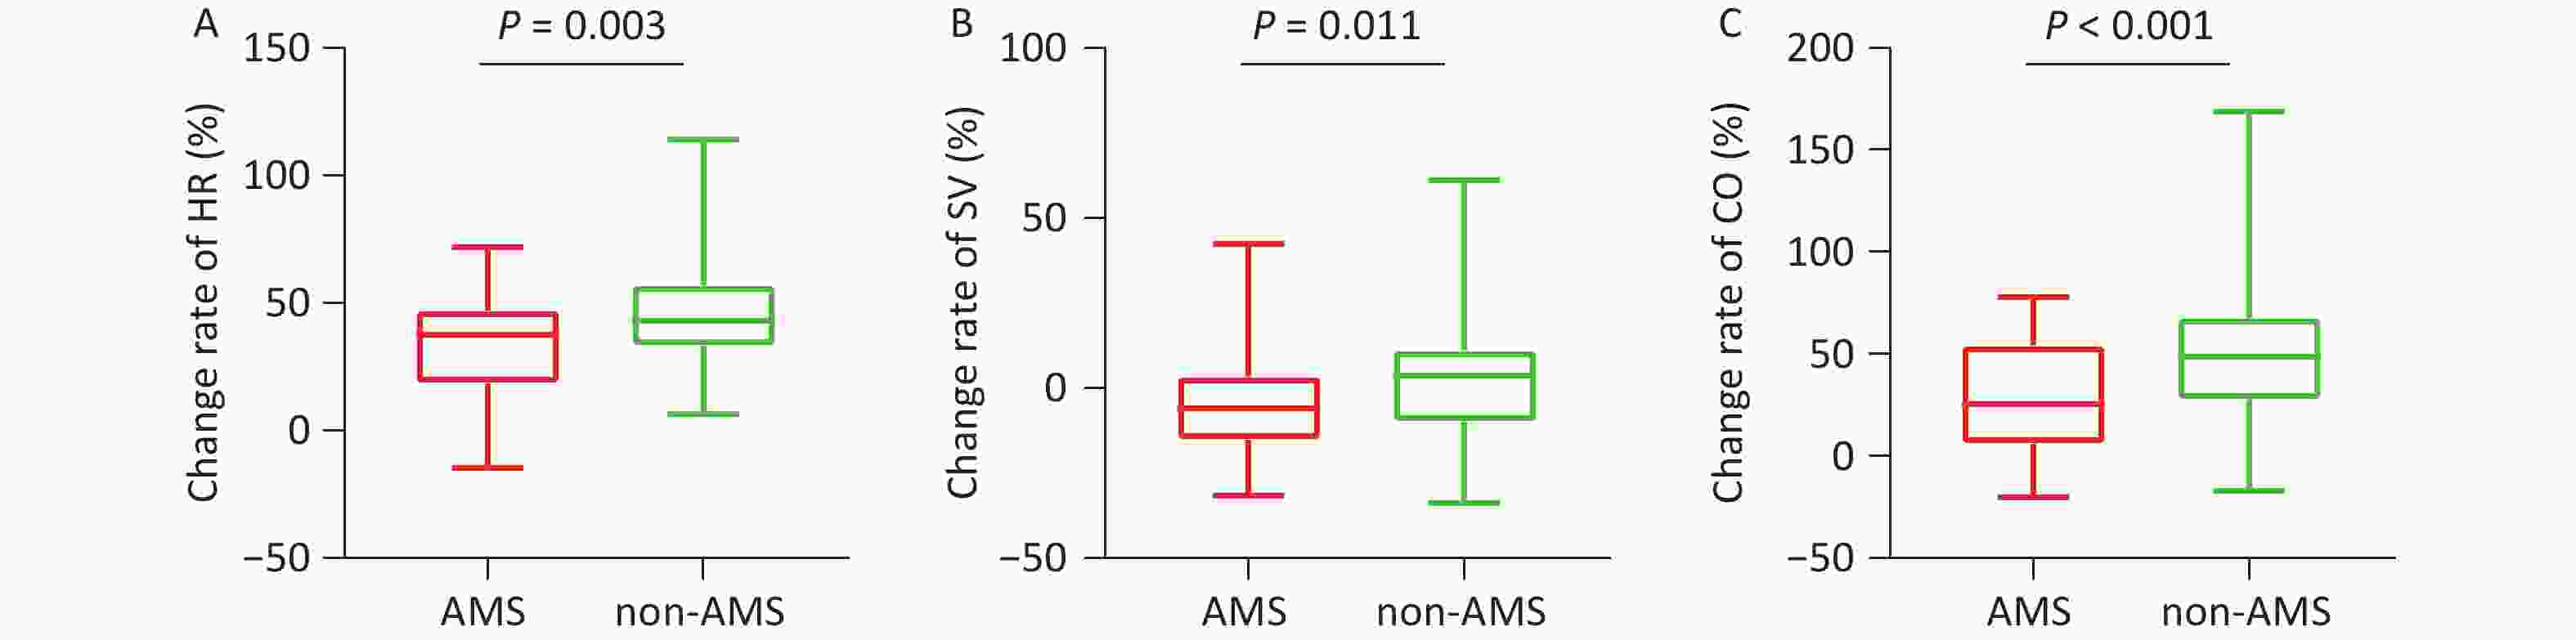
Figure 3. The change rates of HR, SV, and CO in AMS and non-AMS groups. HR: heart rate, SV: stroke volume, CO: cardiac output, AMS: acute mountain sickness.
-
Univariate analysis revealed that female sex (OR = 4.52, 95% CI 1.82–12.21, P = 0.001), smoking status (OR = 0.26, 95% CI 0.11–0.61, P = 0.002), and the change rates of HR (OR = 0.97, 95% CI 0.95–0.99, P = 0.005), CO (OR = 0.98, 95% CI 0.96–0.99, P < 0.001) and SV (OR = 0.97, 95% CI 0.94–0.99, P = 0.015) during exercise were associated with the risk of AMS. Multivariate regression revealed that female sex (OR = 3.17, 95% CI 1.06–9.48, P = 0.039) and the rate of change in CO during exercise at the LA (OR = 0.98, 95% CI 0.96–0.99, P = 0.001) were independent factors associated with AMS incidence after HA exposure (Table 2).
Variables Univariate analyses Multivariate analyses OR (95% CI) P value OR (95% CI) P value Age, y 1.02 (0.97–1.07) 0.540 Not selected Females, n (%) 4.52 (1.82–12.21) 0.001 3.17 (1.06–9.48) 0.039 BMI, kg/m2 0.91 (0.77–1.06) 0.221 Not selected Smokers, n (%) 0.26 (0.11–0.61) 0.002 — HR, beats/min 0.97 (0.95–0.99) 0.005 Not selected SpO2, % 0.85 (0.70–1.04) 0.107 Not selected SBP, mmHg 1.01 (0.98–1.04) 0.457 Not selected DBP, mmHg 1.01 (0.99–1.03) 0.619 Not selected CO, mL/min 0.98 (0.96–0.99) < 0.001 0.98 (0.96–0.99) 0.001 SV, mL 0.97 (0.94–0.99) 0.015 Not selected LAP, mmHg 1.00 (0.99–1.02) 0.725 Not selected LVEF, % 0.98 (0.94–1.01) 0.173 Not selected MV E/A 1.00 (0.98–1.02) 0.996 Not selected MV E/E' 1.00 (0.99–1.02) 0.676 Not selected LVGLS, % 0.99 (0.96–1.02) 0.405 Not selected FAC, % 1.01 (0.98–1.05) 0.430 Not selected TV E/A 1.01 (1.00–1.03) 0.138 Not selected TV E/E' 1.00 (0.99–1.01) 0.843 Not selected TAPSE, mm 1.02 (0.99–1.04) 0.185 Not selected RVGLS, % 1.00 (0.98–1.02) 0.997 Not selected TRV, m/s 1.00 (0.99–1.02) 0.984 Not selected mPAP, mmHg 1.00 (1.00–1.01) 0.430 Not selected SPAP, mmHg 1.00 (0.99–1.01) 0.999 Not selected PAAT, ms 0.99 (0.97–1.02) 0.589 Not selected Note. OR: odds ratio, 95% CI: 95% confidence interval. Abbreviations are presented in Table 1. Table 2. Univariate and multivariate regression analyses for the change rates during exercise associated with AMS
-
The participants were divided into four groups according to the quartiles of the rate of change in CO during exercise for logistic regression. Group 4 served as the reference group and presented the greatest percentage change in CO during the exercise. According to the unadjusted model, participants in Group 1 were more prone to develop AMS (OR = 6.11, 95% CI 1.84–20.32, P for trend = 0.019). Further analysis revealed that, compared with that in Group 4, the AMS incidence was greater in Group 1 after adjusting for Model 1 (OR = 7.04, 95% CI 1.89–26.18, P for trend = 0.024), Model 2 (OR = 7.04, 95% CI 1.89–26.18, P for trend = 0.024) and Model 3 (OR = 9.73, 95% CI 2.43–39.00, P for trend = 0.011) (Table 3).
Variables Group 1 Group 2 Group 3 Group 4 P for trend AMS (%) 69.23 53.85 38.46 26.92 Median (%) −2.11 27.71 53.33 77.29 Model 0 6.11 (1.84–20.32) 3.17 (0.99–10.10) 1.70 (0.53–5.48) 1 (reference) 0.019 Model 1 7.04 (1.89–26.18) 4.80 (1.30–17.80) 3.00 (0.80–11.23) 1 (reference) 0.024 Model 2 7.04 (1.89–26.18) 4.80 (1.30–17.80) 3.00 (0.80–11.23) 1 (reference) 0.024 Model 3 9.73 (2.43–39.00) 4.36 (1.19–16.00) 2.17 (0.59–8.07) 1 (reference) 0.011 Note. Model 0: unadjusted; Model 1: adjusted by age, gender, BMI, smoking status; Model 2: adjusted by Model 1 plus change rates of SBP, DBP, and SpO2; Model 3: adjusted by Model 2 plus change rates of LVEF, MV E/E’, LVGLS, RVGLS, and TAPSE. Abbreviations are presented in Table 1. Table 3. The incidence of AMS according to the change rate of CO during exercise
No patients with severe AMS were diagnosed in this study. A clinically relevant trend was found: the moderate AMS group demonstrated the lowest CO augmentation after exercise, followed by the mild AMS group, whereas the non-AMS group showed the highest rate of change. However, the difference between these groups was not statistically significant (P = 0.132; Table 4).
Variable Non-AMS Mild AMS Moderate AMS P value Change rate of CO, % 43.94 ± 35.54 37.51 ± 34.35 14.61 ± 24.56 0.132 Note. AMS: acute mountain sickness, CO: cardiac output. Table 4. The change rates of CO during exercise according to the severity of AMS
Although the change rate of CO during exercise did not show a statistically significant association with headache, dizziness/light-headedness, or fatigue, it was significantly lower in participants with gastrointestinal symptoms than in those without (20.86% ± 36.52% vs. 44.18% ± 33.09%, P = 0.006, Table 5).
Variable Headache Dizziness/Light-headedness Gastrointestinal Symptoms Fatigue Yes No P value Yes No P value Yes No P value Yes No P value Change rate
of CO, %39.33 ±
36.7839.74 ±
31.240.956 38.30 ±
35.6240.83 ±
34.390.715 20.86 ±
36.5244.18 ±
33.090.006 36.96 ±
35.6445.11 ±
33.080.274 Note. AMS: acute mountain sickness, CO: cardiac output. Table 5. Association between the change rate of CO and AMS-related symptoms
-
As shown in Supplementary Table S1, compared to males, females were younger, had lower BMI, and a smaller proportion of smokers (P < 0.001 for all). Moreover, females consistently demonstrated significantly higher levels of SpO2, LVEF, MV E/A, LVGLS, RVGLS, and PAAT and lower SBP and mPAP at rest (P < 0.05). This pattern persisted during exercise, with the addition of a higher TV E/A in females (P = 0.001). No significant difference was found in the change rates during exercise between males and females (P > 0.05).
-
In this prospective cohort study, 104 participants underwent ESE at the LA before HA exposure. Following ascent, 49 participants developed AMS. Baseline analysis revealed that the participants with AMS exhibited a higher HR and lower SV than the non-AMS participants. During exercise, participants with AMS demonstrated attenuated augmentation rates of HR, CO, and SV, along with a more pronounced decrease in SpO2. Multivariate analysis revealed that female sex and reduced CO augmentation rates during exercise at the LA were independent risk factors for AMS. Notably, participants in the lowest quartile of CO augmentation rate had significantly greater AMS susceptibility than those in the highest quartile. These findings suggest that impaired CO augmentation at the LA during exercise may serve as a predictive marker of AMS risk.
-
Individuals without AMS exhibit increased HR and SV during exercise, enabling CO to closely match metabolic demands. This response reflects integrated cardiovascular adaptations, including preload, contractility, afterload, and cardiopulmonary coupling. First, enhanced venous return from skeletal muscle contraction elevates ventricular preload, increasing EDV, and augmenting SV via the Frank-Starling mechanism[20]. Simultaneously, sympathetic activation triggers catecholamine release, accelerates the HR, and enhances myocardial contractility[20]. Our data confirmed these adaptations, with participants without AMS showing greater CO, HR, and SV elevations during exercise. Moreover, exercise-induced vasodilation induced by adenosine and nitric oxide release decreases peripheral arterial tone and reduces ventricular afterload[12]. Healthy individuals maintain normal cardiopulmonary coupling and reduce pulmonary vascular resistance during exercise[14].
In contrast, participants with AMS displayed blunted CO augmentation during exercise at the LA. Changes in the HR and SV during exercise may explain the impaired CO response. Participants with AMS displayed a higher baseline HR, but the inadequate HR increased during exercise. Due to the shortening of the diastolic period, participants with a higher baseline HR had lower ventricular filling at sea level, as described previously[21]. Hypoxia further attenuated the maximal HR or HR reserve, explaining why participants with a higher baseline HR showed less increase in HR during exercise than those with a lower baseline HR[22]. Moreover, individuals with lower HR at the LA typically exhibit greater heart rate variability, which may enable better autonomic regulation to buffer the stress of HAs exposure[23]. Consistent with previous studies, our data demonstrated that a higher baseline HR and lower HR during exercise may contribute to an attenuated CO increase, further leading to greater susceptibility to AMS.
In the present study, compared to individuals without AMS, participants with AMS presented with lower SV both at rest and during exercise. These findings align with those of a previous study reporting that healthy volunteers experienced significant SV decreases after a rapid ascent to 4,559 m[24]. Although the mechanisms underlying SV reduction after HAs exposure require further investigation, the primary drivers are hemodynamic remodeling caused by a reduction in LV passive filling and an increase in PAP induced by hypoxic pulmonary vasoconstriction[24,25]. Moreover, diminished SV may compromise cerebral oxygen delivery, potentially triggering AMS symptoms such as headache and fatigue. Previous studies support this hypothesis, demonstrating that post-exercise SV and cerebral oxygenation reduction can predict AMS risk[26]. Consistent with these observations, our data suggest that lower baseline SV and attenuated SV change rates contribute to blunted CO augmentation during exercise, thereby increasing the susceptibility to AMS.
-
Acute HAs exposure triggers sympathetic activation, leading to a marked increase in HR and CO during rest and submaximal exercise[6,27]. This compensatory increase in CO is crucial for mitigating the reduced arterial oxygen content. However, SV may exhibit a slight decrease, primarily attributable to impaired left ventricular filling secondary to increased right ventricular afterload from hypoxic pulmonary vasoconstriction[28], which leads to a significant and rapid elevation in PAP[29]. The integrated cardiopulmonary response to acute HAs exposure aims to preserve the systemic oxygen delivery. The inability of the cardiovascular system to effectively meet tissue oxygen demand is considered a key link in the pathogenesis of AMS. Exercise testing effectively simulates the physiological stress encountered in HAs, revealing a cardiovascular insufficiency that may remain undetectable at rest.
ESE may serve as a novel tool for assessing AMS risk. Yi et al. conducted ESE in 20 AMS-susceptible individuals and 20 control participants before their ascent and found an association of RV, pulmonary pressure, and the central venous system with AMS vulnerability[30]. This study enrolled a larger sample size, comprising 104 participants, and focused on the association between the CO response during ESE and AMS. CO during exercise may increase up to five-fold in untrained individuals and eight-fold in professional athletes[31], demonstrating remarkable cardiac reserve function. In contrast, impaired CO responses to exercise have been found in patients with HFpEF[13], which are predominantly related to a reduction in peak maximal oxygen uptake (VO2max). Our data revealed a significant association between attenuated exercise-induced CO augmentation at the LA and an increased AMS incidence and AMS-related gastrointestinal symptoms. The gastrointestinal mucosa is highly vascularized and extremely sensitive to ischemia and hypoxia[32]. In HA environments, to ensure blood supply to core organs such as the heart and brain, the body reduces perfusion in the gastrointestinal tract[33]. Individuals with an insufficient increase in CO levels may have impaired cardiovascular compensatory capacity that fails to meet the body's elevated demand for oxygen delivery, thereby leading to more pronounced gastrointestinal symptoms. Although the association between CO augmentation and AMS severity was not statistically significant, this trend supports a graded relationship between AMS severity and a blunted cardiac response. These findings need to be verified in a larger cohort study.
In particular, participants in the lowest quartile of the rate of change in CO exhibited the greatest susceptibility to AMS (69.23% vs. 26.92%). These findings suggest that an attenuated CO response to exercise in healthy lowlanders reflects a diminished cardiac reserve capacity. This functional limitation not only constrains VO2max during exertion, but also compromises HAs acclimatization efficiency[34]. This interpretation is further supported by comparative physiological studies between Han and Tibetan populations[35]. At extreme altitudes over 5,600 m, Tibetans present significantly greater VO2max values and more stable SV values, indicating enhanced cardiac and oxygen reserve capacities[36]. Tibetans may have acquired superior cardiac contractile reserves and oxygen transport efficiency through genetic or developmental adaptations. Taken together, these findings support the concept that attenuated CO augmentation during exercise may serve as a functional biomarker of impaired HAs acclimatization, although further validation in larger cohorts is warranted.
-
Consistent with previous findings, the female sex was independently associated with an increased risk of AMS. In addition to the direct effects of hormones[37], SV and CO were also found to be significantly lower in women than in men, with a significant decrease in the estimated left ventricular filling pressure and inadequate HR compensation in female participants[23]. However, in this study, at rest and during exercise, the absolute values and change rates of HR, SV, and CO were comparable between females and males. Female sex and the rate of change in CO during exercise still showed an independent predictive value after adjusting for other characteristics, which may be related to AMS risk.
-
The present study had several limitations. First, the participants were mostly young (19–59 years old) and healthy, and whether the findings are applicable to older populations or to those with preexisting cardiopulmonary conditions is unknown. Second, because echocardiographic examination requires participants to maintain a resting supine position, measurements during the last step of exercise may underestimate the true hemodynamic responses. Third, the exercise intensity was set to be mild, and the association needs to be examined at moderate and submaximal exercise levels. Fourth, although significant correlations were observed between cardiovascular responsiveness and AMS incidence, the potential mediating roles of hypoxia-inducible factors require further investigation via concurrent blood biomarker analysis.
The time point chosen for assessing AMS is another potential limitation of this study. It is well established that AMS occurs within the first 1–5 d after ascent. According to the 2018 Lake Louise Acute Mountain Sickness Score system, the AMS score should be assessed after 6 h to avoid confusing AMS with confounding symptoms from travel or responses to acute hypoxia. Different time points of completion of the AMS self-report questionnaires may explain the discrepancies in AMS incidence. Although our chosen time point is methodologically standard for defining incident AMS, we recognize that it may not capture the entire spectrum of AMS incidence, particularly in cases with very late onset. Future studies incorporating repeated assessments over the first 48–72 hours at HAs would provide a more accurate incidence of AMS.
-
For the first time, we demonstrated that blunted CO augmentation during exercise at the LA can be used to evaluate cardiac reserve function and predict the risk of AMS following acute HA exposure. ESE could serve as an effective screening tool for AMS susceptibility because of its value in revealing latent functional deficits that are undetectable under resting sea level conditions. These findings provide novel insights into the mechanisms underlying AMS development and new non-invasive predictive markers for AMS risk assessment and pre-acclimatization screening.
HTML
Study Design
Study Population
Transthoracic Echocardiography
Exercise Stress Echocardiography
Assessment of AMS
Statistical Analysis
Population Characteristics and Incidence of AMS
Baseline Physiologic and Echocardiographic Parameters
Physiologic and Echocardiographic Parameters During Exercise
Factors Associated with AMS
Association of CO Change Rate with the Incidence, Severity, and Symptoms of AMS
Parameters at rest and during exercise in males and females
Mechanism of Blunted CO Augmentation During Exercise
Changes in CO During Exercise: Implications for HAs Adaptation
Sex Differences and AMS
Competing Interests The authors declare that they have no competing interests.
Ethics The study was performed in accordance with the Declaration of Helsinki and approved by the Medical Ethics Committee of the Second Affiliated Hospital of the Army Medical University (Approval No. 2019-Research-075-01). The study protocol was registered with the Chinese Clinical Trial Registry (registration number: ChiCTR1900025728). All participants were fully informed of the trial procedures and provided written informed consent before the start of the study.
Authors’ Contributions Conceptualization and study design: Yang Shen, Boji Wu, Chuan Liu, and Zhexue Qin; field experiments and data collection: Yang Shen, Boji Wu, Zhen Liu, Yuanqi Yang, Shizhu Bian, and Xi Liu; ultrasound scanning: Chun Li and Siming Gong; ultrasound data analysis: Chen Zhang and Jihang Zhang; statistical analyses and manuscript writing: Yang Shen and Boji Wu; supervision, manuscript review, and funding acquisition: Chuan Liu and Zhexue Qin.
Data sharing The data supporting the findings of this study are available from the corresponding author upon request. The supplementary materials will be available in www.besjournal.com.
&These authors contributed equally to this work.

 Quick Links
 DownLoad: