
-
Pathogens, including viruses and bacteria, can be transmitted through the air via multiple pathways, thereby posing substantial public health risks, especially in densely occupied indoor environments. In 2024, the World Health Organization (WHO) reached a formal consensus[1] on airborne pathogen transmission, moving away from the traditional aerosol–droplet dichotomy in favor of a unified conceptual framework. Instead, a unified terminology, Infectious Respiratory Particles (IRPs), was adopted, clarifying that transmission can occur through both short-range and long-range airborne or inhalation routes. IRPs suspended in the air may aggregate under the influence of environmental factors, such as humidity, forming larger particles that subsequently deposit onto surfaces. These deposited aggregates can then cause infection through direct or indirect contact. Indoor settings such as airport terminals and hospital waiting areas are characterized by high occupant density and therefore present elevated risks of airborne transmission. Our research group has previously employed experimental simulation approaches to reconstruct airborne transmission pathways of pathogens in airport[2] and hospital environments[3], providing experimental evidence for potential transmission routes under specific scenarios. However, these studies primarily focused on dissemination pathways and influencing factors. To more comprehensively understand airborne infection processes in complex real-world environments, it is necessary to clarify the distribution characteristics of airborne pathogens and subsequently conduct risk identification.
Airports are critical hubs in the global transportation network. According to the International Air Transport Association (IATA), global air passenger traffic exceeded 4.5 billion in 2019[4] and is projected to reach 5.2 billion by 2025. In China, the Civil Aviation Administration (CAAC) reported that civil aviation passenger traffic reached 730 million in 2024. The gathering, movement, and prolonged presence of high-density populations within complex airport environments substantially increase exposure risks to airborne pathogens. During infectious disease outbreaks, airports therefore become focal points for global public health prevention and control. In the revised International Health Regulations issued by WHO in 2024, the definition of a “pandemic emergency” explicitly emphasizes the potential for pathogens to spread across wide geographical areas, posing a global public health risk[5].
Environmental pathogenic microorganisms, including viruses, bacteria, and fungi, represent important potential threats to human health. Although viruses exhibit high transmissibility and mutability, their lack of cellular structure results in rapid inactivation after leaving the host. In contrast, bacteria and fungi possess specialized structures, such as endospores and spores that enable prolonged survival in complex environments and the formation of persistent environmental reservoirs, warranting particular attention. Aerosol-transmitted bacteria, such as Mycobacterium tuberculosis, present substantial challenges for prevention and control due to the covert nature of transmission. The increasing environmental adaptability of multidrug-resistant (MDR) bacteria has further escalated this issue into a major public health concern. In addition, respiratory infections caused by pathogenic fungi via aerosol or contact transmission also merit serious attention. In response, WHO released priority pathogen lists for fungi and bacteria in 2022 and 2024[6,7], underscoring their public health significance.
Currently, environmental risk assessment of pathogenic microorganisms typically follows a progressive pathway from “screening and identification” to “quantitative assessment.” The primary and indispensable step is qualitative risk screening, which focuses on identifying and prioritizing high-risk targets within complex microbial communities by integrating authoritative pathogen lists with information on relative abundance and detection frequency in the environment. This process itself constitutes an independent and effective approach to risk assessment, particularly in scenarios involving unknown pathogens or requiring rapid response. Moreover, it systematically identifies potential hazards, thereby establishing the essential foundation for the “hazard identification” stage of subsequent quantitative assessments and providing clear targets and justification for further evaluation. On this basis, for pathogens that are common, consistently identified through screening, and supported by established monitoring methods and historical data, quantitative microbial risk assessment (QMRA) can be conducted to estimate risk in quantitative terms. Therefore, risk screening and identification is not only a component of risk assessment but also a prerequisite for quantitative evaluation. However, current environmental microbiological research has predominantly focused on settings such as subways[8-10] and hospitals, while studies addressing microbial community composition, pathogen distribution characteristics, and risk identification in the distinct environment of airports[11,12] remain extremely limited.
Sampling and detection are essential for characterizing the distribution of environmental microorganisms, and accurate sampling is a critical requirement in environmental microbiology research[13,14]. At present, major airborne aerosol sampling approaches, such as wet-wall cyclone sampling[15] and filter-based air sampling[16,17], are based on distinct principles and therefore exhibit different performance characteristics. Wet-wall cyclone sampling preserves microbial viability through liquid collection media, but evaporation of the sampling buffer can reduce collection volume and compromise efficiency. Filter-based sampling is well suited for long-term monitoring, but continuous airflow across collected microorganisms may cause cellular desiccation and damage. During subsequent membrane processing, nucleic acids released from damaged cells may be lost from filter extracts, leading to underestimation of free DNA[18]. These methodological differences complicate cross-study comparisons and can introduce bias into microbial diversity assessments[18-20]. In terms of microbial detection, analytical techniques have evolved from traditional culture-based methods to molecular approaches, including polymerase chain reaction (PCR) and metagenomic sequencing. While culture-based methods are specific, they are time-consuming and have limited sensitivity. PCR improves sensitivity through targeted amplification but is strongly dependent on primer design. Metagenomic sequencing enables culture-independent characterization of microbial communities and functions but requires relatively high DNA input. The 2bRAD-M method used in this study[21,22] offers clear advantages. As a simplified genome sequencing approach, it employs unique tags generated by Type IIB restriction enzymes for microbial identification and relative quantification. Compared with conventional metagenomic sequencing, 2bRAD-M can handle samples with high host DNA content and is particularly suitable for low-biomass samples. Unlike 16S/18S rRNA sequencing, 2bRAD-M enables simultaneous identification of bacteria, fungi, and archaea, and provides species-level resolution.
This study aims to: characterize the distribution of bacteria and fungi across different areas of an airport terminal; identify bacterial and fungal pathogens present in this environment, particularly those listed as WHO priorities with potential human transmission risks; evaluate the effects of airborne aerosol and surface sampling methodologies on microbial capture efficiency and community characterization in a complex real-world environment; assess potential microbial exposure and transmission risks by integrating environmental parameters with pathogen data; and provide scientific evidence to support optimization of airport environmental health monitoring strategies, including sampling method selection, and the development of targeted infection prevention and control measures.
-
A large domestic airport was selected as the study site. Sampling was conducted on August 27, a day with approximately 900 flights and a passenger throughput of about 130,000 individuals. The airport terminal consists of one basement level (B1) and four above-ground levels. Level B1 functions as a rail transit transfer hub, whereas Level 2 and Level 3 correspond to the domestic arrivals and domestic departures areas, respectively. The research focused on sampling points within high-traffic zones of the terminal, specifically the transit transfer area (A1), domestic arrivals area (A2), and domestic departures area (A3).
-
This study employed two sampling instruments to collect airborne aerosols, based on wet cyclone and filter-based[23,24] sampling methodologies, respectively. Prior to sampling, all aerosol collection devices were calibrated for flow rate and cleaned with disinfectant. To ensure comparability between the two devices, the particulate matter sampler and the aerosol sampler were positioned in the same area, separated by a distance of two meters, such that the exhaust port of neither device was directly aligned with the intake port of the other. Both devices were operated concurrently during sampling, with flow rates set to the optimal values specified by the manufacturers. To ensure adequate DNA yield, sampling durations differed between devices, and the sampling interval of the cyclone sampler was fully contained within that of the filter-based sampler. In addition, blank sampling liquid and blank filter membranes were included as negative controls. Operators wore gloves and performed hand disinfection between sampling points.
Bioaerosol samplers (ASE-400, Beijing Zijing Biotechnology Co., Ltd., Beijing, China) were used to collect airborne aerosol samples at a height of approximately 1.5 m above-ground level. The sampling flow rate was 400 L/min, and the sampling duration was 40 min per collection. Sampling was conducted in the morning (M), noon (N), and evening (E), and samples were stored in preservation liquid. Nine aerosol samples were collected from the air. These samples were designated with “B” and labeled following the “B_sampling area_collection time” convention, for example, “B_A1_M.”
Particle samplers (DPS, SKC Inc., Pennsylvania, USA) were operated at the same sampling height, with air drawn at a flow rate of 10 L/min for 570 min, and particles collected on filter membranes. A total of six PM2.5 and PM10 samples were obtained. These samples were designated with “P” and labeled following the “P_sampling area_particle type” convention, for example, “P_A1_PM2.5”.
-
Sterile swabs pre-moistened with sodium chloride solution were used to sample surfaces, including handrails, seats, and counters, after which the swabs were placed into sterile sampling tubes. Blank swabs were included as negative controls throughout the sampling process. At each sampling site, two surface swab samples were collected and pooled into a single composite sample for analysis. The corresponding sample IDs were Surface_A1, Surface_A2, and Surface_A3.
After collection, all aerosol samples were preserved on dry ice and transported to the laboratory immediately.
-
Temperature, humidity, wind speed, and particle number concentration were measured three times at each sampling site during sampling. All environmental monitoring instruments were calibrated and verified prior to use, and the average value of each parameter was recorded.
-
Collected samples were transported to the laboratory under refrigerated conditions. Microbial DNA was extracted using the MagPure Soil DNA KF Kit, with negative control samples included in each analytical batch. Extracted DNA was digested with 4 units (U) of the BcgI restriction enzyme (New England BioLabs) at 37 °C for 3 h. The resulting digestion product (10 μL) was ligated to two types of adapters (0.8 μL each, 5 μM) using T4 DNA ligase (800 units) at 4 °C for 12 h. Ligated fragments were then amplified by PCR (20 μL reaction containing 4 μL 5×HF buffer, 0.6 μL dNTPs (10 mM), 0.4 μL of 10 μM Primer 1 and Primer 2, and 0.4 U Phusion High-Fidelity DNA Polymerase). Amplified products were separated by 8% polyacrylamide gel electrophoresis (400 V for 35 min), after which the 100 bp target band was excised and DNA was eluted from the gel in nuclease-free water for 6–12 h at 4 °C. To incorporate sample-specific barcodes, a second round of PCR was performed using sequencing-platform-specific primers containing unique barcode sequences. Each 20 µL reaction mixture comprised 6 µL of gel-eluted DNA, 4 µL 5×HF buffer, 0.6 µL dNTPs (10 mM), 0.8 μL of 5 μM 5UDI Primer and 7UDI Primer, and 0.4 U Phusion High-Fidelity DNA Polymerase (NEB). Final PCR products were purified using the QIAquick PCR Purification Kit (Qiagen, Valencia, USA), quantified with a Qubit 2.0 fluorometer (Invitrogen), and sequenced on the Illumina Novaseq PE150 platform (Illumina, San Diego, USA). Subsequent 2bRAD-M analysis was conducted by OE Biotech Co., Ltd. (Qingdao, China)[21,22]. Finally, all primer and adaptor sequences used in this study are provided in the supplementary materials.
-
Raw high-throughput sequencing data were generated in FASTQ format. Sequencing reads were filtered to obtain clean reads with the following criteria: removing reads with > 8% unknown bases; removing reads containing more than 20% of low-quality bases (Q-value ≤ 30). Clean reads were then queried against the 2bRAD-M database to retrieve microbial annotation information. Relative abundances of individual species were calculated to generate taxonomic abundance profiles, with calculation formulas provided in the supplementary materials. To ensure analytical accuracy, all data entry and analytical procedures were independently performed by two individuals.
Alpha (α) diversity indices, including Shannon, Chao1, and Simpson indices, were used to evaluate microbial species richness and evenness within individual samples. Beta (β) diversity analysis was conducted using the Bray–Curtis dissimilarity algorithm to construct distance matrices between samples and quantify overall differences in community structure. Principal Coordinates Analysis (PCoA) was applied to visualize these matrices through dimensionality reduction, enabling intuitive assessment of sample clustering and separation in two-dimensional space. To test the statistical significance of community structure differences between groups, such as sampling areas or sample types, permutational multivariate analysis of variance (PERMANOVA, also referred to as Adonis) was performed, with results reported as R2 and P values. To identify significantly enriched biomarkers across taxonomic levels from phylum to species, Linear Discriminant Analysis Effect Size (LEfSe) analysis was conducted, applying an LDA score threshold greater than 2.0 to define significant enrichment. All statistical analyses were performed using R version 4.5.1.
-
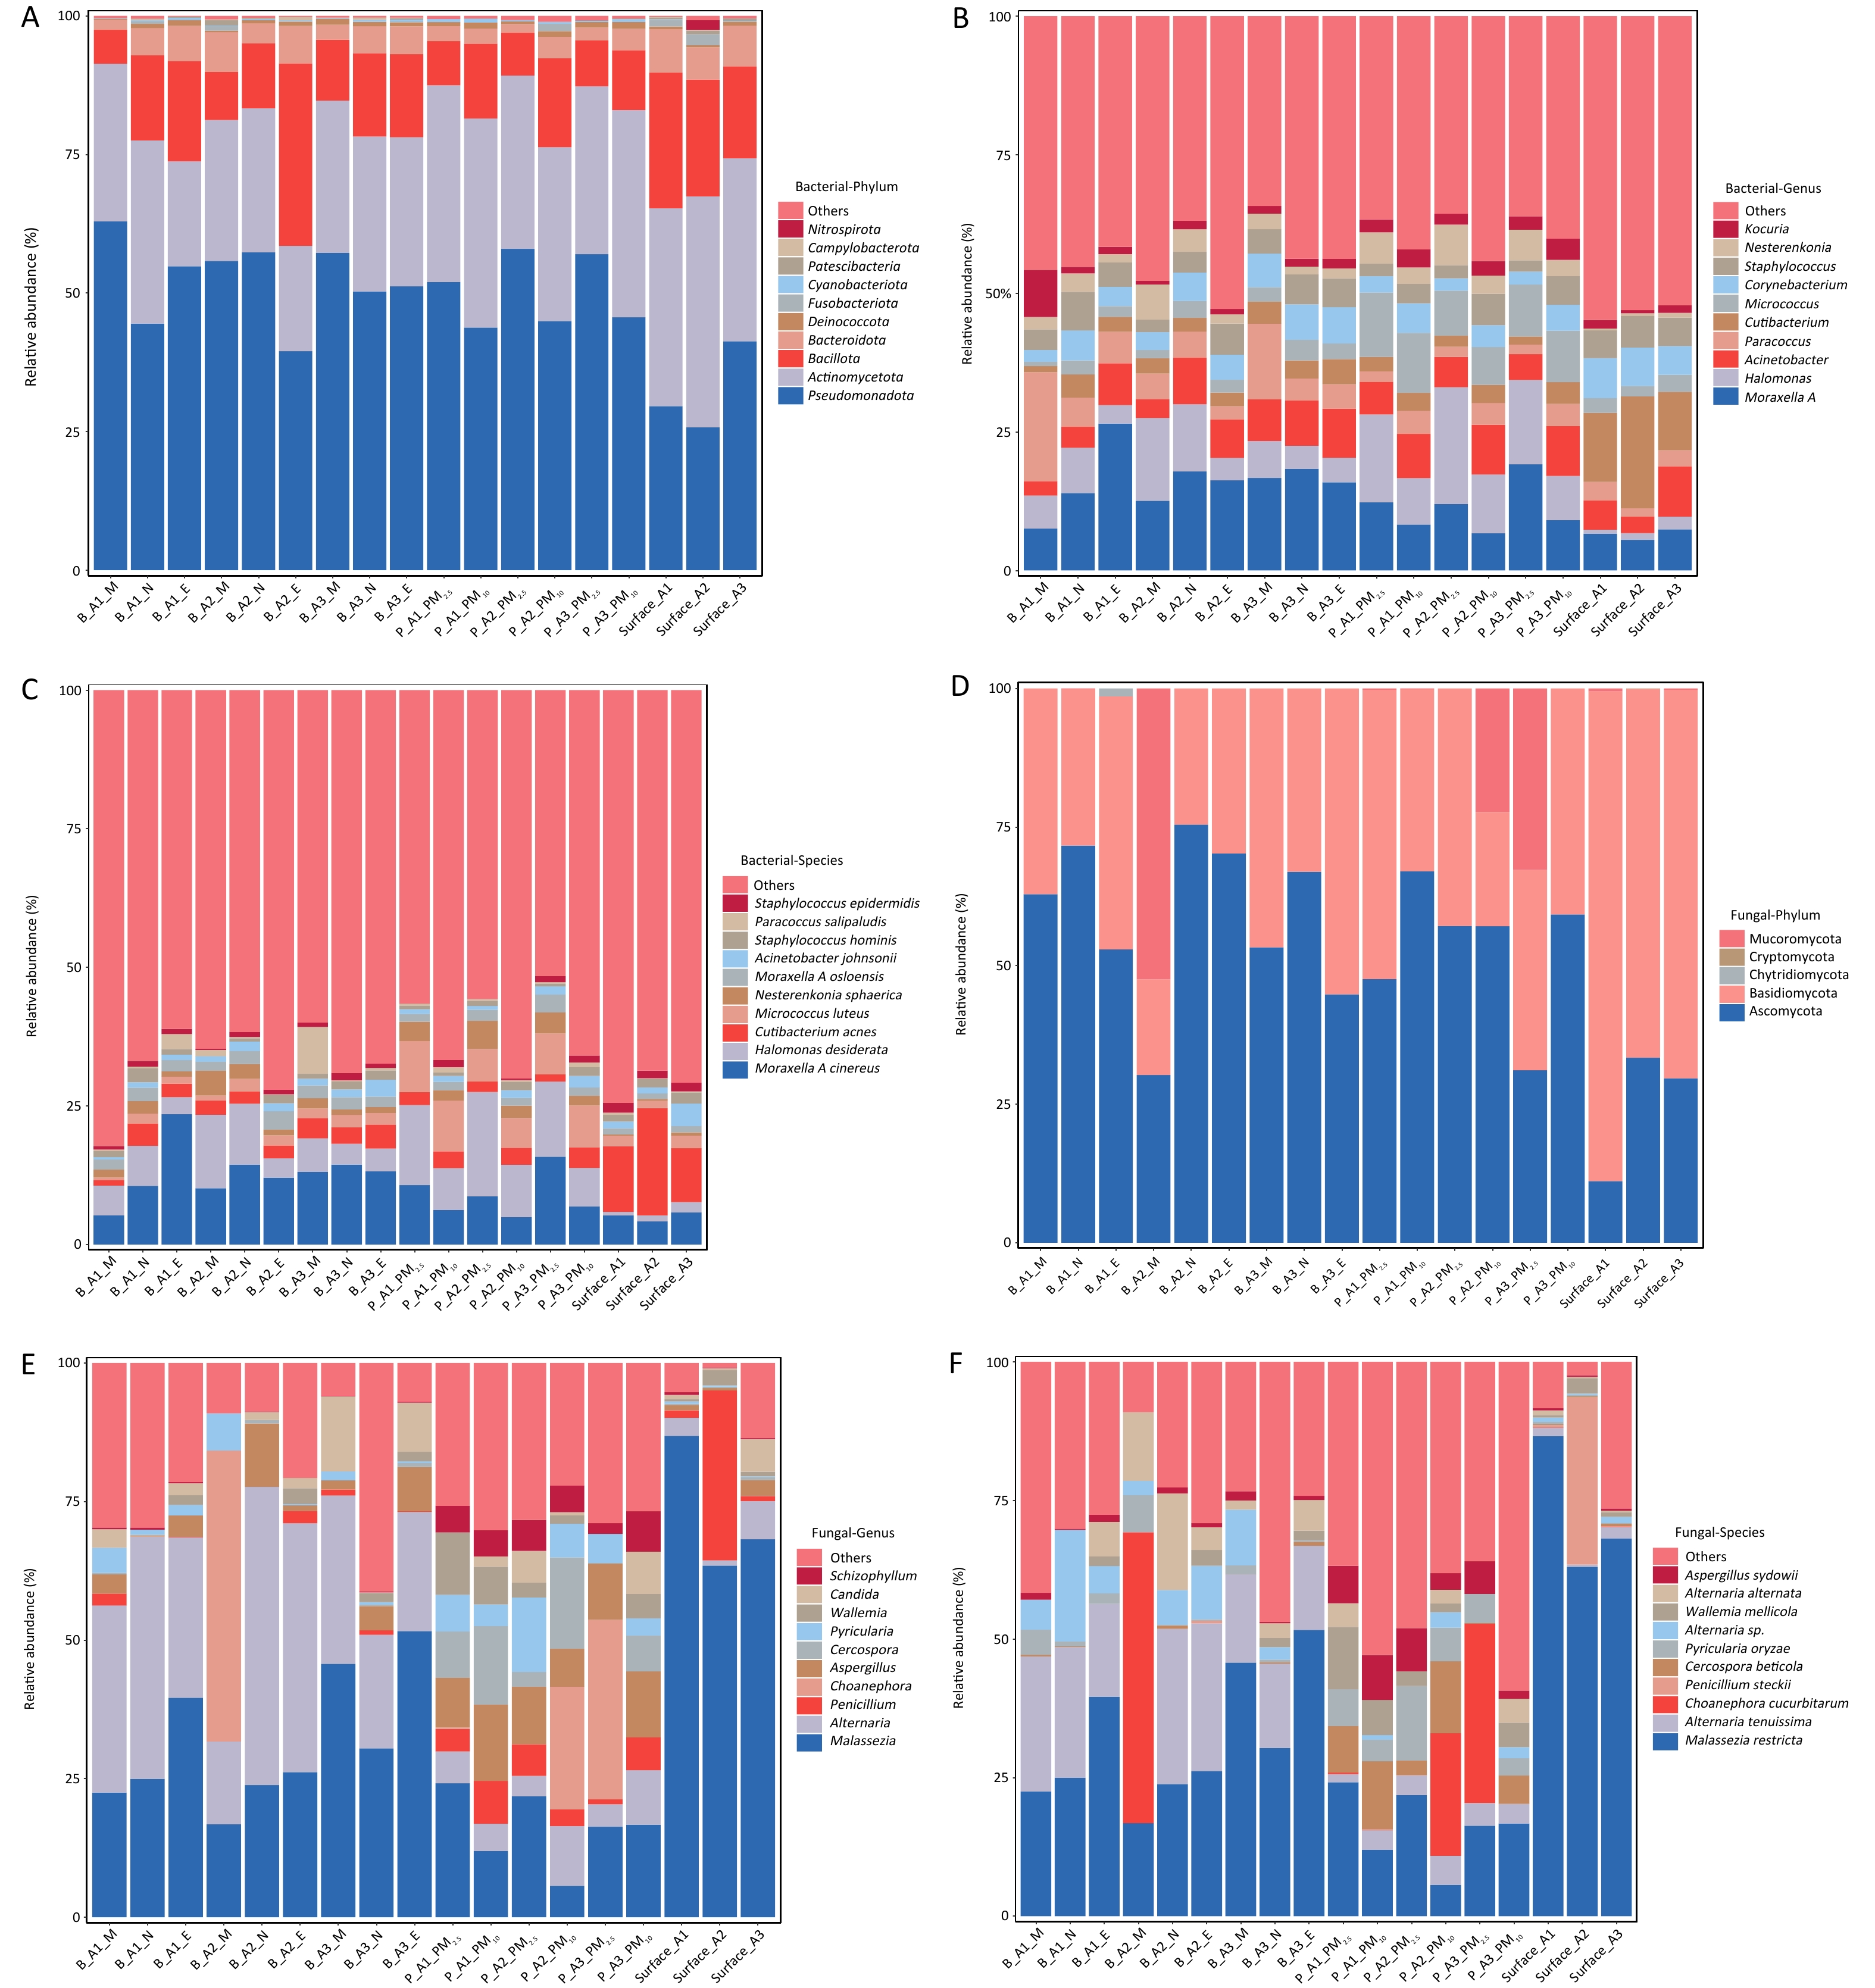
A total of 6,557 microbial species were identified in airborne aerosol samples collected from the transit transfer area (A1), domestic arrivals area (A2), and domestic departures area (A3) of the airport terminal. Bacteria accounted for 98.4% of detected microorganisms (6,450 species), whereas fungi represented 1.6% (107 species). Cumulative histograms of the top ten bacterial taxa by relative abundance at different taxonomic levels are shown in Figure 1A, 1B, and 1C. At the phylum level, 41 phyla were identified, with Pseudomonadota (39.4%–62.9%) and Actinomycetota (18.9%–32.9%) predominating, followed by Bacillota (6.10%–32.8%), Bacteroidota (1.86%–7.17%), and Deinococcota (0.15%–1.04%).
Figure 1. Microbial composition structures for aerosol and surface samples. (A) bacterial phylum; (B) bacterial genus; (C) bacterial species; (D) fungal phylum; (E) fungal genus; (F) fungal species.
At the genus level, 1 941 genera were identified, and the ten most abundant genera collectively accounted for 57.2%–69.1% of total relative abundance. Dominant genera included Moraxella A (7.55%–26.5%), Paracoccus (2.39%–19.7%), Halomonas (3.32%–14.9%), Acinetobacter (2.62%–8.84%), and Corynebacterium (2.15%–6.55%). Furthermore, 6,450 species were detected. The dominant species were Moraxella A cinereus (4.94%–23.5%), Halomonas desiderata (3.02%–18.8%), Micrococcus luteus (0.41%–9.23%), Cutibacterium acnes (1.03%–4.34%), and Nesterenkonia sphaerica (0.95%–5.07%).
Fungi exhibited substantially lower relative abundance. Cumulative histograms of the top ten fungal taxa by relative abundance at different taxonomic levels are shown in Figure 1D, 1E, and 1F. Fungal phyla were mainly Ascomycota (0.07%–0.42%) and Basidiomycota (0.08%–0.25%). At the genus level, Malassezia (0.02%–0.24%) and Alternaria (0.04%–0.19%) predominated. At the species level, Malassezia restricta (0.02%–0.24%) and Alternaria tenuissima (0.03%–0.10%) were the most frequently detected fungi.
-
A total of 7,700 microbial species were detected in surface samples, which was markedly higher than the number identified in airborne aerosol samples. Bacteria constituted 98.4% of detected microorganisms (7,573 species), whereas fungi accounted for 1.6% (127 species). Forty-four bacterial phyla were identified, with dominant phyla consistent with those observed in airborne aerosol samples, including Actinomycetota (32.8%–40.8%), Pseudomonadota (25.2%–41.0%), Bacillota (16.5%–24.2%), Bacteroidota (5.72%–7.80%), and Fusobacteriota (0.04%–1.90%).
On the genus level, 2,105 genera were identified, with the ten most abundant genera accounting for 52.7%–60.6% of total relative abundance. Relative to airborne aerosol samples, the abundances of Cutibacterium (10.5%–20.2%) and Streptococcus spp. (4.27%–10.2%) were substantially higher. Moraxella A (5.51%–7.42%), Corynebacterium (5.17%–7.22%), Acinetobacter (2.96%–9.09%), and Staphylococcus (5.00%–5.69%) were also among the dominant genera.
At the species level, 7,573 species were identified, with the top ten species dominated by Cutibacterium acnes (9.71%–19.4%), Moraxella A cinereus (4.14%–5.76%), Acinetobacter johnsonii (1.11%–4.07%), Lawsonella clevelandensis A (0.97%–3.29%), Micrococcus luteus (1.34%–2.29%), Corynebacterium matruchotii (0.22%–2.70%), and Staphylococcus epidermidis (1.40%–1.76%).
Fungi also exhibited low relative abundance in surface samples. Dominant fungal phyla were Ascomycota (0.09%–0.70%) and Basidiomycota (0.49%–1.39%), while dominant genera included Malassezia (0.47%–1.32%) and Penicillium (0.01%–0.64%). Relative to airborne aerosol samples, fungal abundance in surface samples showed a modest increase, with Malassezia restricta and Penicillium steckii present at 0.47%–1.32% and 0.01%–0.63%, respectively. Taken together, these findings indicate that overall fungal abundance remained low, although deposition-related variation was evident.
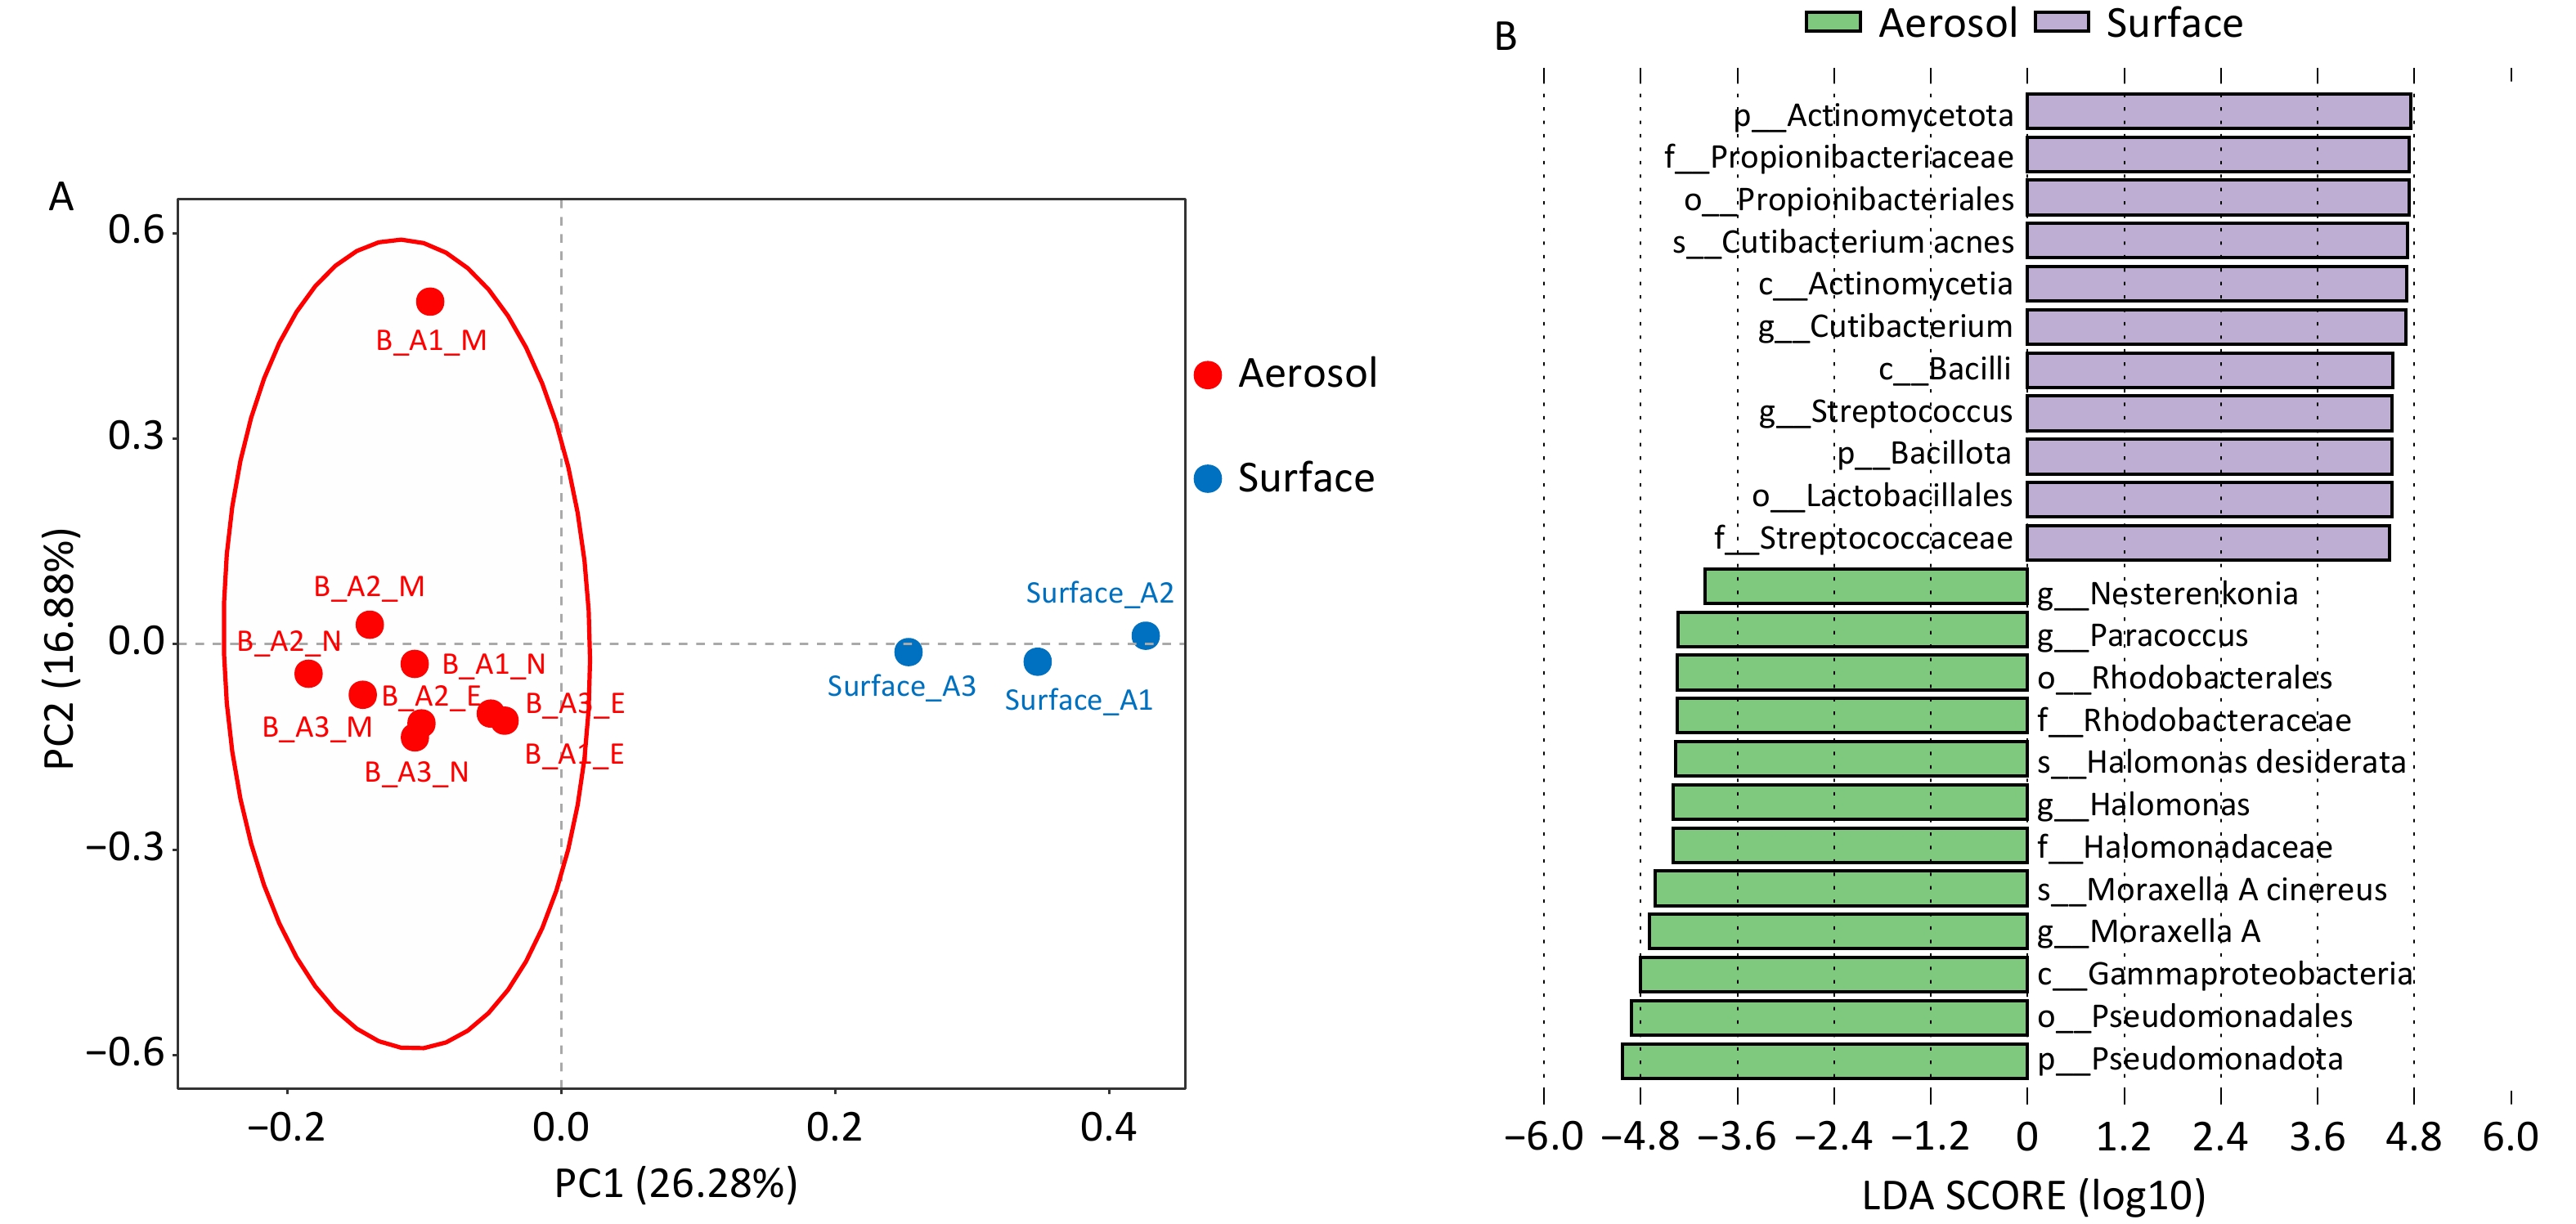
Figure 2A demonstrated a clear separation between airborne aerosol and surface samples. PERMANOVA analysis based on Bray–Curtis distance revealed significant differences in microbial community structure between groups (R2 = 0.25, F = 3.33, P = 0.004), indicating that sample type explained approximately 25% of total community variation. LEfSe analysis results are presented in Figure 2B. At the phylum level, Actinomycetia, Bacillota, and Pseudomonadota were identified as differential phyla, with the former two enriched in surface samples and Pseudomonadota more abundant in airborne aerosol samples. Differential genera included Cutibacterium, Streptococcus spp., Nesterenkonia, Paracoccus, Halomonas, and Moraxella A. The first two genera were significantly enriched in surface samples, whereas the latter four were more abundant in airborne aerosol samples. Among surface samples, differential species included Cutibacterium acnes, Halomonas desiderata, and Moraxella A cinereus, with Cutibacterium acnes showing the most pronounced enrichment.
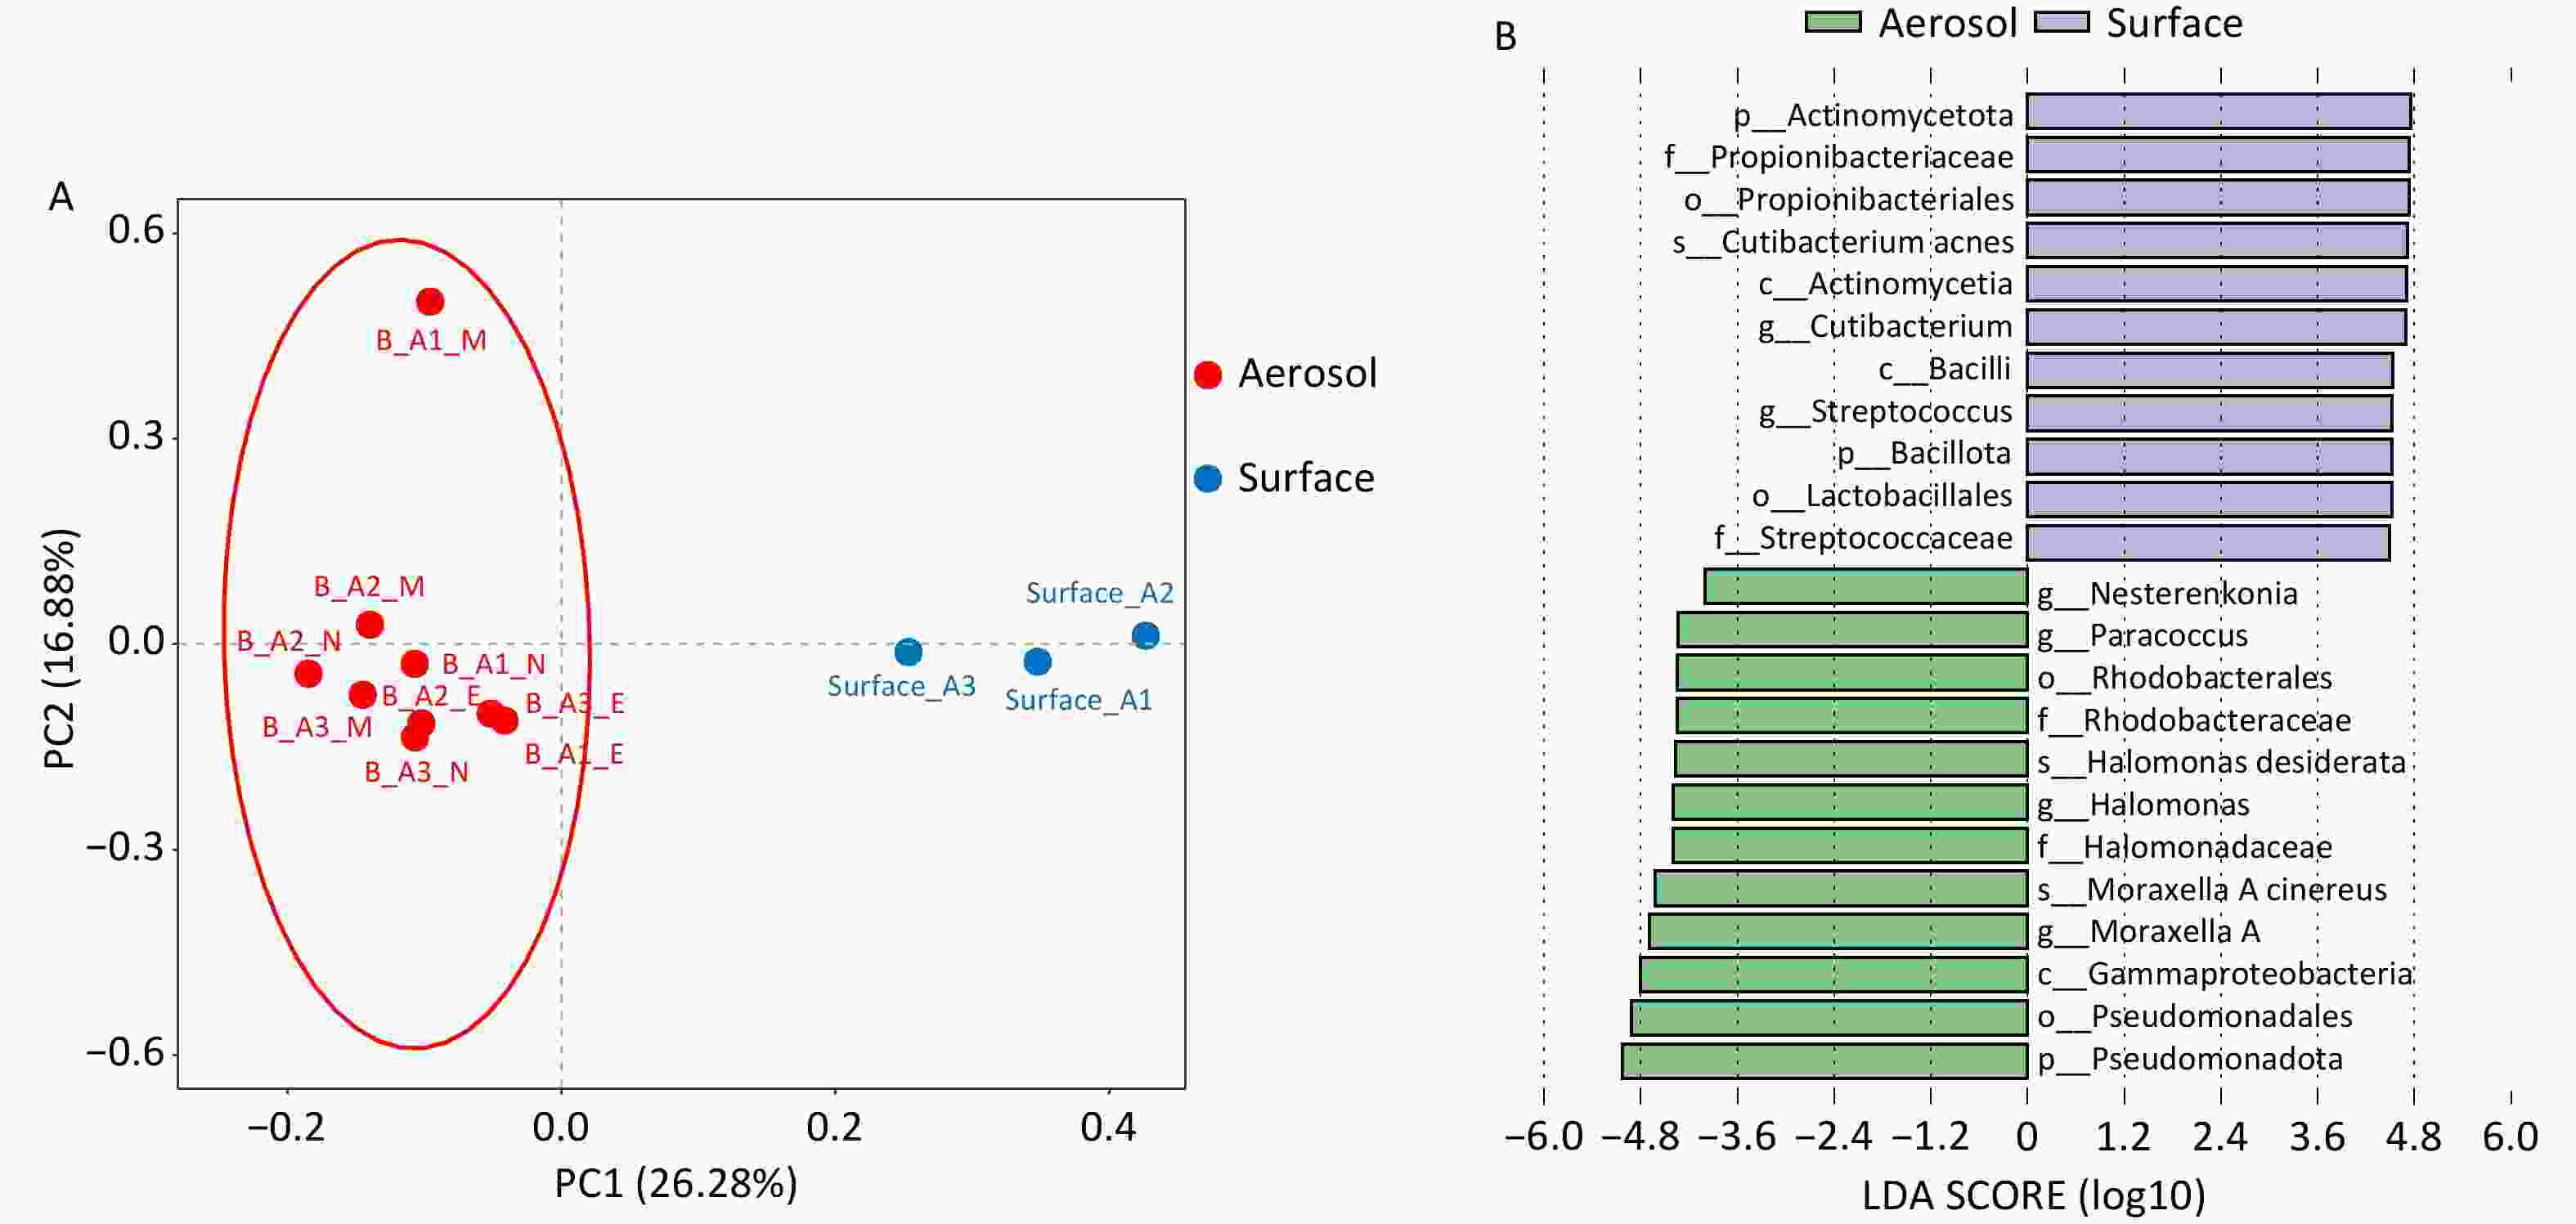
Figure 2. Differential analysis of airborne aerosol samples and surface samples. (A) Principal Coordinate Analysis (PCoA) results at species level; (B) LEfSe analysis results of microorganisms at different taxonomic levels.
-
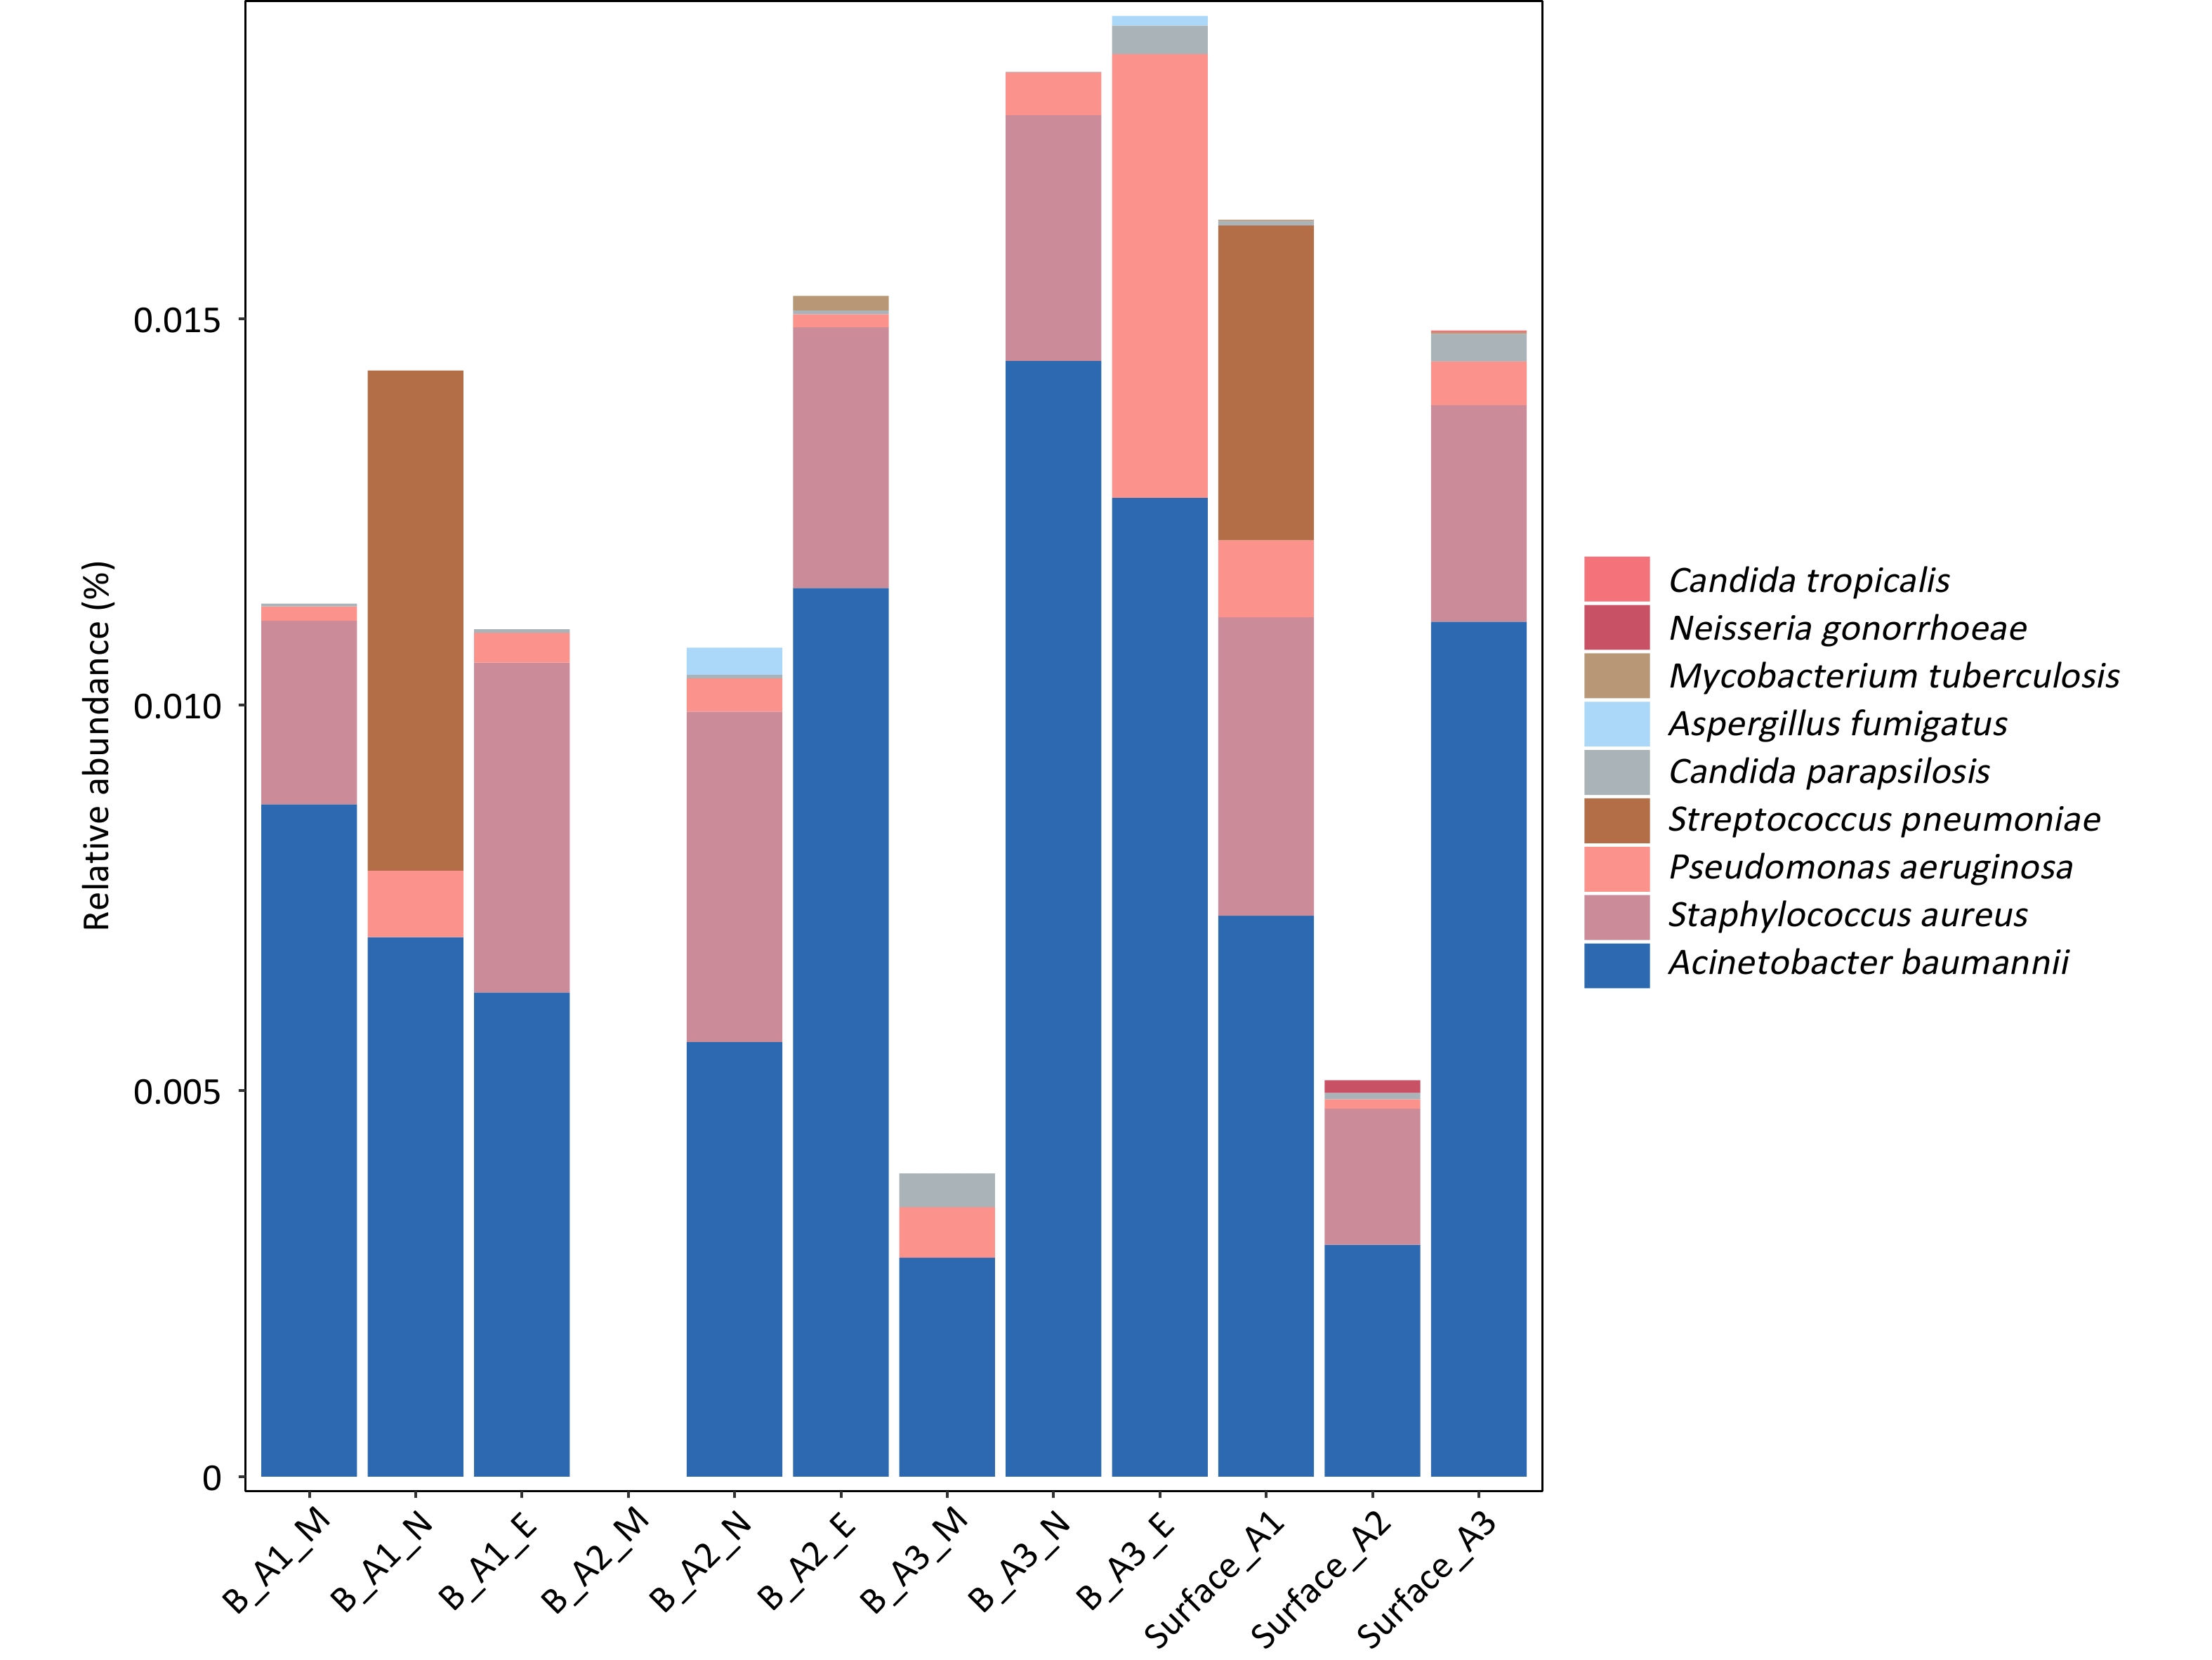
The two WHO priority pathogen lists encompass 15 antibiotic-resistant bacterial pathogens and 19 fungal pathogens, classified into the “Critical,” “High,” and “Medium” groups according to research and development needs and public health importance, as shown in Figure 3 and Tables 1 and 2. Moreover, since pathogen resistance genes were not sequenced in this study, the analysis was limited to detection of the corresponding species. Among bacteria, six pathogen types were detected in airborne aerosol samples, whereas seven types were identified in surface samples, with Neisseria gonorrhoeae detected only on surfaces. Within the bacterial pathogens, Enterobacterales showed the highest detection frequency. In this group, 136 species were detected in airborne aerosol samples and 131 species in surface samples, with relative abundances ranging from 0.001%–2.4% and 0.0002%–0.5%, respectively. Acinetobacter baumannii and Pseudomonas aeruginosa were also frequently detected, with relative abundances of 0.3%–1.4% and 0.01%–1.24%, respectively. Staphylococcus aureus exhibited a relatively high detection rate, with relative abundances of 0.1%–0.4%. In contrast, Streptococcus pneumoniae and Mycobacterium tuberculosis were detected at lower frequencies, with relative abundances of 0.4%–0.6% and 0.001%–0.02%, respectively.
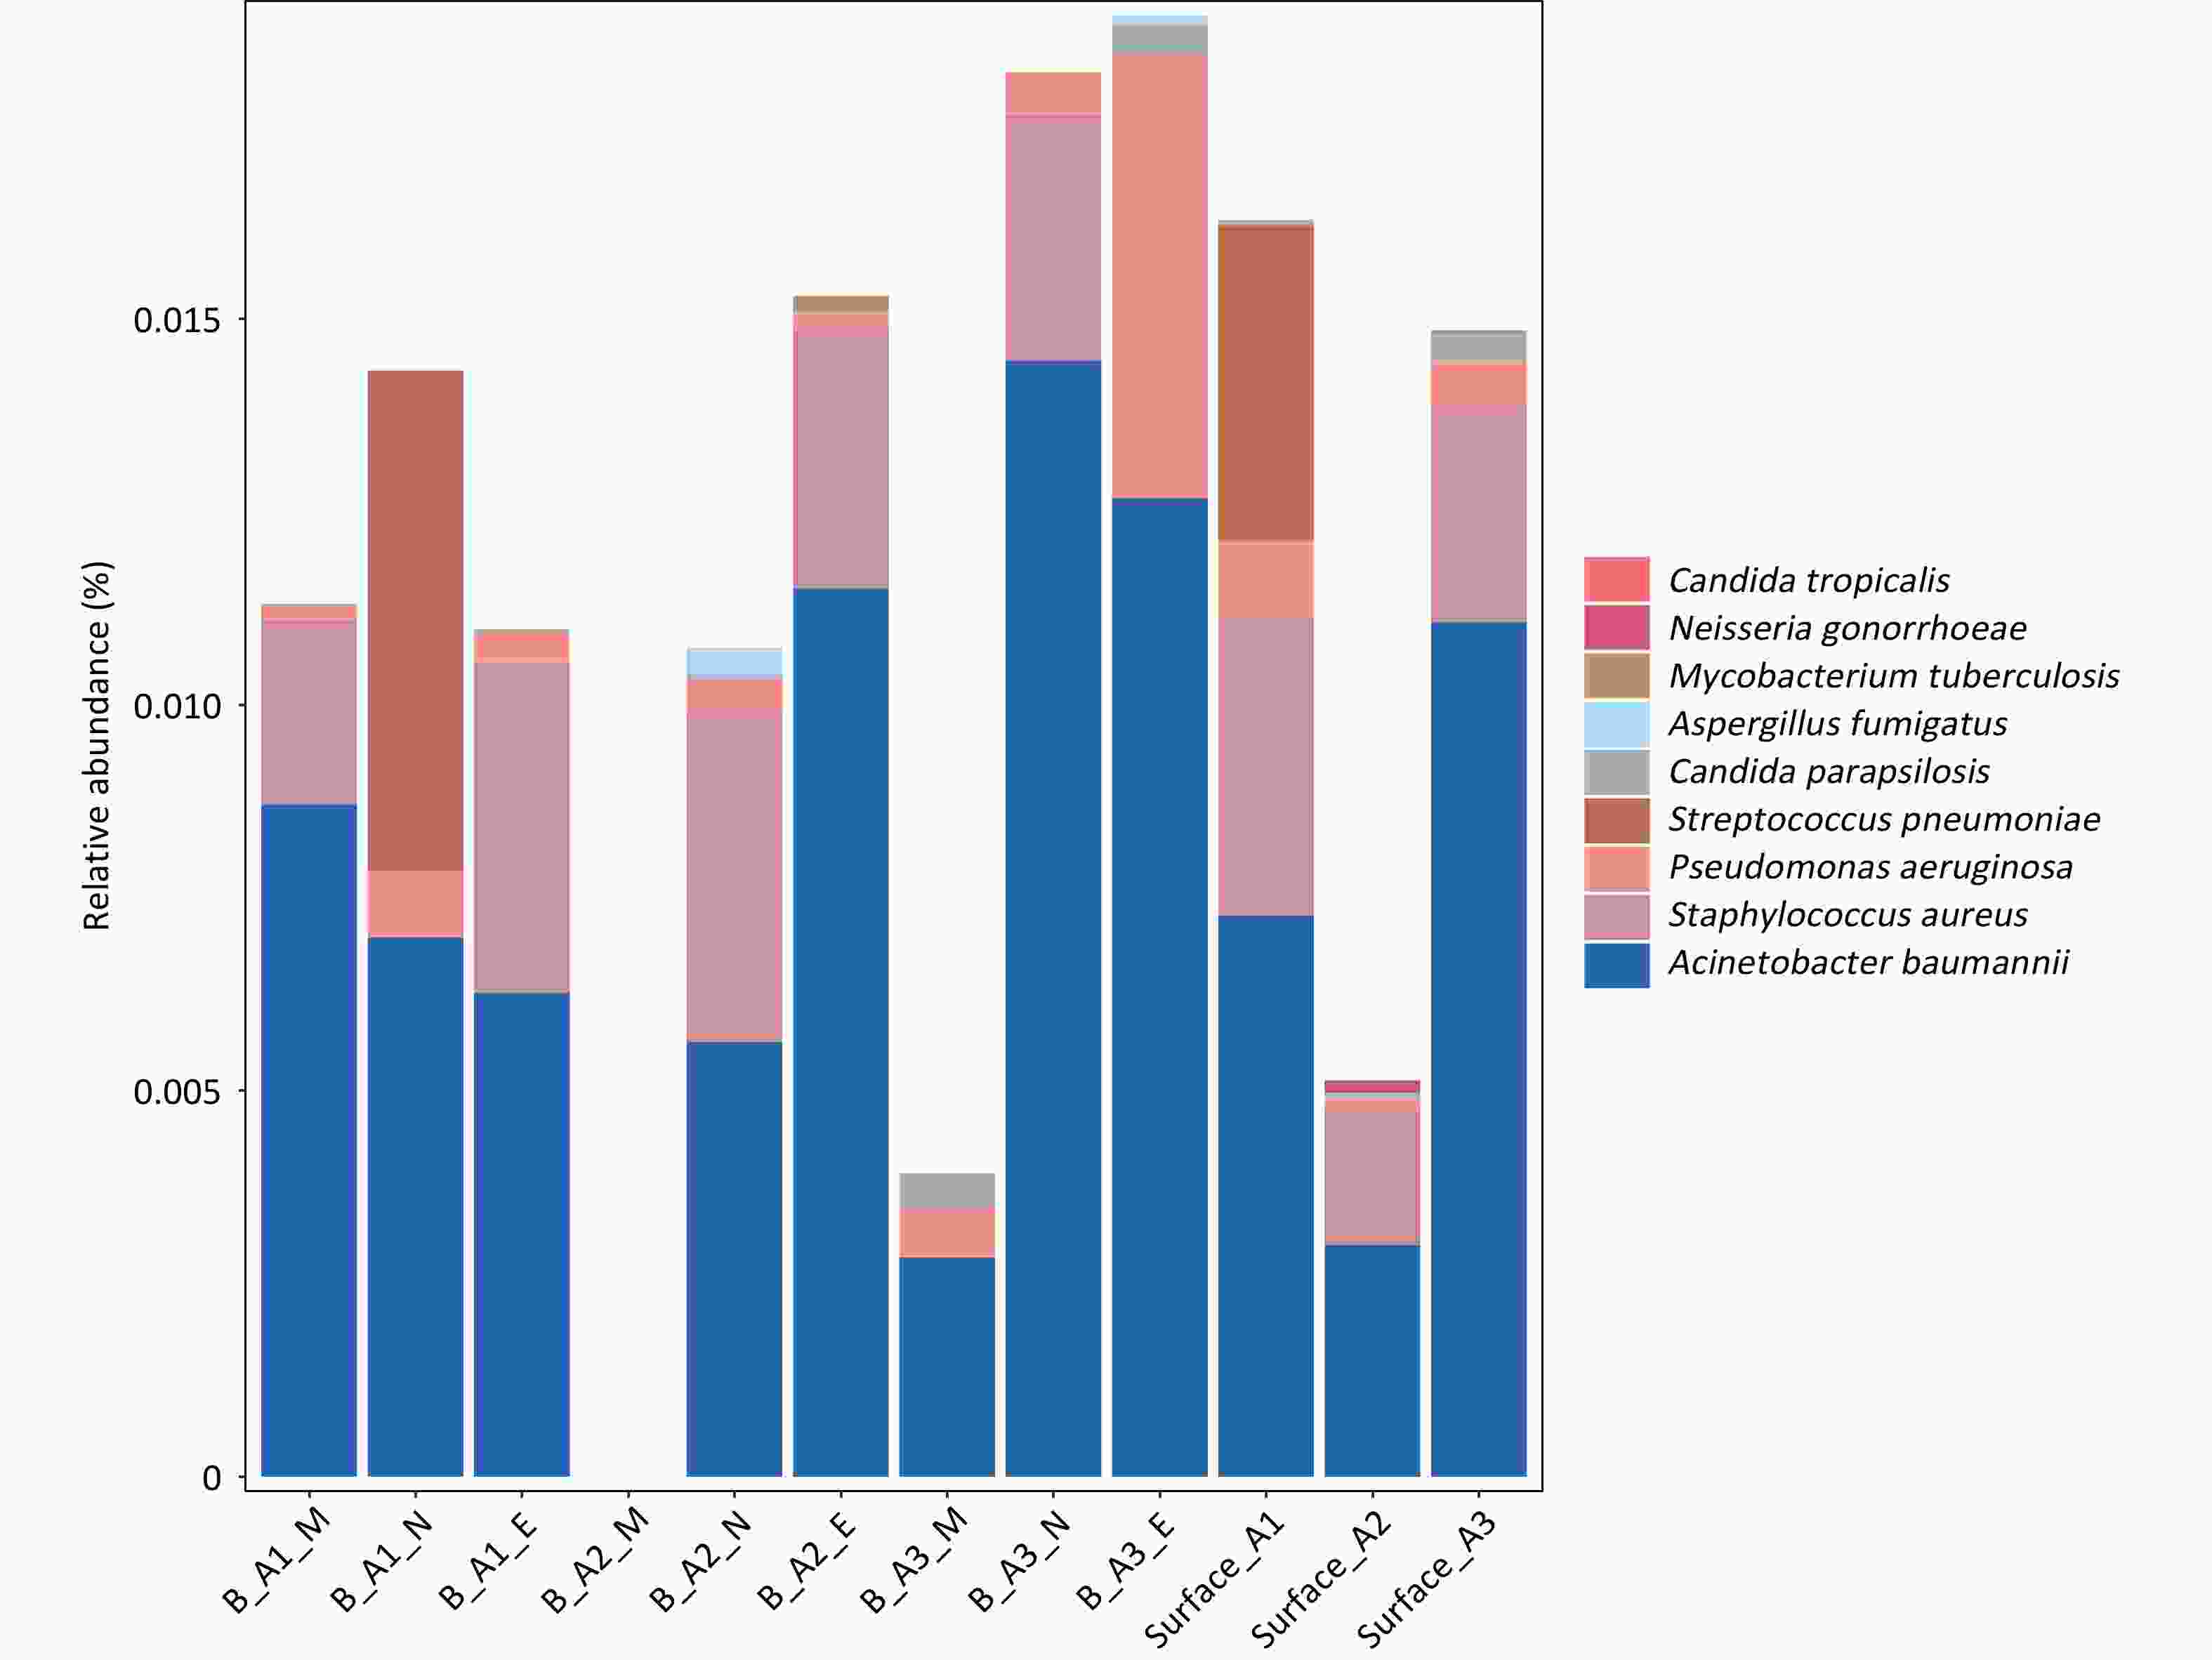
Figure 3. Relative abundance of WHO priority bacteria and fungi in airborne aerosol samples and surface samples.
WHO category WHO bacterial priority pathogen Airborne aerosol sample detection rate Surface sample detection rate Critical Acinetobacter baumannii 88.9% (8/9) 100% (3/3) Enterobacterales 100% (9/9) 100% (3/3) Mycobacterium tuberculosis 11.1% (1/9) 66.7% (2/3) High Salmonella Typhi ND ND Shigella spp. ND ND Enterococcus faecium ND ND Pseudomonas aeruginosa 88.9% (8/9) 100% (3/3) Non-typhoidal Salmonella ND ND Neisseria gonorrhoeae ND 33.3% (1/3) Staphylococcus aureus 55.6% (5/9) 100% (3/3) Medium Group A Streptococci ND ND Streptococcus pneumoniae 11.1 (1/9) 33.3 (1/3) Haemophilus influenzae ND ND Group B Streptococci ND ND Note. ND: Not Detected. Table 1. Detection of WHO priority bacteria in samples (Airborne aerosol, Surfaces)
WHO category WHO fungal priority pathogen Airborne aerosol sample detection rate Surface sample detection rate Critical Cryptococcus neoformans ND ND Candida auris ND ND Aspergillus fumigatus 22.2% (2/9) ND Candida albicans ND ND High Nakaseomyces glabrata ND ND Histoplasma spp. ND ND Eeumycetoma causative agents ND ND Mucorales 11.1% (1/9) 66.7% (2/3) Fusarium spp. ND ND Candida tropicalis ND 33.3% (1/3) Candida parapsilosis 77.8% (7/9) 100% (3/3) Medium Scedosporium spp. ND ND Lomentospora prolificans ND ND Coccidioides spp. ND ND Pichia kudriavzeveii ND ND Cryptococcus gattii ND ND Talaromyces marneffei ND ND Pneumocystis jirovecii ND ND Paracoccidioides spp. ND ND Note. ND: Not Detected. Table 2. Detection of WHO priority fungi in samples (airborne aerosol, surfaces)
For fungi, three pathogen types were detected in airborne aerosol samples and three types in surface samples. Aspergillus fumigatus was detected only in airborne aerosol samples, with relative abundances of 0.01%–0.04%, whereas Candida tropicalis was detected exclusively in surface samples, with a relative abundance of 0.2%. Candida parapsilosis showed a high detection frequency but low relative abundance (0.01%–0.04%). Detection of Mucorales was infrequent, with relative abundances ranging from 0.00051% to 0.19%.
-
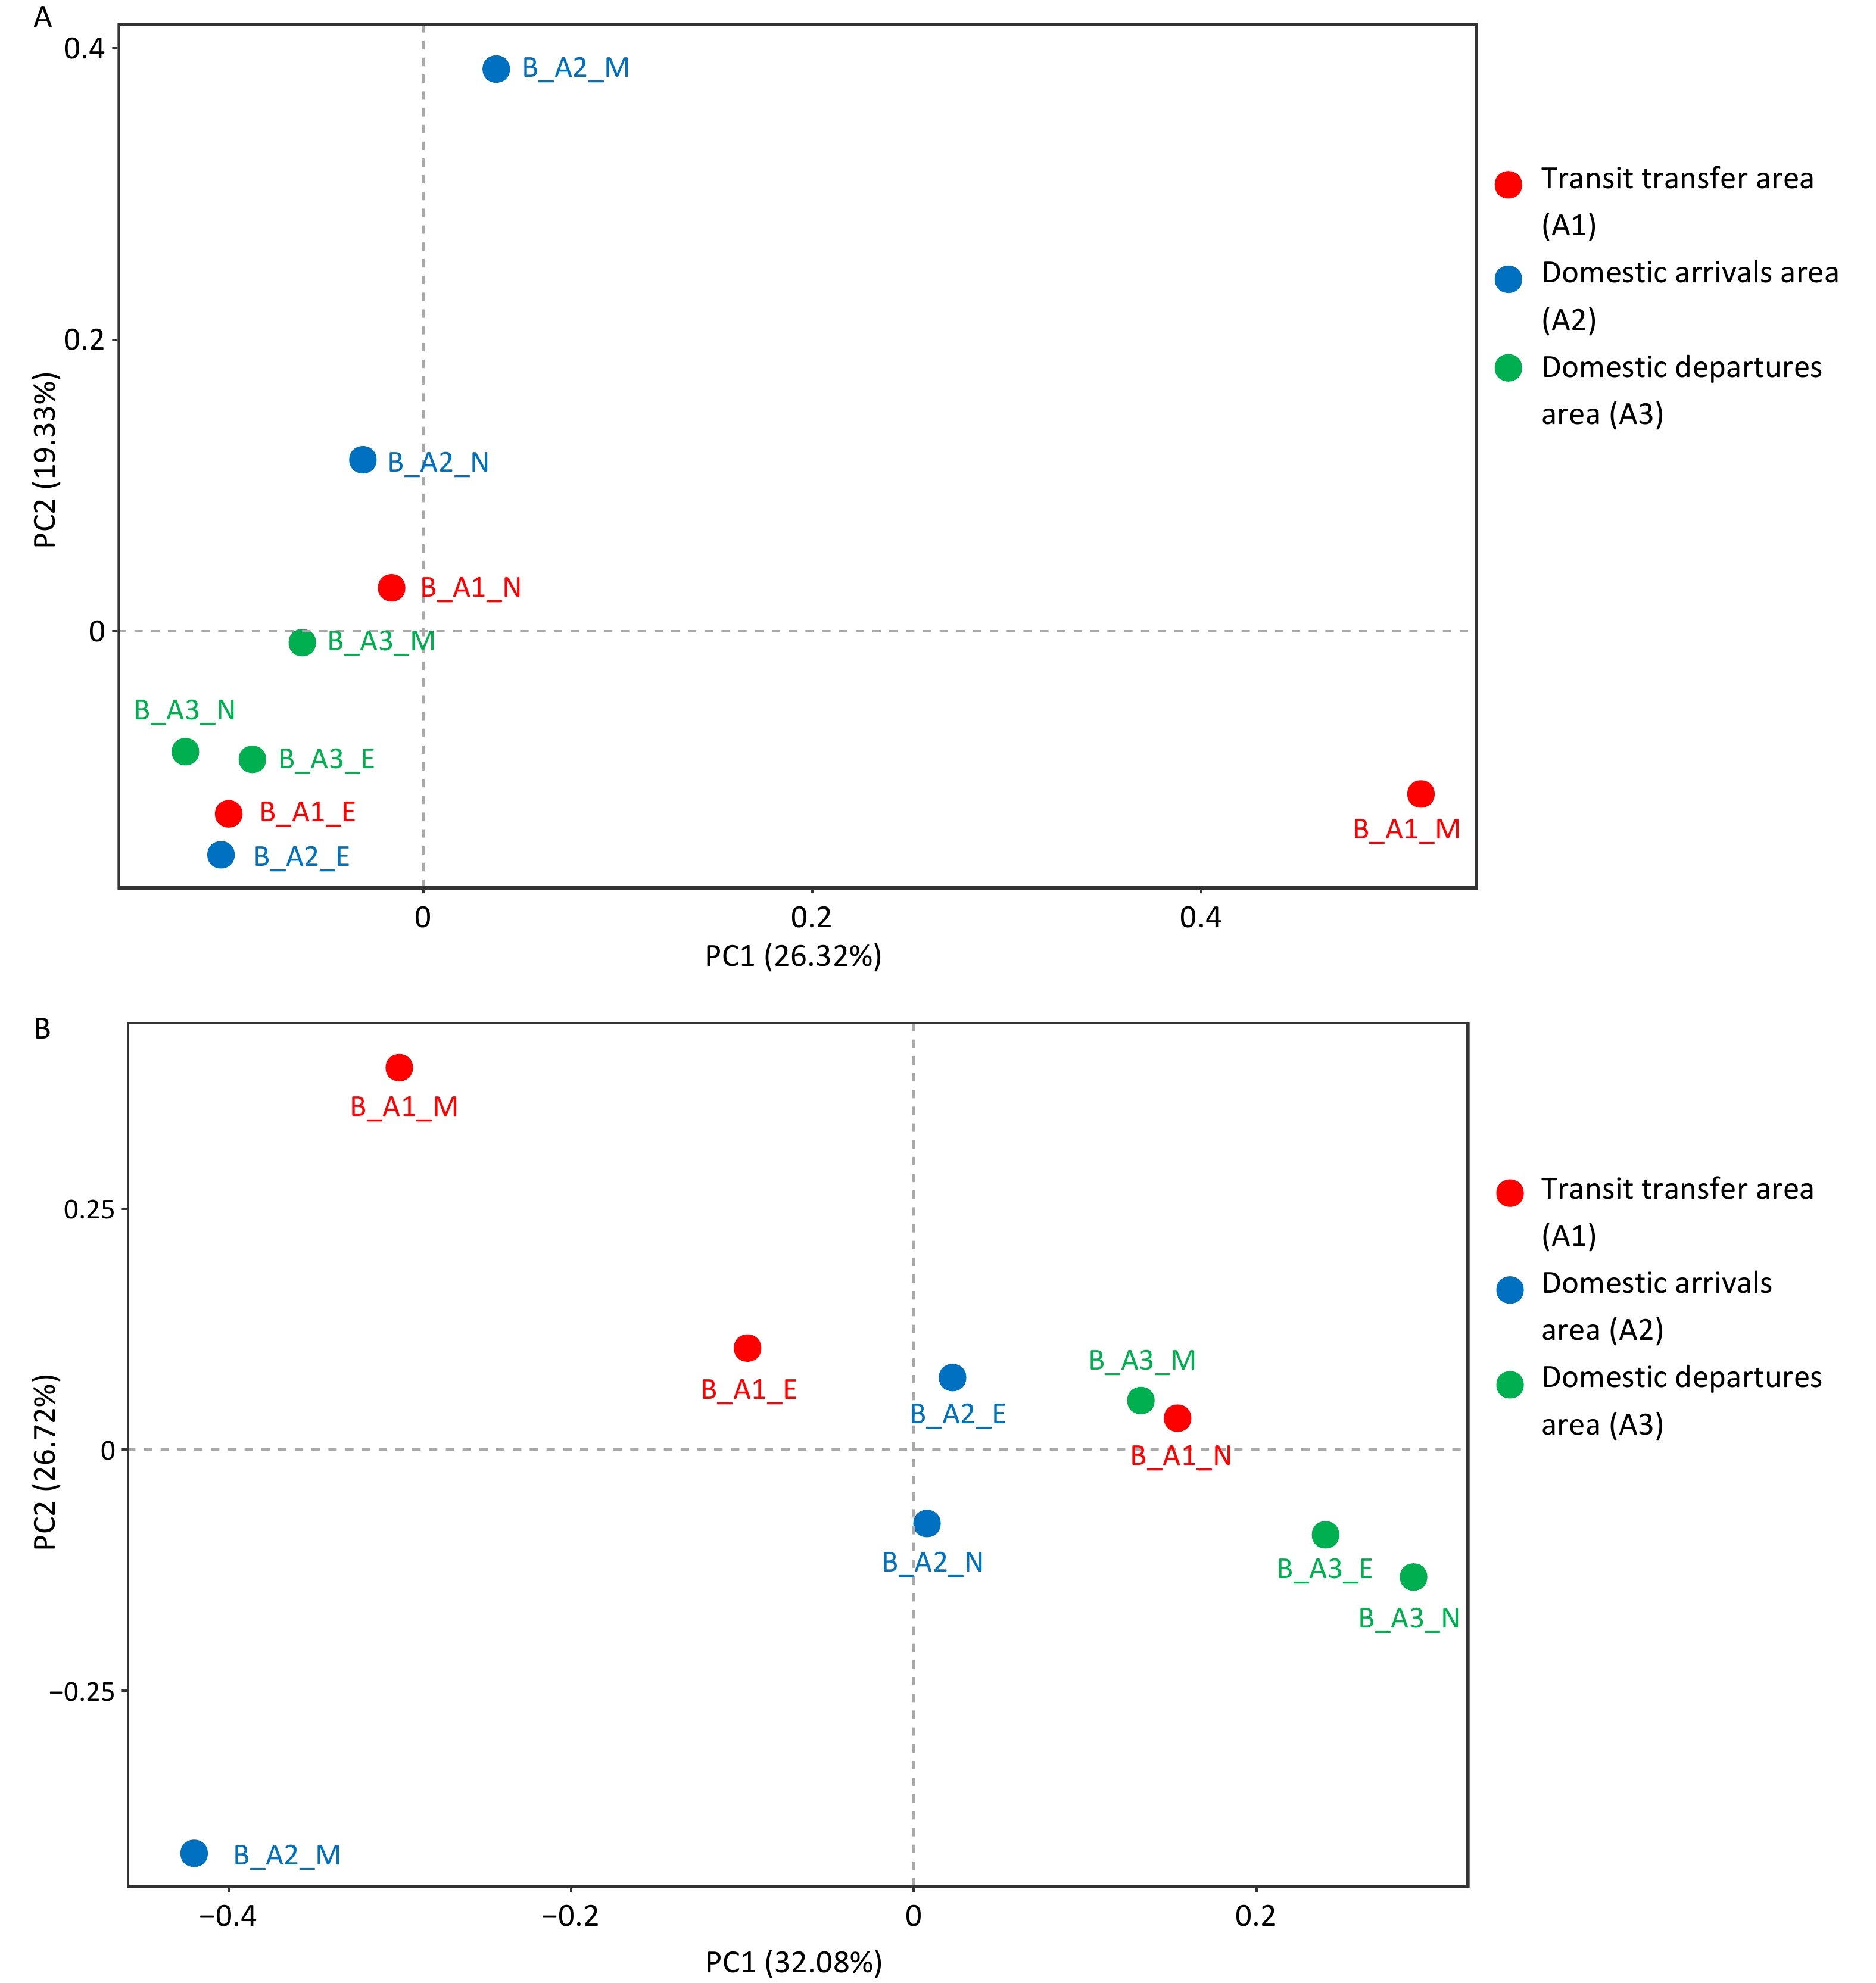
Airborne aerosol sampling was conducted on the same day during the morning, noon, and afternoon periods in the transit transfer area (A1), domestic arrivals area (A2), and domestic departures area (A3). Alpha diversity analysis based on the Chao1, Shannon, and Simpson indices is presented in Table 3 (environmental monitoring results and alpha diversity analysis results of other samples are provided in the Supplementary Material). In all three areas, Chao1 and Shannon indices showed increasing trends over time, and area A1 consistently exhibited a higher Chao1 index than the other two areas, indicating greater microbial species richness. Figure 4 illustrates the distribution patterns of bacterial and fungal communities across the different areas. As shown in the figure, samples collected from the same area did not display clear clustering patterns. PERMANOVA analysis was used to evaluate the effect of the grouping factor (Group) on bacterial and fungal community structure. The grouping factor had no significant effect on bacterial communities (P = 0.237). Although the grouping factor explained 36.1% of the variation in fungal communities and the P value was 0.01, the overall relative abundance of fungi was low, which may introduce statistical bias. Overall, these results indicate that the influence of spatial grouping on bacterial and fungal community composition was relatively limited.
Sample Chao1 Shannon Simpson B_A1_M 1,864 6.91 0.97 B_A1_N 1,611 7.27 0.97 B_A1_E 2,258 7.25 0.94 B_A2_M 752 6.85 0.96 B_A2_N 1,205 7.12 0.96 B_A2_E 1,585 7.37 0.98 B_A3_M 1,452 7.13 0.97 B_A3_N 1,457 7.43 0.97 B_A3_E 1,838 7.76 0.97 Table 3. Alpha diversity of airborne microbial aerosols across areas and time points (cyclone sampling)
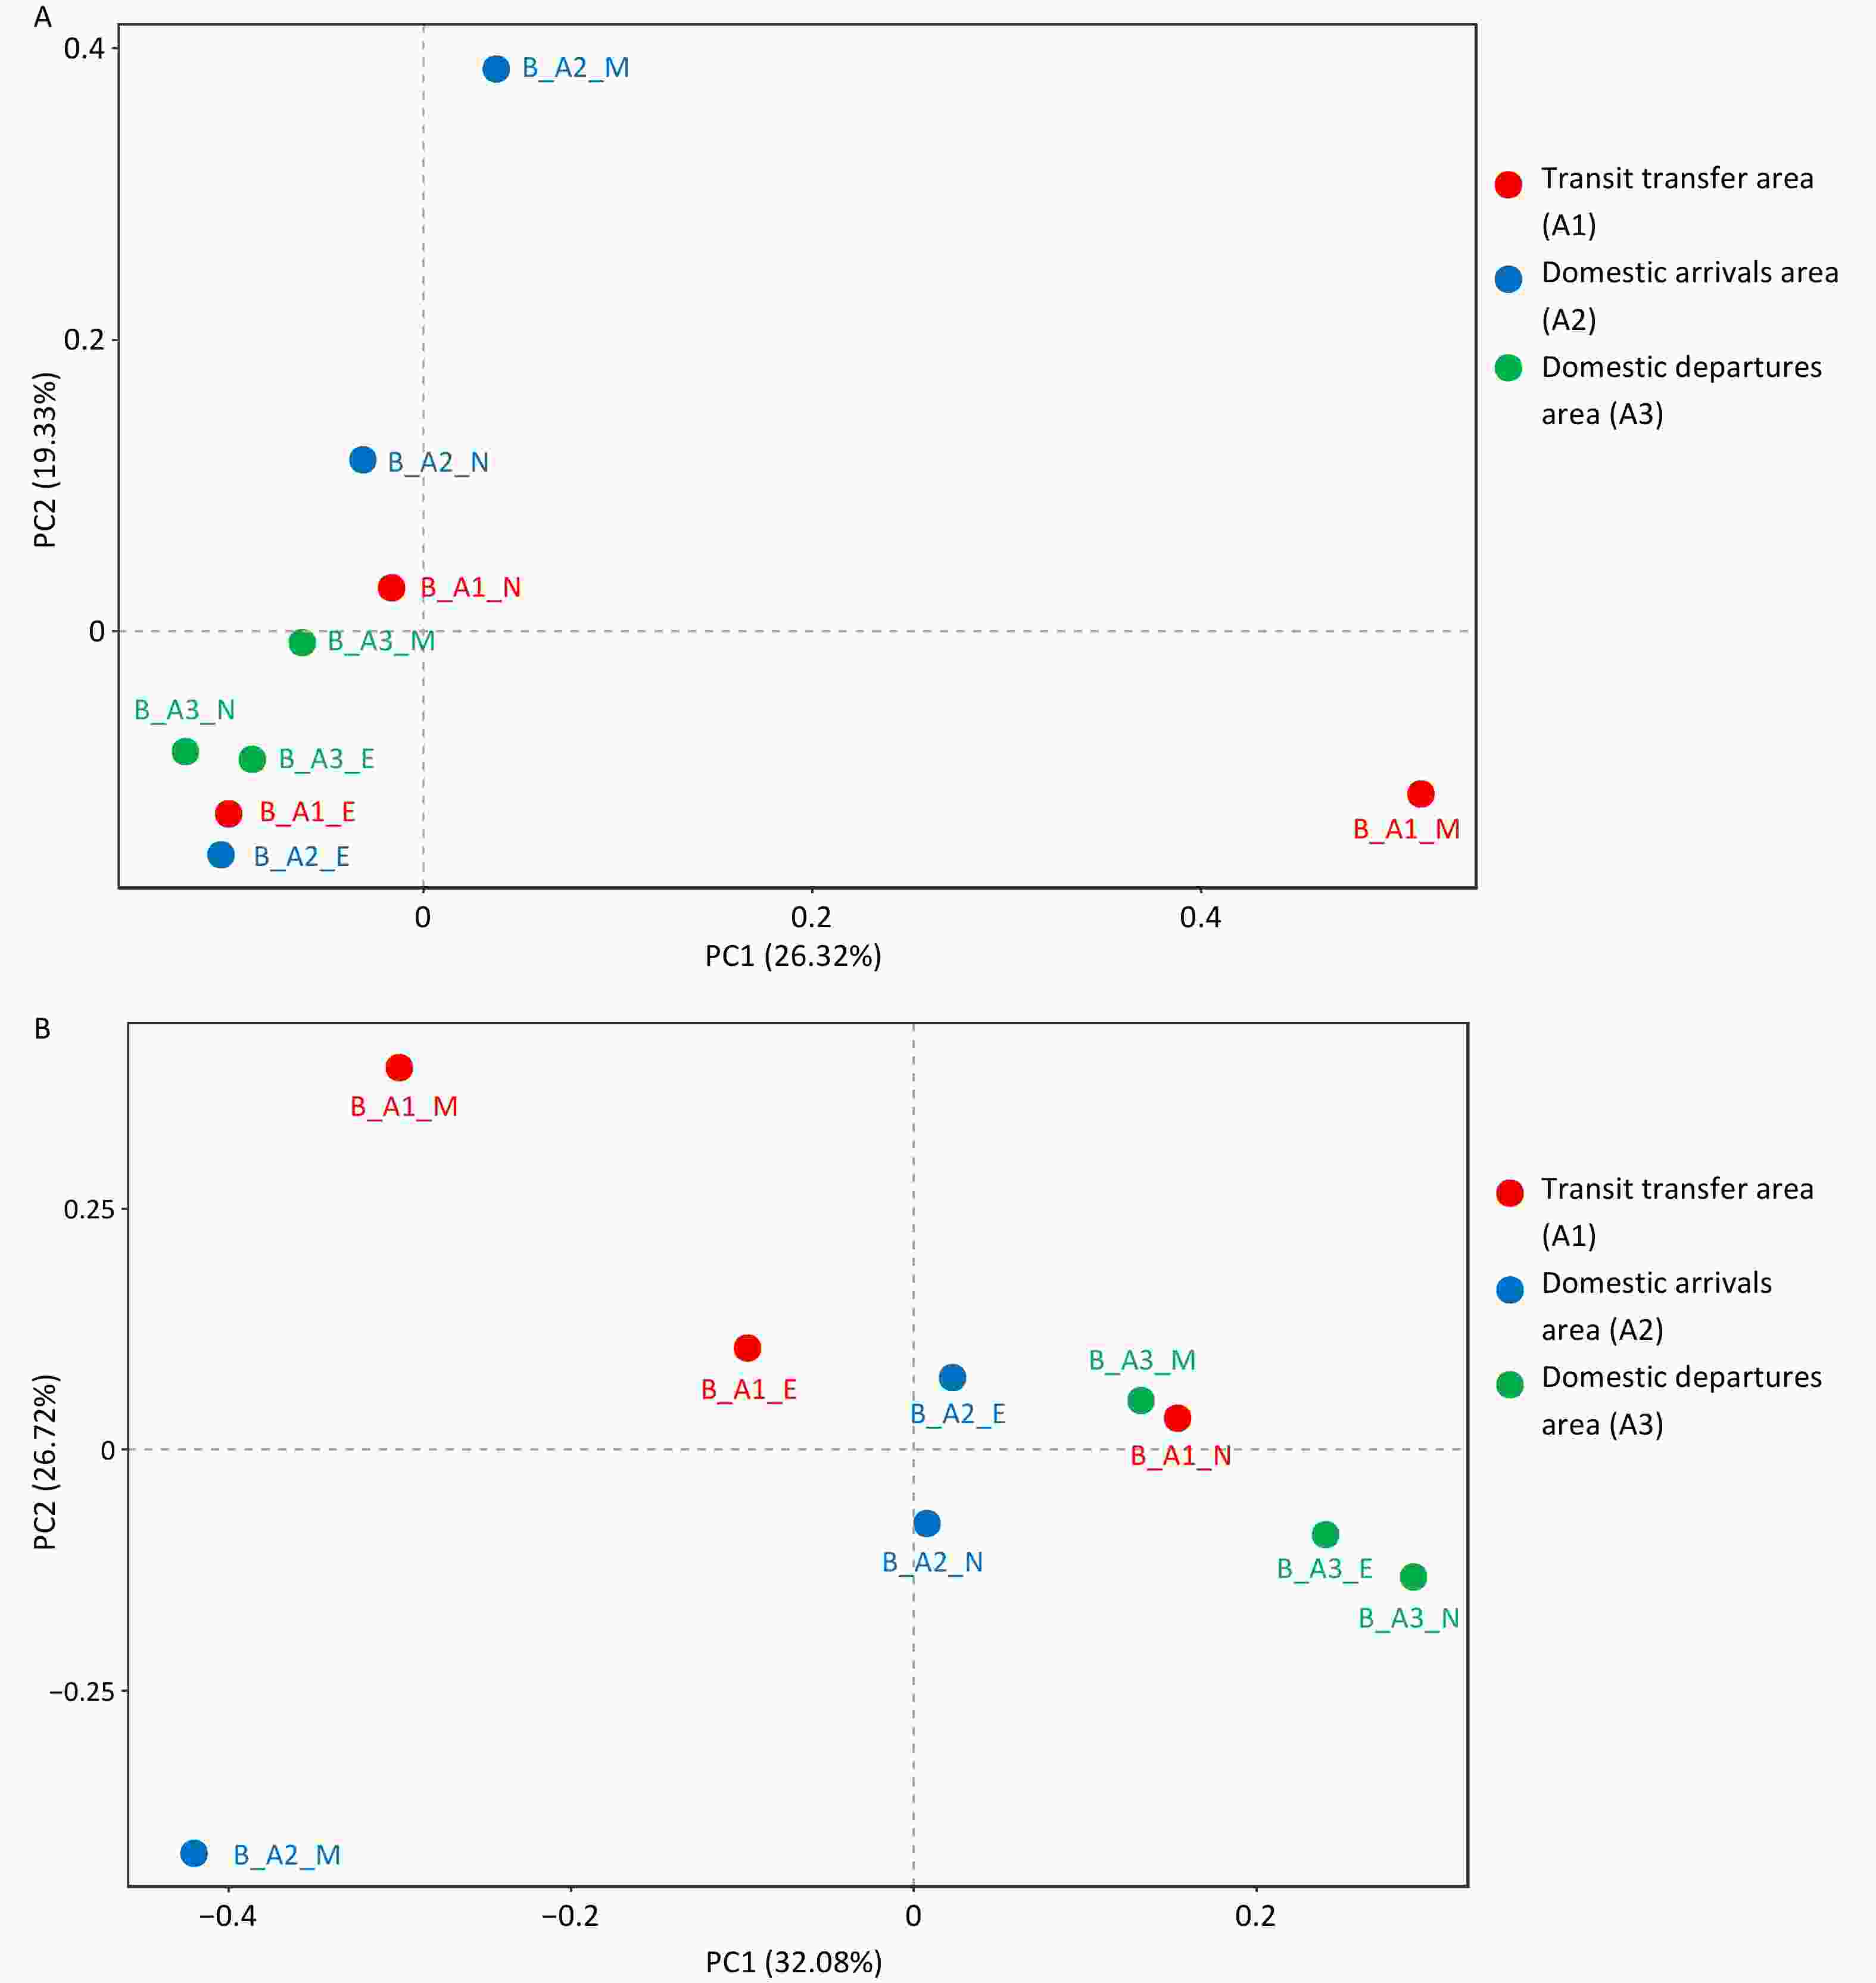
Figure 4. Differential analysis results of bacteria (A) and fungi (B) of airborne aerosol samples collected from different areas (transit transfer area (A1), domestic arrivals area (A2), domestic departures area (A3)).
-
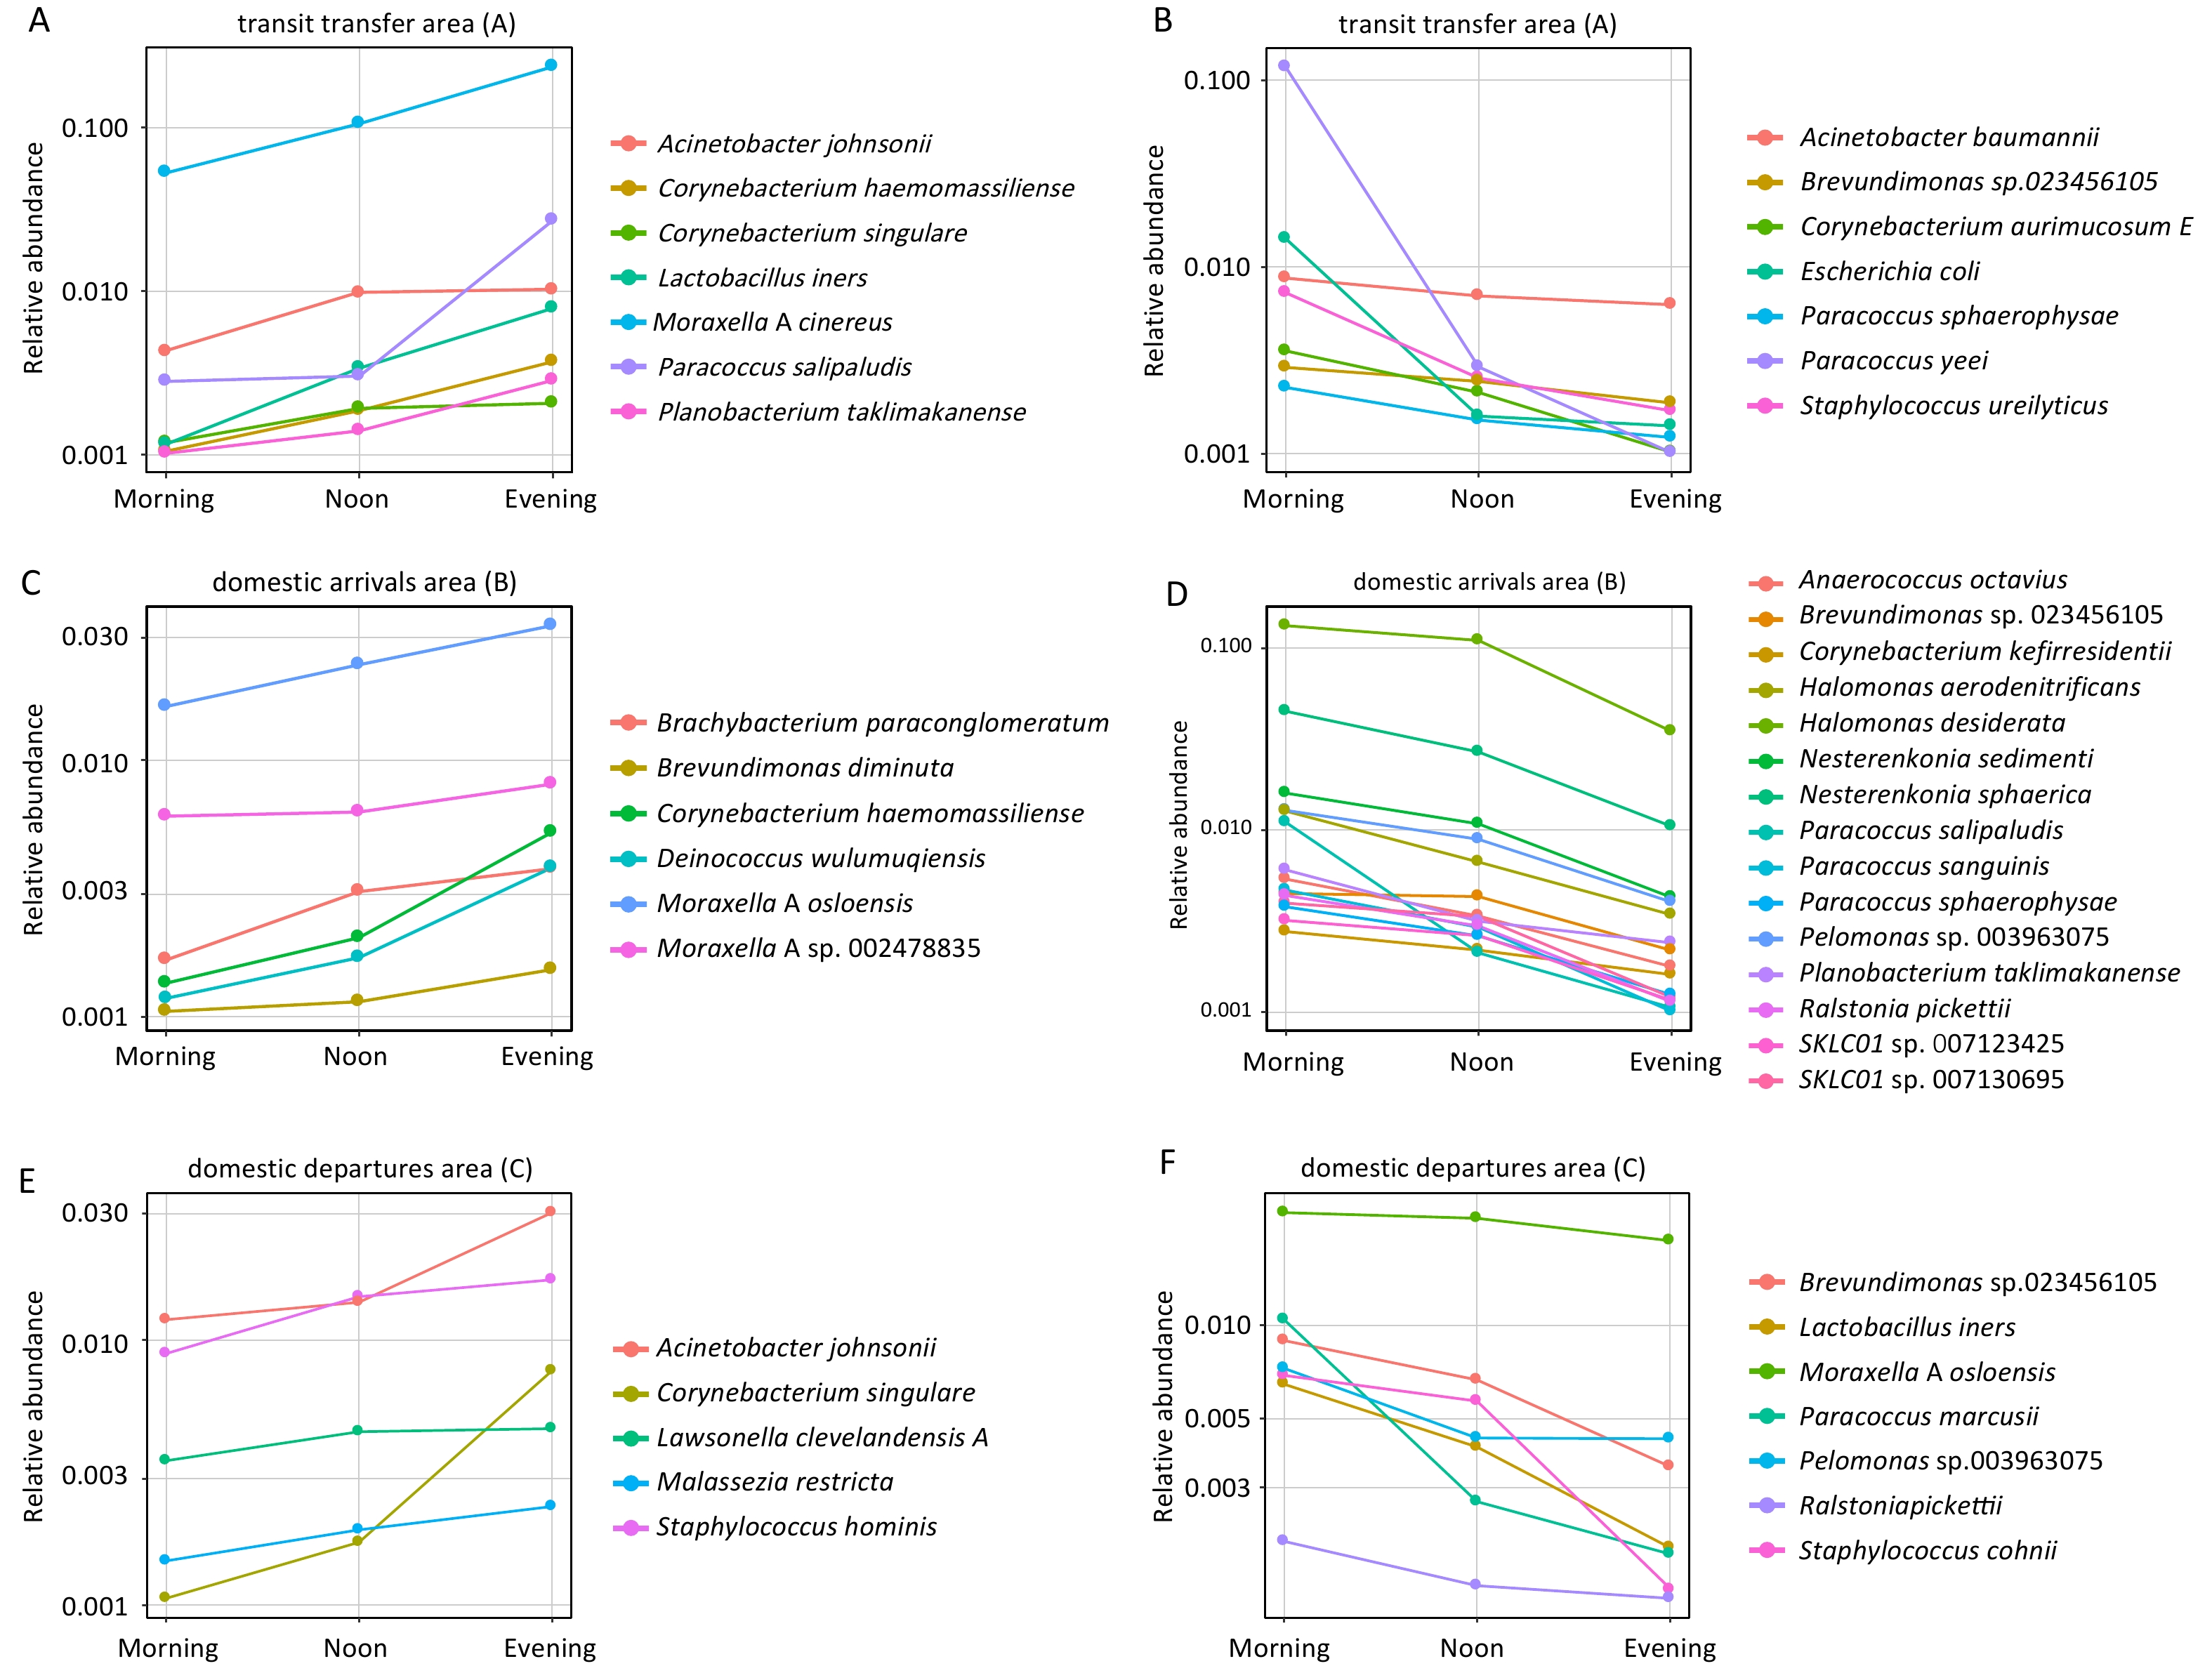
During sampling conducted in the morning, noon, and evening, species with relative abundances greater than 10-3 and exhibiting monotonic increases or decreases from morning to evening were selected, and temporal trend lines were plotted, as shown in Figure 5. In the transit transfer area (A1), the relative abundance of 7 species increased over time. Among these, Lactobacillus iners and Moraxella A cinereus showed evening abundances that were 6.78-fold and 4.45-fold higher than those observed in the morning, respectively. Paracoccus salipaludis exhibited the most pronounced increase, reaching a relative abundance 9.65 times higher in the evening than in the morning. In contrast, seven species showed decreasing trends, with Paracoccus yeei displaying a marked decline of 99%. In the domestic arrivals area (A2), six species exhibited increased relative abundance, with evening levels ranging from 1.33-fold to 3.87-fold of morning values. Meanwhile, the relative abundance of 15 species declined, with decreases ranging from 44% to 90%. In the domestic departures area (A3), five species increased in relative abundance, whereas seven species decreased. Notably, Corynebacterium singulare showed a substantial increase, while Staphylococcus cohnii and Paracoccus marcusii exhibited pronounced declines.
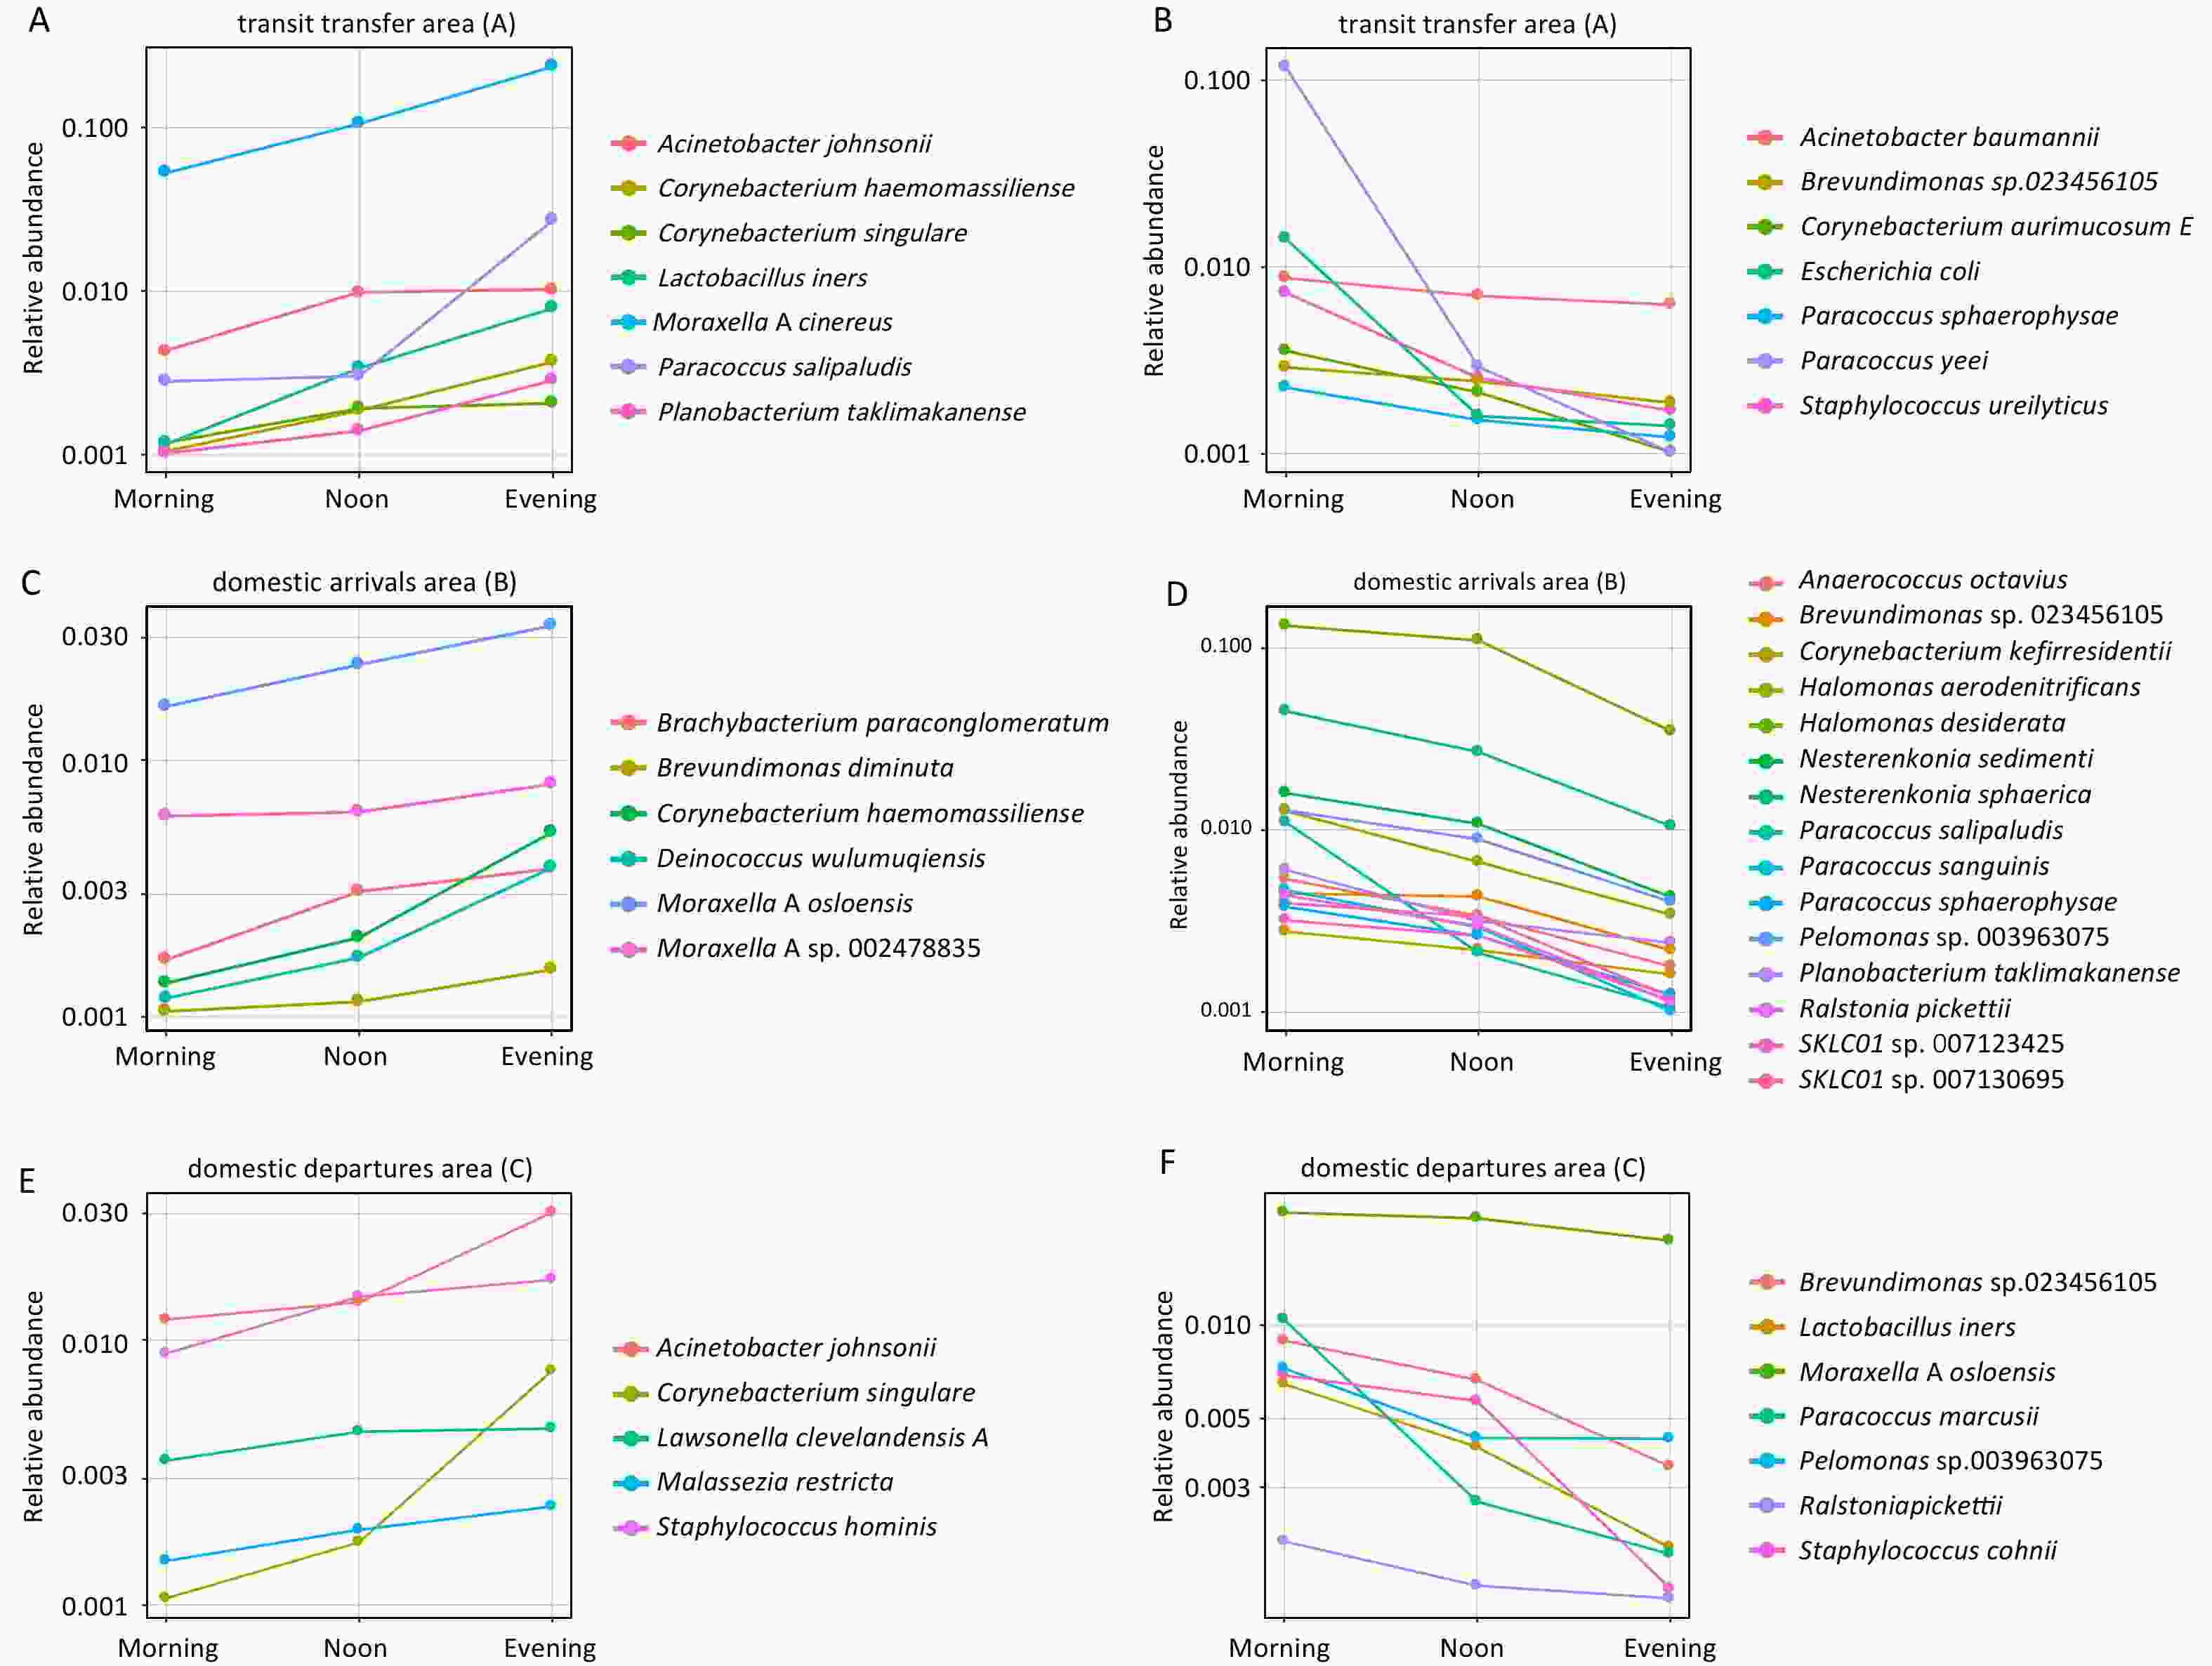
Figure 5. Trend chart of relative abundance changes for species with relative abundance > 0.001 in three areas. (A, B) transit transfer area; (C, D) domestic arrivals area; (E, F) domestic departures area.
-
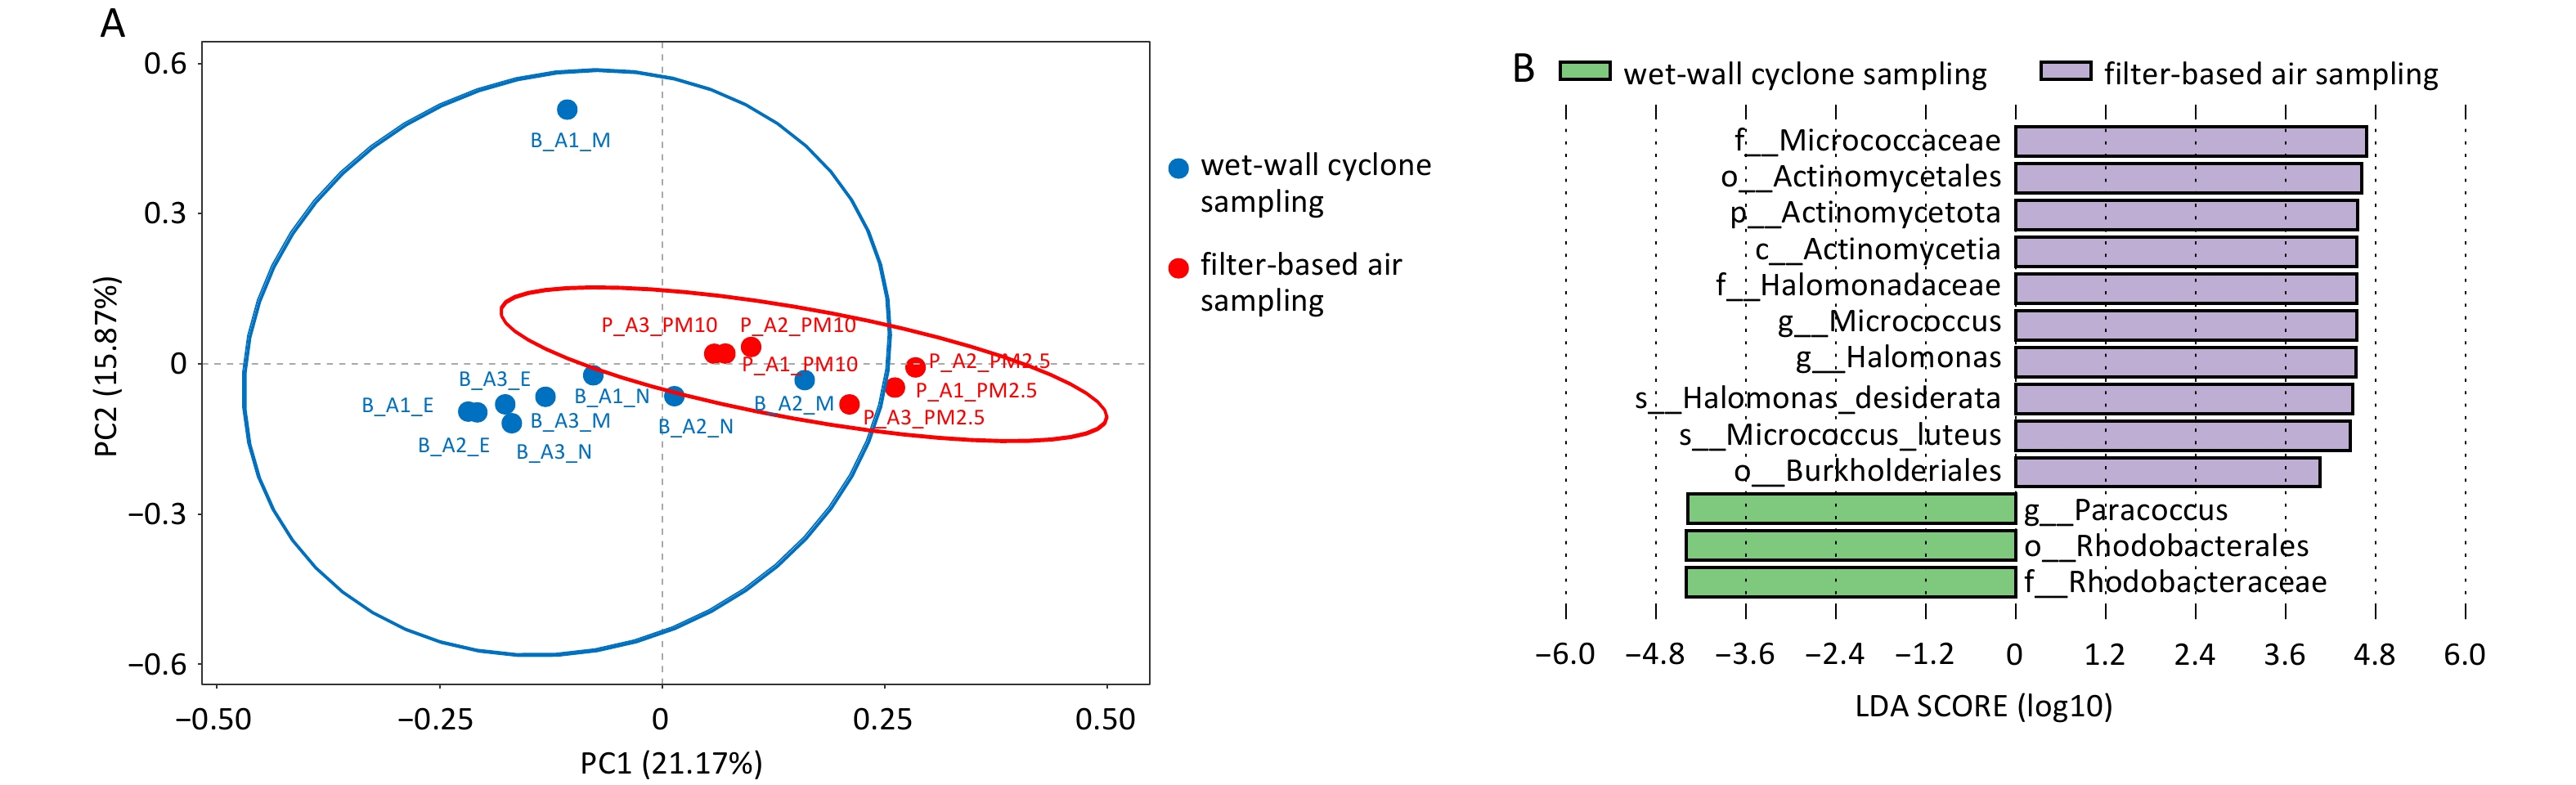
Differences between sampling methods were evaluated under real field conditions, with sampling parameters and results summarized in Table 4. Because sampling volumes differed between methods, microbial abundance was compared on a per unit volume basis. Filter-based sampling yielded a higher microbial count per unit volume (0.792/L) than cyclone sampling (0.410/L). As shown in Figure 6A, samples collected using different samplers exhibited distinct clustering patterns. To assess the effect of sampling method on microbial community structure, PERMANOVA was applied to compare communities obtained using cyclonic and filtration sampling. The results indicated that sampling method was a significant determinant of microbial community differences (R2 = 0.169, P = 0.001), suggesting method-specific biases in the capture of airborne microorganisms. LEfSe analysis further identified differentially enriched taxa (Figure 6B). At the phylum level, Actinomycetota was identified as a differential phylum and was more abundant in filter-based samples. At the genus level, Halomonas, Micrococcus, and Paracoccus were identified as differential genera. Among these, Halomonas desiderata and Micrococcus luteus showed higher relative abundances in filter-based samples.
Sampling parameters Cyclonic sampling Filtration sampling Collection Medium Viral preservation liquid Filter membrane Sampling Flow Rate/L/min 400 10 Sampling Time/min 40 570 Sampling Volume/L 16,000 5,700 Number of Collections/times 3 2 Microorganisms Detected (count) 6,557 4,512 Microorganisms Detected per Unit Volume (count/L) 0.410 0.792 Table 4. Sampling parameters and microbial detection results for different sampling methods

Figure 6. Differential analysis of microorganisms in wet-wall cyclone sampling samples and filter-based air sampling samples. (A) Principal Coordinate Analysis (PCoA) results at species level; (B) LEfSe analysis results of microorganisms at different taxonomic levels.
-
This study reveals distinct characteristics of microbial community composition in airport terminal environments. Airborne communities were dominated by bacteria, with Pseudomonadota, Actinomycetota, and Bacillota as the predominant phyla. Owing to the limited number of studies conducted in airport settings, comparisons were made with other transportation hubs. While overall patterns were broadly consistent with observations from public transportation environments such as subways and train stations, the dominant taxa differed among locations. For example, Pseudomonadota was most abundant in the Shanghai subway[15], whereas Actinomycetota, Pseudomonadota, and Bacillota predominated in the subways of Bangkok[17] and New York[25]. These differences likely reflect city-specific conditions as well as variations in hub design and operation[26]. The predominance of genera such as Moraxella A and species including Moraxella cinereus and Moraxella osloensis within Pseudomonadota likely reflects the continuous release of human commensal bacteria into the air through respiration, skin shedding, and clothing friction, followed by dispersion under airflow. In addition, the tolerance of Halomonas desiderata to high-salinity conditions may confer a selective advantage in microenvironments such as air-conditioning condensate or areas influenced by detergent residues. The presence of Actinomycetota may be linked to soil-related sources, including carpet dust, ornamental plants, or contaminants originating from air-conditioning filters. Fungal communities were dominated by Malassezia and Alternaria, differing from the Yarrowia, Cladosporium, and Hortaea-dominated profiles reported in the Bangkok subway[27]. Detection of Malassezia restricta, a human skin commensal, further suggests a strong association between fungal distribution and human activity. In contrast, Penicillium and Aspergillus-dominated patterns reported in public transport systems in Ahvaz, Iran[28], differ markedly from the present findings, potentially reflecting regional climatic conditions such as humidity and temperature or differences in cleaning frequency. Overall, the primary sources of airborne bacteria and fungi in airport terminals appear to be both anthropogenic and natural, and human activities exerting a major influence on their distribution[10,29].
Microbial composition differed markedly between surface and airborne aerosol samples, consistent with observations from other public transport hubs[30,31]. Surface samples exhibited higher microbial diversity, in agreement with findings by Yan et al.[32] in train stations, supporting the role of surfaces as microbial reservoirs. Facility surfaces provide favorable substrates for microbial attachment and growth, enabling accumulation through repeated human contact and particle sedimentation. The dominance of Pseudomonadota in airborne aerosol samples may be related to aerodynamic properties, as bacteria within this phylum typically have diameters smaller than 5 microns, allowing prolonged suspension in air and facilitating airborne transport. The markedly higher abundances of Cutibacterium acnes and Malassezia restricta on surfaces relative to airborne aerosols indicate that high-frequency contact surfaces, such as seat armrests and touchscreens, act as exchange interfaces for human-associated microbes via sebum, skin flakes, and hair, thereby creating potential cross-contamination pathways. The biofilm-forming capacity of Cutibacterium acnes may further promote its transient persistence on abiotic surfaces. Although airborne levels of these taxa were low, their accumulation on surfaces may still pose potential risks to immunocompromised individuals, including those with atopic dermatitis.
-
Previous studies have shown that pathogen transmission is influenced by environmental factors and population density[33,34]. In this study, sampling was conducted in three distinct areas of the airport at different times on the same day. The results indicated that microbial diversity varied among areas, with the transit transfer area (A1) exhibiting higher microbial species richness than the other locations. Comparison of environmental monitoring data revealed minimal temperature differences among the three areas, with little temporal variation within each area. In contrast, wind speed differed substantially, with A1 showing notably lower wind speed than A2 and A3, while relative humidity was slightly higher. In addition, the mean number concentration of bio-particles in A1 exceeded that of the other two areas. As a major transit hub, A1 experiences high occupant density and frequent movement. Its relatively limited ventilation may facilitate microbial accumulation and transmission, thereby contributing to the higher community richness observed in this area.
Across the three areas, the relative abundances of multiple microorganisms showed consistent increases or decreases over the course of the day, a pattern likely associated with human activity within the airport. In A1, the abundances of seven species, including Lactobacillus iners, Moraxella cinereus, and Paracoccus salipaludis, increased markedly, suggesting that these taxa originate from the human body, such as the skin or respiratory tract, and are continuously introduced and enriched in the ambient air as passenger numbers increase. Conversely, several species, including Paracoccus yeei, showed sharp declines of up to 99%, possibly reflecting suppression of environmental sources, such as soil, through cleaning and ventilation. Similar activity-related selection effects were also observed in A2 and A3.
Although species richness differed among the three areas, no statistically significant differences were detected in overall bacterial or fungal abundance. This finding is consistent with observations from the Barcelona subway environment[35] and may reflect rapid bacterial diffusion in air, resulting in relatively uniform abundances across areas. Fungi, which are primarily dispersed as spores, differ from bacteria in their transmission dynamics. Spore dispersal is strongly influenced by airflow patterns and humidity. The absence of significant spatial differences may therefore be attributable to the low overall abundance of fungi.
-
Different air sampling methods vary in capture efficiency, particle size selectivity, and their influence on estimates of microbial relative abundance, thereby affecting characterization of microbial diversity. The cyclone sampler used in this study, characterized by a high flow rate and short sampling duration, primarily captures short-term peaks in airborne aerosol concentration. In contrast, the filter-based sampler, operating at a lower flow rate over an extended period, reflects cumulative airborne exposure. The higher microbial count per unit volume observed for filter-based sampling (0.792/L vs. 0.410/L for cyclone sampling) indicates greater efficiency in collecting microorganisms that remain suspended for prolonged periods or settle slowly. Filter sampling also more effectively captured Actinomycetota, whose spores, typically 0.6–1.3 μm in diameter, can remain airborne for extended durations[36]. Short-duration cyclone sampling may therefore underestimate low-abundance or slowly settling actinomycetes.
In addition, filter sampling directly retains microorganisms on membranes, making it more suitable for detecting desiccation-resistant bacteria. The lower flow rate of filter sampling (10 L/min) may favor inertial impaction of small particles, such as Halomonas (approximately 0.5–1.0 μm), whereas turbulence generated by the high flow rate of cyclone sampling (400 L/min) may allow smaller particles to escape. Micrococcus luteus, commonly associated with biofilms on floors or air-conditioning systems, is released gradually into the air as small fragments (1–3 μm). Extended filter sampling durations increase the likelihood of capturing such intermittently released particles, whereas short-term cyclone sampling may miss peak release events. Overall, cyclone sampling tends to favor larger particles (> 2 μm), while filter-based sampling is more sensitive to smaller microorganisms. Prolonged sampling times, such as the 570 min used for filter sampling, further enhance detection of low-abundance taxa through cumulative concentration effects.
No single sampling method is suitable for comprehensive collection and analysis of all bioaerosols types[23]. Selection of sampling approaches should therefore be guided by specific research objectives[37,38]. When microbial culturability or infectivity must be preserved, cyclone samplers using liquid media are preferable. For long-term monitoring, filter-based samplers provide greater continuity. Furthermore, in selecting filter samplers, microbial particle size distributions should be considered[39,40]. For example, Chen et al. reported that 36%–76% of outdoor airborne microbes were deposited on sampler stages corresponding to aerodynamic diameters of 0.65–4.7 μm. Other studies have shown that bacterial particle sizes in subway environments are mainly concentrated between 1.1 and 3.3 μm during daytime hours, whereas particles larger than 3.3 μm account for a greater proportion at night[29].
-
This study identified multiple WHO Critical and High priority bacterial and fungal pathogens in the airport terminal environment. Although resistance gene detection was not performed, increasing pathogen resistance rates[6] indicate that the presence of these pathogens may still pose substantial public health risks. Among bacteria, Enterobacterales showed the highest detection level, with 136 species identified. As a WHO “Critical” priority pathogen group, carbapenem-resistant Enterobacterales (CRE) are associated with high lethality rates of 30%–70%[41]. When combined with the capacity for aerosol diffusion through airport ventilation systems, these pathogens present a synergistic threat, potentially leading to group exposure in enclosed spaces such as departure halls. The frequent detection of Acinetobacter baumannii (WHO Critical priority) and Pseudomonas aeruginosa (WHO High priority) in both aerosols and surface samples reflects their strong environmental adaptability[42,43]. Their capacity to form biofilms on high-frequency contact surfaces, such as seats and elevator handrails, together with aerosol dispersion via air-conditioning airflow, constitutes dual contact and airborne transmission pathways, increasing the risk of opportunistic infection among immunocompromised travelers. Detection of Staphylococcus aureus and Streptococcus pneumoniae (both WHO High priority) further indicates the potential for dissemination of respiratory pathogens in densely populated settings. Although Mycobacterium tuberculosis (WHO Critical priority) was detected at very low abundance, its airborne transmission route and the high lethality associated with rifampicin-resistant strains (RR-TB)[6] necessitate continued vigilance regarding latent infection sources introduced through international travel.
With respect to fungi, Aspergillus fumigatus (WHO Critical priority) was detected exclusively in airborne aerosol samples. Its spores, which can be transported through ventilation systems, are capable of causing invasive aspergillosis with reported lethality rates of 47%–88%[7]. Although Candida parapsilosis was detected at low airborne abundance, its strong biofilm-forming capacity may facilitate infection through respiratory colonization. Despite the absence of resistance gene data, detection of WHO Critical priority pathogens, particularly Acinetobacter baumannii, in aerosols suggests that airports may serve as important nodes for cross-border transmission of resistant strains. Comprehensive evaluation of these risks requires integration of pathogen transmission characteristics with WHO-defined priority risk levels.
-
Based on observed microbial distribution patterns and potential transmission risks, several prevention and control strategies are proposed. From an environmental management perspective, increasing indoor ventilation frequency is recommended to reduce airborne pathogen accumulation. Regular disinfection of ventilation systems, for example through hydrogen peroxide fogging, may help eliminate biofilms formed by salt-tolerant bacteria such as Halomonas and P. aeruginosa. In addition, more frequent replacement of HEPA filters during influenza seasons could further reduce aerosolized pathogen concentrations. Scheduled disinfection of high-frequency contact surfaces, including handrails and check-in counters, using chlorine-based disinfectants may suppress colonization by skin-associated bacteria such as Moraxella and C. acnes and remove biofilms formed by A. baumannii and P. aeruginosa, thereby lowering contact transmission risk.
To enhance population-level protection, improved availability of hand hygiene facilities is recommended, for example by ensuring high coverage of hand sanitizer dispensers. Provision of masks and targeted hand hygiene guidance for immunocompromised passengers may further reduce individual risk. Temporary isolation measures for passengers exhibiting respiratory symptoms could also limit transmission. In addition, establishment of a dynamic airport pathogen surveillance network incorporating metagenomic sequencing would enable monitoring of temporal changes in dominant pathogens. Such a system could support early warning of emerging infectious threats and inform optimization of prevention strategies, ultimately reducing the likelihood of public health incidents.
-
This study provides a preliminary assessment of bacterial and fungal distribution characteristics, regional variation, and sampling methodology within an airport terminal. Owing to resource constraints, the number of sampling sites and overall sample size were limited, which may not fully represent the microbial composition of the entire terminal environment. In addition, sampling was conducted over a short time period, without long-term or seasonal monitoring, restricting evaluation of seasonal variability and the sustained effectiveness of hygiene management measures. From a methodological perspective, although species-level identification was achieved, antibiotic resistance genes (ARGs) were not concurrently analyzed, limiting deeper assessment of antimicrobial resistance risks associated with the detected pathogens. Furthermore, reliance on sequencing-derived relative abundance data prevented estimation of absolute pathogen concentrations, making quantitative infection risk assessment and direct comparison with concentration-based thresholds infeasible. Finally, the relatively limited number of fungal genomes available in the RefSeq reference database constrained comprehensive characterization of fungal community diversity.
Future studies should integrate metagenomics, metabolomics, and long-term monitoring approaches to elucidate interactions between microbial functional traits and environmental factors. At the same time, standardized sampling protocols should be developed and extended to indoor environments across diverse public transport hubs, thereby providing a more robust scientific basis for environmental management and public health prevention and control. In particular, metagenomic sequencing should be applied to directly characterize environmental resistomes, enabling comprehensive surveillance and assessment of antimicrobial resistance dissemination in public spaces. Incorporation of absolute quantification methods, such as qPCR, to validate selected target microorganisms is also essential. This integrated strategy would allow clearer differentiation between the effects of sampler physical collection efficiency and downstream bioinformatic analysis, resulting in a more robust comparison of sampling method performance. Ultimately, combining absolute quantification with metagenomic approaches to generate concentration data, together with development of comparable datasets across critical indoor environments, will support more precise evaluation of public health risks.
-
This study systematically characterized the distribution of bacterial and fungal communities across different areas of an airport terminal and conducted a preliminary assessment of WHO-listed bacterial and fungal pathogens. By integrating airborne aerosol and surface sampling, it highlighted potential risks associated with different transmission pathways. In addition, comparison of airborne aerosol sampling methods demonstrated method-dependent differences in bacterial and fungal detection, providing essential data for interpreting microbial distribution patterns in airport environments and informing environmental hygiene management strategies. Pseudomonadota and Actinomycetota were the dominant phyla in airborne aerosol samples, whereas surface samples contained higher proportions of human commensal bacteria, such as Cutibacterium acnes, and exhibited distinct community structures. The transit transfer area (A1) showed greater species richness, which appeared to be strongly influenced by regional environmental conditions. Owing to its cumulative sampling characteristics, filter-based sampling demonstrated superior capture efficiency for Actinomycetota and small-particle microorganisms, including Halomonas desiderata, relative to cyclone sampling. Detection of multiple WHO Critical and High priority pathogens, such as Acinetobacter baumannii and Aspergillus fumigatus, together with their environmental persistence and aerosol diffusion potential, suggests dual contact and airborne transmission risks. Establishment of a continuous pathogen surveillance network, coupled with timely risk warnings and implementation of measures including enhanced ventilation and disinfection, targeted cleaning of high-frequency contact surfaces, and improved hand hygiene provision, is therefore recommended to interrupt potential transmission chains, reduce pathogen spread, and safeguard public health within airport settings.
Microbial Diversity in Airport Terminal Environments and Potential Aerosol Transmission Risks
doi: 10.3967/bes2026.018
- Received Date: 2025-06-17
- Accepted Date: 2026-01-26
-
Key words:
- Airport terminal /
- Microbial diversity /
- Aerosol and surface sampling /
- 2bRAD-M /
- WHO priority pathogens /
- Transmission risk
Abstract:
| Citation: | Zhuona Zhang, Qin Wang, Xiaoyan Dong, Xia Li, Bo Lu, Dongqun Xu. Microbial Diversity in Airport Terminal Environments and Potential Aerosol Transmission Risks[J]. Biomedical and Environmental Sciences. doi: 10.3967/bes2026.018

|

 Quick Links
 DownLoad: