
-
With the acceleration of population aging, frailty has become increasingly prevalent among older adults and its prevalence is expected to continue to increase. In geriatrics research, frailty has gained increasing importance, as it is associated not only with limitations in activities of daily living (ADLs), an increased incidence of falls, and reduced quality of life, but also with deteriorating social functioning, greater utilization of healthcare resources, and a higher risk of mortality[1,2]. A systematic review and meta-analysis quantitatively demonstrated that frailty assessed using the Frailty Index (FI) was significantly and positively associated with mortality risk, with each 0.01 increase in the FI, corresponding to an approximately 3.9% higher risk of death[3]. The prevalence of frailty varies substantially among populations. For example, among community-dwelling older adults, reported prevalence estimates range from 4.0% to 59.1%[4]. In low- and middle-income countries, the prevalence of frailty, when assessed using the frailty phenotype, is 17.4%, whereas pre-frailty affects 49.3% of older adults[5]. Frailty in older adults is not a static condition but a dynamic process that can either deteriorate or improve over time. Previous studies have shown that approximately 37% of individuals experience one or more transitions across the states of robustness, pre-frailty, and frailty[6]. Therefore, identifying factors associated with frailty transition among older adults is crucial for recognizing frailty and developing targeted interventions to slow or reverse its progression.
Frailty arises from the decline of multiple physiological systems and progressive functional deterioration. Thus, investigating factors associated with frailty transitions, particularly modifiable protective factors that can be improved within a relatively short timeframe for early intervention, such as disease status, functional capacity, and other socioeconomic factors, is of substantial importance[7,8]. Previous studies have generally examined the effects of protective factors on frailty or frailty transitions in isolation; however, these factors are often interdependent and cumulative. Few studies have comprehensively evaluated their combined effects on frailty transitions. This study investigated the associations between health-protective factors and frailty transitions among older adults by constructing a Protection Index (PI) based on data from the Fourth Sample Survey of the Aged Population in Urban and Rural China (SSAPUR). This study aimed to identify specific targets for frailty-related interventions and to enhance the potential to reverse or delay frailty transitions in this population. Notably, these factors may exhibit distinct associations with frailty transitions in Asian populations owing to differences in cultural contexts and lifestyle patterns.
-
The data for this study originated from the nationwide SSAPUR database of the older adult population created by the China National Committee on Ageing, administered from August 1 to 31, 2015. This nationwide survey of the older adult population comprised Chinese citizens aged 60 years and older living in mainland China. To ensure the representativeness of the samples, the survey adopted a stratified multi-stage probability proportionate-to-size sampling design and was sampled across four stages,as described in previous studies[9,10]. The sample size was 223,680 (with a total sampling ratio of approximately 1‰). The survey covered all provinces, autonomous regions, municipalities directly under the central government, and the Xinjiang Production and Construction Corps, totaling 466 counties (districts), 1,864 townships (regions) (four townships [regions] for each sampled county [district]), and 7,456 village (community) committees (four village [community] committees for each sampled township [region]). Excluding those who refused to respond to the survey, those who had died, those unavailable for contact (after being contacted at least three times), or were long-term residents of care facilities, the actual sample size was 224,142. For the first time, the survey attained nationwide coverage and is, to date, the largest database of older adults in China. The National Bureau of Statistics approved the study protocol [No. (2014)87], and the Ethics Committee of Beijing Hospital (No. 2021BJYYEC-294-01). All the participants provided written informed consent before completing the survey.
Subsequently, the China National Committee on Aging monitored the 2015 survey samples in 2016, 2017, 2018, and 2019 to dynamically understand the living conditions and health status of older adults. The monitoring survey involved tracking approximately 100 older adults who had initially participated in the 2015 survey within each county (district/city) and conducted an annual follow-up assessment. Although the sample size of the annual monitoring survey was smaller than that of the nationwide survey, the sampling design ensured that the data remained nationally representative[11]. Because the 2017 survey population overlapped more with the 2019 cohort, we used the 2017 data as the baseline and the 2019 data as the follow-up data to analyze frailty transitions in older adults from 2017 to 2019. Among the 12,788 participants assessed in 2017, 9,093 were reassessed 2 years later in 2019, excluding 3,695 older adults who were lost to follow-up. Compared with the participants who were followed up with, those who were lost to follow-up were older (72.97 ± 8.04 years vs. 71.18 ± 6.99 years), comprised a higher proportion of men [1,981 (53.6%) vs. 4,598 (50.6%)], and had a higher FI (0.16 ± 0.11 vs. 0.14 ± 0.09) and a lower PI (0.53 ± 0.11 vs. 0.55 ± 0.11) (all P < 0.05).
-
These study data, collected through household interviews and questionnaires, included demographic characteristics (e.g., age, sex, ethnicity, educational level, marital status), family status (e.g., whether living alone, children's status), health and medical status (e.g., vision, hearing, exercise, use of healthcare products, medical checkups, chronic diseases, medical consultation, medical insurance, self-assessment of health status), caregiver service status (e.g., ADLs, incontinence, use of assistive devices, life caregiving, willingness for life caregiving), economic status (e.g., income, expenditure, whether they have housing), living environment (e.g., housing area, housing conditions, satisfaction with housing), social participation (e.g., participation in public welfare activities, willingness to help older adults in difficulty), rights protection (awareness of older adults’ rights and interests, whether their legitimate rights and interests are safeguarded), and spiritual and cultural life (e.g., participation in community activities, and regular access to the Internet). Chronic diseases were defined as self-reported physician diagnoses made by hospitals at or above the county level. Symptom-based self-reports without a physician’s diagnosis were not treated as diseases for coding purposes.
-
Frailty was assessed using the FI model developed by Rockwood et al.[12]. Thirty-one variables were selected from the survey to construct the FI based on established criteria for health deficits, including a prevalence greater than 1% and a missing rate of less than 5%. According to the type of variable, health deficits were coded on a scale of 0 to 1 (i.e., 0 and 1 for dichotomous variables and 0, 0.5, and 1 for trichotomous variables). Each variable was assigned a value ranging from 0 to 1[13]. Notably, the FI was calculated as the number of health deficit scores divided by the total number of items considered as health deficits (31 in this study), which reflects the proportion of potentially unhealthy indicators among all health measures of an individual, ranging from 0 to 1, with larger values indicating that the more health deficits of an individual, the more frail their condition[13]. As indicated in Supplementary Table S1, the 31 variables used to construct the FI in this study included ADLs (6 items), chronic diseases (11 items), geriatric symptoms (5 items), health status and emotions (4 items), and the use of assistive devices (5 items). As in existing studies[14,15], frailty was categorized into robust (FI ≤ 0.10), prefrail (0.10 < FI ≤ 0.21), and frail (FI > 0.21) conditions based on the FI values, and frailty transitions included three frailty states (e.g., robust, prefrail, and frail) within the interconversion, including deterioration, stabilization, and improvement.
-
To better characterize frailty transition among older adults, we introduced a PI to capture the combined associations of multiple factors with potential protective relevance rather than concentrating exclusively on risk factor reduction[16]. Based on the questionnaire content, the PI comprised 20 variables (listed in Supplementary Table S2), each with a prevalence greater than 1% and less than 5% missing data. The scoring scheme for the PI variables was the inverse of that used for the FI variables. For dichotomous variables, the presence of protective factors, such as having a spouse, attaining a high school education or above, good financial status, and participation in social activities, was assigned a value of 1, whereas their absence was assigned a value of 0. Intermediate values were assigned according to the ordinal variables. The PI was calculated using the same approach as the FI; therefore, the PI values ranged from 0 to 1. Unlike the FI, where higher values indicated lower robustness, higher PI values indicated higher levels of protection.
-
SPSS v.24.0 and Matlab 2020 were used for data analysis and graphing. Missing data values were filled using the Markov Chain Monte Carlo procedure of the multiple-imputation method[17]. Measurement information was expressed as mean ± standard deviation (SD). An independent samples t-test was employed to compare the two groups, and Analysis of Variance (ANOVA) was employed to compare multiple groups. Count data were expressed as the number of cases (percentage), and the χ2 test was employed to compare the groups. Nonlinear regression techniques were used to fit age-specific FI values as a function of age (exponential function) between older adults of different sexes. The distribution of PI was determined using histograms. The PI of men and women across age groups were compared using bar charts. Pearson’s correlation was used to measure the correlation between FI and PI and to analyze the changes in the frailty state of those with different frailty degrees at baseline. Linear regression was employed to fit the PI’s mean value as a function of age. Binary and multinomial logistic regression analyses were employed to analyze the effect of the PI on frailty transition among older adults according to different frailty degrees at baseline, with frailty stability set as the reference category for frailty transitions. Differences were considered statistically significant at P < 0.05.
-
The survey was administered to 9,093 older adults aged 62–101 years, with a mean age of 71.2 ± 7.0 years; of these, 4,495 were women, with a mean age of 71.5 ± 7.2 years, and 4,598 were men, with a mean age of 70.9 ± 6.8 years. Robust, pre-frail, and frail older adults accounted for 39.3% (3,572/9,093), 45.1% (4,098/9,093), and 15.6% (1,423/9,093) of the sample, respectively. Regarding general characteristics, those who were older, women, ethnic minorities, and those living in rural areas were more likely to be prefrail and frail. Further comparisonof the general characteristics of the participants with different frailty states by sex revealed no statistically significant effect of ethnicity or place of residence on frailty among older men, whereas age was a factor influencing frailty among older men. For older women, the effects of age, ethnicity, and place of residence on frailty were significant (all P < 0.05). Additionally, concerning PI-related factors, except for physical examination in the past year, access to healthcare, and participation in a senior college/school, all PI-related factors were associated with the degree of frailty of older adults, irrespective of sex. The PI of 9,093 older adults was 0.55 ± 0.11, and the frailty degree increased with decreasing PI in both older men and women. The degree of protective factors was stratified according to the PI quartiles, the results revealed that frailty degree increased with decreasing PI levels in the whole population, and both among older men and women (Table 1).
Variables All (n = 9,093) Women (n = 4,495) Men (n = 4,598) Robust Prefrail Frail P-value Robust Prefrail Frail P-value Robust Prefrail Frail P-value N 3,572 4,098 1,423 1,481 2,157 857 2,091 1,941 566 Age (years) 69.3 ± 6.1 71.7 ± 6.9 74.2 ± 7.8 < 0.001 69.2 ± 6.2 71.9 ± 7.1 74.4 ± 7.9 < 0.001 69.4 ± 6.1 71.6 ± 6.8 74.0 ± 7.7 < 0.001 Age group (years) 60– 48.5 41.2 10.3 < 0.001 42.7 44.5 12.7 < 0.001 53.8 38.1 8.1 < 0.001 70– 33.4 49.0 17.6 26.9 52.2 20.9 39.7 45.8 14.5 ≥ 80 22.8 48.6 28.7 17.1 49.0 33.9 29.4 48.1 22.5 Sex Women 32.9 48.0 19.1 < 0.001 Men 45.5 42.2 12.3 Ethnicity Han 39.6 44.8 15.6 0.034 33.3 47.6 19.2 0.017 45.7 42.1 12.2 0.114 Minority 33.0 50.7 16.4 24.9 58.6 16.6 39.7 44.1 16.2 Residence Urban 41.2 44.1 14.7 < 0.001 35.5 46.9 17.7 < 0.001 47.1 41.2 11.7 0.071 Rural 37.3 46.1 16.6 30.1 49.2 20.6 43.9 43.2 12.9 Protective factors Education ≤ Junior high school 32.5 51.8 15.7 0.024 32.9 48.0 19.1 0.591 45.9 41.8 12.3 0.009 ≥ Senior high school 43.7 45.2 11.1 66.7 33.3 0.0 33.3 55.3 11.4 Marital status Married 43.3 43.3 13.4 < 0.001 37.7 46.5 15.7 < 0.001 47.6 40.9 11.6 < 0.001 Othera 28.2 49.9 22.0 24.4 50.6 25.0 35.9 48.4 15.8 Living alone 28.9 50.8 20.3 < 0.001 23.7 52.6 23.8 < 0.001 36.1 48.4 15.5 < 0.001 Exercise/week (times) ≤ 2 36.6 45.3 18.1 < 0.001 30.9 47.7 21.5 < 0.001 42.7 42.8 14.5 < 0.001 ≥ 3 43.0 44.8 12.2 36.2 48.5 15.3 48.8 41.5 9.6 Annual medical checkups 38.7 45.7 15.6 0.150 33.3 48.1 18.6 0.400 44.1 43.3 12.6 0.027 2-week illness history 15.5 49.8 34.8 < 0.001 13.7 48.7 37.7 < 0.001 18.0 51.4 30.6 < 0.001 Hospitalizations
of past year (times)0 45.0 42.7 12.4 < 0.001 38.1 46.3 15.6 < 0.001 51.5 39.2 9.3 < 0.001 1 24.9 54.2 21.0 20.7 56.2 23.2 28.9 52.3 18.8 ≥ 2 13.2 49.4 37.3 9.0 48.3 42.6 18.1 50.8 31.1 Medicare coverage 39.3 45.1 15.6 0.667 33.0 48.0 19.0 0.499 45.5 42.2 12.3 0.924 Medical reimbursement Convenient 39.8 45.0 15.2 < 0.001 33.2 48.2 18.7 < 0.001 46.2 42.0 11.8 < 0.001 Fair 31.9 49.5 18.6 27.2 52.4 20.4 36.8 46.5 16.7 Inconvenient 24.1 49.4 26.6 18.2 51.3 30.5 29.6 47.5 22.8 Support during illness 3.2 31.8 64.9 < 0.001 2.9 30.6 66.5 < 0.001 3.7 33.5 62.8 < 0.001 Receiving paid employment 64.2 32.2 3.6 < 0.001 55.1 38.8 6.1 < 0.001 67.9 29.5 2.6 < 0.001 Receiving pension 49.9 40.8 9.2 < 0.001 43.3 44.7 12.0 < 0.001 55.6 37.5 6.9 < 0.001 House ownership 42.5 44.2 13.3 < 0.001 36.7 46.9 16.4 < 0.001 47.4 41.9 10.7 < 0.001 Financial status Good 58.4 35.3 6.3 < 0.001 51.6 40.8 7.6 < 0.001 64.1 30.6 5.2 < 0.001 Adequate 41.1 45.9 13.0 34.3 49.3 16.4 48.0 42.4 9.6 Poor 17.1 51.5 31.4 13.9 50.3 35.8 20.4 52.7 26.9 Receiving public welfare subsidies 43.9 44.3 11.9 < 0.001 37.2 47.6 15.1 < 0.001 49.6 41.4 9.0 < 0.001 Participation in older adult associations 47.1 41.9 11.0 < 0.001 38.8 46.6 14.6 < 0.001 54.6 37.6 7.8 < 0.001 Helping other older individuals in need 41.5 44.5 14.0 < 0.001 34.8 47.8 17.3 < 0.001 47.8 41.3 10.8 < 0.001 Recreational participation 40.4 45.1 14.5 < 0.001 34.4 48.2 17.4 < 0.001 46.0 42.3 11.8 < 0.001 Regular internet access 53.8 40.0 6.2 < 0.001 45.1 48.6 6.3 < 0.001 59.0 34.9 6.1 < 0.001 Online education participation 47.6 43.5 8.9 0.003 44.1 47.5 8.5 0.003 50.8 39.8 9.4 0.391 PI 0.59 ± 0.10 0.54 ± 0.11 0.49 ± 0.11 < 0.001 0.58 ± 0.10 0.53 ± 0.11 0.48 ± 0.11 < 0.001 0.60 ± 0.10 0.56 ± 0.10 0.50 ± 0.10 < 0.001 PI level Q1 21.2 50.1 28.7 < 0.001 17.3 51.5 31.3 < 0.001 27.2 48.1 24.7 < 0.001 Q2 33.1 48.4 18.5 30.2 49.8 20.0 36.3 46.9 16.8 Q3 45.3 44.1 10.6 41.2 45.7 13.1 48.6 42.7 8.6 Q4 57.2 37.6 5.2 50.1 43.0 6.9 62.1 33.9 4.0 Note. Data in the table are presented as mean ± standard deviation or n (%). aOther marital statuses included widowed, divorced, or never married; PI: protection index. Table 1. Comparison of demographics and protective factors among older adults with different levels of frailty
-
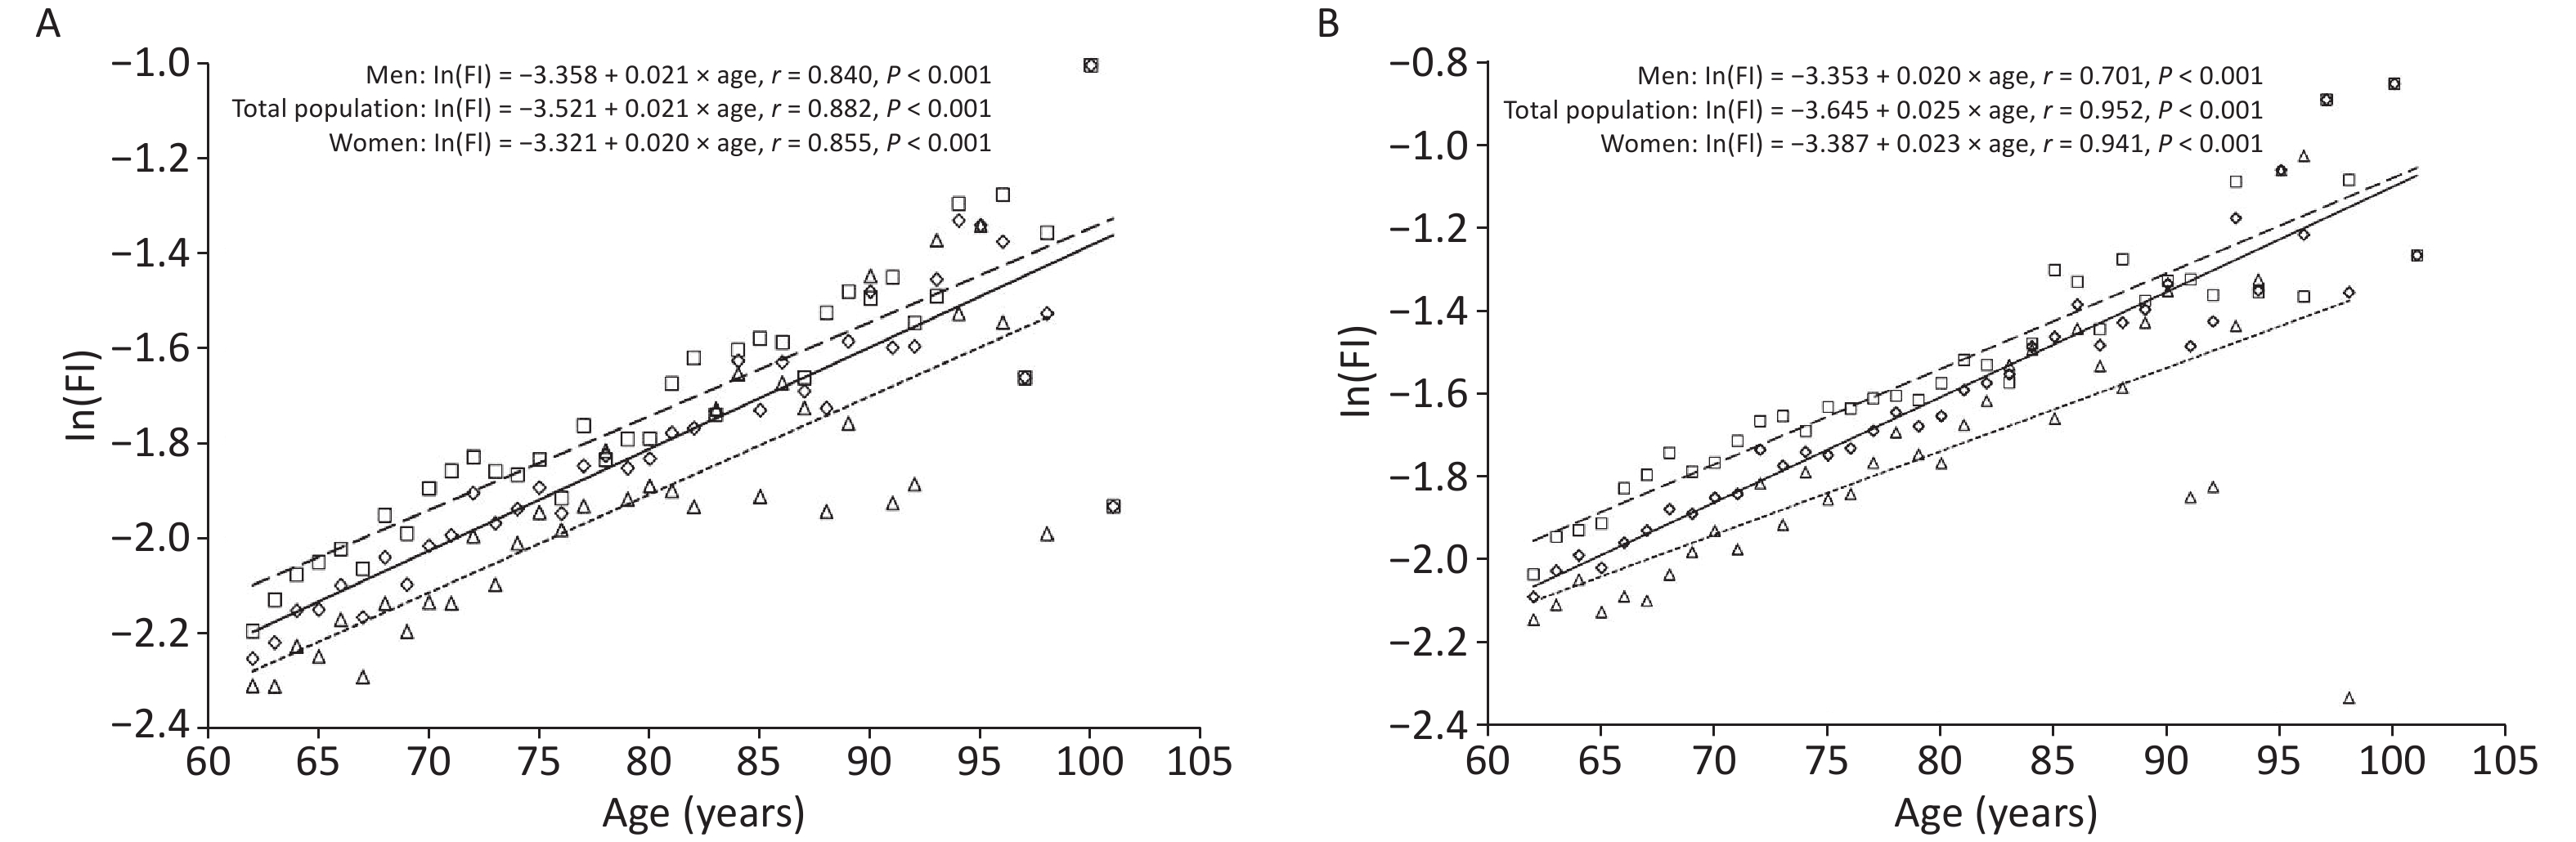
Overall, 9,093 older adults had FI values ranging from 0 to 0.76 in 2017, with a mean FI value of 0.14 ± 0.09 for the total sample, 0.12 ± 0.08 for men, and 0.15 ± 0.09 for women. Further, FI values at the 2019 follow-up ranged from 0 to 0.77, with a mean FI value of 0.16 ± 0.11 for the total sample, 0.15 ± 0.10 for men, and 0.18 ± 0.11 for women. Further analysis of the trend of FI values with age among older adults by sex revealed that FI values increased exponentially with age, both in the whole population and among older women and men: In(FI)= A + B × age. At any age, women had higher FI values than men; older women had higher frailty levels than men. However, in 2017, the mean annual relative growth rate of FI values was slightly lower among older women than among men (β = 0.020 vs. β = 0.021, t = 1.049, P = 0.206); in 2019, the mean annual relative growth rate of FI values among women was higher than that for men (β = 0.023 vs. β = 0.020, t = 5.100, P < 0.001), as indicated by the cross-sectional correlation between FI and age. That is, older women accumulated health deficits at a faster rate than older men (Figure 1A,B).
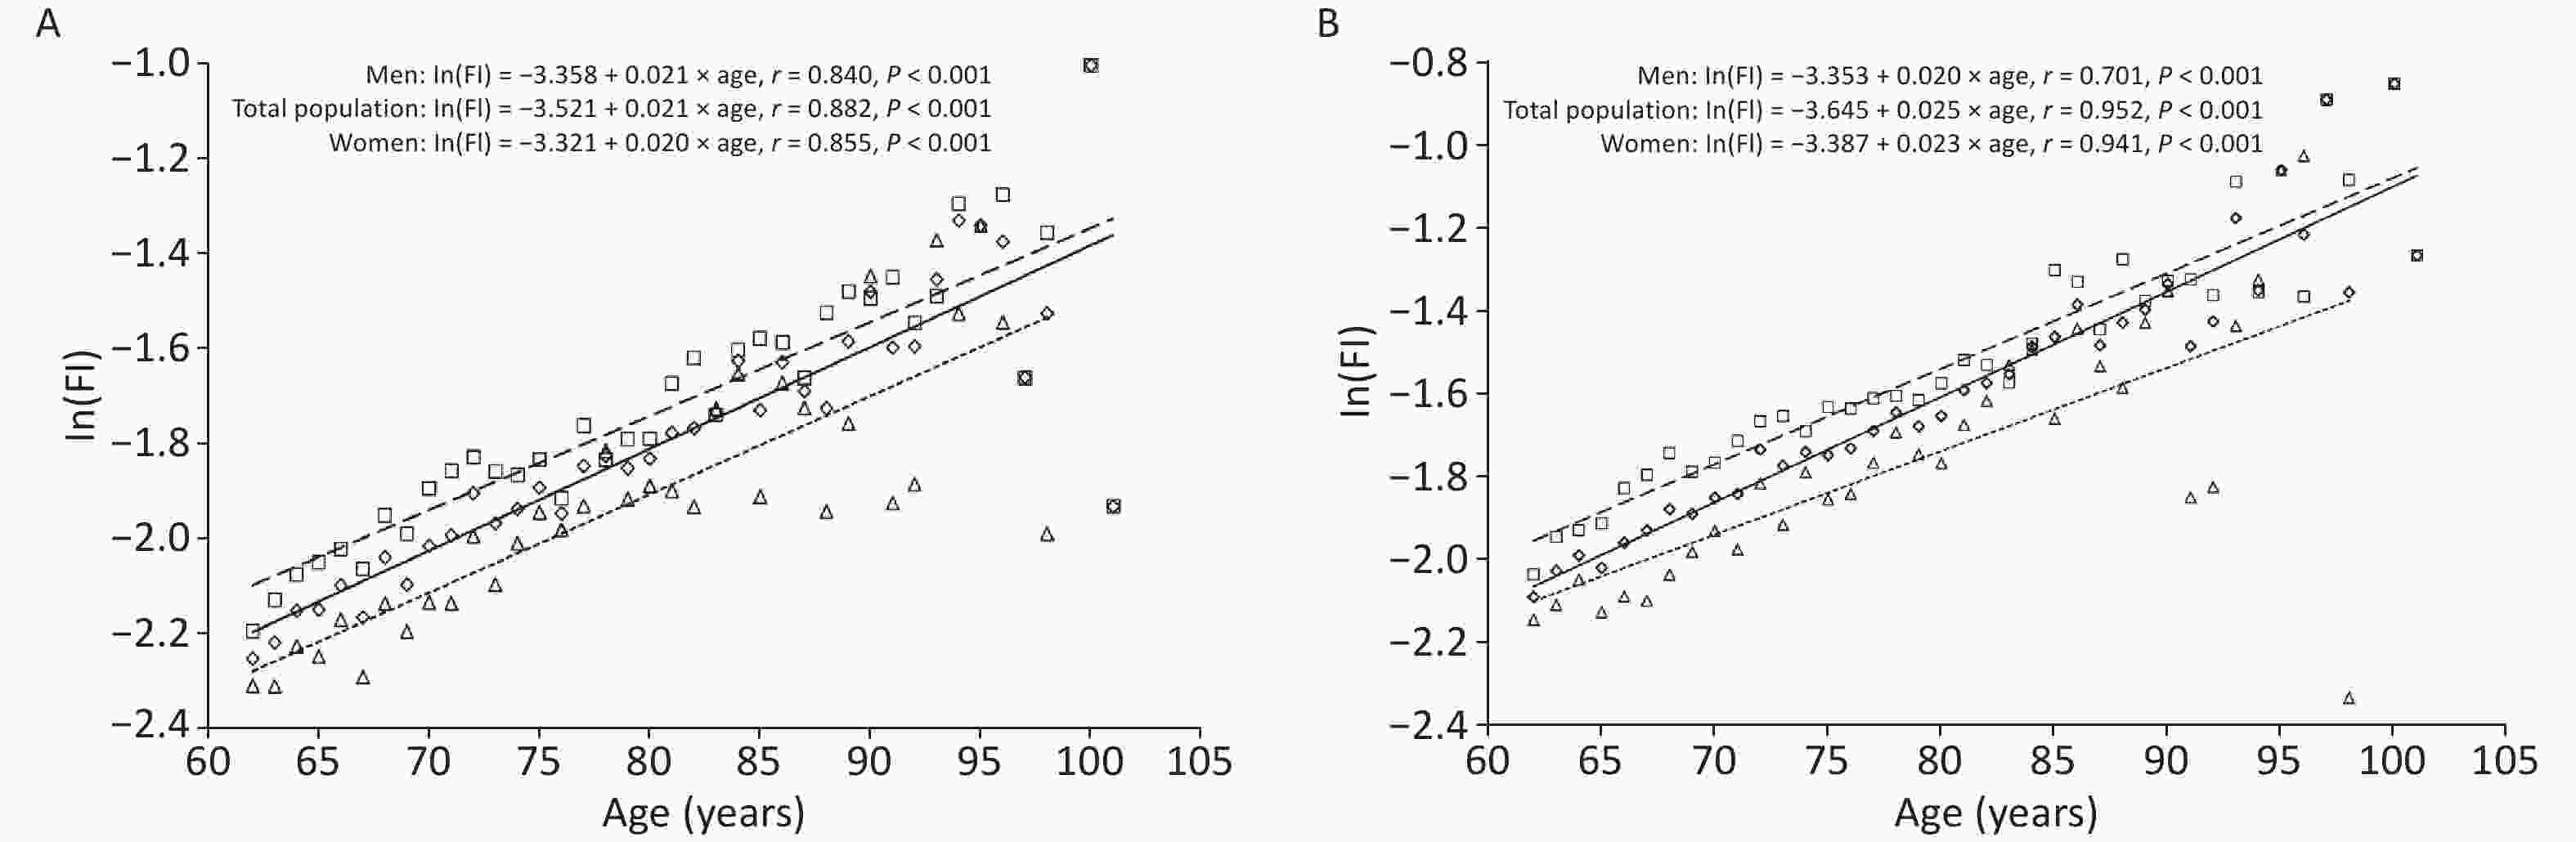
Figure 1. The relationship between age and the mean value of the frailty index (FI): Panel (A) Older adults at baseline in 2017. Panel (B) Older adults at follow-up in 2019. Total population: diamond and solid line; Women: square and dashed line; Men: triangle and dotted line.
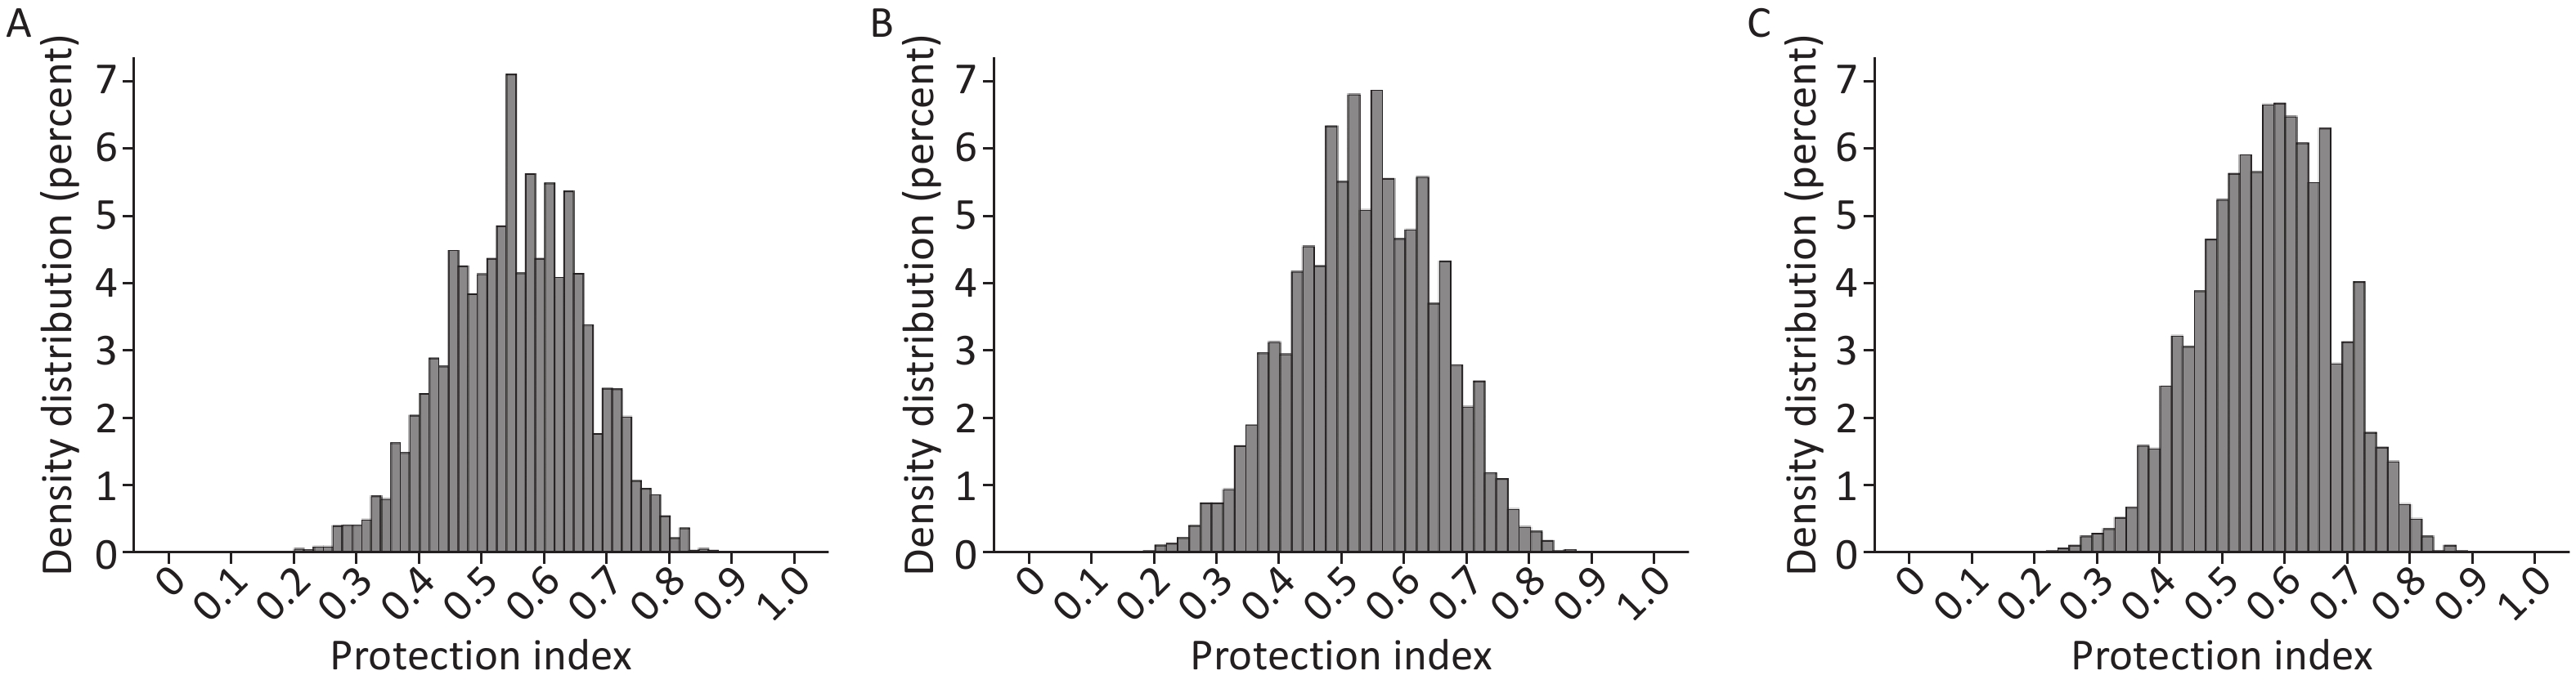
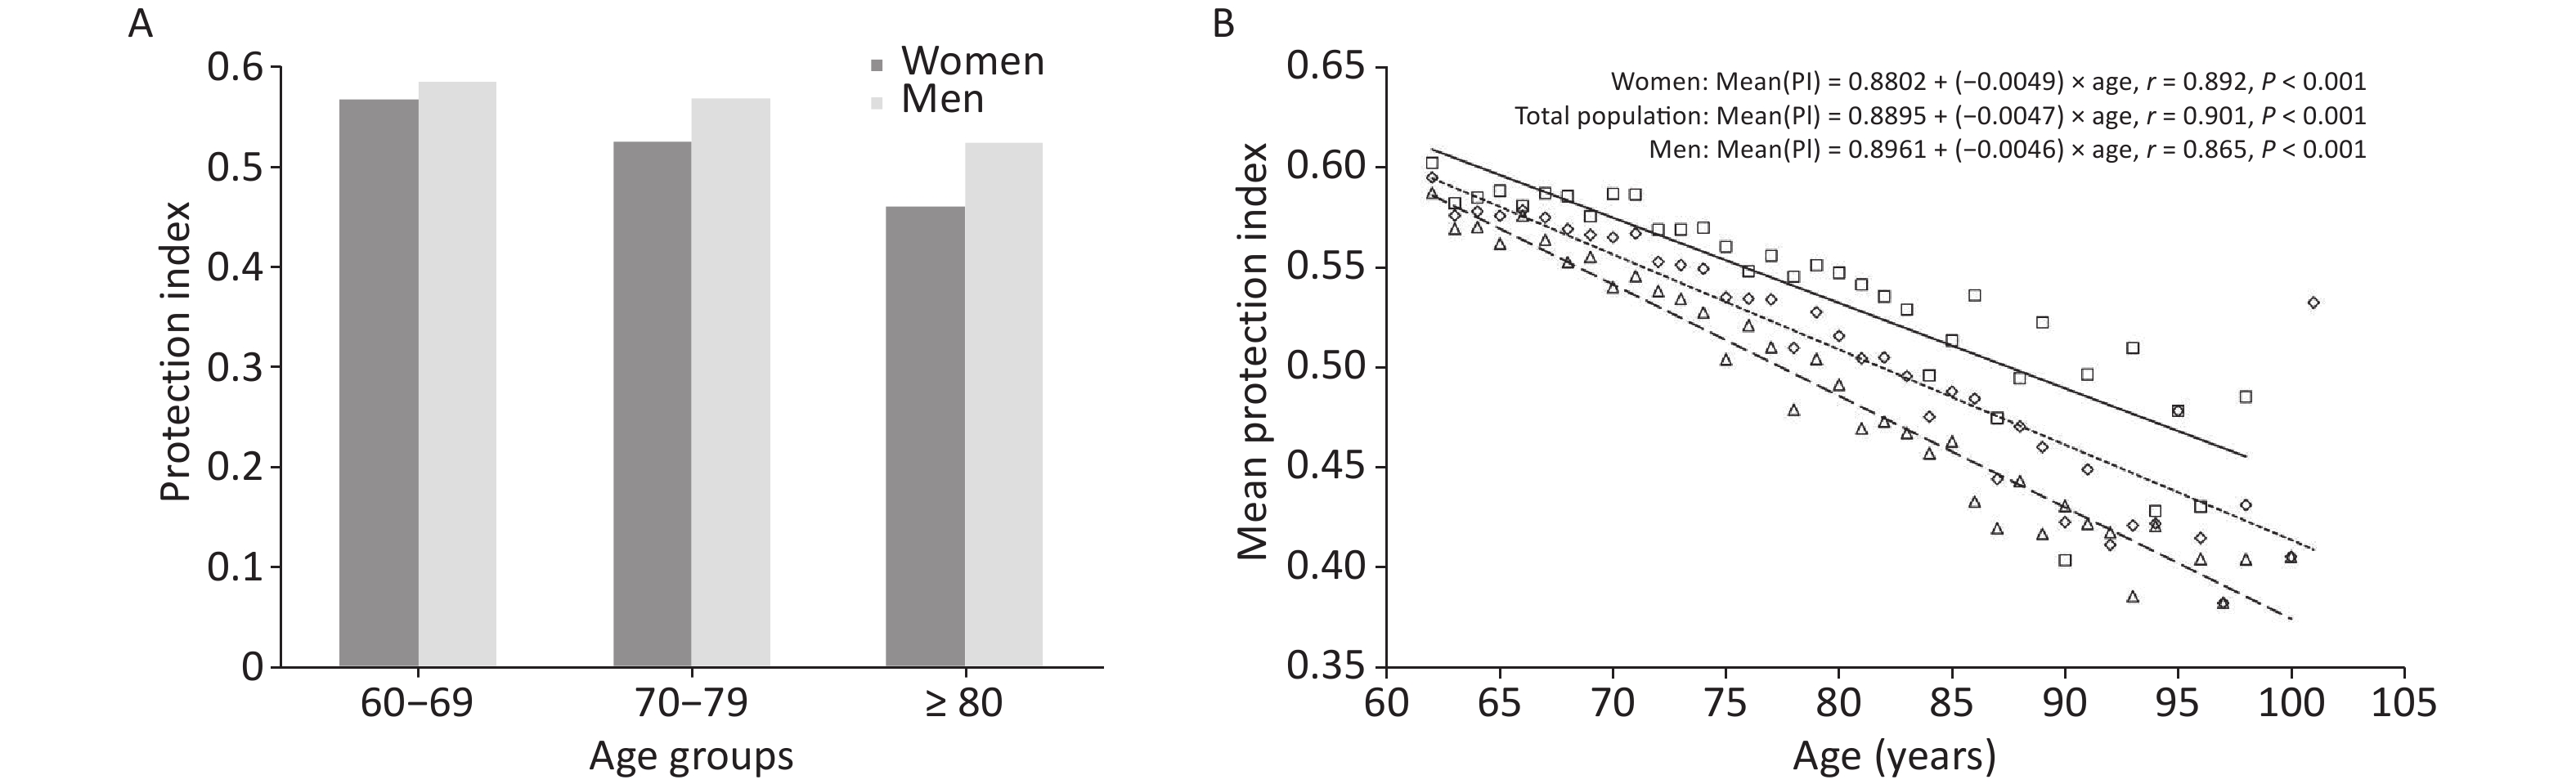
Regarding health protective factors, the PI ranged from 0.15 to 0.92, with a mean PI value of 0.40 ± 0.12, indicating that health protective factors were present to varying degrees among all the older adults (Figure 2A). The mean PI value was 0.57 ± 0.11 in men and 0.53 ± 0.11 in women, and the distribution of PI was similar among men and women (Figure 2B, C). The trend of PI with age in older adults of different sex was analyzed; the results indicated that PI decreased with age and that at any age, PI values were higher among men than among women; that is, the health protection level was higher among older men than among older women. The rate of decrease in PI values was higher among women than among men (β = 0.0049 vs. β = 0.0046, t = 9.789, P < 0.001), as indicated by the cross-sectional correlation between PI and age; that is, the health protection level declined faster among older women than among older men (Figure 3A, B). Correlation analyses showed that the PI was moderately and negatively associated with frailty among older adults (r = −0.349, P < 0.001). Similar negative correlations between PI and FI were observed in both men (r = −0.341, P < 0.001) and women (r = −0.327, P < 0.001).
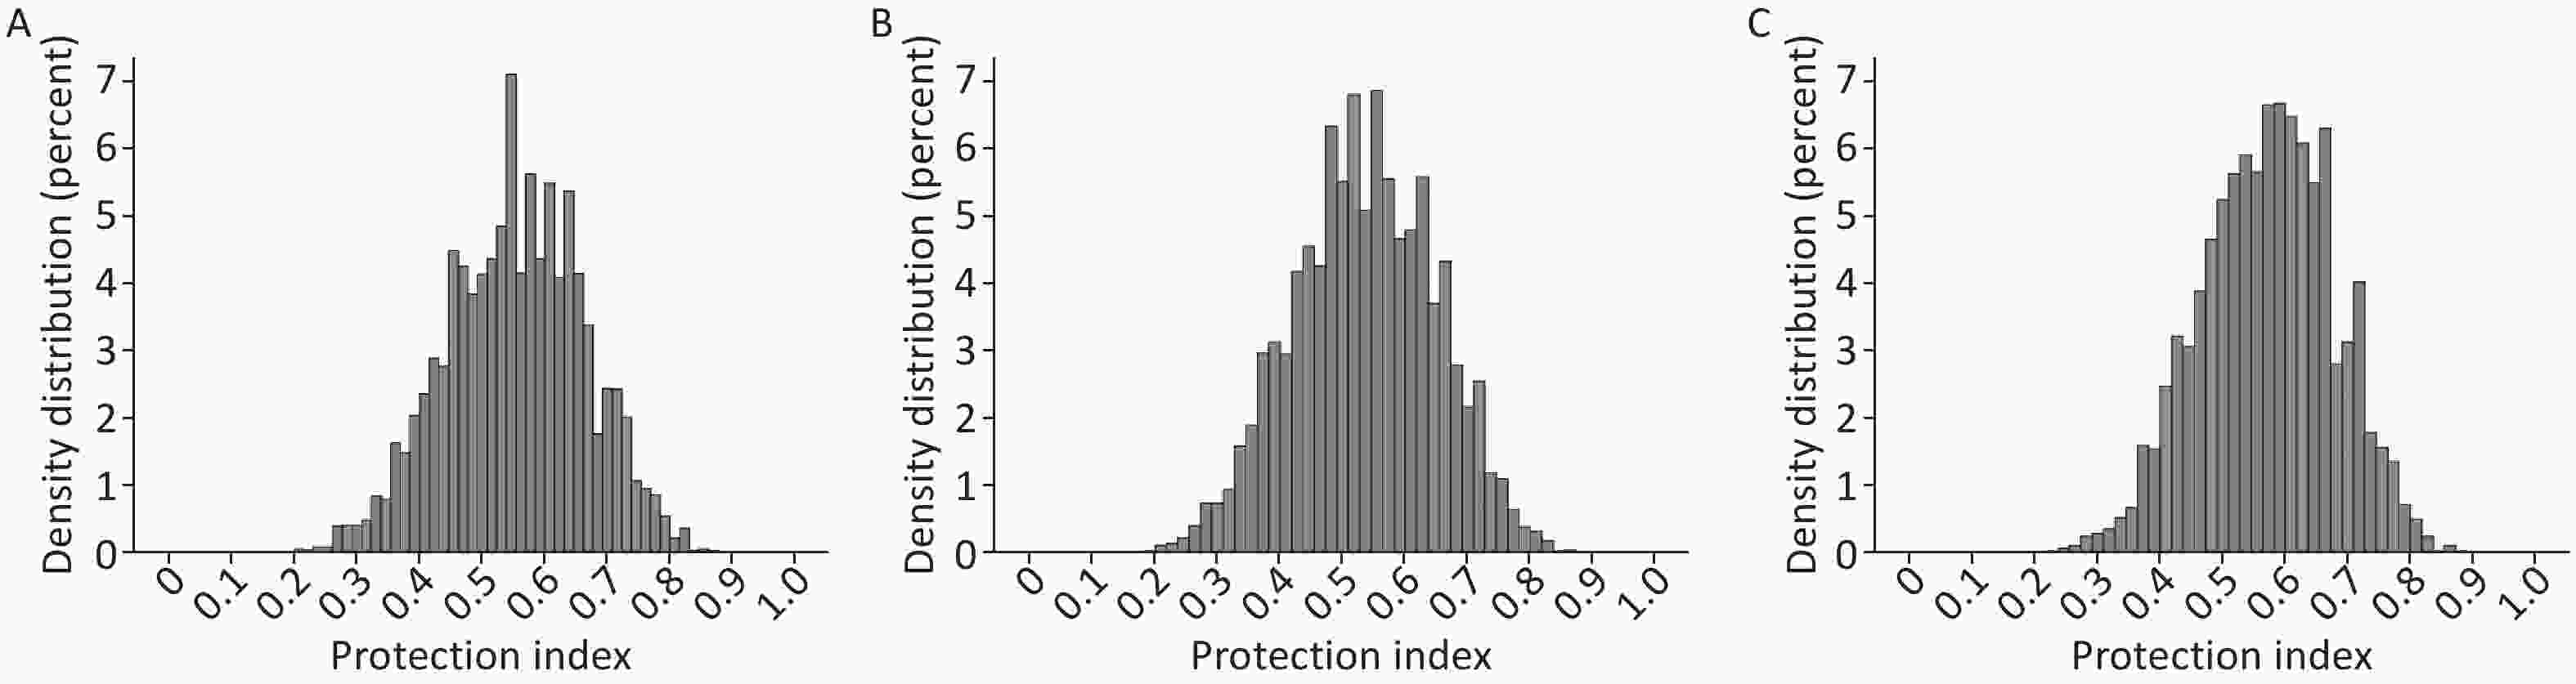
Figure 2. Distribution of the protection index: (A) Total population (n = 9,093); (B) Women (n = 4,495); (C) Men (n = 4,598).
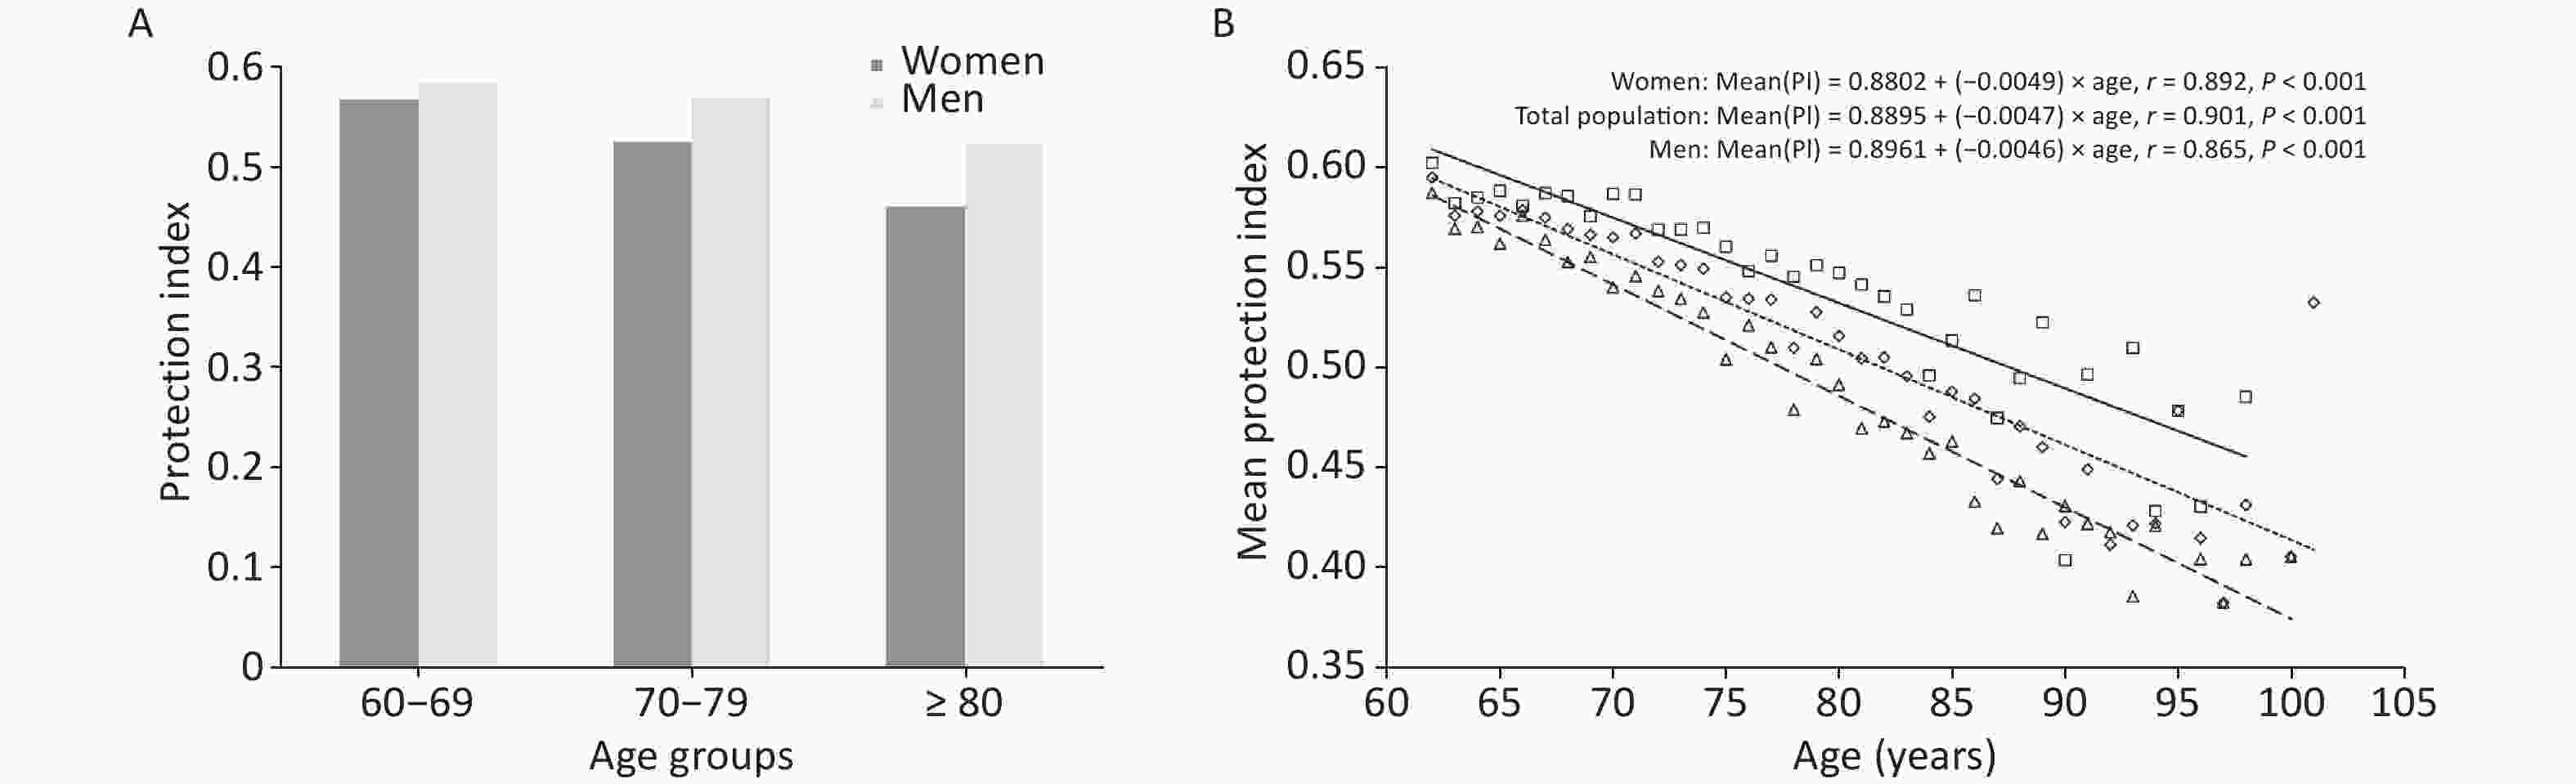
Figure 3. Mean protection index in relation to age and sex. Panel (A) Mean protection index among older adults of different agegroups. Panel (B) The relationship between age and the mean value of the protection index. Total population: diamond and dotted line; Men: square and solid line; Women: triangle and dashed line. PI, protection index.
-
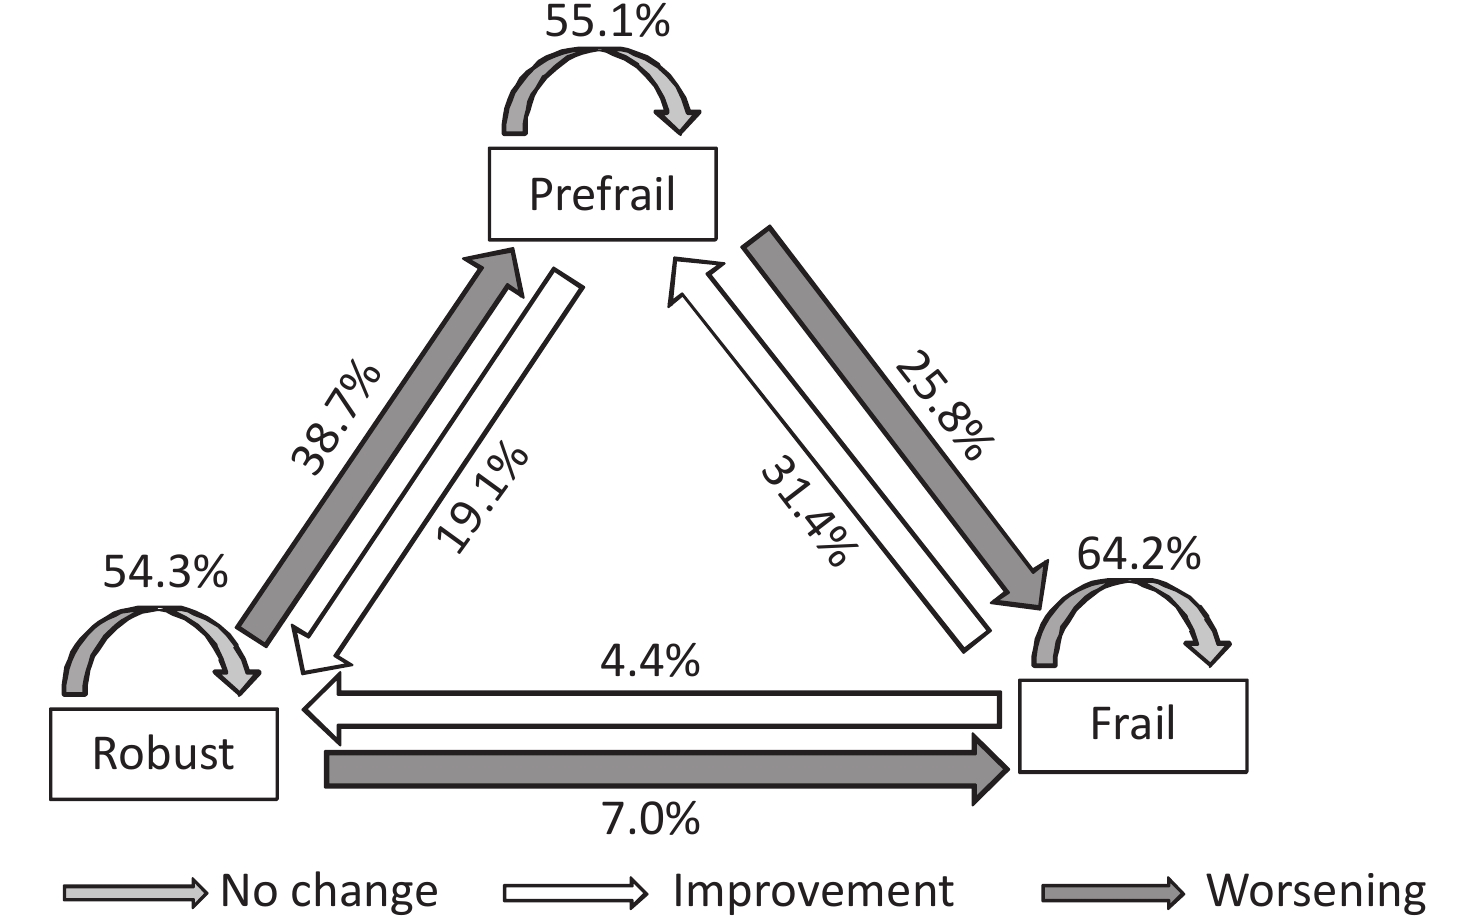
At baseline (in 2017), the proportions of older adults who were robust, prefrail, and frail were 39.3% (3,572/9,093), 45.1% (4,098/9,093), and 15.6% (1,423/9,093), respectively; in 2019, the proportions of those who were robust, prefrail, and frail were 30.6% (2,784/9,093), 45.0% (4,089/9,093), and 24.4% (2,220/9,093), respectively. During the 2-year follow-up, frailty remained stable in most participants (56.2%, 5,111/9,093), improved in 1,292 participants (14.2%, 1,292/9,093), and worsened in 2,690 participants (29.6%, 2,690/9,093). Of these, 54.3% (1,939/3,572) of older adults who were robust, 55.1% (2,259/4,098) of those with pre-frailty, and 64.2% (913/1,423) of those with frailty remained unchanged from their baseline frailty status. Regarding frailty transition, 38.7% (1,383/3,572) of older adults who were robust at baseline progressed to pre-frailty, 25.8% (1,057/4,098) of older adults with pre-frailty became frail, and 7.0% (250/3,572) of older adults who were robust progressed directly to frailty. Notably, 31.4% (447/1,423) of older adults with frailty improved to pre-frailty, 19.1% (782/4,098) improved to robustness, and 4.4% (63/1,423) returned to a robust state. Overall, negative frailty transitions(deterioration) were more common than positive frailty transitions (improvement), and transitions between adjacent frailty states occurred more frequently than transitions across multiple frailty states (3,669 [40.3%] vs. 313 [3.4%]; Figure 4).
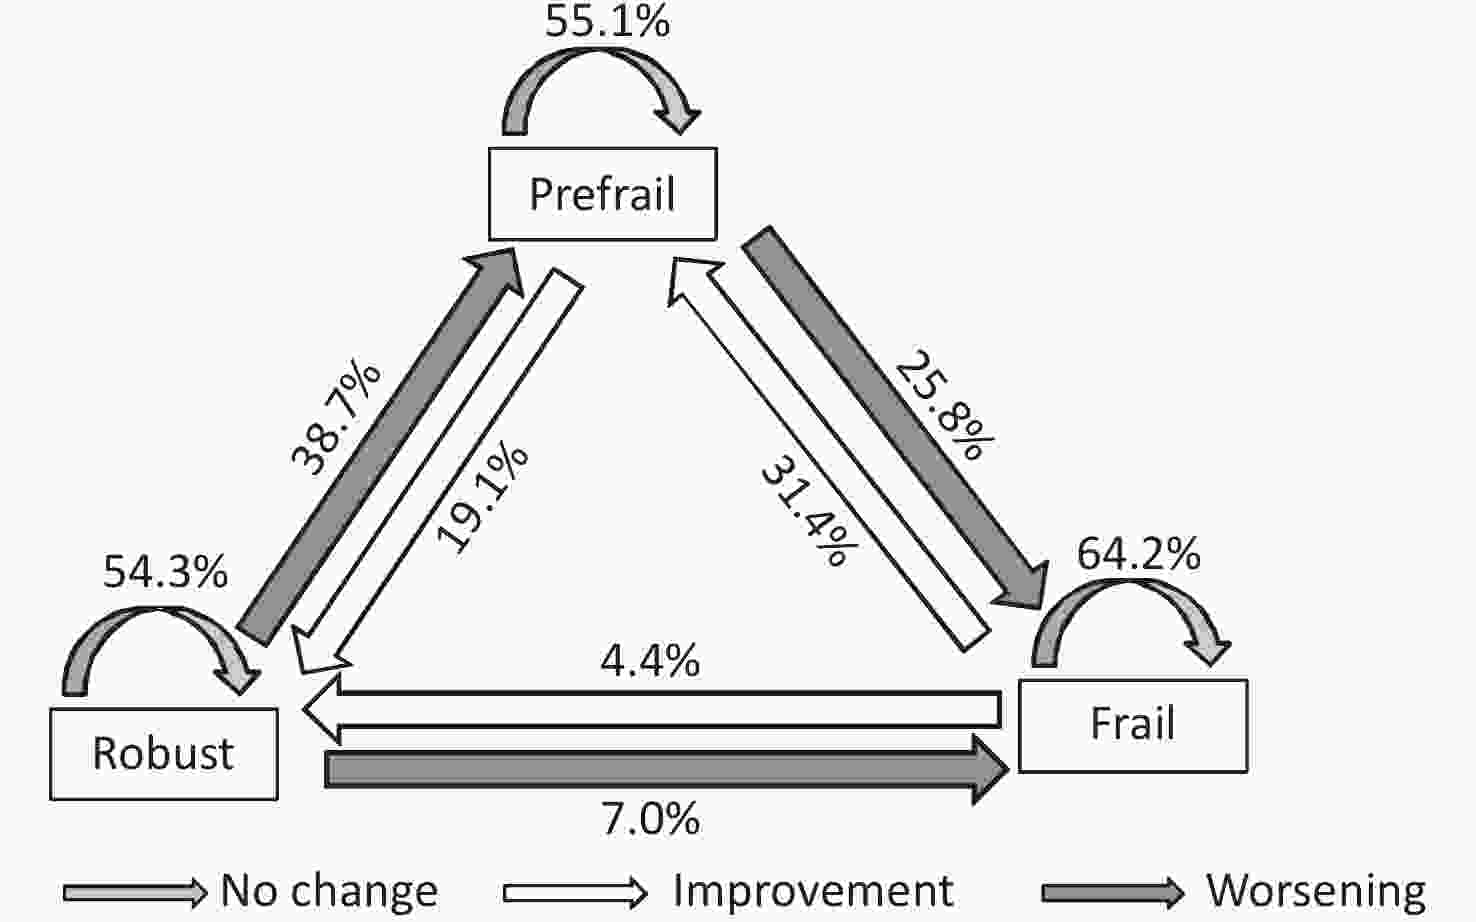
Figure 4. Transitions in frailty status at the 2-year follow-up.
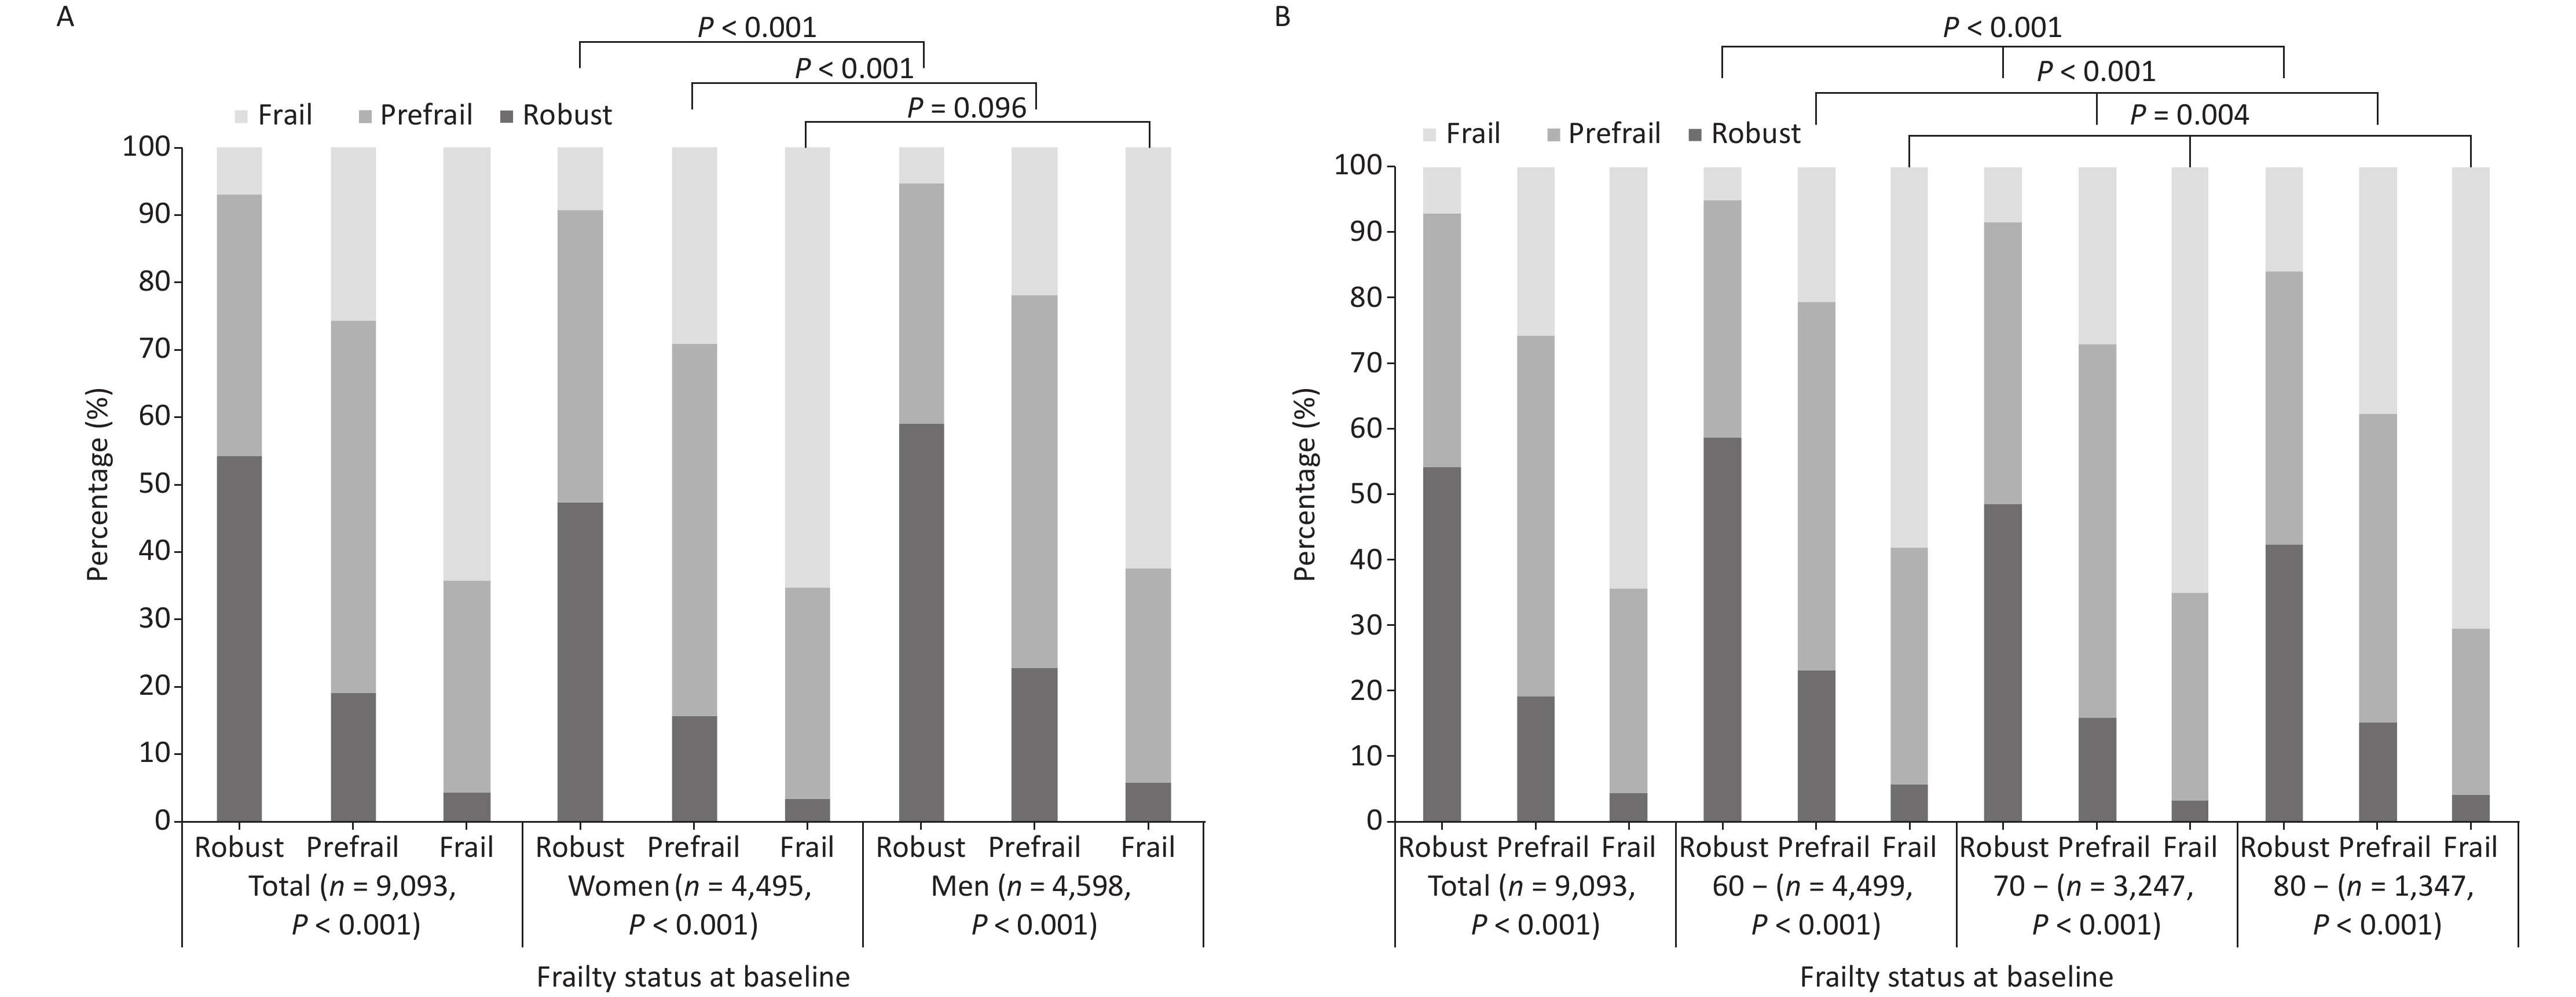
Further analysis by sex revealed that the difference in frailty transition after 2 years of follow-up was significant among older adults with different degrees of frailty at baseline, irrespective of sex (X2 = 1,211.821, 1,395.544, both P < 0.001; Table 2). Among older women, 54.6% (2,453/4,495) exhibited frailty that remained stable, 14.1% (635/4,495) improved, and 31.3% (1,407/4,495) experienced a negative frailty transition. Among older men, 57.8% (2,658/4,598) had frailty that remained stable, 14.3% (657/4,598) improved, and 27.9% (1,283/4,598) experienced a negative frailty transition. Women had a higher proportion of negative frailty transitions than men (χ2 = 13.148, P = 0.001). Specifically, among older adults who were robust or prefrail, a higher proportion of men than women had stable or improving frailty, and women tended to have worsening frailty (χ2 = 55.849, 47.820, both P < 0.001). In contrast, the difference in frailty transitions between men and women was not significant (χ2 = 4.695, P = 0.096) among older adults with frailty (Figure 5A). The difference in frailty transitions after a 2-year follow-up was significant within each of the 60-, 70-, and 80-year age groups when analyzed by the baseline frailty status (χ2 = 1,239.498, 904.541, and 297.660; all P < 0.001; Table 2). The percentages of those with frailty remaining stable, improving, and worsening were 57.7% (2,595/4,499), 13.8% (623/4,499), and 28.5% (1,281/4,499), respectively, in the 60-year age group; the proportions of the same in the 70- and 80-year age group were 55.6% (1,806/3,247), 14.0% (454/3,247), 30.4% (987/3,247); and 52.7% (710/1,347), 16.0% (215/1,347), 31.3% (422/1,347), respectively. Older adults had a higher risk of negative frailty transitions with increasing age (χ2 = 12.297, P = 0.015). The association between age and frailty transition was significant, irrespective of whether the older adults were robust, prefrail, or frail at baseline (χ2 = 82.809, 93.467, and 15.251; all P < 0.05), which indicated that older adults tended to be increasingly vulnerable to frailty with increasing age (Figure 5B).
Frailty status at baseline Frailty status at follow-up χ2 P-value Robust Prefrail Frail Total Whole sample 2,784 4,089 2,220 9,093 2,701.188 < 0.001 Robust to 1,939 (54.3) 1,383 (38.7) 250 (7.0) 3,572 (39.3) Prefrail to 782 (19.1) 2,259 (55.1) 1,057 (25.8) 4,098 (45.1) Frail to 63 (4.4) 447 (31.4) 913 (64.2) 1,423 (15.6) Women 1,071 2,095 1,329 4,495 1,211.821 < 0.001 Robust to 703 (47.5) 638 (43.1) 140 (9.5) 1,481 (32.9) Prefrail to 338 (15.7) 1,190 (55.2) 629 (29.2) 2,157 (48.0) Frail to 30 (3.5) 267 (31.2) 560 (65.3) 857 (19.1) Men 1,713 1,994 891 4,598 1,395.544 < 0.001 Robust to 1,236 (59.1) 745 (35.6) 110 (5.3) 2,091 (45.5) Prefrail to 444 (22.9) 1,069 (55.1) 428 (22.1) 1,941 (42.2) Frail to 33 (5.8) 180 (31.8) 353 (62.4) 566 (12.3) 60− years 1,737 2,003 759 4,499 1,239.498 < 0.001 Robust to 1,281 (58.7) 792 (36.3) 108 (5.0) 2,181 (48.5) Prefrail to 429 (23.1) 1,044 (56.3) 381 (20.6) 1,854 (41.2) Frail to 27 (5.8) 167 (36.0) 270 (58.2) 464 (10.3) 70− years 801 1,550 896 3,247 904.541 < 0.001 Robust to 528 (48.7) 463 (42.7) 93 (8.6) 1,084 (33.4) Prefrail to 253 (15.9) 906 (57.0) 431 (27.1) 1,590 (49.0) Frail to 20 (3.5) 181 (31.6) 372 (64.9) 573 (17.6) 80− years 246 536 565 1,347 297.660 < 0.001 Robust to 130 (42.3) 128 (41.7) 49 (16.0) 307 (22.8) Prefrail to 100 (15.3) 309 (47.2) 245 (37.5) 654 (48.6) Frail to 16 (4.1) 99 (25.6) 271 (70.2) 386 (28.7) Note. Data in the table are presented as n or n (%) Table 2. Transitions in frailty status at the 2-year follow-up according to the baseline frailty status
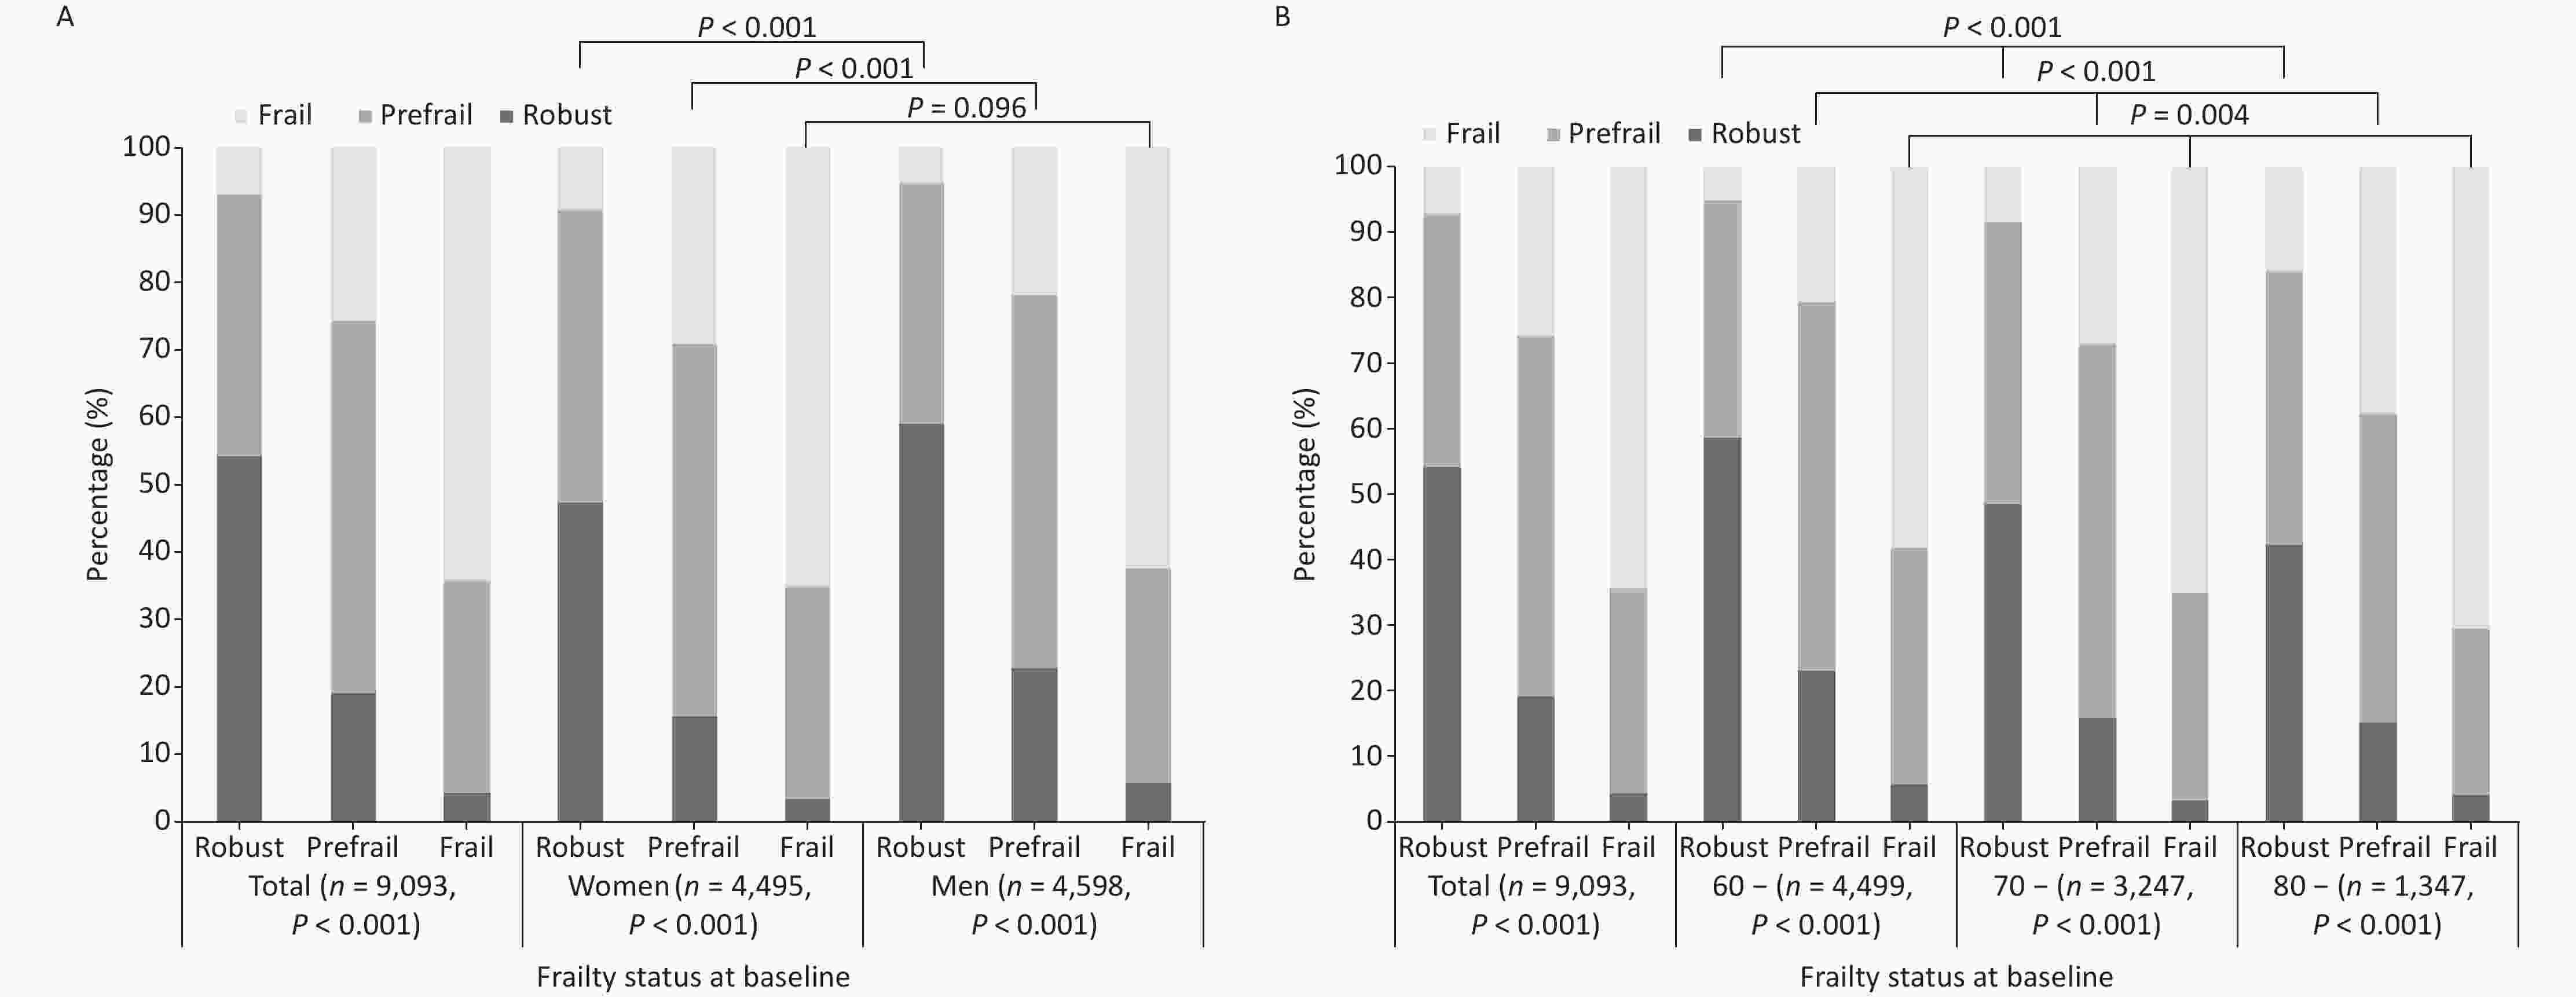
Figure 5. Transitions in the frailty status from baseline to the follow-up assessment: (A) according to sex; (B) according to agegroup.
-
Univariate analysis demonstrated that age, sex, ethnicity, place of residence, PI, and baseline FI differed significantly among older adults with different frailty transitions (all P < 0.05; Table 3). Moreover, baseline frailty status was significantly associated with subsequent frailty transitions. Accordingly, the effect of PI on frailty transition was further examined and stratified by baseline frailty status using multivariate logistic regression models, in which frailty transition was specified as the dependent variable and PI as the independent variable, with adjustments for age, sex, ethnicity, and place of residence. PI levels were associated with a lower likelihood of deterioration in frailty status among older adults who were robust or in the prefrail stage (OR = 0.989, 0.981; both P < 0.05). However, no significant association was observed among older adults who were already frail or had improved frailty status. Although the interaction between PI and sex was not statistically significant in the full-sample model, we conducted a sex-stratified logistic regression analysis to explore potential sex-specific associations between PI and frailty transition. The results indicated that age was only associated with the risk of negative frailty transitions among older women who were robust or prefrail, whereas it affected frailty transitions among older men who were robust, prefrail, or frail. Among older men with frailty, those belonging to ethnic minorities were more likely to improve in terms of frailty than those who were Han Chinese. The place of residence only affected frailty transitions among older women with frailty, whereas it influenced the worsening of robust older men and the improvement of prefrail and frail older men. An increase in PI was protective only against negative frailty transitions among older women with prefrailty (OR = 0.980, 95% CI: 0.971–0.989) and against negative frailty transitions among older men who were robust or prefrail (OR = 0.988, 0.982; both P < 0.05). In summary, PI exerted a greater impact on robust or pre-frail older adults than on older adults with frailty; thus,even among frail older adults, higher levels of protection could not eliminate the impact of health deficits (Table 4).
Determinants Stability (n = 5,111) Worsening (n = 2,690) Improvement (n = 1,292) F/χ2 P-value Age (years) 71.0 ± 6.9 71.5 ± 7.0 70.1 ± 7.2 6.617 0.001 Age group (years) 16.864 0.002 60− 2,594 (57.7) 1,254 (27.9) 651 (14.4) 70− 1,805 (55.6) 986 (30.4) 456 (14.0) 80− 7,12 (52.9) 450 (33.4) 185 (13.7) Sex 13.148 0.001 Woman 2,453 (54.6) 1,407 (31.3) 635 (14.1) Man 2,658 (57.8) 1,283 (27.9) 657 (14.3) Ethnicity 7.975 0.019 Han 4,907 (56.3) 2,592 (29.7) 1,221 (14.0) Minority 204 (54.7) 98 (26.3) 71 (19.0) Residence 38.747 < 0.001 Urban 2,727 (58.6) 1,242 (26.7) 687 (14.8) Rural 2,384 (53.7) 1,448 (32.6) 605 (13.7) PI 0.56 ± 0.11 0.53 ± 0.11 0.56 ± 0.11 31.591 < 0.001 PI level 65.253 < 0.001 Q1 1,186 (55.1) 693 (32.2) 275 (12.8) Q2 1,320 (54.7) 779 (32.3) 315 (13.0) Q3 1,277 (55.8) 694 (30.3) 317 (13.9) Q4 1,328 (59.4) 524 (23.4) 385 (17.2) Baseline FI 0.14 ± 0.10 0.10 ± 0.05 0.19 ± 0.07 423.633 < 0.001 FI level 1,819.019 < 0.001 Robust 1,939 (54.3) 1,633 (45.7) 0 (0.0) Prefrail 2,259 (55.1) 1,057 (25.8) 782 (19.1) Frail 913 (64.2) 0 (0.0) 510 (35.8) Note. Data in the table are presented as mean ± standard deviation or n (%). PI: protection index; FI: frailty index. Table 3. Univariate analysis of factors associated with frailty transitions
Variables Total Women Men Robust
Worsening
(n = 1,633)Prefrail
Worsening
(n = 1,057)Prefrail
Improvement
(n = 782)Frail
improvement
(n = 510)Robust
Worsening
(n = 778)Prefrail
Worsening
(n = 629)Prefrail
Improvement
(n = 338)Frail
improvement
(n = 297)Robust
Worsening
(n = 855)Prefrail
Worsening
(n = 428)Prefrail
Improvement
(n = 444)Frail
improvement
(n = 213)Age group 1.405* (1.264,1.561) 1.359* (1.227,1.505) 0.844* (0.748,0.952) 0.797* (0.688,0.923) 1.220* (1.033,1.440) 1.240* (1.081,1.421) 0.872
(0.728,1.044)0.842
(0.697,1.017)1.553* (1.354,1.780) 1.540* (1.318,1.798) 0.843* (0.715,0.994) 0.736* (0.579,0.935) Sex 0.624* (0.544,0.716) 0.802* (0.690,0.933) 1.432* (1.214,1.689) 1.079
(0.861,1.352)Ethnicity 0.813
(0.560,1.181)0.865
(0.603,1.240)1.086 (0.742,1.590) 2.009* (1.194,3.381) 0.657
(0.352,1.226)0.930
(0.577,1.499)1.472
(0.860,2.518)1.434
(0.665,3.091)0.929
(0.586,1.475)0.792
(0.455,1.378)1.125
(0.479,1.412)2.719* (1.310,5.642) Residence 1.206* (1.052,1.384) 1.007 (0.852,1.151) 0.755* (0.639,0.893) 0.651* (0.520,0.814) 1.196
(0.969,1.478)1.054
(0.772,1.147)0.876
(0.684,1.121)0.717* (0.538,0.956) 1.219* (1.017,1.462) 1.068
(0.846,1.348)0.662* (0.526,0.833) 0.557* (0.388,0.799) PI 0.989* (0.983,0.996) 0.981* (0.974,0.988) 1.006 (0.998,1.014) 1.007
(0.995,1.017)0.990
(0.980,1.001)0.980* (0.971,0.989) 1.009
(0.997,1.021)1.002
(0.989,1.016)0.988* (0.979,0.997) 0.982* (0.971,0.993) 1.003
(0.992,1.014)1.014
(0.995,1.032)PI×Sex 0.998 (0.871,1.021) 1.002 (0.991,1.032) 1.006 (0.896,1.035) 1.012 (0.881,1.029) Note. For the frailty transition outcomes, the reference category was stability. For the independent variables, the reference groups were as follows: 60 yearsof age group for agegroup, female sex, Han ethnicity, and urban residence for place of residence. The protection index (PI) was treated as a continuous variable and odds ratios represent the effect per unit increase. PI: Protective Index; *P < 0.05, statistically significant. Table 4. Multivariable logistic regression analysis of frailty transitions by baseline frailty status [OR (95% CI)]
-
This study examined frailty status and frailty transitions among Chinese community-dwelling older adults using a prospective cohort design based on the 4th SSAPUR results and explicitly derived a PI to quantify the combined influence of health-related protective factors on frailty transitions over a 2-year follow-up. Most participants remained in the same frailty state; however, negative transitions were more common than improvements, particularly with increasing age and among women. Higher PI levels were associated with a lower likelihood of frailty deterioration among older adults who were robust or pre-frail, whereas no significant association was observed among those who were already frail or had positive frailty transitions.
In our study, frailty was assessed using the FI, which captures intrinsic health deficits and reflects the dynamic and stochastic nature of age-related health changes[12]. Compared with other frailty assessment tools, the FI provides a broader assessment of the frailty state and more effectively reflects the diversity of biological processes, enabling a better assessment of the overall health of older adults by centralizing variables reflecting multiple and complex health information to form a single indicator, thus enhancing the statistical validity of outcome estimates[18]. Within this theoretical framework, the PI was not intended to represent a single protective mechanism, but rather to summarize a constellation of extrinsic factors, including lifestyle behaviors, social engagement, and environmental conditions, which may buffer the impact of intrinsic deficits on health transitions. This conceptualization follows earlier work by Wang et al.[16], who distinguished intrinsic deficits from extrinsic protection and demonstrated that protective factors can mitigate but not fully offset deficit accumulation and mortality risk. By aggregating multiple protective factors, the PI provides a pragmatic approach to capturing the overall protective context in which frailty progression occurs. This study indicated that frailty degree increased with the decrease of protective factors among both older men and women, as also confirmed by the moderate negative correlation between PI and frailty in the results of the subsequent correlation analyses. Wang et al.[16] also reported that the degree of frailty in older adults increased with a decrease in protective factors, which contributed to preventing, delaying, or mitigating the process of frailty by decelerating the occurrence rate of health damage and shortening the recovery time.
This study also showed that FI among older adults increased exponentially with age in the baseline year (2017) and in a subsequent follow-up assessment (2019), and the average annual growth rate of FI in 2019 was higher than in 2017, suggesting that health deficits accumulated at an increased rate in older adults as their age increased. Women generally had higher levels of debility than men at any age, which was consistent with the results of our previous studies[19-20]. Generally, older women are more likely to exhibit symptoms associated with frailty than are older men. These sex differences may be partially explained by the distinct trajectories and physiological roles of sex hormones during aging. It has been highlighted that the occurrence of age-related frailty is closely related to changes in sex hormone levels, as the decline in sex hormones is directly associated with muscle weakness, fatigue, and functional attenuation among older adults. In women, estrogen levels decline sharply after menopause, which not only accelerates the loss of muscle mass and physical endurance but also increases vulnerability to sleep disorders, pain, and psychological symptoms such as anxiety and depression, thereby cumulatively elevating the risk of frailty[21]. In contrast, frailty in older men appeared to be more strongly associated with androgen levels. Testosterone and dihydrotestosterone play critical roles in the maintenance of muscle strength, physical performance, and metabolic function. Higher serum-free testosterone and dihydrotestosterone levels have been shown to reduce the risk of frailty among older men, suggesting that the gradual decline in androgen levels may partly buffer frailty progression in men compared with women[22]. Concerning protective factors, PI decreased with age. At any age, health-protective factors were higher among older men than among older women and declined more rapidly among older women than among older men. This may be related to various factors such as biological differences, lifestyle choices, and psychosocial factors. For instance, older men may enjoy higher levels of protective factors owing to biological differences and healthier lifestyles, whereas older women may face a faster decrease in protective factors owing to changes in hormone levels and different social roles[23]. Therefore, understanding and assessing the various protective factors influencing frailty among older adults and their relationship with age and sex are critical for developing effective prevention and intervention measures.
Frailty is in a dynamic state. A multicenter study among older adults in Indonesia with a 12-month follow-up found that 58.0% of the participants remained frail, 14.8% showed improvement, and 27.2% experienced worsening frailty[24]. A meta-analysis revealed that during an average follow-up period of 3.9 years, frailty worsened in approximately 30% of community-dwelling older adults, whereas it improved in 13%, and transitions directly from fitness to frailty or from frailty to fitness were rare, with probabilities of both ranging from 3% to 4%[25]. The results of the present study are consistent with those of the aforementioned studies. Over the 2-year follow-up period, frailty remained stable among most older adults (56.2%) and worsened in 29.6%, whereas in 14.2% frailty improved. Specifically, transitions to negative frailty (i.e., deterioration) were more common than transitions to positive frailty, and transitions between adjacent frailty states were more frequent than those across several frailty states. The results of the analysis based on sex indicated that among older adults who were robust or pre-frail, frailty remained stable or improved in a higher percentage of men than women, and that frailty among women tended to deteriorate more; meanwhile, among older adults who were frail, the difference between frailty transitions among men and women was not significant, which was consistent with prior studies by Tong et al.[26] and Ye et al.[27]. The results suggest that sex is an important factor influencing frailty transitions among older adults, highlighting that developing individualized interventions that address characteristics of older adults and demands based on sex are particularly critical for preventing and intervening in frailty, especially in the case of older adults who are robust or prefrail. Moreover, the results of this study indicated that older adults exhibited a higher risk of negative frailty transitions with increasing age. Negative frailty transitions due to aging are associated with not only physiological decline but also various other factors, such as the accumulation of chronic diseases, cognitive decline, mental health issues, and diminished social support, which interact with each other to accelerate these transitions. Therefore, focusing on age-related risk factors in health management and prevention of frailty in older adults is crucial.
Multivariate logistic regression analysis indicated that higher PI values were associated with a lower risk of negative frailty transitions, particularly among robust or prefrail older adults. This suggests that protective factors exert their primary influence by modulating the trajectory of frailty, rather than by reversing advanced deficit accumulation. Notably, among individuals who were already frail, increases in PI did not significantly promote positive frailty transitions, implying that once health deficits exceeded a certain threshold, the buffering capacity of external protective factors became limited. This pattern aligns with the notion of partial irreversibility in deficit accumulation proposed in earlier studies[16], in which advanced frailty reflects a prolonged recovery time and a diminished physiological reserve. Although the use of a composite PI allows for the evaluation of the cumulative protective environment, it does not replace the analysis of individual protective factors. Indeed, to identify which specific behaviors or conditions are most strongly associated with frailty prevention and to design targeted intervention strategies, analyses at the level of individual factors remain indispensable. In this sense, the PI serves as a complementary analytical tool that is particularly useful for capturing the combined and potentially synergistic effects of multiple protective factors, whereas single-factor analyses are better suited for providing precise intervention priorities.
The sex- and age-specific differences observed in frailty transitions further underscore the need for tailored preventive strategies. The greater susceptibility of older women to frailty progression and stronger effects of age and residence among older men suggest that both biological and contextual factors shape the translation of protective resources into positive health outcomes. Therefore, interventions aimed at strengthening protective factors may be most effective when implemented earlier in the frailty trajectory and should be adapted to individual demographic and environmental contexts.
This study had several limitations that should be acknowledged. Protective factors were assessed using self-reported measures, which may introduce reporting bias; however, self-perceived factors by older adults may be more relevant to their health status than objective measures[27]. Attrition due to loss to follow-up, particularly among individuals with higher frailty and lower PI, may have led to conservative estimates of frailty progression. The PI did not encompass all possible extrinsic protective factors, and its optimal composition may vary across populations and sociocultural settings. Future research should explore alternative PI constructions and combine composite indices with factor-specific analyses to enhance explanatory power and practical relevance.
-
As older adults age, transitions to negative frailty states become more prevalent than those to positive frailty states. Transitions between adjacent frailty states occurred more frequently than those between multiple frailty states. A higher PI was associated with a lower risk of negative frailty transitions among older adults who were robust or pre-frail but showed no association with positive frailty transitions among frail older adults. These findings suggest that although protective factors are not sufficient to fully prevent overall health deterioration with aging, higher levels of protection are more strongly associated with favorable frailty transitions before individuals reach a frail state. Further research is needed to determine whether adopting healthier lifestyles such as engaging in appropriate physical, cognitive, social, and leisure activities can slow or reverse the progression of frailty among older adults.
HTML
Study Design and Participants
Questionnaire Contents
Frailty Assessment and FI Transition
Protection Index
Data Analysis
Comparison of General Characteristics and PI-related Factors with Different Frailty States
Analysis of Frailty and Health Protective Factors
Frailty Transition among Older Adults
Univariate and Multivariate Analyses of the Effect of PI on Frailty Transitions
Competing Interests All the authors declare no conflict of interest.
Ethics The National Bureau of Statistics approved the study protocol [(2014)87], and the Ethics Committee of Beijing Hospital (2021BJYYEC-294-01) approved of the study.
Authors’ Contributions Statistical analyses of the data and manuscript drafting were performed by Jing Shi. The data analysis and manuscript preparation were performed by Ziyi Zhou, Baiyu Zhou, Yongkang Tao, and Yan Cen. The data cleansing and processing were performed by Luyao Zhang, Sainan Li, Ying Li, Botao Sang, Xiangfei Liu, Qinnan Ma and Xuezhai Zeng. Pulin Yu assisted in interpretation of the results and manuscript revisions. The study initiation, design, and final approval of the version to be published were conducted by Jing Li and Deping Liu. All authors contributed to manuscript revision and have read and approved the submitted version.
Data Sharing The data analyzed in this study are available from the China National Committee on Aging; however, restrictions apply and thus, they are not publicly available to the public. The data are available from the authors upon reasonable request and with permission from the China National Committee on Aging. The supplementary materials will be available in www.besjournal.com.

 Quick Links
 DownLoad: