


-
Global food systems threaten both human and planetary health[1]. Dietary shifts towards more plant-rich options have the potential to nurture population health and support environmental sustainability[1]. In 2019, the EAT-Lancet Commission proposed the Planetary Health Diet (PHD) as a healthy and sustainable dietary pattern that recommends increasing the intake of plant-based foods and limiting the intake of animal-sourced foods and starchy vegetables[1]. Little is known about the health and environmental impacts of the EAT-Lancet diet, particularly the PHD[2,3]. There is evidence that healthy diets play a vital role in maintaining a normal body mass index range[4] and reducing the risk of chronic diseases and mortality[5]. However, whether body mass index mediates the relationship between the PHD and risk of mortality remains unclear.
To address these knowledge gaps, we analyzed data from the National Health and Nutrition Examination Survey (NHANES) and the UK Biobank to assess the adherence of individuals to the PHD, identify the association of the PHD with mortality risk and the mediating role of body mass index in the relationship, and examine the associated environmental impacts of the PHD. Our study sheds light on ways to lower the mortality risk, minimize diet-related environmental footprints, and improve food system sustainability.
In this study, adherence to the PHD was measured using the Planetary Health Diet Index (PHDI), which was calculated based on the midpoint of the recommended intake of each dietary component in the EAT-Lancet report[1]. This score comprises 14 dietary components: whole grains, whole fruits, non-starchy vegetables, nuts and seeds, legumes (non-soy legumes and soybean products), unsaturated oils, starchy vegetables, dairy, red and processed meat, poultry, eggs, seafood, saturated fats, added sugars and fruit juice[1]. Each food category was scored on a scale from 0 point (minimum) to 10 points (maximum) based on a diet of 2,500 kcal/d (Supplementary Table S1). Owing to the lack of information on unsaturated oils component in the UK Biobank, the possible PHDI ranges were 0–140 points for the NHANES and 0–130 points for the UK Biobank, respectively. The PHDI was then categorized into quartiles.
Individual-level diet-related environmental impacts included greenhouse gas emissions, cropland use, and freshwater use (Supplementary Table S2). Greenhouse gas emissions focused on non-CO2 emissions from agriculture (particularly methane and nitrous oxide), whereas cropland and freshwater use referred to the consumption of cropland, surface water, and groundwater, respectively. Mortality data of NHANES adult participants and UK Biobank participants were obtained from the National Death Index through December 31, 2019 and the National Health Service Digital (England and Wales) and National Health Service Central Register (Scotland), respectively. Person-time was estimated from the date of the interview (NHANES) or the last dietary assessment (UK Biobank) to the date of death, loss to follow-up, or end of follow-up (NHANES: December 31, 2019; UK Biobank: December 31, 2022), whichever occurred earlier. Data were harmonized for covariates across surveys (Supplementary Table S3).
A total of 131,130 participants were included in this study, including 14,345 from the NHANES and 116,785 from the UK Biobank (Supplementary Figure S1). The characteristics of study participants at baseline are summarized in Table 1. During a median follow-up of 10.6 years, 7,019 (5.35%) deaths occurred, with an incidence rate of 5.22 (95% confidence interval [CI] = 5.10–5.35) per 1,000 person-years. Higher adherence to the PHD was associated with a reduced risk of mortality (Quartile 2: hazard ratio [HR] = 0.88, 95% CI = 0.82–0.95; Quartile 3: 0.87, 0.82–0.93; and Quartile 4: 0.70, 0.54–0.92) (Figure 1A). The results for Models 1–3 are shown in Supplementary Figure S2. The relationship between the PHDI and mortality showed linearity (P = 0.1877 and 0.5456, respectively) (Supplementary Figure S3).
Overall Planetary Health Diet Index P-value Quartile 1
(Low)Quartile 2
(Lower-middle)Quartile 3
(Upper-middle)Quartile 4
(High)Total 131,130 (100.00%) 34,254 (26.12%) 27,656 (21.09%) 38,348 (29.24%) 30,872 (23.54%) Age (years) 55.63 ± 7.92 54.65 ± 8.01 55.51 ± 7.95 55.95 ± 7.86 56.41 ± 7.74 < 0.0001 Sex Male 58,339 (44.59%) 18,901 (55.18%) 12,620 (45.63%) 15,710 (40.97%) 11,108 (35.98%) < 0.0001 Female 72,791 (55.51%) 15,353 (44.82%) 15,036 (54.37%) 22,638 (59.03%) 19,764 (64.02%) Education level Non-university degree 64,542 (49.22%) 19,145 (55.89%) 14,021 (50.70%) 18,048 (47.06%) 13,328 (43.17%) < 0.0001 College or university degree 66,588 (50.78%) 15,109 (44.11%) 13,635 (49.30%) 20,300 (52.94%) 17,544 (56.83%) Socioeconomic status Low 35,894 (27.37%) 10,557 (30.82%) 7,425 (26.85%) 10,014 (26.11%) 7,898 (25.58%) < 0.0001 Middle 44,370 (33.84%) 11,628 (33.95%) 9,467 (34.23%) 12,939 (33.74%) 10,336 (33.48%) High 50,866 (38.79%) 12,069 (35.23%) 10,764 (38.92%) 15,395 (40.15%) 12,638 (40.94%) Smoking status Never 54,590 (41.63%) 13,492 (39.39%) 11,557 (41.79%) 16,278 (42.45%) 13,263 (42.96%) < 0.0001 Former 65,596 (50.02%) 16,419 (47.93%) 13,674 (49.44%) 19,460 (50.75%) 16,043 (51.97%) Current 10,944 (8.35%) 4,343 (12.68%) 2,425 (8.77%) 2,610 (6.81%) 1,566 (5.07%) Alcohol consumption No 20,438 (15.59%) 5,537 (16.16%) 4,253 (15.38%) 5,749 (14.99%) 4,899 (15.87%) < 0.0001 Yes 110,692 (84.41%) 28,717 (83.84%) 23,403 (84.62%) 32,599 (85.01%) 25,973 (84.13%) Physical activity No 15,455 (11.79%) 5,160 (15.06%) 3,393 (12.27%) 4,109 (10.72%) 2,793 (9.05%) < 0.0001 Low intensity 13,396 (10.22%) 3,599 (10.51%) 2,904 (10.50%) 3,796 (9.90%) 3,097 (10.03%) High intensity 102,279 (78.00%) 25,495 (74.43%) 21,359 (77.23%) 30,443 (79.39%) 24,982 (80.92%) Body mass index (kg/m2) 27.01 ± 5.00 27.90 ± 5.32 27.21 ± 4.97 26.74 ± 4.84 26.17 ± 4.70 < 0.0001 Multimorbidity No 70,224 (53.55%) 18,033 (52.64%) 14,708 (53.18%) 20,710 (54.01%) 16,773 (54.33%) < 0.0001 Yes 60,906 (46.45%) 16,221 (47.36%) 12,948 (46.82%) 17,638 (45.99%) 14,099 (45.67%) Total energy intake (kcal/d) 2,041.47 (1,723.66–2,403.31) 2,074.27 (1,735.80–2,464.79) 2,025.41 (1,707.63–2,386.04) 2,027.16 (1,715.25–2,376.93) 2,038.89 (1,735.55–2,387.49) 0.0001 Diet-related environmental burdens Greenhouse gas emissions
(kg CO2 equivalent)2.47 (1.19–4.47) 4.22 (2.39–6.68) 2.61 (1.33–4.58) 2.03 (0.90–3.63) 1.48 (0.59–2.63) 0.0001 Cropland use (m2) 2.81 (1.99–3.93) 2.76 (1.81–4.04) 2.62 (1.81–3.80) 2.72 (1.98–3.80) 3.09 (2.34–4.06) 0.0001 Freshwater use (m3) 0.38 (0.27–0.53) 0.34 (0.23–0.50) 0.35 (0.25–0.50) 0.38 (0.28–0.52) 0.44 (0.33–0.57) 0.0001 Note. Variables are presented as mean ± standard deviation, median (interquartile range), or n (%). Comparisons according to quartiles of the Planetary Health Diet Index were performed using analysis of variance or Kruskal–Wallis test for continuous variables and the chi-square test for categorical variables. Table 1. Baseline characteristics of the participants by quartiles of the Planetary Health Diet Index (n = 131,130)
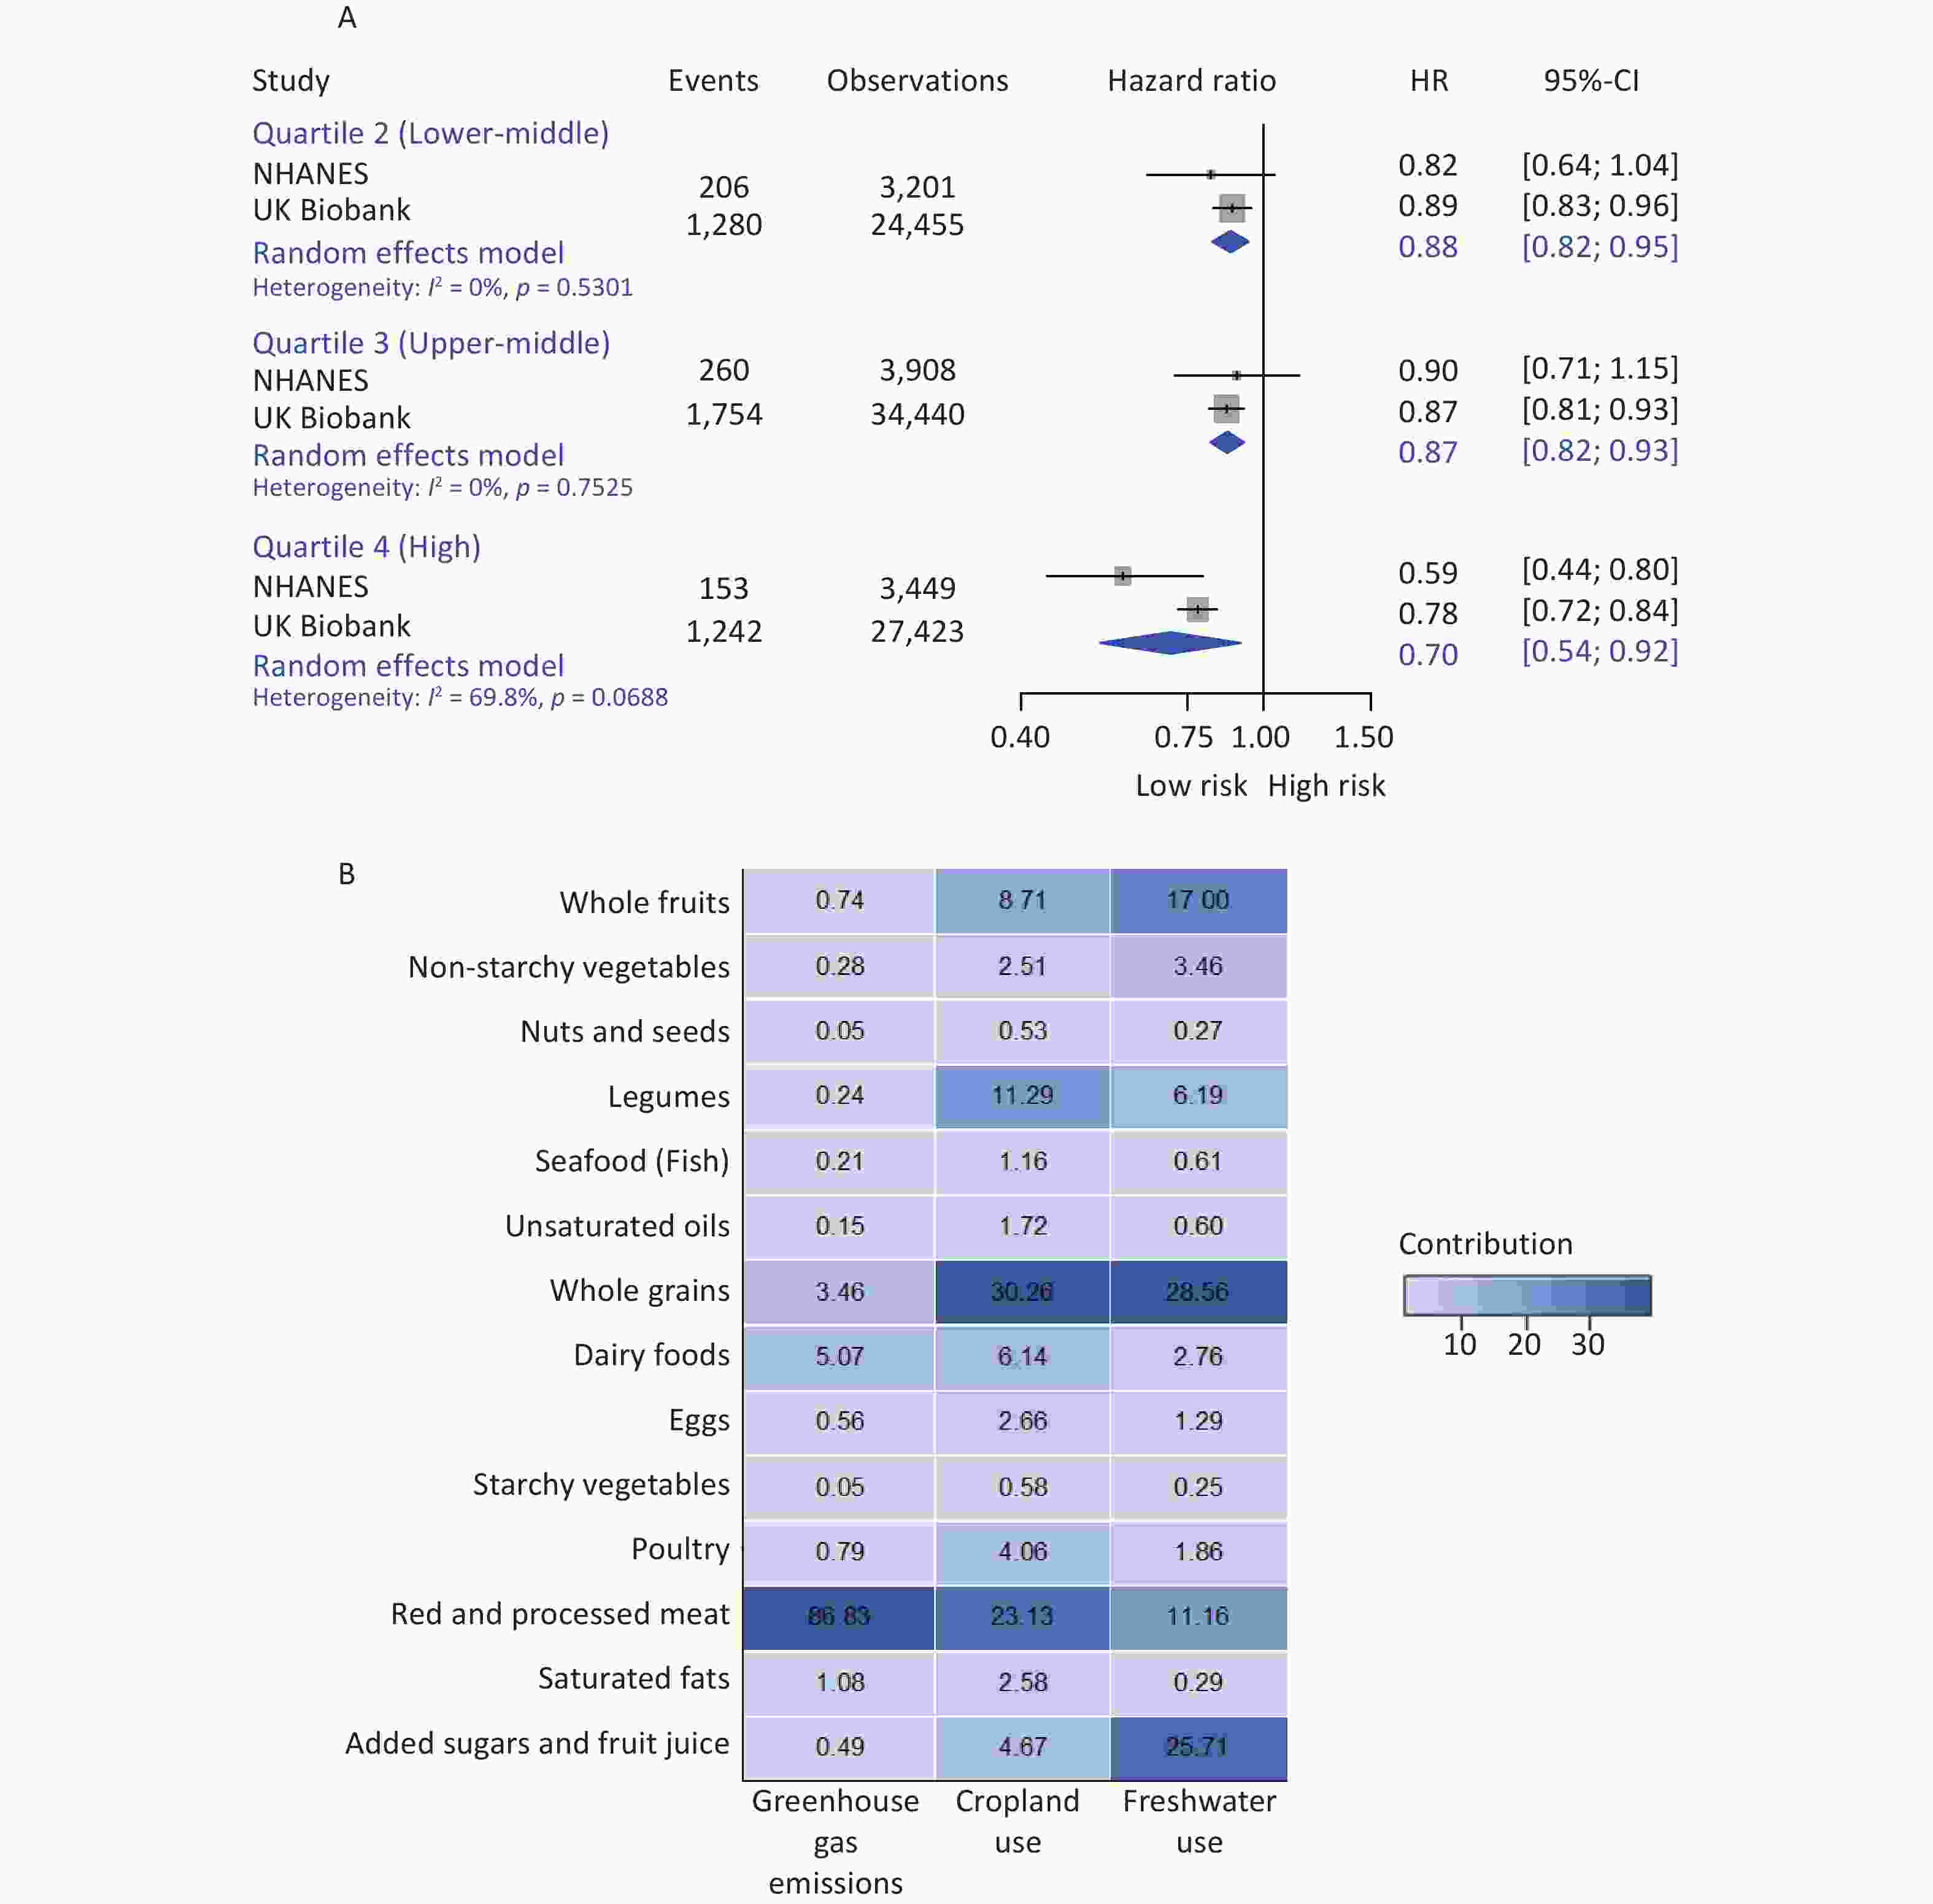
Figure 1. Health and environmental impacts of the Planetary Health Diet. (A) Individual and pooled effects of the Planetary Health Diet Index on risk of mortality (n = 131,130). (B) Overall percentage contributions of individual dietary components to environmental impacts.
Body mass index was related to mortality (HR = 1.12, 95% CI = 1.00–1.25), after controlling for all covariates (Supplementary Table S4). A significant association was observed between the PHD and body mass index (coefficient = −0.009 kg/m2, 95% CI = −0.015 to −0.004) (Supplementary Table S5). Based on these results, our study met the prerequisites for mediation analysis. After adjusting for all covariates, body mass index mediated 11.88% of the association between the PHD and mortality (Supplementary Figure S4). In subgroup analyses, the effect of the PHD on risk of mortality was stronger among US men (Quartile 4: HR = 0.63, 95% CI = 0.47–0.85) and individuals with middle socioeconomic status (Quartile 4: HR = 0.54, 95% CI = 0.39–0.77), compared to their respective counterparts (Supplementary Table S6). The inverse association between the PHD and mortality risk remained consistent in sensitivity analyses (Supplementary Table S7).
The estimated median (interquartile range) greenhouse gas emissions, cropland use, and freshwater use were 2.47 (1.19–4.47) kg CO2 equivalent, 2.81 (1.99–3.93) m2, and 0.38 (0.27–0.53) m3, respectively (Table 1). Higher adherence to the PHD was generally associated with lower greenhouse gas emissions (Quartile 4 vs. Quartile 1: coefficient = −3.37 kg CO2 equivalent, 95% CI = −3.49 to −3.25), but higher freshwater use (0.08 m3, 0.07 to 0.09) (P for trend < 0.0001) (Table 2). Among the dietary components, red and processed meat contributed the most to greenhouse gas emissions (86.83%), whereas whole grains were the major contributors to cropland (30.26%) and freshwater use (28.56%) (Figure 1B).
Diet-related environmental impacts Planetary Health Diet Index P-value for trend Quartile 1 (Low) Quartile 2 (Lower-middle) Quartile 3 (Upper-middle) Quartile 4 (High) Greenhouse gas emissions (kg CO2 equivalent) 0.00 (reference) −1.50 (−1.62 to −1.38) −2.51 (−2.63 to −2.40) −3.37 (−3.49 to −3.25) < 0.0001 Freshwater use (m3) 0.00 (reference) 0.01 (0.00 to 0.02) 0.02 (0.01 to 0.03) 0.08 (0.07 to 0.09) < 0.0001 Cropland use (m2) Quartile 1 0.00 (reference) −0.10 (−0.14 to −0.05) −0.42 (−0.46 to −0.38) −1.00 (−1.05 to −0.96) - Quartile 3 0.00 (reference) −0.12 (−0.17 to −0.07) −0.12 (−0.16 to −0.08) 0.14 (0.10 to 0.18) - Quartile 4 0.00 (reference) −0.19 (−0.24 to −0.14) −0.30 (−0.34 to −0.26) −0.07 (−0.11 to −0.02) - Note. Models were adjusted for age at baseline, sex, and total energy intake. P-values for trends were assessed by assigning the median value of the Planetary Health Diet Index to each quartile and modeling it as a continuous variable. Table 2. Regression coefficients for the association between quartiles of the Planetary Health Diet Index and environmental impacts (n = 131,130)
To the best of our knowledge, this is the first large-scale multi-cohort study to investigate adherence to the PHD, its diet-related environmental impacts, and mortality risk among middle-aged adults in the US and UK. Our findings indicate that higher adherence to the PHD benefits population health; however, its benefits for environmental sustainability are less certain.
Our finding of an inverse association between the PHDI and mortality extended the existing evidence on health gains of the PHD, which is in line with prior studies[6-8] but contrasts with a study in UK adults[3]. These inconsistencies are potentially due to differences in scoring methods, demographic characteristics, dietary patterns of the cohorts, and the length of follow-up. We also found that the association between the PHDI and mortality risk was linear, and the HR for mortality was 1.00 when the PHDI reached approximately 76 points. Additionally, we observed that body mass index mediated 11.88% of the association between the PHD and mortality. It is evident that healthy diets rich in whole grains, fruits, and vegetables are good for a healthy body weight[4], and body mass index has a J- or U-shaped association with the risk of mortality[9]. Our findings suggest that higher adherence to the PHD could be a promising approach for mortality prevention, and body mass index played an important role in this association.
In addition, this study found that higher adherence to the PHD resulted in lower greenhouse gas emissions, but higher freshwater use. Our result is in line with a previous study in Singapore[10], but is partially consistent with the available evidence among Chinese adults[7]. The significant decrease in greenhouse gas emissions in our study is potentially driven by limiting the consumption of red and processed meat in the PHD[10], whereas increased freshwater use may be explained by the fact that the intake of whole grains was not strictly limited. Therefore, a further reduction in the consumption of whole grains may help alleviate the environmental burdens. Our findings confirmed that dietary changes alone may not be sufficient to remain within most planetary boundaries[1]. To minimize the environmental footprint, it is imperative to further optimize food production, processing, distribution, and waste management[1], in addition to encouraging the greatest adherence to the PHD.
The strengths and limitations of this study are as follows. This study benefited from using data from two nationally representative cohorts with a prospective study design, having a large sample size (131,130 participants) and a long follow-up (10.6 years), and relying on nationwide high-quality registers to ascertain mortality. Thus, we believe that our study accurately measured dietary compliance with the PHD in the US and UK and comprehensively examined the benefits of the PHD for population health and ecosystems. However, our findings should be interpreted with caution owing to some limitations. First, as this study was observational in design, residual and unmeasured confounding factors could not be ruled out[7,10] despite adjusting for many relevant covariates. Second, dietary data were based on self-reported 24-h dietary recalls; therefore, subsequent changes in dietary intake during follow-up could not be captured[7,10]. Our findings may be subject to recall bias and measurement errors, although using multiple 24-h dietary assessments mitigated measurement errors. Third, the PHDI in this study was calculated only using data from the US and UK. Future research is required to compare the predictive performance of the PHDI in different settings and populations. Finally, the diet-associated environmental impacts in our study were estimated based on the global average environmental footprint of food items. Thus, it is necessary to further explore the influence of the PHD on ecosystems in these two countries.
In conclusion, this large prospective cohort study suggests that higher adherence to the PHD reduces mortality risk and greenhouse gas emissions but increases freshwater use. Our findings highlight the health and environmental benefits of compliance with the PHD and provide insights into the role of body mass index in the PHD–mortality relationship. To further alleviate the environmental burden, strict adherence to the PHD and continuous optimization of food systems are necessary. Further studies are required to determine the population and environmental health benefits of the PHD in other cohorts.
HTML
Competing Interests The authors declare that they have no competing interests.
Ethics The NHANES and UK Biobank were approved by the Ethics Review Board of the National Center for Health Statistics and the North West Multi-Center Research Ethics Committee, respectively, and all participants provided written informed consent. Our study used de-identified and publicly accessible data; therefore, ethical approval was not required for the analysis of anonymized data. This study was conducted according to the principles of the Declaration of Helsinki.
Authors’ Contributions Conceptualization: J.L. Methodology: X.L. and J.L. Investigation: X.L., L.Y.T., and J.L. Visualization: X.L. Funding acquisition: J.L. Project administration: J.L. Supervision: J.L. Writing–original draft: X.L. Writing–review & editing: X.L., L.Y.T., and J.L.
Data Sharing The data used in this study are available on the following websites: the National Health and Nutrition Examination Survey (NHANES; https://wwwn.cdc.gov/nchs/nhanes/) and the UK Biobank (https://www.ukbiobank.ac.uk/about-our-data/). The UK Biobank data were accessed from the publicly available UK Biobank Resource under Application Number 79114. The supplementary materials will be available in www.besjournal.com.
Reference

 Quick Links
 DownLoad: