
-
Cobalt is an essential trace element for human health and a key component of vitamin B12, which is involved in hematopoiesis and the maintenance of related enzymatic activity[1]. However, cobalt is also classified as a heavy metal, and exposure to environmental cobalt may pose health concerns[2]. Owing to its advantageous physical properties, cobalt has been widely used in industrial manufacturing in recent decades. This widespread use has elevated public exposure and may consequently induce associated health risks[3,4].
China is currently experiencing one of the most rapid population aging processes worldwide[5]. According to the latest official data, by the end of 2024, the population aged 60 years and above in China exceeded 310 million, accounting for 22.0% of the total population, with approximately 220 million individuals aged 65 years and above representing 15.6%[6]. It is projected that by 2035, the population aged 60 years and older will surpass 400 million, comprising more than 30% of the total population and marking China's transition into a stage of severe population aging[7]. This profound demographic shift renders older adults particularly vulnerable to the health effects of environmental exposures, such as heavy metals, thereby sharply increasing the burden of chronic diseases and accelerating aging. Studies conducted among middle-aged and older Chinese populations have further elucidated the potential hazards associated with cobalt exposure[8]. A study of middle-aged and elderly populations in Guangxi, China, indicated that elevated urinary cobalt concentrations may be associated with accelerated aging[9]. In contrast, the Dongfeng Tongji Cohort Study in China reported no significant association between plasma cobalt levels and aging, although it did observe that higher plasma cobalt concentrations may contribute to physiological dysfunction[10]. Furthermore, an study of 1,290 middle-aged and older individuals without dyslipidemia from Nanjing, China, demonstrated that participants with the highest urinary cobalt levels (Q4) had a significantly increased risk of developing atherosclerosis compared with those in the lowest quartile (Q1), with an odds ratio (OR) of 1.53 [95% confidence interval (CI): 1.07–2.22][8].
Emerging evidence indicates a complex association between cobalt exposure and mortality, with findings exhibiting substantial heterogeneity. A large prospective cohort study from the National Health and Nutrition Examination Survey (NHANES) showed that cobalt exposure was associated with an increased risk of all-cause and cardiovascular mortality among adults in the United States, but not with cancer mortality[11]. Similarly, data from a United States-based multi-ethnic cohort study further supports an association between urinary cobalt concentrations and elevated risks of cardiovascular mortality [hazard ratio (HR): 1.24 (1.03–1.48)] and overall mortality [HR: 1.37 (1.19–1.58)] among middle-aged and older adults[12]. Additionally, a cohort study of patients with asthma identified urinary cobalt and cadmium as significant predictors of elevated all-cause mortality risk[13]. However, Zhang et al. reported no association between urinary cobalt and all-cause mortality, despite identifying significant associations with urinary lead and cadmium[14]. Similarly, Duan et al. found no evidence linking urinary cobalt to overall, cardiovascular, and cancer mortalities among American adults[15]. Due to age-related declines in physiological functions, including immunity, metabolism, and biosynthetic capacity, older adults are highly susceptible to the adverse effects of environmental metal exposure[16,17]. Nevertheless, evidence regarding the association between cobalt exposure and neurological mortality remains scarce. Notably, a study based on NHANES data from 2011 to 2014 demonstrated that urinary cobalt concentrations were inversely correlated with cognitive function in adults[18]. In addition, a study conducted using the Multi-ethnic Cohort data found that cobalt exposure was associated with decreased Digit Symbol Coding test performance and exhibited a significant link with the incidence of dementia[19]. Exploring the relationship between cobalt exposure and mortality in the elderly, particularly cause-specific mortality, has significant implications for disease prevention and clinical treatments.
Existing research findings are inconsistent and exhibit several limitations. First, current studies investigating the association between cobalt and mortality have primarily focused on developed countries and adults, with limited evidence from Chinese populations, particularly older adults. Second, existing studies have predominantly examined the association between urinary cobalt and cardiovascular or cancer mortality, while comprehensive analyses of its impact on overall, respiratory, and neurological mortality are limited. Third, apart from multicenter evidence from the United States, there is a paucity of multicenter population-based research in China.
To address these gaps, we recruited two population-based prospective cohorts of the Chinese individuals aged ≧ 60 years to measure urinary cobalt concentrations and determine participants' survival status and causes of death through a combination of the National Cause of Death Surveillance System and questionnaire-based follow-up surveys. This comprehensive investigation of the association between urinary cobalt level and all-cause and cause-specific mortality among older Chinese adults may offer important population-based evidence for the clinical treatment and health management of cobalt exposure.
-
This study utilized two dynamic, population-based Chinese prospective cohorts: the Healthy Aging and Biomarkers Cohort Study (HABCS) and the China National Human Biomarker Monitoring (CNHBM) project. The HABCS project was initiated in 2008 and has since been implemented across 18 longevity regions in 14 provinces nationwide, collecting health-related data and biological samples from individuals aged 65 years and older. In 2017, the CNHBM project conducted a baseline survey at 152 testing sites across 31 provinces, enrolling participants aged 3–79. Both cohorts initiated urinary metal testing in 2017. Baseline urinary cobalt concentrations were measured during the 2017–2018 and 2021 survey cycles, with follow-ups conducted through 2024. Details of the study design and protocols for the HABCS and CNHBM have been reported previously[21,22]. The eligibility criteria for the present analysis required participants from both cohorts to be aged ≧ 60 years. Participants with missing urinary cobalt measurements or values exceeding the 99th percentile (due to the right-skewed distribution of urinary cobalt concentrations) were excluded. The final analytical sample comprised of 9,727 individuals (Supplementary Figure S1). All participants provided written informed consent prior to survey enrollment. Both HABCS and CNHBM were approved by the Ethics Review Board of China's National Institute of Environmental Health, Chinese Center for Disease Control and Prevention (China CDC, Approval No. 202029 for HABCS; No. 202031 for CNHBM).
-
Urine specimens were collected during scheduled on-site visits and transported to the central laboratory with continuous cold-chain preservation (−80 °C). Urinary cobalt concentrations were measured using inductively coupled plasma mass spectrometry (ICP-MS: Agilent Technologies 8900, Santa Clara, California, USA). The recoveries and relative standard deviations of the spiked samples for the detection method are provided in Supplementary Table S1. Given the limits of detection (LOD) differences between the two cohorts (0.07 μg/L in HABCS and 0.006 μg/L in CNHBM), data harmonization was performed by applying the higher LOD (0.07 μg/L) uniformly to all measurements. Values below the LOD were imputed as LOD/√2, in accordance with established methodological practices[23,24].
-
Mortality records from 2017 to December 31, 2024, were obtained from the Chinese Disease Surveillance Point System (DSPS), administered by the Chinese Center for Disease Control and Prevention (China CDC). Established in 2013, the DSPS encompasses 605 communities across 322 administrative regions, covering a total population of 323.8 million (approximately 24.3% of the total population of China). Its sampling methodology and implementation protocols have been previously described, and the system serves as a critical resource for assessing disease burden at both national and regional levels[25]. Mortality registry records were supplemented with questionnaire-based verification during the follow-up. Cause-specific mortality was classified using the Tenth Revision of the International Classification of Diseases (ICD-10): deaths were categorized as neurological (G00–G99), cancer (C00–C99), respiratory (J00–J99), or cardiovascular (I00–I99) diseases, with all other causes classified as “other” (Supplementary Figure S1).
-
To minimize potential confounding factors, we adjusted for a comprehensive set of covariates including basic demographic characteristics, lifestyle-related factors, and chronic health conditions. Basic demographic characteristics included age, sex, ethnicity (Han Chinese or others), educational attainment (literate or illiterate), economic status (low, middle, or high), body mass index (BMI), residential area (urban or rural), and marital status (married or unmarried). Lifestyle factors included dietary consumption (meat, fruits, and vegetables), current smoking status, and current drinking status. Chronic health conditions included hypertension, diabetes, dyslipidemia, and chronic kidney disease (CKD). Urinary creatinine concentration was adjusted in all analyses to account for the impact of urine dilution. Cohort-specific batch effects were controlled for using binary indicators. Urinary cadmium and lead concentrations were also included as covariates to adjust for the potential confounding effects of other common metals. For variables with missing values, multiple imputations using chained equations (MICE) was performed with five iterations[26]. Detailed classifications of the covariates are provided in the supplementary materials.
-
The characteristics of the deceased participants were stratified according to the cause of death. Categorical variables were presented as n (%) and compared using the chi-square (χ2) test. For continuous variables with a normal distribution, analysis of variance (ANOVA) was used, with results presented as mean ± standard deviation (SD). In contrast, the Kruskal-Wallis test was applied to non-normally distributed data, which were reported as medians (interquartile range [IQR]: Q1, Q3). To evaluate the association between urinary cobalt concentration and all-cause and cause-specific mortality, Cox proportional hazards models were used, with follow-up years as the timescale. HRs and 95% CIs were calculated, and no violations of the proportional hazard assumption were detected. Based on existing evidence linking cadmium and lead exposure to elevated mortality risk[27,28], we adjusted for these metals to control for potential confounding effects on the association between urinary cobalt and mortality. To address additional potential confounders when assessing the association between urinary cobalt levels and mortality, we constructed four sequential multivariable adjustment models. Model I was adjusted for age, sex, urinary creatinine concentration, cohort (as a binary indicator), urinary cadmium, and urinary lead. Model II was further adjusted for ethnicity, marital status, residential area, educational attainment, economic status, and BMI. Model III further included lifestyle-related factors. Model IV was further adjusted for chronic health conditions. Urinary cobalt concentrations were also categorized into quartiles (Q1–Q4), with Q1 serving as the reference group. HRs and 95% CIs were estimated for each quartile and trend tests were conducted. The P value for the trend was calculated using the Wald test by assigning sequential integer values to each exposure quartile and treating this categorical variable as a continuous variable in the model. Additionally, given the narrow variation in urinary cobalt concentrations, we included the results for urinary cobalt concentrations in IQR increments. To explore potential nonlinear associations, restricted cubic spline (RCS) models with three knots positioned at the 10th, 50th, and 90th percentiles were used[29].
To identify populations susceptible to cobalt-induced health impairment, we performed five subgroup analyses as follows: (1) Stratification by age (≥ 80 years vs. < 80 years), due to differences in physiological and metabolic capacities; (2) Stratification by sex, considering variations in hormone levels and renal clearance capacity; (3) Stratification by residential area (urban vs. rural), given differences in exposure sources and access to healthcare; (4) Stratification by ethnicity to account for difference in cultural practices and genetic polymorphism; (5) Stratification by educational attainment to address disparities in health awareness.
Several sensitivity analyses were conducted to verify the robustness of the findings. First, to address the potential confounding effects of arsenic and chromium, we adjusted for urinary arsenic and chromium levels. Second, dyslipidemia was excluded from multivariate adjustment because it may act as a mediator rather than a confounder. Third, to assess the impact of urine dilution correction, we replaced the direct adjustment for urinary creatinine with cobalt concentrations normalized to creatinine (i.e., cobalt excretion per unit creatinine). Fourth, based on previous evidence linking urinary nickel to increased mortality risk, we adjusted for nickel exposure. Fifth, to minimize reverse causation due to pre-existing severe illnesses, participants who died within the first 12 months of follow-up were excluded. Sixth, participants with any preexisting neurological, cardiovascular, cancer, or respiratory diseases at baseline were excluded from the study. Seventh, as only medication use for respiratory diseases was documented in both cohorts, this variable was further adjusted in the model. Eighth, we specifically analyzed the association between urinary cobalt concentration and lung cancer mortality (ICD-10: C34). Finally, cardiovascular mortality was redefined using an alternative ICD-10 coding scheme (I00–I09, I11, I13, I20–I51, and I60–I69) to further explore its association with the urinary cobalt concentrations[30]. Statistical analyses were conducted using the R software (version 4.4.2), and figures were generated using the ggplot2 package (version 3.5.1). A two-sided P value < 0.05 was considered significant for all analyses.
-
A cohort of 9,727 elderly participants was recruited, with a mean age of 77.820 years and 52.8% being female. The median urinary cobalt concentration was 0.220 μg/L (Supplementary Table S2). During a mean follow-up period of 4.754 years, (95% CI: 4.706-4.801), 2745 participants died (mortality rate: 28.2%). Of these deaths, 1,341 were attributed to cardiovascular disease, 311 to respiratory disease, 294 to cancer, 162 to neurological disease, and 523 to other causes. Table 1 shows the statistically significant differences in all covariates across different survival statuses (all P < 0.05). Supplementary Tables S2 and S3 present comparisons of population characteristics by urinary cobalt quartiles (Q1–Q4) and survival status (alive vs. deceased), respectively.
Characteristics Overall Survivors Decedents P-value Alive Neurological mortality Cardiovascular mortality Respiratory mortality Cancer mortality Other causes of mortality Participants, n 9,727 6,982 162 1,341 311 294 523 Age [mean ± SD] 77.820 (13.080) 73.417 (10.605) 96.716 (6.320) 89.565 (11.305) 89.399 (11.207) 76.755 (10.864) 90.501 (12.101) < 0.001 Sex [n, (%)] < 0.001 Male 4,589 (47.178) 3,342 (47.866) 46 (28.395) 597 (44.519) 169 (54.341) 173 (58.844) 213 (40.727) Female 5,138 (52.822) 3,640 (52.134) 116 (71.605) 744 (55.481) 142 (45.659) 121 (41.156) 310 (59.273) Educational attainment [n, (%)] < 0.001 Literate 5,725 (58.857) 4,667 (66.843) 44 (27.160) 489 (36.465) 121 (38.907) 195 (66.327) 176 (33.652) Illiterate 4,002 (41.143) 2,315 (33.157) 118 (72.840) 852 (63.535) 190 (61.093) 99 (33.673) 347 (66.348) Economic status [n, (%)] < 0.001 Low 1,651 (16.973) 1,268 (18.161) 12 (7.407) 183 (13.647) 46 (14.791) 41 (13.946) 85 (16.252) Middle 6,287 (64.635) 4,378 (62.704) 100 (61.728) 963 (71.812) 218 (70.096) 198 (67.347) 345 (65.966) High 1,789 (18.392) 1,336 (19.135) 50 (30.864) 195 (14.541) 47 (15.113) 55 (18.707) 93 (17.782) Ethnicity [n, (%)] 0.009 Han Chinese 9,029 (92.824) 6,474 (92.724) 160 (98.765) 1,238 (92.319) 290 (93.248) 277 (94.218) 491 (93.881) Other 698 (7.176) 508 (7.276) 2 (1.235) 103 (7.681) 21 (6.752) 17 (5.782) 32 (6.119) Residential area [n, (%)] < 0.001 Rural 2,258 (23.214) 1,974 (28.273) 4 (2.469) 113 (8.427) 39 (12.540) 52 (17.687) 69 (13.193) Urban 7,469 (76.786) 5,008 (71.727) 158 (97.531) 1,228 (91.573) 272 (87.460) 242 (82.313) 454 (86.807) Marital status [n, (%)] < 0.001 Married 6,003 (61.715) 5,035 (72.114) 22 (13.580) 448 (33.408) 115 (36.977) 190 (64.626) 167 (31.931) Unmarried 3,724 (38.285) 1,947 (27.886) 140 (86.420) 893 (66.592) 196 (63.023) 104 (35.374) 356 (68.069) BMI [n, (%)] < 0.001 Underweight 909 (9.345) 384 (5.500) 45 (27.778) 229 (17.077) 64 (20.579) 34 (11.565) 122 (23.327) Normal 4,661 (47.918) 3,214 (46.033) 79 (48.765) 714 (53.244) 177 (56.913) 142 (48.299) 274 (52.390) Overweight 2,929 (30.112) 2,369 (33.930) 28 (17.284) 294 (21.924) 47 (15.113) 83 (28.231) 92 (17.591) Obesity 1,228 (12.625) 1,015 (14.537) 10 (6.173) 104 (7.755) 23 (7.395) 35 (11.905) 35 (6.692) Current smoking status [n, (%)] < 0.001 Yes 2,072 (21.302) 1,580 (22.630) 18 (11.111) 220 (16.406) 58 (18.650) 92 (31.293) 87 (16.635) No 7,655 (78.698) 5,402 (77.370) 144 (88.889) 1,121 (83.594) 253 (81.350) 202 (68.707) 436 (83.365) Current drinking status [n, (%)] < 0.001 Yes 2,341 (24.067) 1,851 (26.511) 26 (16.049) 204 (15.213) 59 (18.971) 93 (31.633) 93 (17.782) No 7,386 (75.933) 5,131 (73.489) 136 (83.951) 1,137 (84.787) 252 (81.029) 201 (68.367) 430 (82.218) Fruit consumption [n, (%)] < 0.001 Yes 7,372 (75.789) 5,593 (80.106) 117 (72.222) 894 (66.667) 177 (56.913) 202 (68.707) 333 (63.671) No 2,355 (24.211) 1,389 (19.894) 45 (27.778) 447 (33.333) 134 (43.087) 92 (31.293) 190 (36.329) Vegetable consumption [n, (%)] < 0.001 Yes 9,366 (96.289) 6,829 (97.809) 151 (93.210) 1,237 (92.245) 288 (92.605) 282 (95.918) 482 (92.161) No 361 (3.711) 153 (2.191) 11 (6.790) 104 (7.755) 23 (7.395) 12 (4.082) 41 (7.839) Meat consumption [n, (%)] < 0.001 Yes 8,957 (92.084) 6,500 (93.097) 144 (88.889) 1,172 (87.397) 284 (91.318) 275 (93.537) 477 (91.205) No 770 (7.916) 482 (6.903) 18 (11.111) 169 (12.603) 27 (8.682) 19 (6.463) 46 (8.795) Hypertension [n, (%)] < 0.001 Yes 6,763 (69.528) 4,777 (68.419) 117 (72.222) 995 (74.198) 226 (72.669) 186 (63.265) 384 (73.423) No 2,964 (30.472) 2,205 (31.581) 45 (27.778) 346 (25.802) 85 (27.331) 108 (36.735) 139 (26.577) Diabetes [n, (%)] < 0.001 Yes 1,639 (16.850) 1,226 (17.559) 12 (7.407) 198 (14.765) 43 (13.826) 61 (20.748) 91 (17.400) No 8,088 (83.150) 5,756 (82.441) 150 (92.593) 1,143 (85.235) 268 (86.174) 233 (79.252) 432 (82.600) Dyslipidemia [n, (%)] < 0.001 Yes 3,111 (31.983) 2,420 (34.661) 44 (27.160) 342 (25.503) 59 (18.971) 90 (30.612) 132 (25.239) No 6,616 (68.017) 4,562 (65.339) 118 (72.840) 999 (74.497) 252 (81.029) 204 (69.388) 391 (74.761) Chronic kidney disease [n, (%)] < 0.001 Yes 2,170 (22.309) 1,102 (15.783) 91 (56.173) 520 (38.777) 136 (43.730) 58 (19.728) 210 (40.153) No 7,557 (77.691) 5,880 (84.217) 71 (43.827) 821 (61.223) 175 (56.270) 236 (80.272) 313 (59.847) Cohort [n, (%)] < 0.001 CNHBM 3,604 (37.052) 3,221 (46.133) 2 (1.235) 169 (12.603) 39 (12.540) 102 (34.694) 67 (12.811) HABCS 6,123 (62.948) 3,761 (53.867) 160 (98.765) 1,172 (87.397) 272 (87.460) 192 (65.306) 456 (87.189) Note. n, number; BMI, body mass index; SD, standard deviation. Data are presented as means (SD) or n (%). Table 1. Characteristics of 9,727 study participants across different survival statuses and causes of death
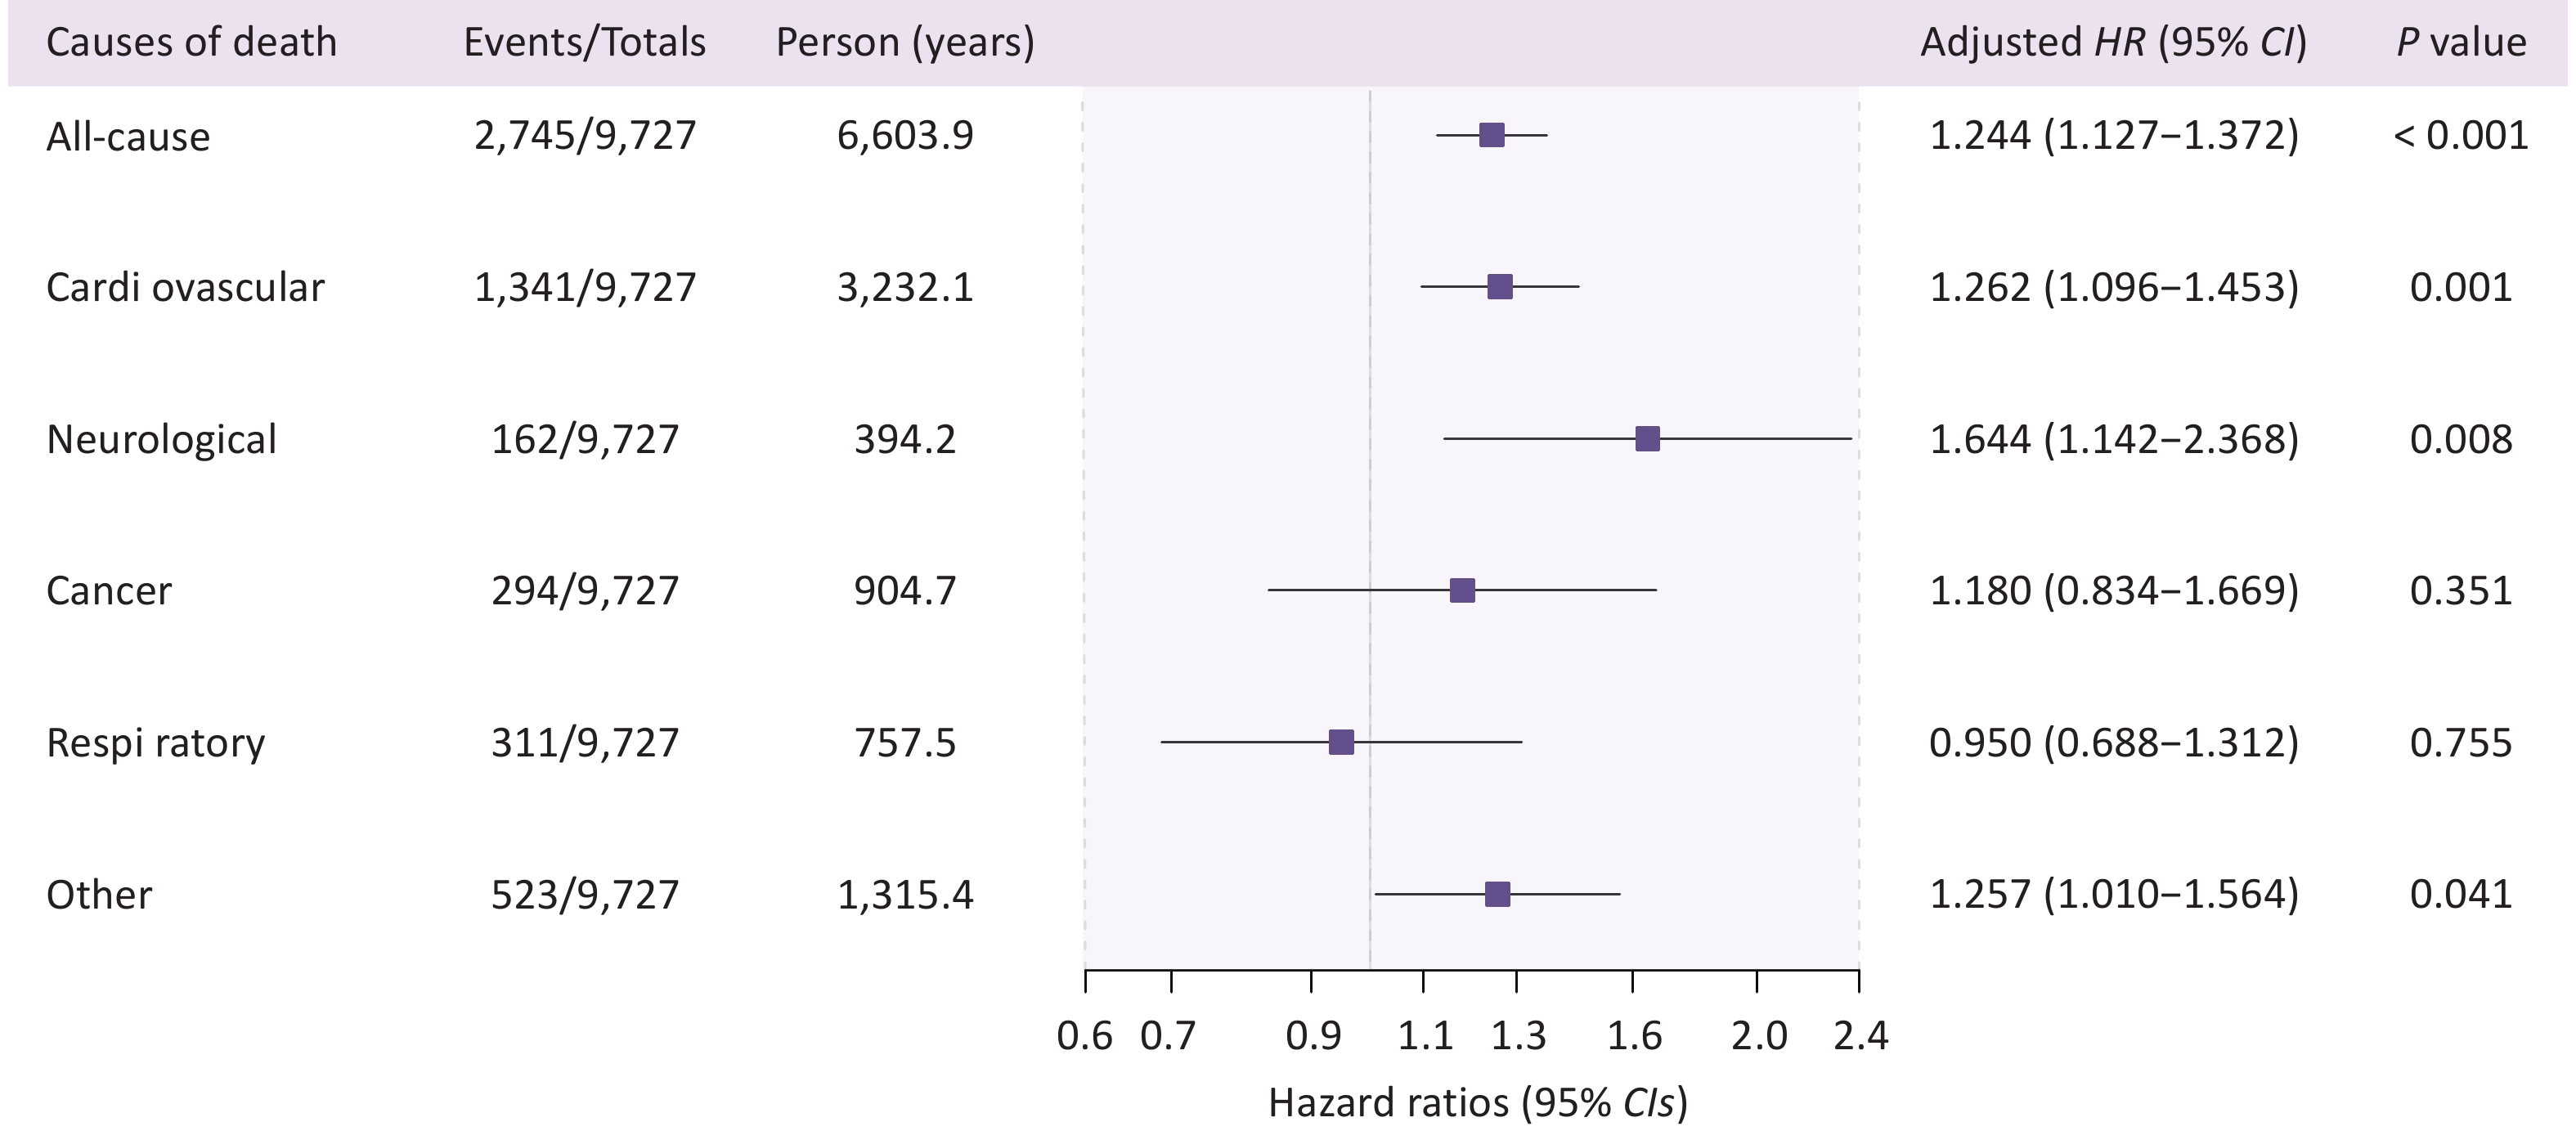
Covariate-adjusted Cox proportional hazard regression models revealed that urinary cobalt levels were consistently associated with all-cause and cause-specific mortality outcomes (Supplementary Table S4), with Model IV designated as the final model in this study. We found that elevated urinary cobalt levels were associated with a higher risk of all-cause, cardiovascular, neurological, and other-cause mortality (24.4%, 26.2%, 64.4%, and 25.7% risk elevation per unit increase in urinary cobalt, respectively), whereas no association was observed between urinary cobalt concentration and cancer or respiratory mortality (Figure 1). Furthermore, compared with Q1, Q4 showed a significant association with both all-cause and cause-specific mortality (excluding cancer and respiratory disease), with a significant trend observed for both (P < 0.05, Table 2). Notably, compared to the Q1 group, higher urinary cobalt levels in (Q2 and Q3 groups) showed significantly associated with respiratory mortality (Table 2).
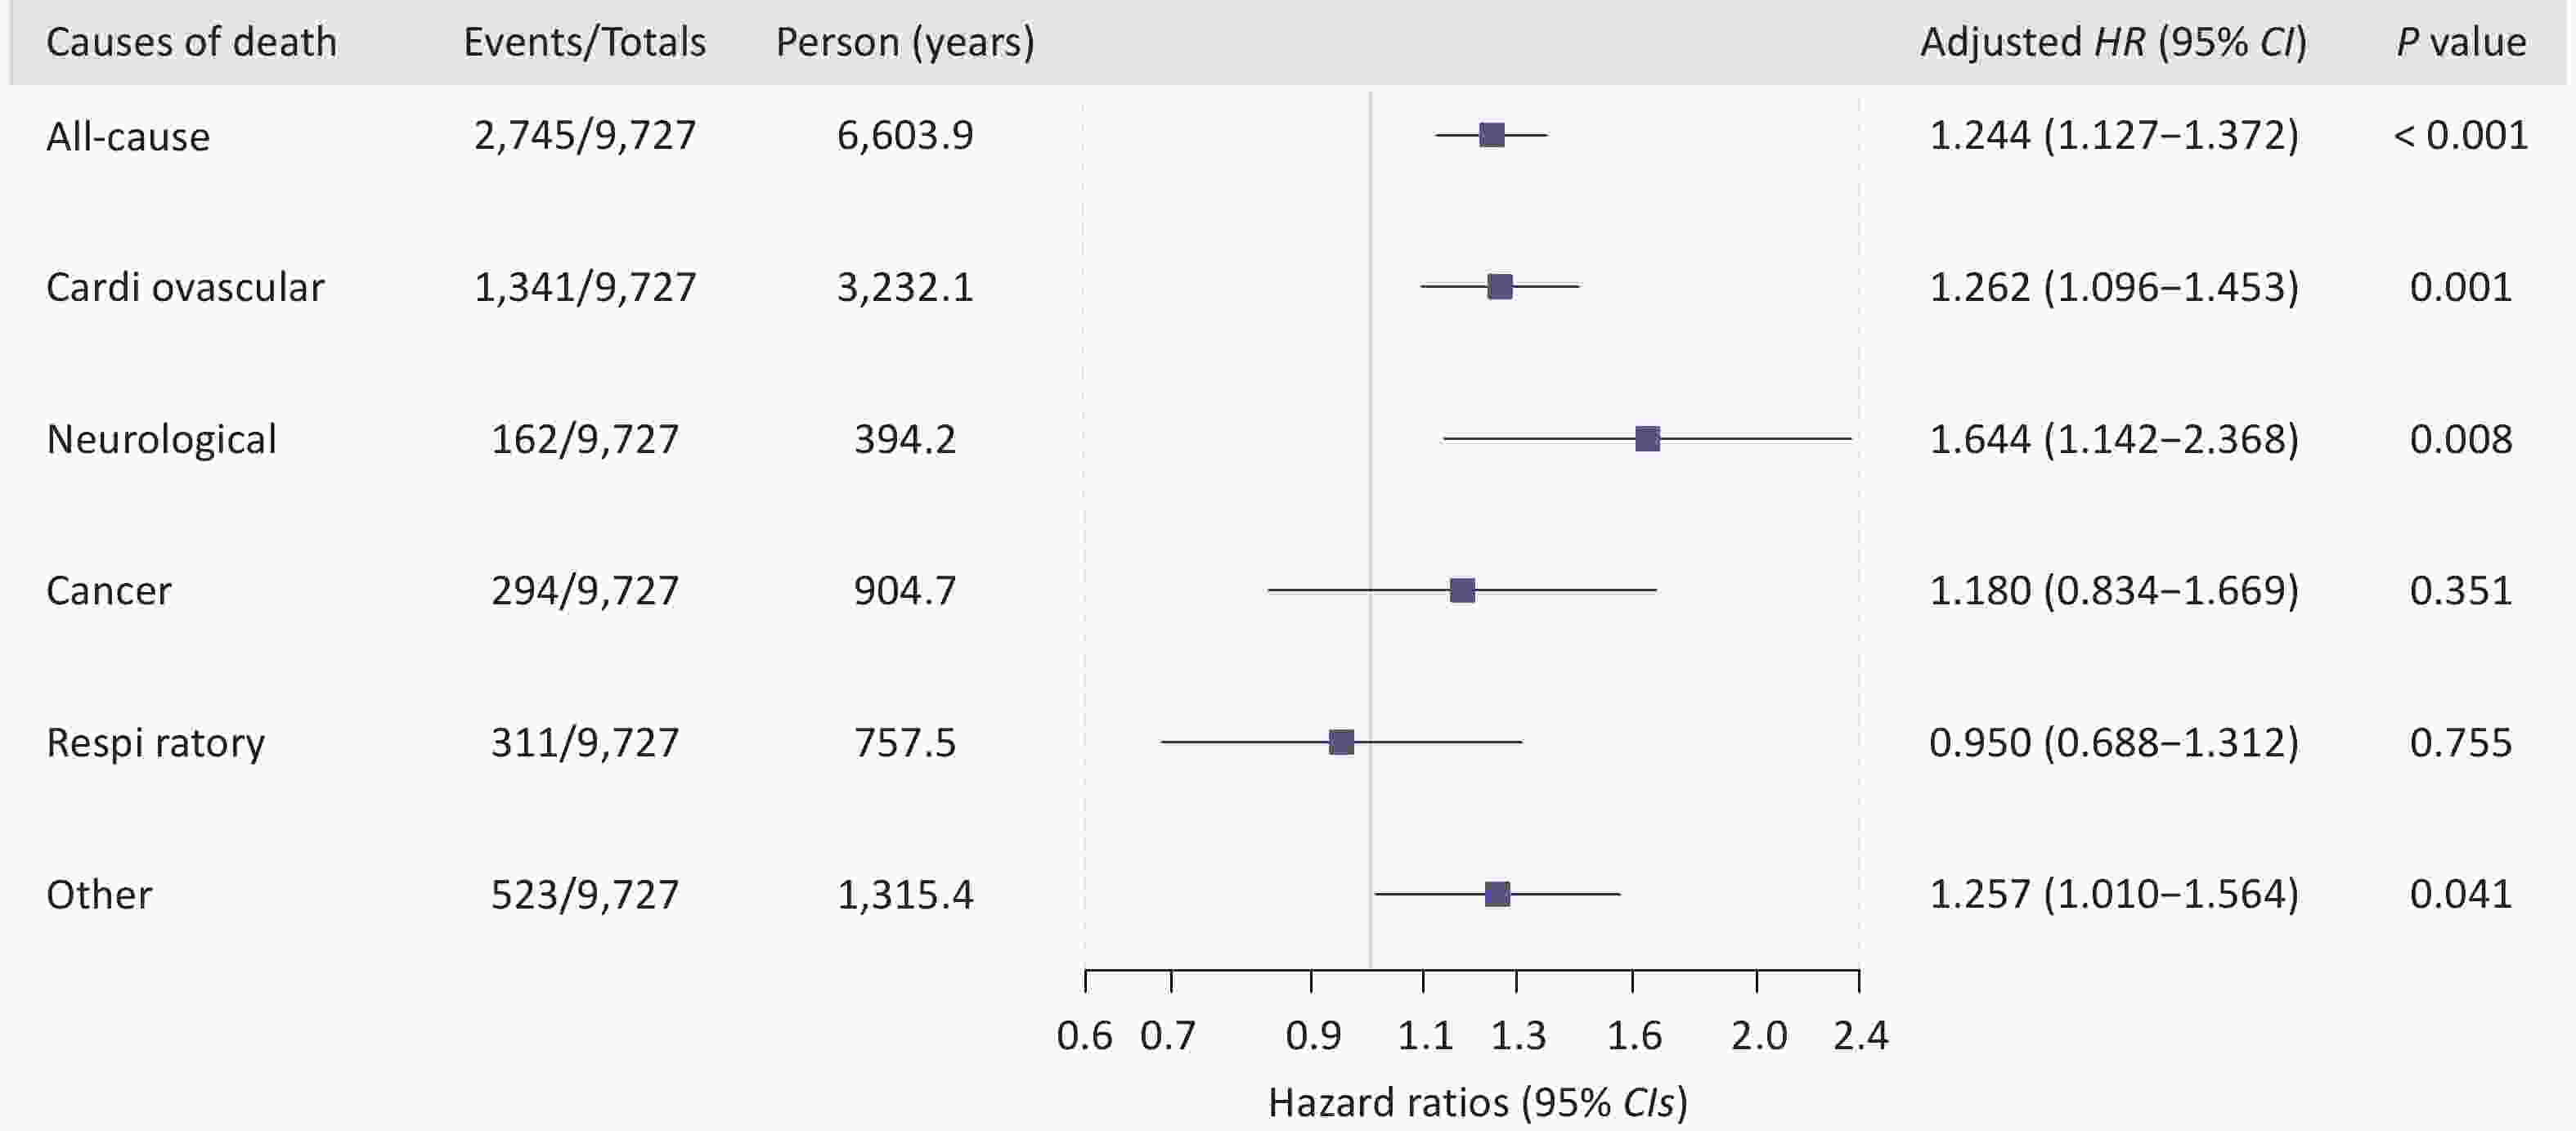
Figure 1. Forest plot of hazard ratios and 95% confidence intervals for urinary cobalt and mortality risk (All-cause and cause-specific). HR, hazard ratio; CI, confidence interval. HRs and 95% CIs are adjusted for age, sex, ethnicity, marital status, educational attainment, economic status, residential area, body mass index, smoking, drinking, meat consumption, fruit consumption, vegetable consumption, diabetes, hypertension, dyslipidemia, chronic kidney disease and cohort batch. Neurological mortality corresponds to ICD-10 codes G00–G99 (covering all neurological disorders), cancer mortality to codes C00–C99 (covering all malignant neoplasms), respiratory mortality to codes J00–J99 (covering all respiratory system diseases), and cardiovascular mortality to codes I00–I99 (covering all circulatory system diseases), with all remaining deaths that did not fall into the above categories (i.e., those with ICD-10 codes outside the ranges G00–G99, C00–C99, J00–J99, and I00–I99) grouped under the category of “other causes of mortality.”
Outcomes Unit Events/Total HR (95% CI) P-value Total mortality Per IQR 2,745/9,727 1.060 (1.033, 1.088) < 0.001 Q1 622/2,552 1.000 (Ref.) Q2 618/2,345 1.120 (1.000, 1.254) 0.051 Q3 691/2,403 1.176 (1.050, 1.318) 0.005 Q4 814/2,427 1.292 (1.155, 1.445) < 0.001 P for trend < 0.001 Cardiovascular mortality Per IQR 1,341/9,727 1.064 (1.025, 1.105) 0.001 Q1 316/2,552 1.000 (Ref.) Q2 300/2,345 1.097 (0.934, 1.288) 0.261 Q3 336/2,403 1.167 (0.993, 1.372) 0.061 Q4 389/2,427 1.248 (1.065, 1.464) 0.006 P for trend 0.004 Neurological mortality Per IQR 162/9,727 1.143 (1.036, 1.260) 0.008 Q1 31/2,552 1.000 (Ref.) Q2 33/2,345 1.390 (0.844, 2.290) 0.195 Q3 39/2,403 1.672 (1.018, 2.748) 0.042 Q4 59/2,427 2.371 (1.498, 3.754) < 0.001 P for trend < 0.001 Cancer mortality Per IQR 294/9,727 1.045 (0.952, 1.147) 0.351 Q1 81/2,552 1.000 (Ref.) Q2 76/2,345 0.957 (0.695, 1.317) 0.787 Q3 67/2,403 0.825 (0.587, 1.161) 0.270 Q4 70/2,427 0.905 (0.638, 1.285) 0.577 P for trend 0.571 Respiratory mortality Per IQR 311/9,727 0.986 (0.905, 1.075) 0.755 Q1 55/2,552 1.000 (Ref.) Q2 82/2,345 1.619 (1.144, 2.291) 0.007 Q3 88/2,403 1.541 (1.083, 2.192) 0.016 Q4 86/2,427 1.339 (0.931, 1.925) 0.115 P for trend 0.281 Other causes of mortality Per IQR 523/9,727 1.063 (1.003, 1.127) 0.041 Q1 125/2,552 1.000 (Ref.) Q2 107/2,345 0.951 (0.731, 1.237) 0.709 Q3 127/2,403 1.025 (0.790, 1.329) 0.854 Q4 164/2,427 1.253 (0.974, 1.612) 0.079 P for trend 0.037 Note. HR, hazard ratio; IQR, interquartile range, Q1-Q4: quartiles 1-4, Ref, reference. HRs and 95% CIs are adjusted for age, sex, ethnicity, marital status, educational attainment, economic status, residential area, body mass index, smoking, drinking, meat consumption, fruit consumption, vegetable consumption, diabetes, hypertension, dyslipidemia, chronic kidney disease, and cohort batch. Neurological mortality corresponds to ICD-10 codes G00–G99 (covering all neurological disorders), cancer mortality to codes C00–C99 (covering all malignant neoplasms), respiratory mortality to codes J00–J99 (covering all respiratory system diseases), and cardiovascular mortality to codes I00–I99 (covering all circulatory system diseases), with all remaining deaths that did not fall into the above categories (i.e., those with ICD-10 codes outside the ranges G00–G99, C00–C99, J00–J99, and I00–I99) grouped under the category of “other causes of mortality.” Table 2. Hazard ratios and 95% confidence interval for the association between urinary cobalt and all-cause mortality and cause-specific mortality across urinary cobalt concentration categories.
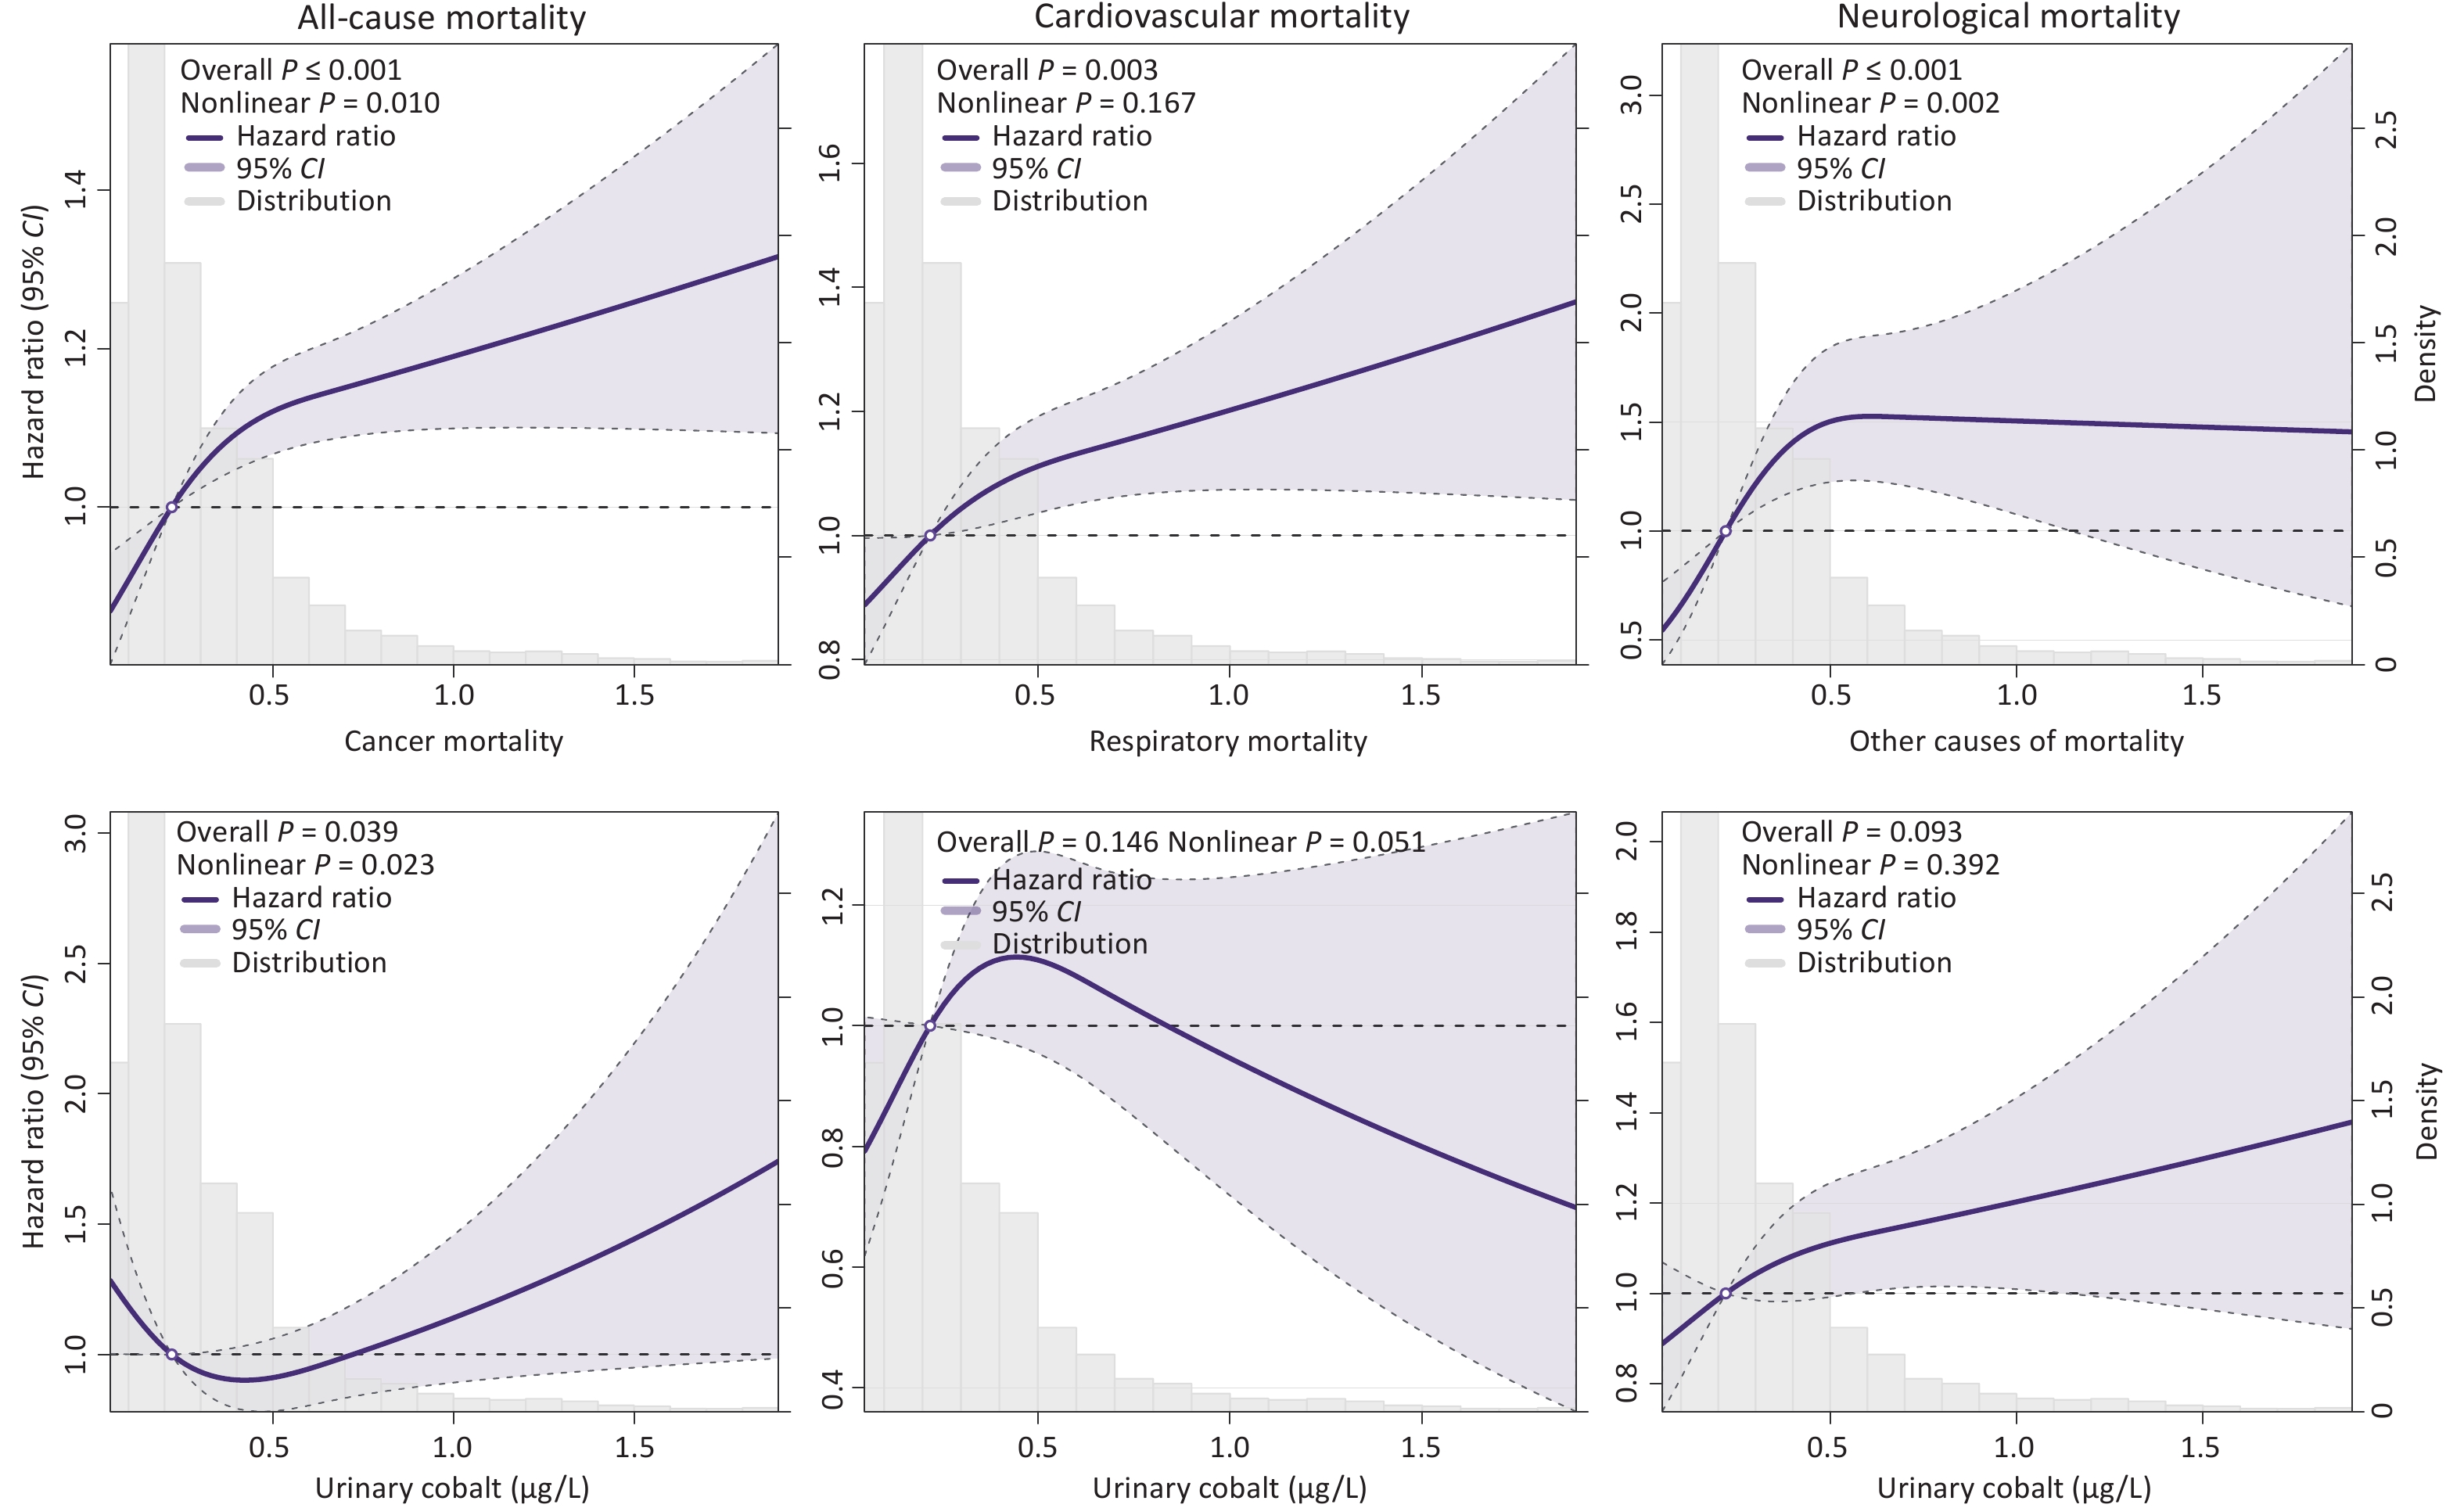
To further characterize the potential nonlinear associations between urinary cobalt levels and all-cause and cause-specific mortality, the results of the RCS analysis demonstrated nonlinear relationships between urinary cobalt concentrations and all-cause, neurological, and cancer mortality, which exhibited inverted J-shaped, inverted L-shaped, and U-shaped patterns, respectively (Figure 2). No nonlinear associations were observed for cardiovascular, respiratory, or other causes of mortality (all nonlinear P > 0.05).
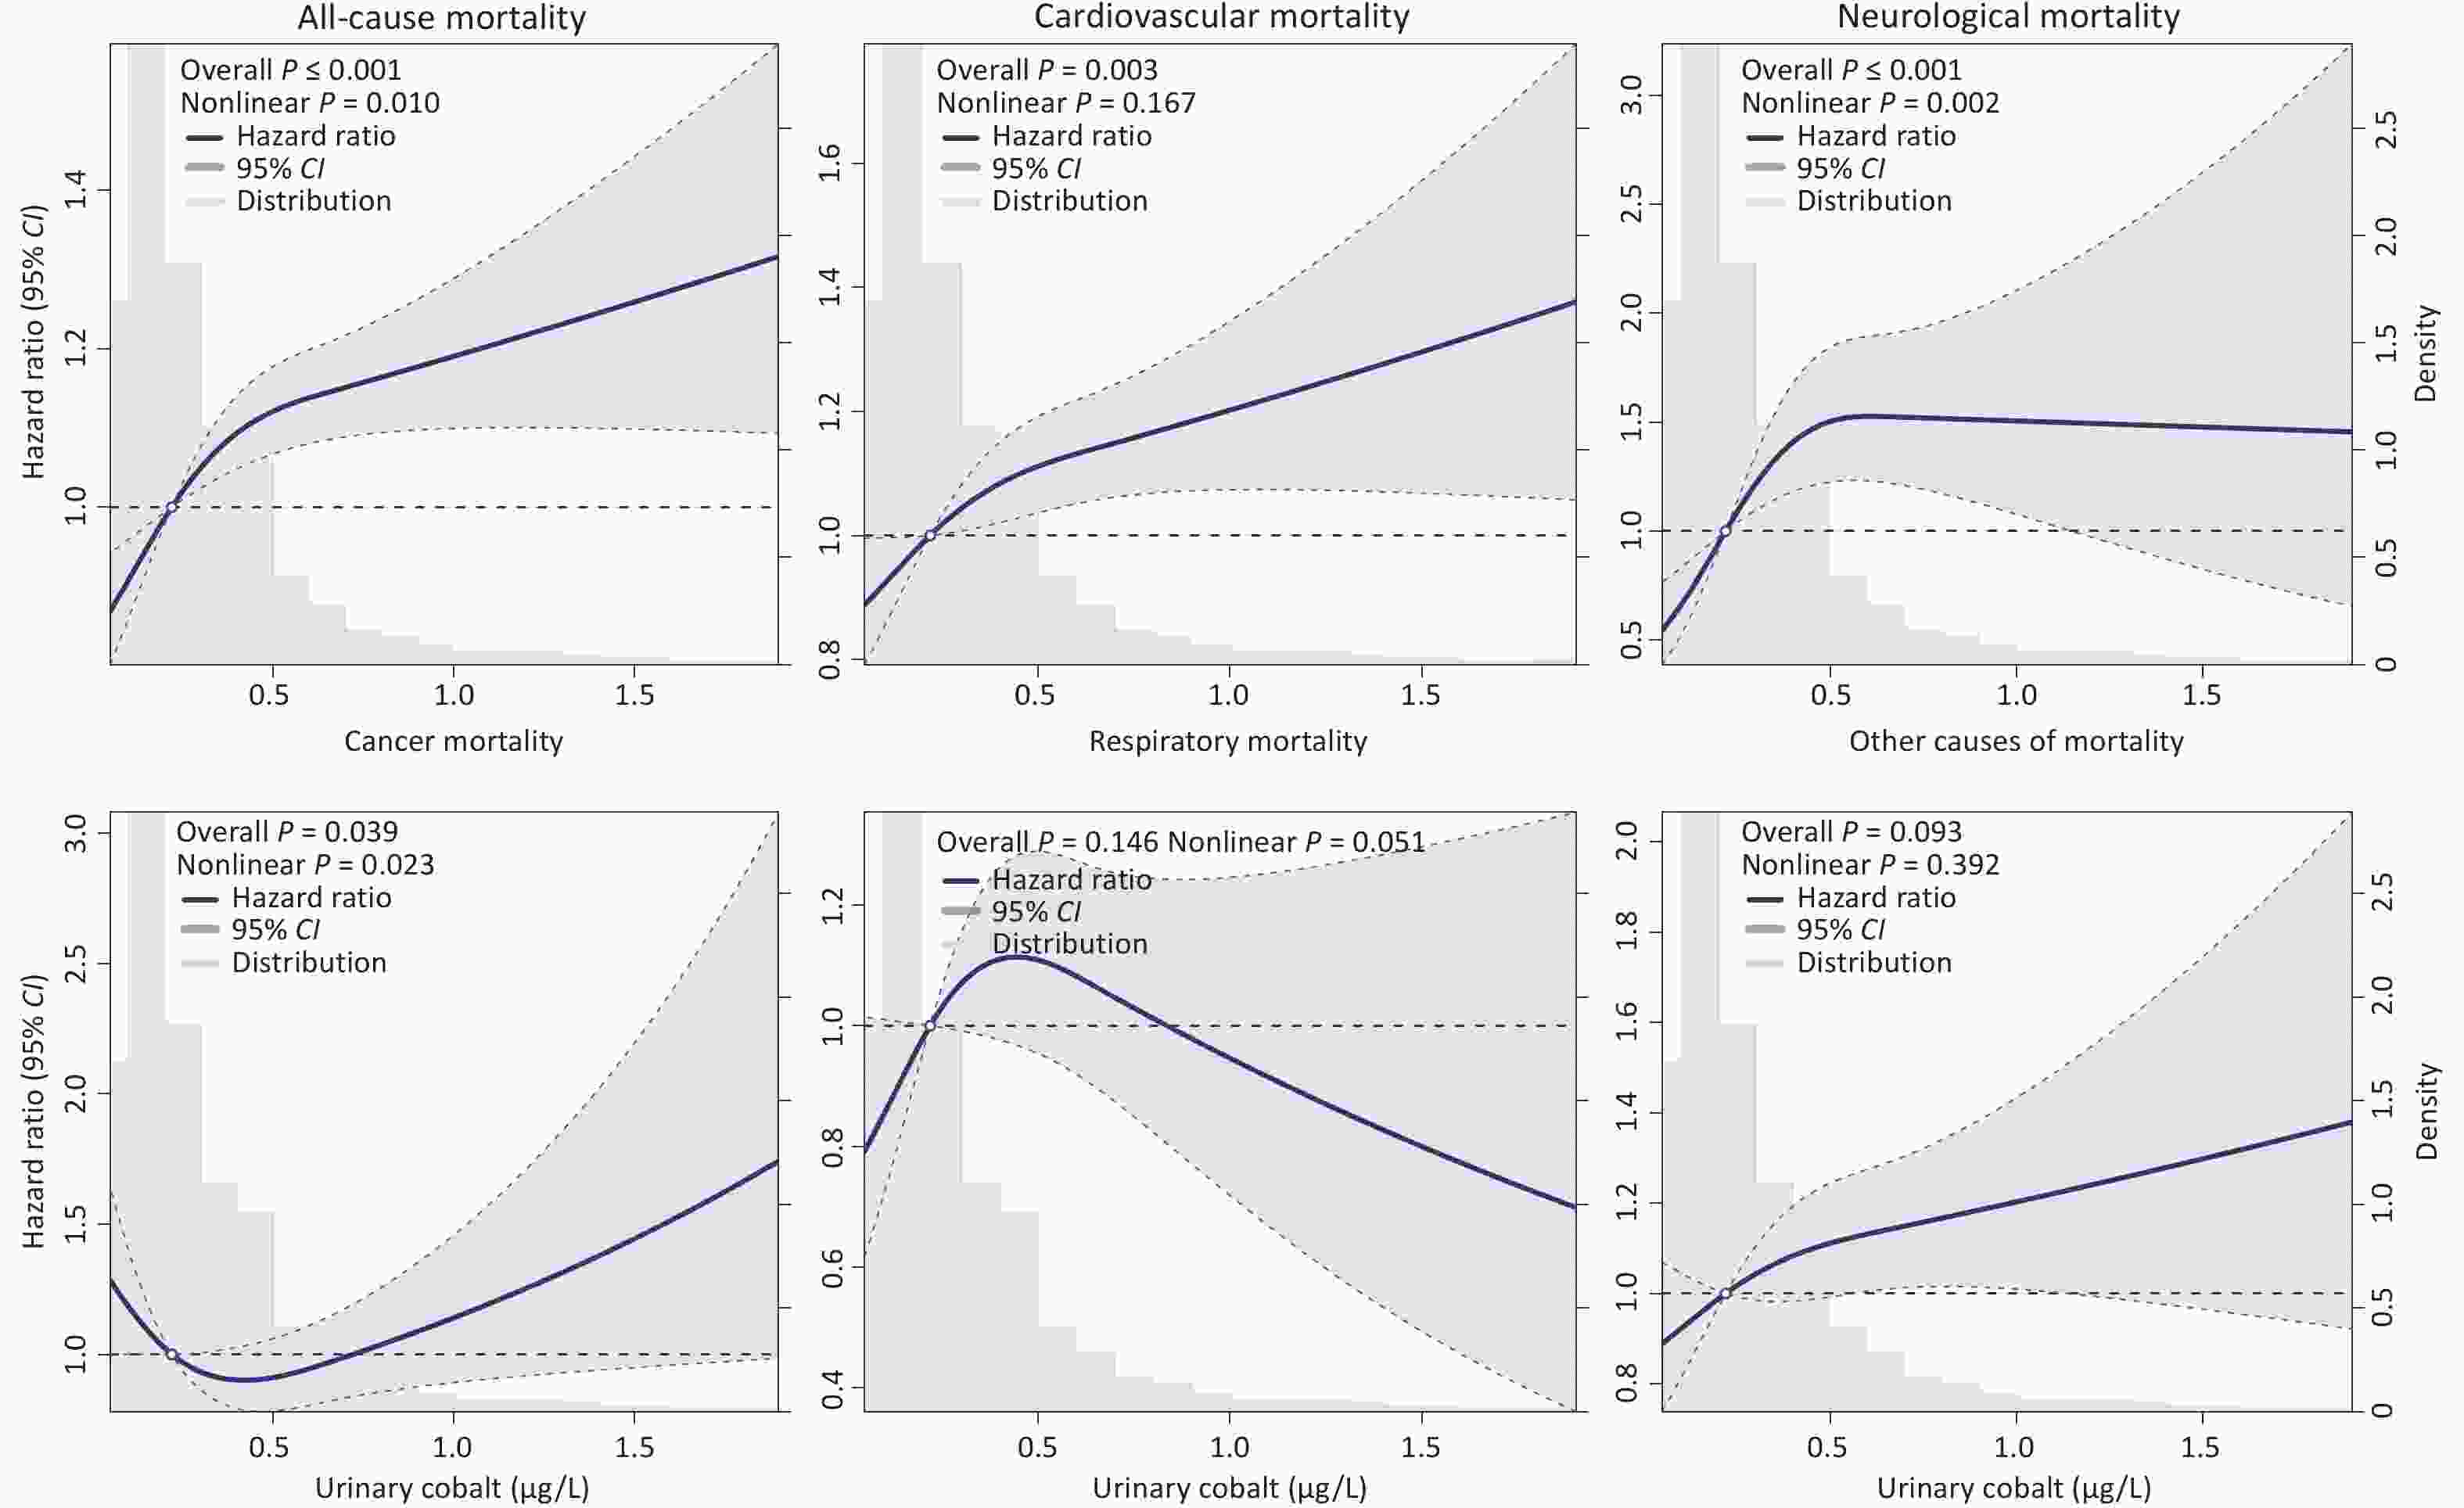
Figure 2. The nonlinear relationship between urinary cobalt and all-cause and cause-specific mortality using restricted cubic splines. CI, confidence interval. Hazard ratios and 95% CIs are adjusted for age, sex, ethnicity, marital status, educational attainment, economic status, residential area, body mass index, smoking, drinking, meat consumption, fruit consumption, vegetable consumption, diabetes, hypertension, dyslipidemia, chronic kidney disease and cohort batch. Neurological mortality corresponds to ICD-10 codes G00–G99 (covering all neurological disorders), cancer mortality to codes C00–C99 (covering all malignant neoplasms), respiratory mortality to codes J00–J99 (covering all respiratory system diseases), and cardiovascular mortality to codes I00–I99 (covering all circulatory system diseases), with all remaining deaths that did not fall into the above categories (i.e., those with ICD-10 codes outside the ranges G00–G99, C00–C99, J00–J99, and I00–I99) grouped under the category of “other causes of mortality.”
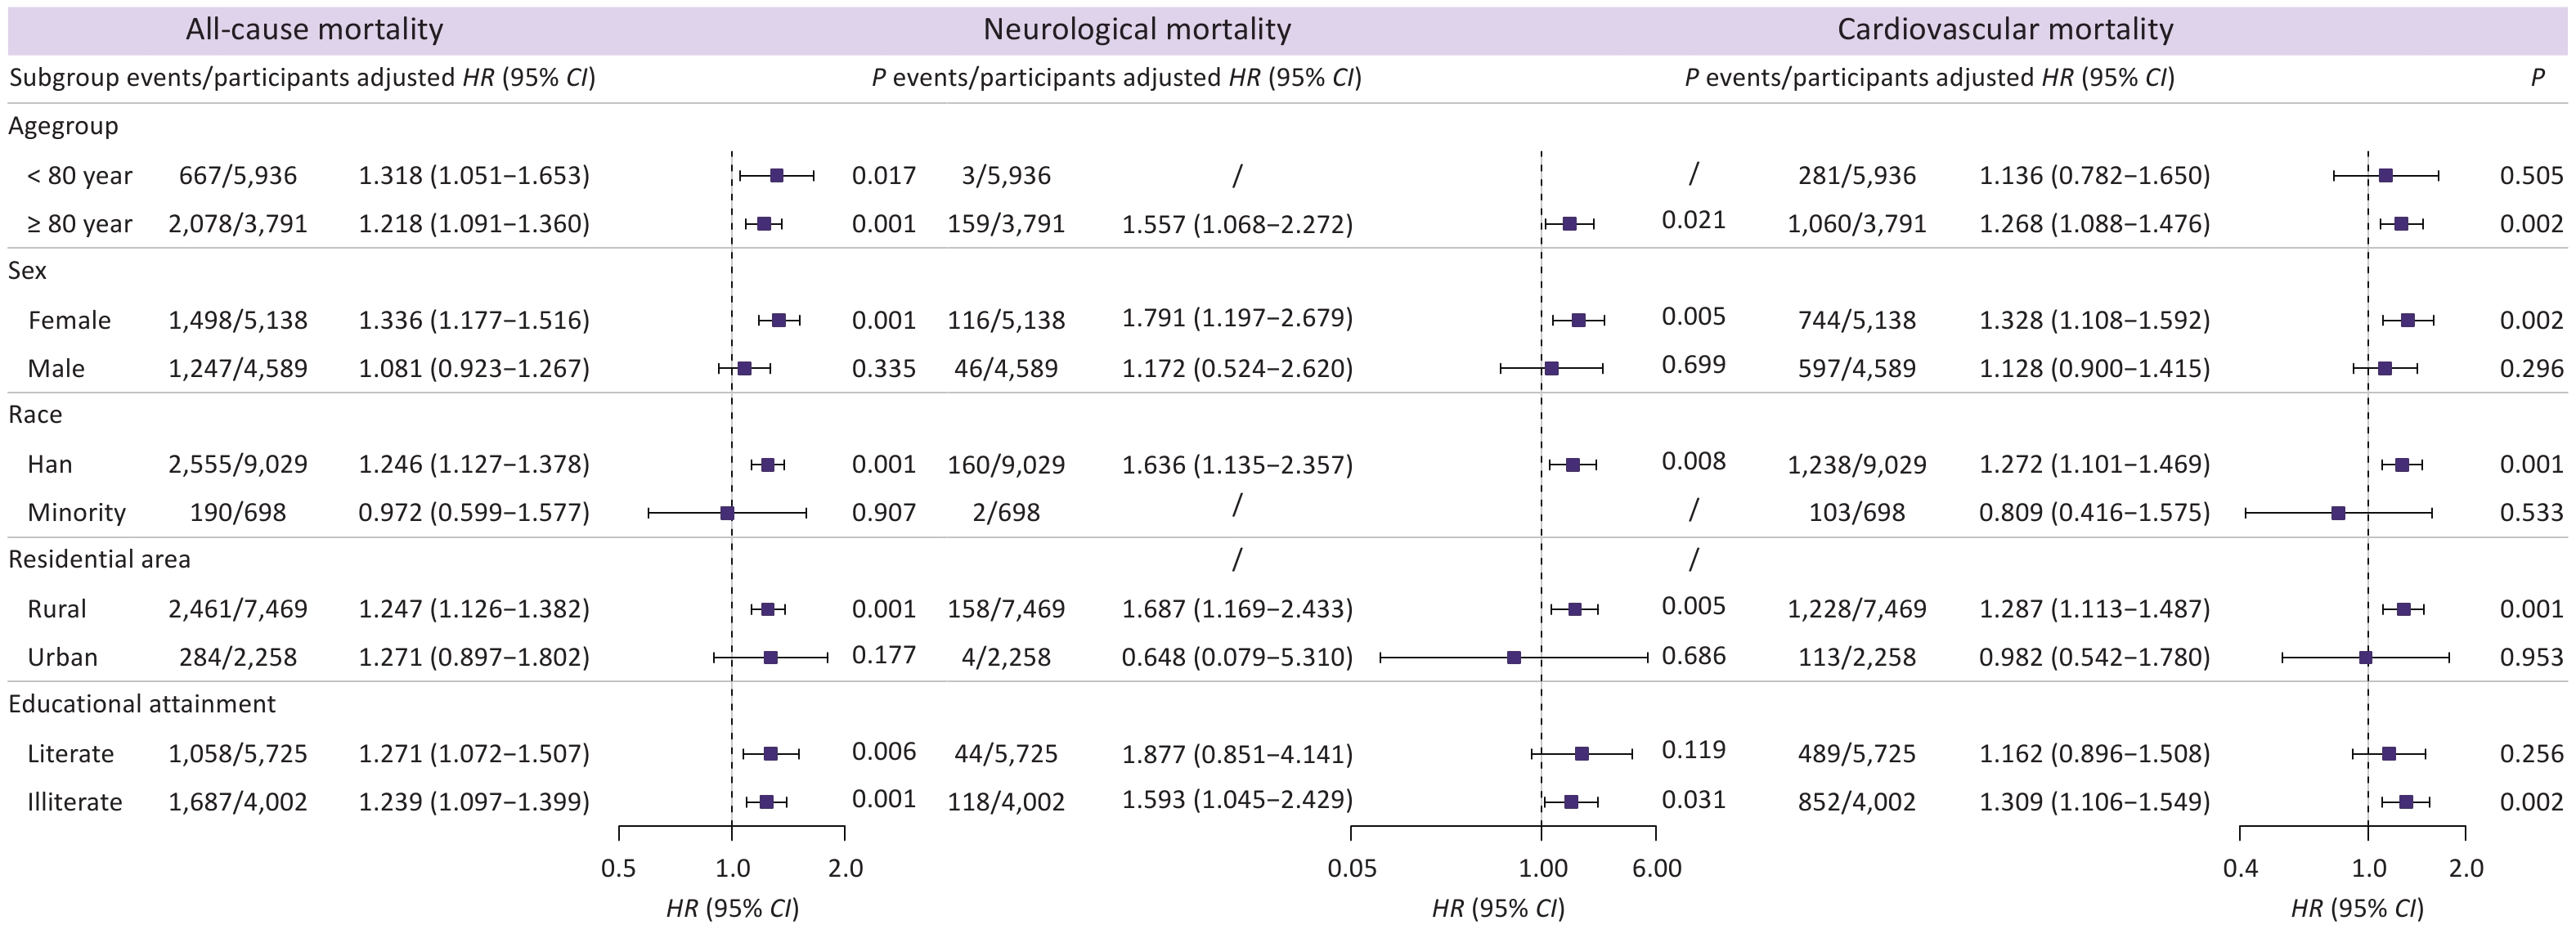
Subgroup analyses demonstrated that elevated urinary cobalt levels were primarily associated with an increased risk of all-cause mortality among female, Han ethnicity, and rural elderly populations, with HR values and 95% CIs of 1.336 (1.177, 1.516), 1.246 (1.127, 1.378), and 1.247 (1.126, 1.382), respectively (Figure 3). Furthermore, elevated urinary cobalt concentrations were associated with an increased risk of all-cause mortality across different age groups (younger and older elderly adults) and educational levels (illiterate and educated elderly individuals), with relatively small differences in the magnitude of risk. For cardiovascular and neurological mortality, we observed a similar effect, and urinary cobalt was linked to cardiovascular mortality among the oldest-old, but not among younger elderly individuals. Moreover, across educational levels, urinary cobalt increased cardiovascular and neurological mortality risks among illiterate individuals (Figure 3).
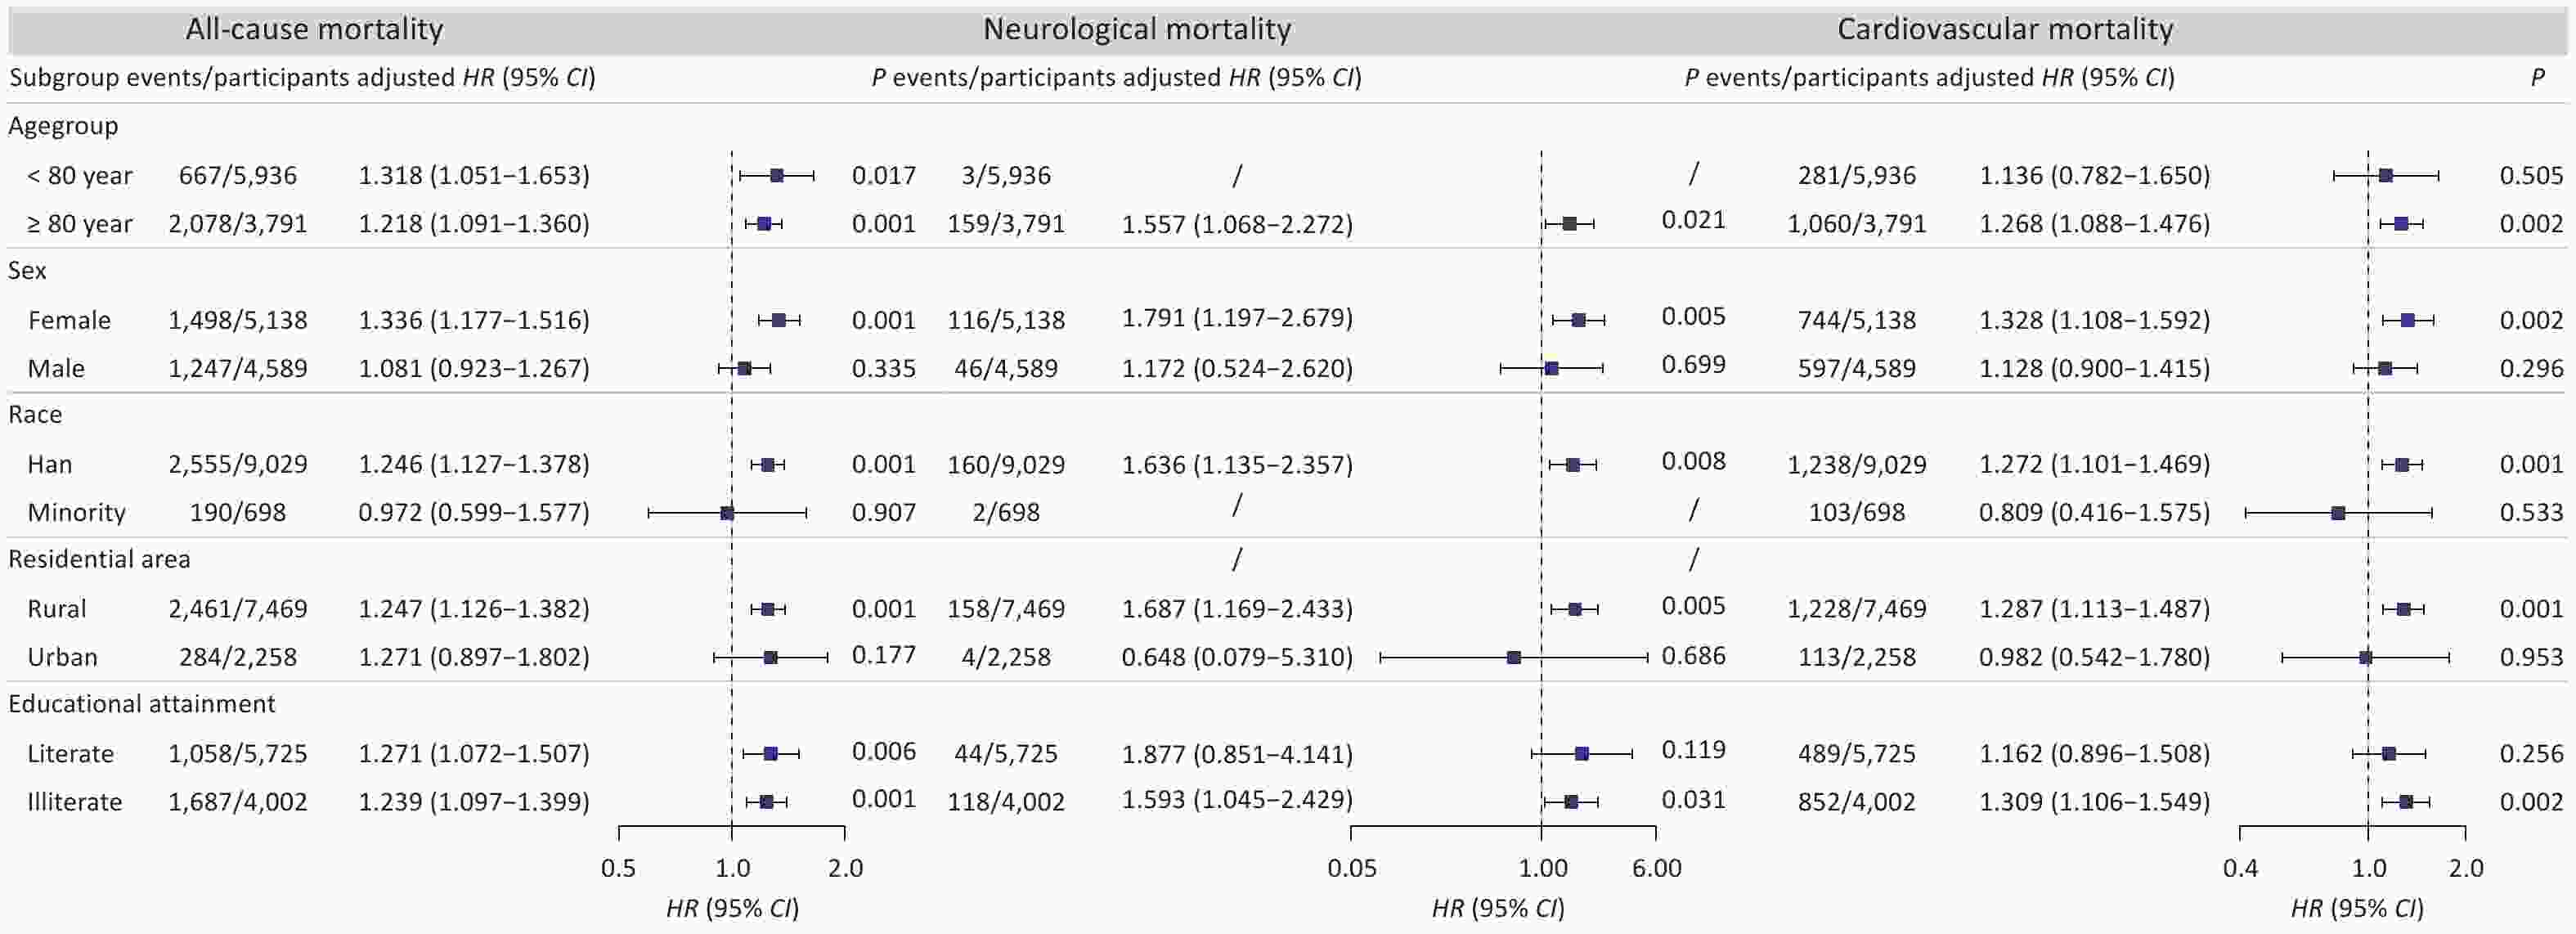
Figure 3. Association between urinary cobalt and all-cause, cardiovascular, and neurological mortality across subgroups. HR, hazard ratio; CI, confidence interval; /, Unable to perform the analysis. According to the ICD-10 classification system, deaths were categorized as neurological diseases (G00-G99) and cardiovascular diseases (I00-I99).
Sensitivity analyses yielded results that were generally consistent with the primary findings (Supplementary Tables S5–S12), with only minor discrepancies. While creatinine-adjusted urinary cobalt analyzed continuously showed no significant association with neurological mortality, quartile-based analysis demonstrated a persistently elevated risk of neurological mortality. Furthermore, after excluding participants who died within the first year of follow-up, the association between urinary cobalt concentrations and cardiovascular mortality was no longer statistically significant in the quartile-based analysis (HR > 1, though non-significant). However, this effect remained statistically significant when urinary cobalt concentrations were analyzed as a continuous variable.
-
This prospective cohort study comprehensively evaluated the association between urinary cobalt concentrations and mortality among older adults in China. Higher urinary cobalt concentrations were associated with increased all-cause, cardiovascular, and neurological mortality. Female, Han Chinese individuals, and rural residents were susceptible to all-cause mortality associated with cobalt exposure. Additionally, the oldest-old adults and illiterate individuals were particularly vulnerable to cardiovascular mortality.
Our findings that elevated cobalt exposure is associated with increased risks overall and cardiovascular mortality risk are consistent with prior evidence. He et al. demonstrated that a log-unit increase in urinary cobalt concentration corresponded to a 19% increased risk of all-cause mortality (HR = 1.190) and a 32% increased risk of cardiovascular mortality (HR = 1.320) in adults after accounting for covariates[11]. Furthermore, recent data from the United States linked cobalt exposure to incident frailty, which was identified as a major driver in mixture analyses[16], suggesting that frailty may mediate cobalt-associated mortality. A retrospective cohort study in Nanjing, China, found that elevated urinary cobalt levels increased the risk of atherosclerosis in individuals without dyslipidemia, a key precursor to cardiovascular mortality[8]. Furthermore, Cheng et al. found a dose-dependent relationship between cobalt exposure and cardiovascular mortality[31]. These results are consistent with a multi-ethnic atherosclerosis cohort study in the United States, which found that elevated urinary cobalt levels were associated with higher risks of overall and cardiovascular mortality[12]. However, research by Zhang et al. and Duan et al. involving participants aged 20 years or older did not observe significant links between cobalt exposure and overall and cardiovascular mortality[14,15]. This discrepancy may stem from differences in the populations studied. Our findings regarding cobalt exposure and cancer mortality were consistent with those of previous studies. Evidence gathered from 32,354 workers across five countries, working at 17 manufacturing sites for three companies, revealed that hard metal production, predominantly composed of cobalt, nickel, and tungsten, is not linked to lung cancer[32]. Furthermore, evidence from a long-term cohort study based on the US NHANES 1999–2014 data showed no association between elevated urinary cobalt levels and cancer mortality risk[15].
Although evidence linking cobalt exposure to neurological mortality remains scarce, emerging data have revealed complex and often contradictory associations with neurocognitive outcomes. Inconsistencies persist across studies. Investigations in elderly populations in Iran (n = 191), Italy (n = 35), and Shenzhen, China, reported either no association or potential protective effects of cobalt (serum/urinary) against cognitive impairment[33-35]. Conversely, elevated cobalt levels in the brain tissue were correlated with neuropathology in arthroplasty patients (n = 88)[36], and a recent U.S. Multi-Ethnic Atherosclerosis Study identified an 18% increase in dementia risk per unit increase in urinary cobalt[19]. To the best of our knowledge, this investigation offers initial evidence suggesting a potential association between urinary cobalt levels and neurological mortality, which may help clarify some of the inconsistencies observed in prior neurocognitive research.
This study identified female, Chinese Han, and rural older adults as vulnerable populations to urinary cobalt exposure. Possible explanations include reduced liver enzyme activity for metabolizing toxins in postmenopausal female because of declining estrogen levels[37]. Additionally, lower muscle mass density in female may predispose them to subclinical renal impairment, leading to impaired cobalt excretion[38,39]. The dietary patterns of the Han Chinese population may facilitate a higher cobalt intake, potentially compounded by genetic polymorphisms that affect bone metabolism or toxic response mechanisms. Older rural adults may exhibit relatively low health awareness and limited dietary variety. Further research is necessary to verify these observations and to better understand the possible biological mechanisms.
The biological pathway linking cobalt exposure to increased mortality risk may involve disruption of cellular redox homeostasis[4]. Cobalt exposure disrupts cellular redox homeostasis through two primary pathways[40,41]: (1) Reduction in reduced glutathione (GSH) levels accompanied by increased oxidized glutathione (GSSG) and (2) Formation of ROS, with notable production of superoxide radicals. Disruption of cellular redox homeostasis may trigger lipid peroxidation and DNA damage, subsequently leading to increased apoptosis or necrosis, thereby increasing the risk of tissue injury and mortality[42]. Specifically, for cardiovascular mortality, cobalt induces ferroptosis-like cell death in cardiac tissues by elevating intracellular Fe2+, enhancing reactive oxygen species (ROS) production, inhibiting glutathione peroxidase 4 (GPX4), and promoting lipid peroxidation, resulting in cardiomyocyte apoptosis, arrhythmias, heart failure, and increased cardiovascular disease-specific deaths[43]. Additionally, cobalt cardiomyopathy manifests as a potentially lethal systolic dysfunction via direct myocardial toxicity, oxidative stress, and disruption of calcium homeostasis, further increasing cardiovascular mortality in elderly individuals[44]. Regarding neurological mortality, cobalt exposure triggers neurotoxicity through DNA damage, excessive ROS accumulation, mitochondrial impairment, and activation of hypoxia-inducible factor-1α (HIF-1α), leading to impaired autophagic flux, neuronal apoptosis, and progression of neurodegenerative disorders such as amyotrophic lateral sclerosis (ALS), which culminate in fatal motor neuron degeneration and respiratory failure in older adults[45]. Cobalt also contributes to cobalt-encephalopathy by inducing cellular hypoxia, antioxidant imbalance, and m6A RNA methylation dysregulation, fostering oligodendrocyte and microglial damage, hypometabolic brain regions, and eventual neurological death in susceptible elderly populations with chronic exposure[46].
To our knowledge, no previous large prospective cohort study has comprehensively assessed urinary cobalt concentrations in relation to cause-specific mortality among elderly individuals in China. However, several limitations must be considered. First, the exclusive reliance on elderly Chinese participants may reduce the external validity of the findings, particularly in other populations. Second, the relatively short follow-up period suggests that future studies with extended monitoring may provide deeper insight into the link between metal biomarkers and mortality. Nevertheless, due to the high mortality rate among older adults, a substantial number of outcome events occurred, which enabled us to identify a statistically significant association between urinary cobalt levels and all-cause mortality. Third, although we adjusted for a wide range of covariates, data limitations precluded the inclusion of physical activity, a potential confounder modifying heavy metal exposure risks through detoxification, reduced inflammation, and cardiovascular protection[47]. This may introduce residual confounding and, thus, overestimate the adverse effects of cobalt exposure[48]. Future studies should incorporate assessments of physical activity to generate more robust and reliable results. Fourth, the definition of diabetes relied solely on self-reports and fasting plasma glucose, potentially underdiagnosing cases by excluding oral glucose tolerance tests, which might have biased the estimates toward the null. Fifth, the small number of outcome events observed in certain demographic subgroup analyses for all-cause and cause-specific mortality might have reduced the statistical power. Therefore, future studies with larger sample sizes and higher event counts are required to validate these findings. Finally, a single baseline urinary cobalt measurement may not accurately reflect true exposure levels during follow-up, necessitating repeated measurements in future studies to enhance the reliability of the exposure assessment.
-
Urinary cobalt is primarily associated with elevated cardiovascular and neurological mortality among older Chinese adults. The associations varied across population subgroups, with female, Han people, illiterate individuals, and rural residents being the most vulnerable. These results suggest that exposure to environmental cobalt may be an emerging and preventable risk factor for mortality, and may assist in the development of prevention strategies targeting cardiovascular and neurological health through cobalt exposure mitigation, especially for female, Han people, illiterate individuals, and rural residents.
HTML
Study Cohort
Assessment of Urinary Cobalt
Definition and Classification of Mortality
Study Covariables
Statistics Analysis
Competing Interests The authors declare no conflicts of interest associated with this study.
Ethics The HABCS and CNHBM projects were approved by the Ethics Review Board of China's National Institute of Environmental Health, Chinese Center for Disease Control and Prevention (approval nos. 202029 and 202031, respectively). The “Measures for the Ethical Review of Biomedical Research Involving Human Subjects” and “Measures for the Ethical Review of Life Sciences and Medical Research Involving Human Subjects” regulations have been observed.
Authors’ Contributions Conceptualization, Methodology, Software, Formal analysis, Writing– original draft: Yudong Wu and Yongqiang Chen; Conceptualization, Writing– original draft: Chen Chen and Liang Ding; Investigation, Data curation: Linsen Yang and Kai Zhang and Xi Meng; Conceptualization and Investigation: Wenhui Shi, Yang Li, Jiahao Chen and Yue Chen; Investigation, Methodology: Yingli Qu, Wanyin Shi, Ziyu Hu, Fanye Long, Lijun Wang, and Luxi Wei; Investigation, Conceptualization, Data curation: Ying Zhu, Jinhui Zhou, Feng Zhao, Ying Zhu and Maigeng Zhou; Writing - review & editing, Supervision, Project administration, Funding acquisition, Data curation, Conceptualization: Yuebin Lv and Xiaoming Shi. All authors have reviewed and agreed to the final version of this manuscript.
Data Sharing Deidentified participant data that support the findings of this study will be made available upon publication from the corresponding author upon reasonable request, for the purpose of replicating the procedures and results reported in this Article. The shared data will include the anonymized datasets analyzed in this study. Data requests should include a brief research proposal outlining the intended use. Access is subject to a formal material transfer agreement, approval by the relevant ethical review boards, and compliance with legal and ethical requirements. The data will be shared with qualified researchers for scientifically approved purposes.
&These authors contributed equally to this work.

 Quick Links
 DownLoad: