
-
Particulate matter 2.5 (PM2.5) refers to atmospheric particles suspended in the air with diameters ≤ 2.5 μm, consisting of both organic and inorganic components[1]. Currently, epidemiological findings linking short-term PM2.5 exposure to lung function remain inconsistent[2,3]. Evidence from a study in Jinan (China) found that increased PM2.5 levels were associated with a decline in lung function[2]. In contrast, a study involving 40 healthy young men in Beijing reported that elevated PM2.5 levels over 3 days, corresponded to improved lung function[3]. These inconsistent findings may be partly explained by variations in PM2.5 composition, which comprises multiple components with different sources and toxicological properties.
Several studies have explored how PM2.5 is related to lung function[2,3]. For instance, a panel investigation involving 76 older participants found that contact with individual PM2.5 components was linked to a decline in lung function[2]. Conversely, Wu et al. reported positive associations between chlorine ions (Cl-), zinc (Zn), copper (Cu), vanadium (V), lead (Pb), and tin (Sn) and lung function on a 3-day moving average in healthy young adults[3]. The different compositions of PM2.5, may partly explain the inconsistent findings across existing studies. However, research explicitly addressing the mixed exposure to PM2.5 components remains limited. Therefore, it is essential to investigate how PM2.5 components relate to lung function, examine component interactions, identify key components, and provide evidence for developing customized prevention and control measures.
This multi-center cross-sectional study was conducted in 10 cities in the Beijing–Tianjin–Hebei (BTH) region and surrounding areas, including Beijing, Tianjin, Jinan, Shijiazhuang, Anyang, Qinhuangdao, Baoding, Langfang, Taiyuan, and Xionganxinqu from 2018 to 2019. In each city, one community was selected as the study site, and 200 participants (20 male and 20 female participants having ages representative of each 10-year period between 40 and 89 years) were recruited from each community. All participants underwent a comprehensive survey covering their characteristics, residential environment, smoking, alcohol consumption, disease history, physical examination, and lung function measurements. Data relative to PM2.5 and its components, such as carbonaceous components, water-soluble inorganic ions (WSIIs), and elemental components, were collected from nearby atmospheric monitoring sites. Components with a detection frequency of > 75% were included in the analysis (Supplementary Table S1). Ultimately, 24 components were included for analysis, including organic carbon (OC), elemental carbon (EC), calcium ion (Ca2+), Cl-, magnesium ion (Mg2+), sodium ion (Na+), potassium ion (K+), ammonium ion (NH4+), sulfate ion (SO42-), nitrate ion (NO3-), barium (Ba), calcium (Ca), chromium (Cr), Cu, iron (Fe), manganese (Mn), potassium (K), nickel (Ni), Pb, selenium (Se), Zn, V, titanium (Ti), thallium (Tl). Trained medical staff conducted lung function tests according to standardized procedures. To ensure accuracy and data quality, lung function measurements were performed twice for each participant. The lung function indicators included forced vital capacity (FVC), forced expiratory volume in 1 s (FEV1), 1-s rate (FEV1/FVC), peak expiratory flow (PEF), forced expiratory flow at 25% FVC (FEF25%), and forced expiratory flow at 75% FVC (FEF75%).
Descriptive analysis of the basic characteristics of participants was performed. Spearman’s correlation analysis was used to examine the relationships between PM2.5, its components, and meteorological parameters including temperature and humidity. Associations of PM2.5, its components, and lung function were assessed using linear mixed-effects (LME) models. Age, sex, body mass index (BMI), education level, smoking status, drinking status, season, temperature, and humidity, with temperature and humidity modeled using natural splines with three degrees of freedom, were included as fixed-term effects, and cities were modeled as random effects in the LME models. To investigate the combined influence of PM2.5 components on lung function, three mixed-exposure models were employed: weighted quantile sum regression (WQS), quantile g-computation (Qgcomp), and Bayesian kernel machine regression (BKMR). Statistical analyses were performed using R v.4.4.3 (R Foundation for Statistical Computing, Vienna, Austria). Two-sided tests were performed to obtain both P-values and false discovery rate (FDR)-adjusted P-values, and statistical significance was defined as P < 0.05.
The study initially recruited 2,045 participants aged 40–89 years. After data quality screening, 1,454 participants with complete lung function and PM2.5 component data were available for analysis. No significant differences in personal characteristics were found between the original 2,045 and the final 1,454 participants. (Supplementary Table S2). The participants included 713 male and 741 female individuals and had a mean age of 65.26 ± 13.47 years and an average BMI of 25.68 ± 3.59 kg/m2. Detailed information on the participants’ characteristics and lung function measurements is presented in Table 1.
Characteristic n (%) or (Mean ± SD) Sex (n, %) Male 713 (49.04) Female 741 (50.96) Age (years, mean ± SD) 65.26 ±13.47 Education (n, %) Primary school degree or less 478 (32.87) Middle/High school degree 769 (52.89) College degree or above 207 (14.24) BMI (kg/m2, mean ± SD) 25.68 ± 3.59 Current smoker (n, %) Yes 286 (19.67) No 1,168 (80.33) Alcohol consumption (n, %) Yes 267 (18.36) No 1,187 (81.64) Lung function (mean ± SD) FVC (L) 2.96 ± 1.77 FEV1 (L) 2.24 ± 1.35 FEV1/FVC (%) 0.77 ± 0.17 PEF (L/s) 3.95 ± 2.54 FEF25% (L/s) 3.20 ± 2.33 FEF75% (L/s) 1.86 ± 1.68 Respiratory disease 23 (1.58) Cardiovascular disease 238 (16.44) Note. N, sample size; SD, standard deviation; BMI, body mass index; FVC, forced vital capacity; FEV1, forced expiratory volume in 1 s; FEV1/FVC, one-second rate; PEF, peak expiratory flow; FEF25%, forced expiratory flow at 25% of FVC; FEF75%, forced expiratory flow at 75% of FVC. Table 1. Characteristics of study participants (N = 1454).
Table 2 summarizes the concentrations of PM2.5 and its components. During the study period, PM2.5 exhibited and average concentration of 71.92 μg/m3. Figure S1 presents the Spearman’s correlation coefficients of PM2.5 and its components. The PM2.5 component concentrations in each city are listed in Supplementary Table S3.
Components Mean SD Min Median Max IQR PM2.5 (μg/m³) 71.92 43.64 3.00 66.62 197.67 72.98 Carbonaceous components (μg/m³) OC 11.57 11.08 0.93 8.93 48.87 7.91 EC 7.93 14.17 0.44 3.30 71.90 4.31 Water-soluble inorganic ions (μg/m³) Ca2+ 2.35 4.43 0.00 0.51 17.26 1.78 Cl- 2.45 1.99 0.03 2.40 11.31 2.29 K+ 1.04 1.43 0.01 0.48 10.45 1.14 NO3- 16.82 14.20 0.22 14.48 61.55 20.61 Mg2+ 0.26 0.41 0.00 0.06 1.51 0.35 Na+ 0.86 1.01 0.03 0.56 6.41 0.37 NH4+ 7.22 7.01 0.17 5.74 32.33 9.76 SO42- 9.30 7.17 0.00 9.65 53.01 12.67 Elemental components (ng/m³) Ba 48.69 89.63 1.23 18.74 364.93 25.42 Ca 435.49 246.40 13.58 379.27 1419.29 355.8 Cr 7.27 7.17 0.00 4.87 36.93 4.60 Cu 66.21 76.54 0.00 34.61 275.50 74.93 Fe 493.58 271.23 33.58 483.86 1,711.31 411.99 K 828.62 494.60 0.78 806.93 1,957.15 689.70 Mn 65.76 38.55 0.74 53.58 180.17 45.71 Ni 10.58 11.57 0.00 7.68 61.58 10.77 Pb 87.76 86.79 0.62 62.62 450.39 69.07 Se 8.06 9.78 0.00 7.18 81.58 6.10 Ti 47.48 56.69 0.01 30.94 281.19 23.42 Tl 3.26 11.89 0.00 1.54 105.58 2.72 V 3.57 13.32 0.00 0.59 109.58 0.96 Zn 294.71 274.49 10.62 229.53 1,280.71 201.52 Daily Average Temperature (°C) 4.23 4.90 -7.50 4.60 11.70 5.80 Relative Humidity (%) 54.72 18.81 18.00 58.00 92.00 26.00 Note. PM2.5, Particulate Matter 2.5; OC, organic carbon; EC, elemental carbon; Ca2+, calcium ion; Cl-, chloride ion; Mg2+, magnesium ion; Na+, sodium ion; K+, potassium ion; NH4+, ammonium ion; SO42-, sulfate ion; NO3-, nitrate ion; Ba, barium; Ca, calcium; Cr, chromium; Cu, copper; Fe, iron; Mn, manganese; K, potassium; Ni, nickel; Pb, lead; Se, selenium; Zn, zinc; V, vanadium; Ti, titanium; Tl, thallium. Table 2. Descriptive statistics of the daily concentrations of PM2.5 and components during the study period
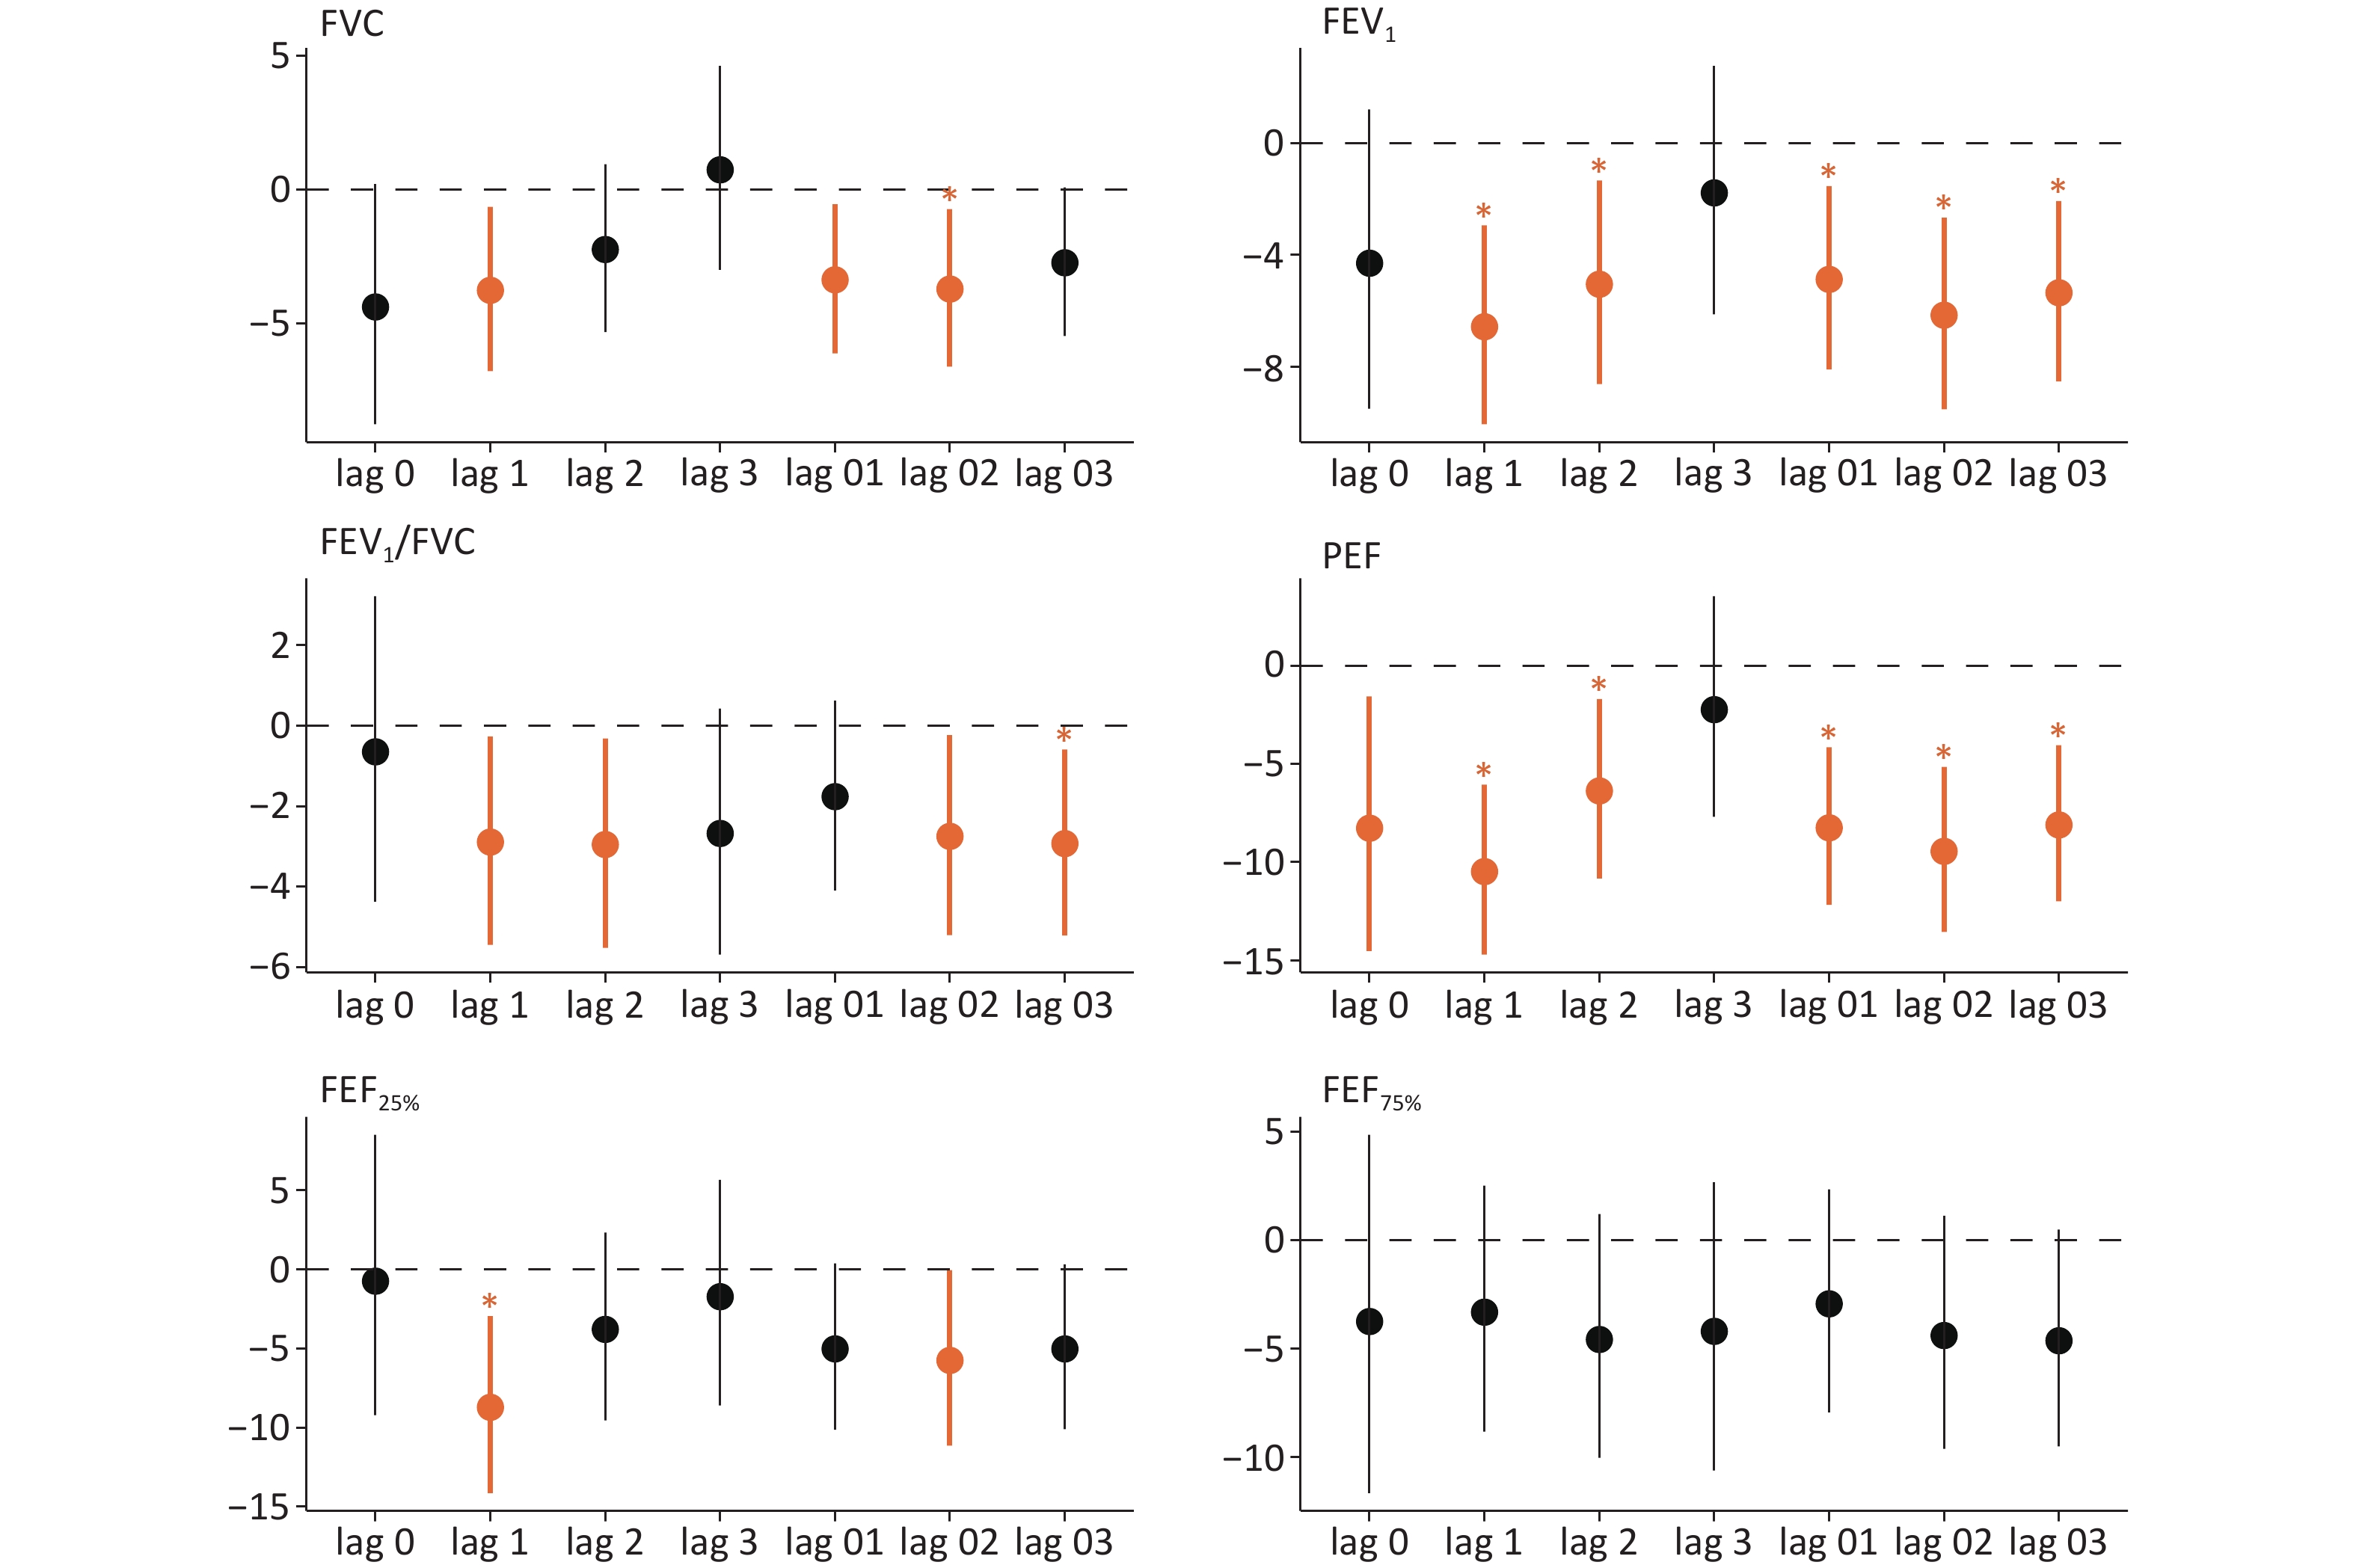
The relationship between PM2.5 and lung function is illustrated in Figure 1. At different lag periods, FVC, FEV1, FEV1/FVC, PEF, and FEF25% were inversely correlated. With a 1-day lag, each IQR rise in PM2.5 was associated with declines in FVC (3.75%, 95% confidence interval (CI): –6.77%, –0.64%), FEV1 (6.56%, 95% CI: –10.05%, –2.94%), FEV1/FVC (2.89%, 95% CI: –5.45%, –0.26%), PEF (10.48%, 95% CI: –14.70%, –6.05%), and FEF25% (8.71%, 95% CI: –14.14%, –2.95%). The greatest changes in lung function, with each IQR increase in PM2.5, were observed with a 1-day lag. Accordingly, a lag of 1 d was selected to analyze the relationships of PM2.5 components with lung function.
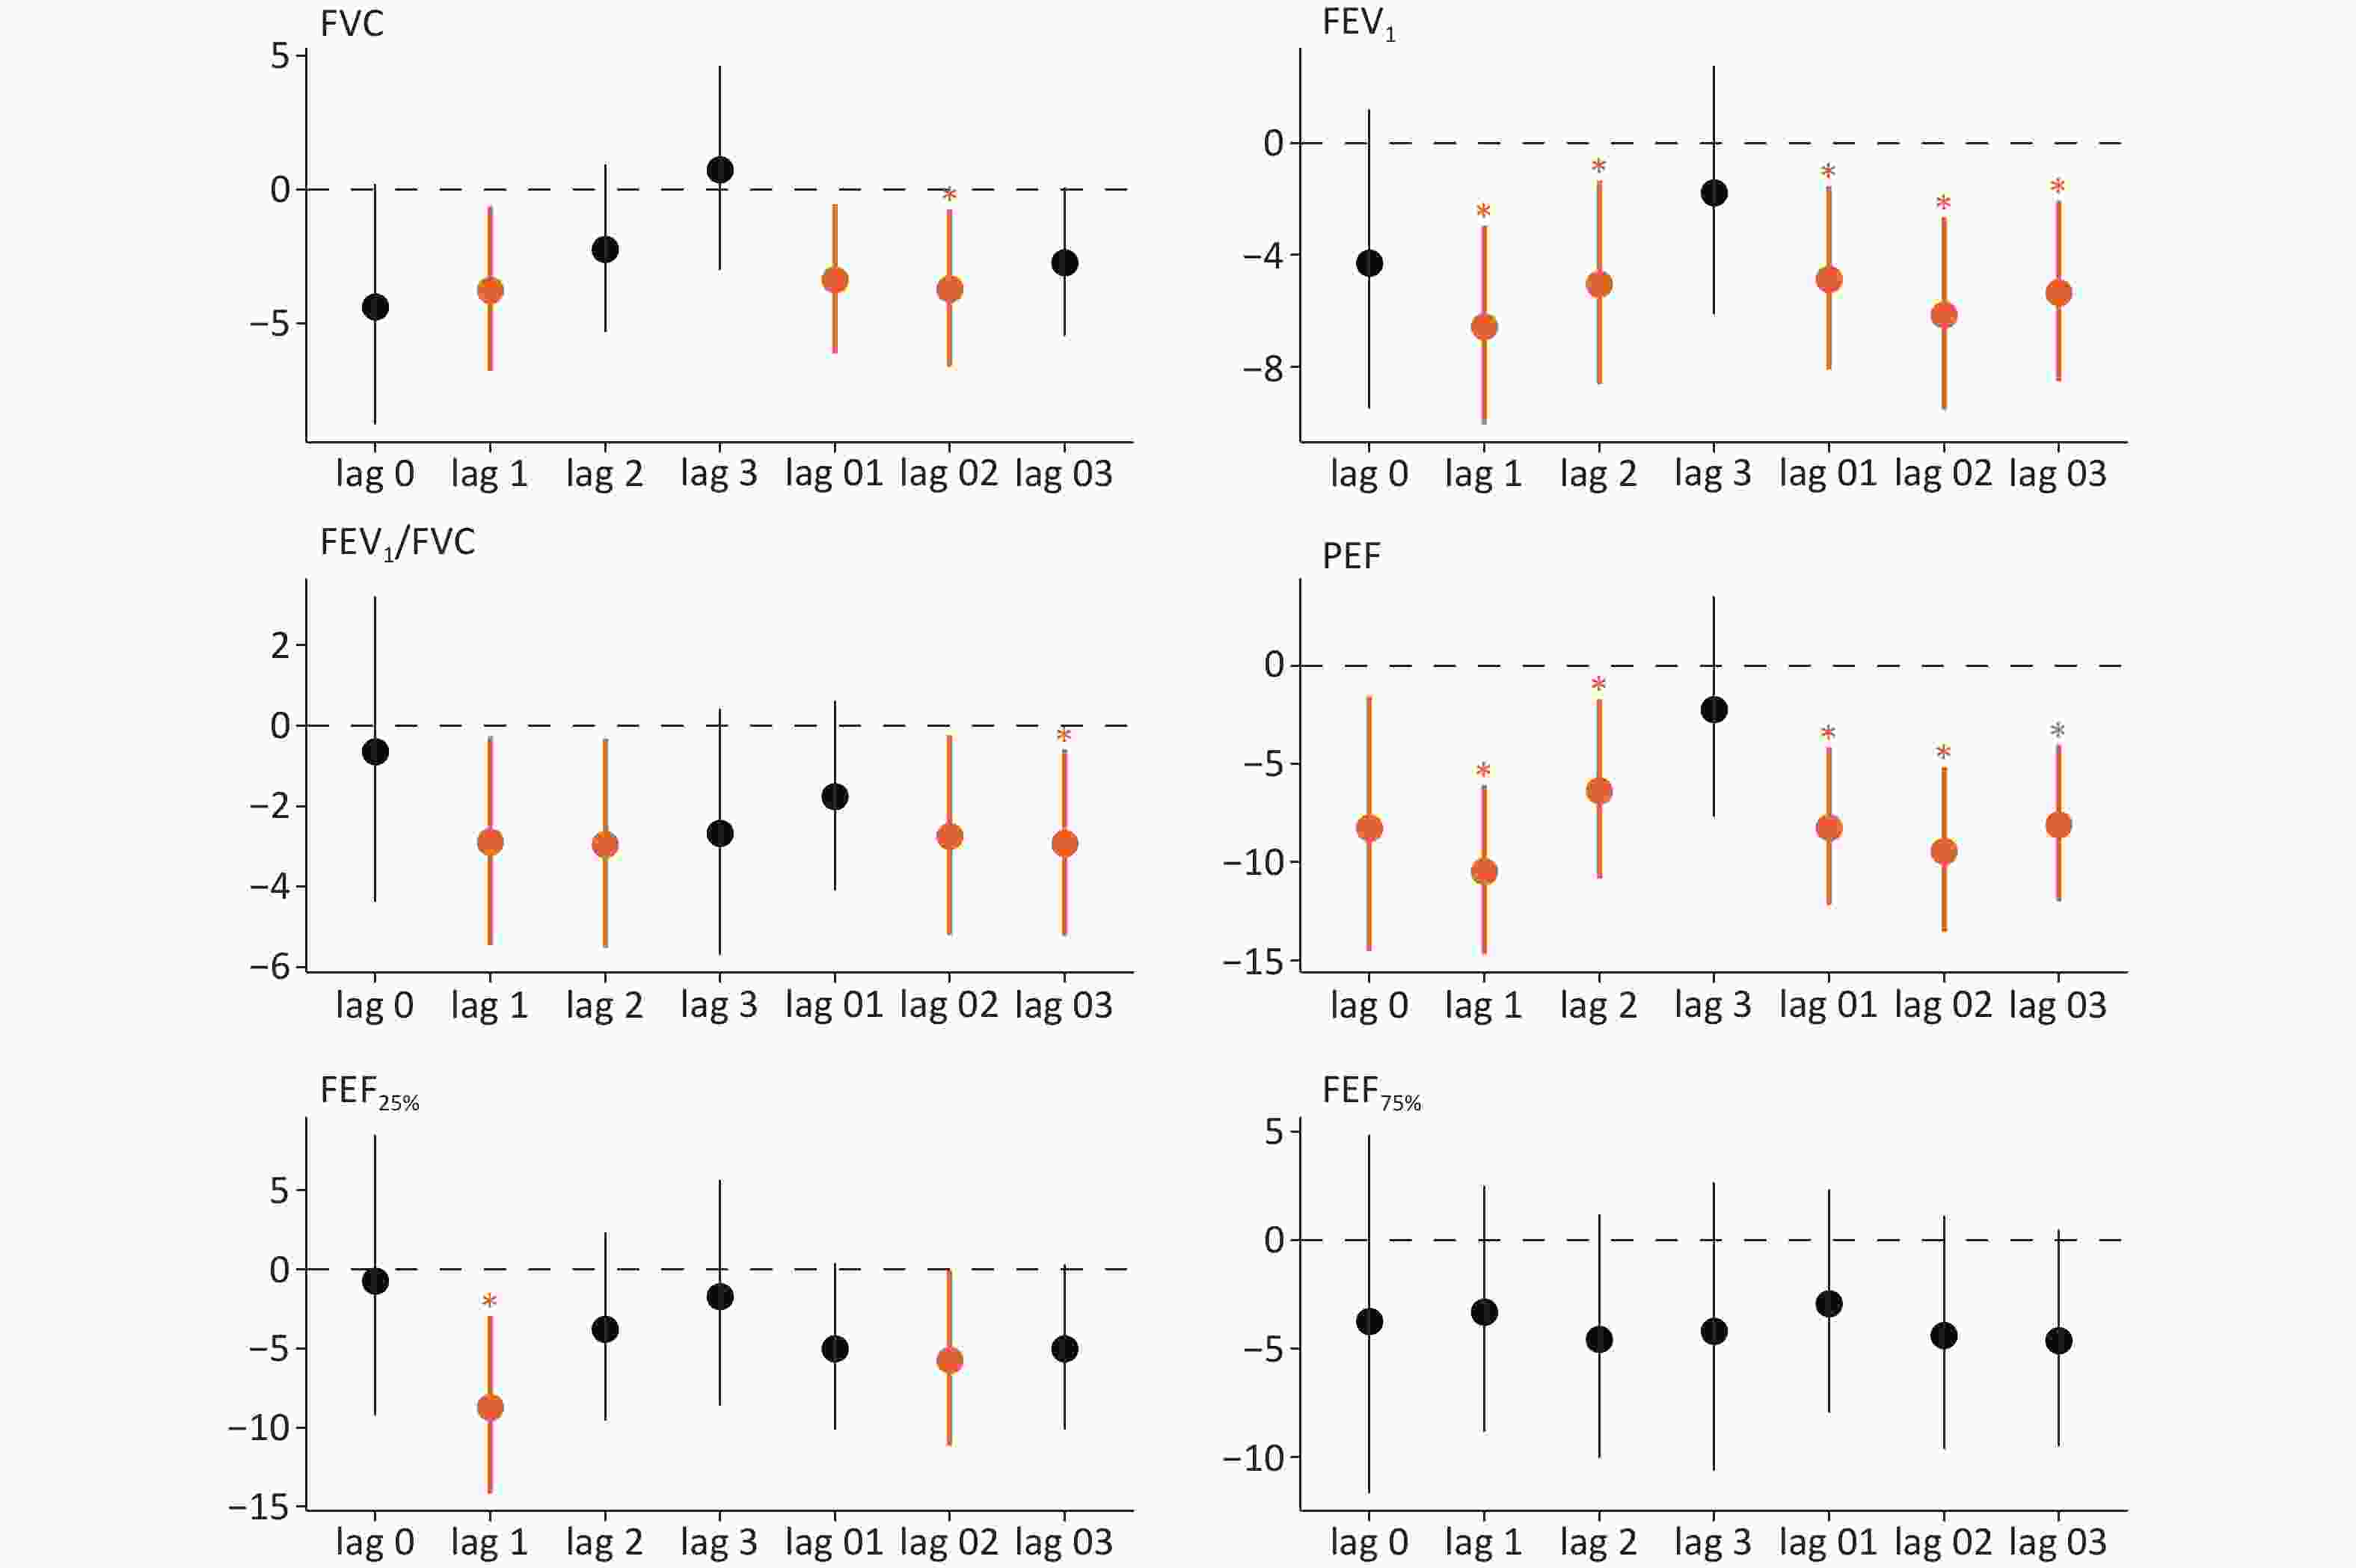
Figure 1. Percent change (95% confidence interval [CI]) in lung function associated with an IQR increase in PM2.5 at different lag times. Significant associations (P value < 0.05) indicated in orange. Significant associations with the false discovery rates (FDR < 0.05) are marked by "*"; FVC, forced vital capacity; FEV1, forced expiratory volume in 1 second; FEV1/FVC, one-second rate; PEF, peak expiratory flow; FEF25%, forced expiratory flow at 25% of FVC; FEF75%, forced expiratory flow at 75% of FVC.
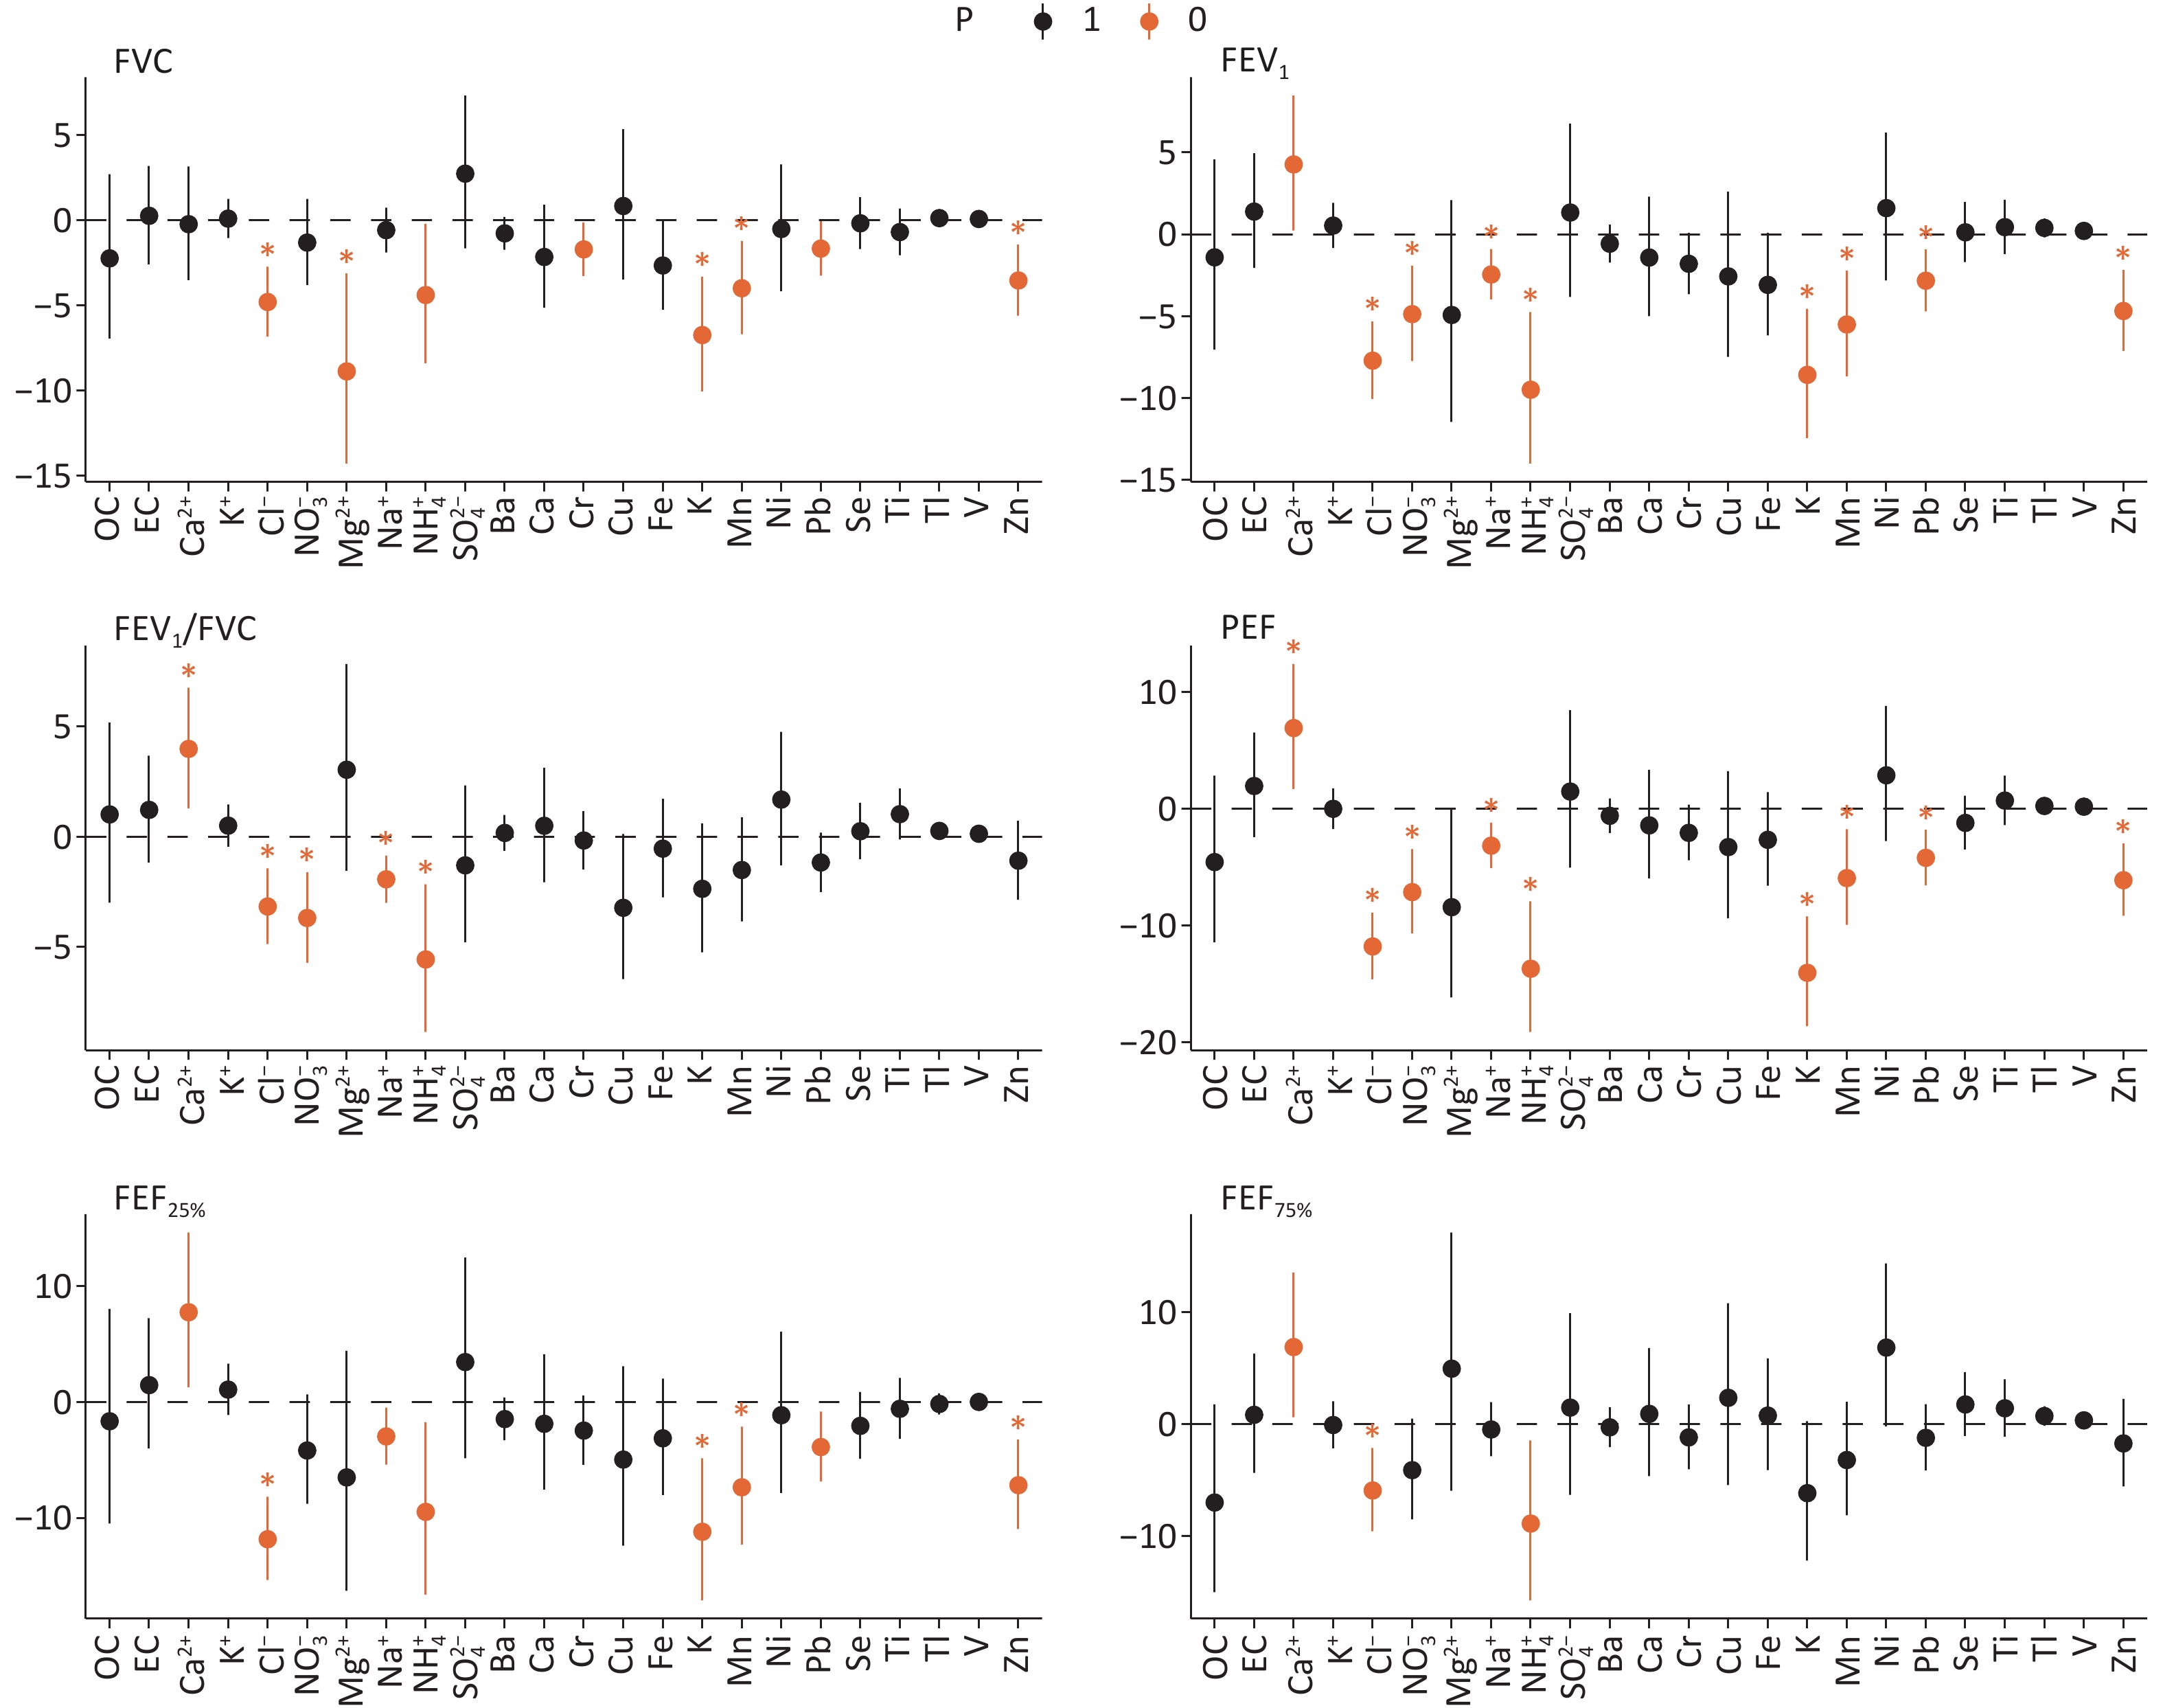
Figure 2 displays the PM2.5 components related to lung function at a 1-day lag. Cl- and NH4+ demonstrated significantly negative associations with all six lung function parameters. K, Mn, Pb, and Zn levels were significantly associated with reduced FVC, FEV1, PEF, and FEF25%. Sensitivity analyses confirmed that PM2.5 remained consistently associated with lung function after additional adjustments for income, disease history, physical activity, occupation, and medication use (Table S4). These associations did not change considerably after adjusting for the NO2 or O3 (Table S5). Subgroup analyses indicated that higher PM2.5 was linked to reduced lung function in participants aged ≥ 60 years, with the strongest associations observed for FVC, FEV1, PEF, FEF25% and FEF75%. Subgroup analyses based on sex and smoking status revealed no significant differences (Supplementary Figure S2). Only PM2.5 components showing significant links with lung function were included in subsequent analyses.
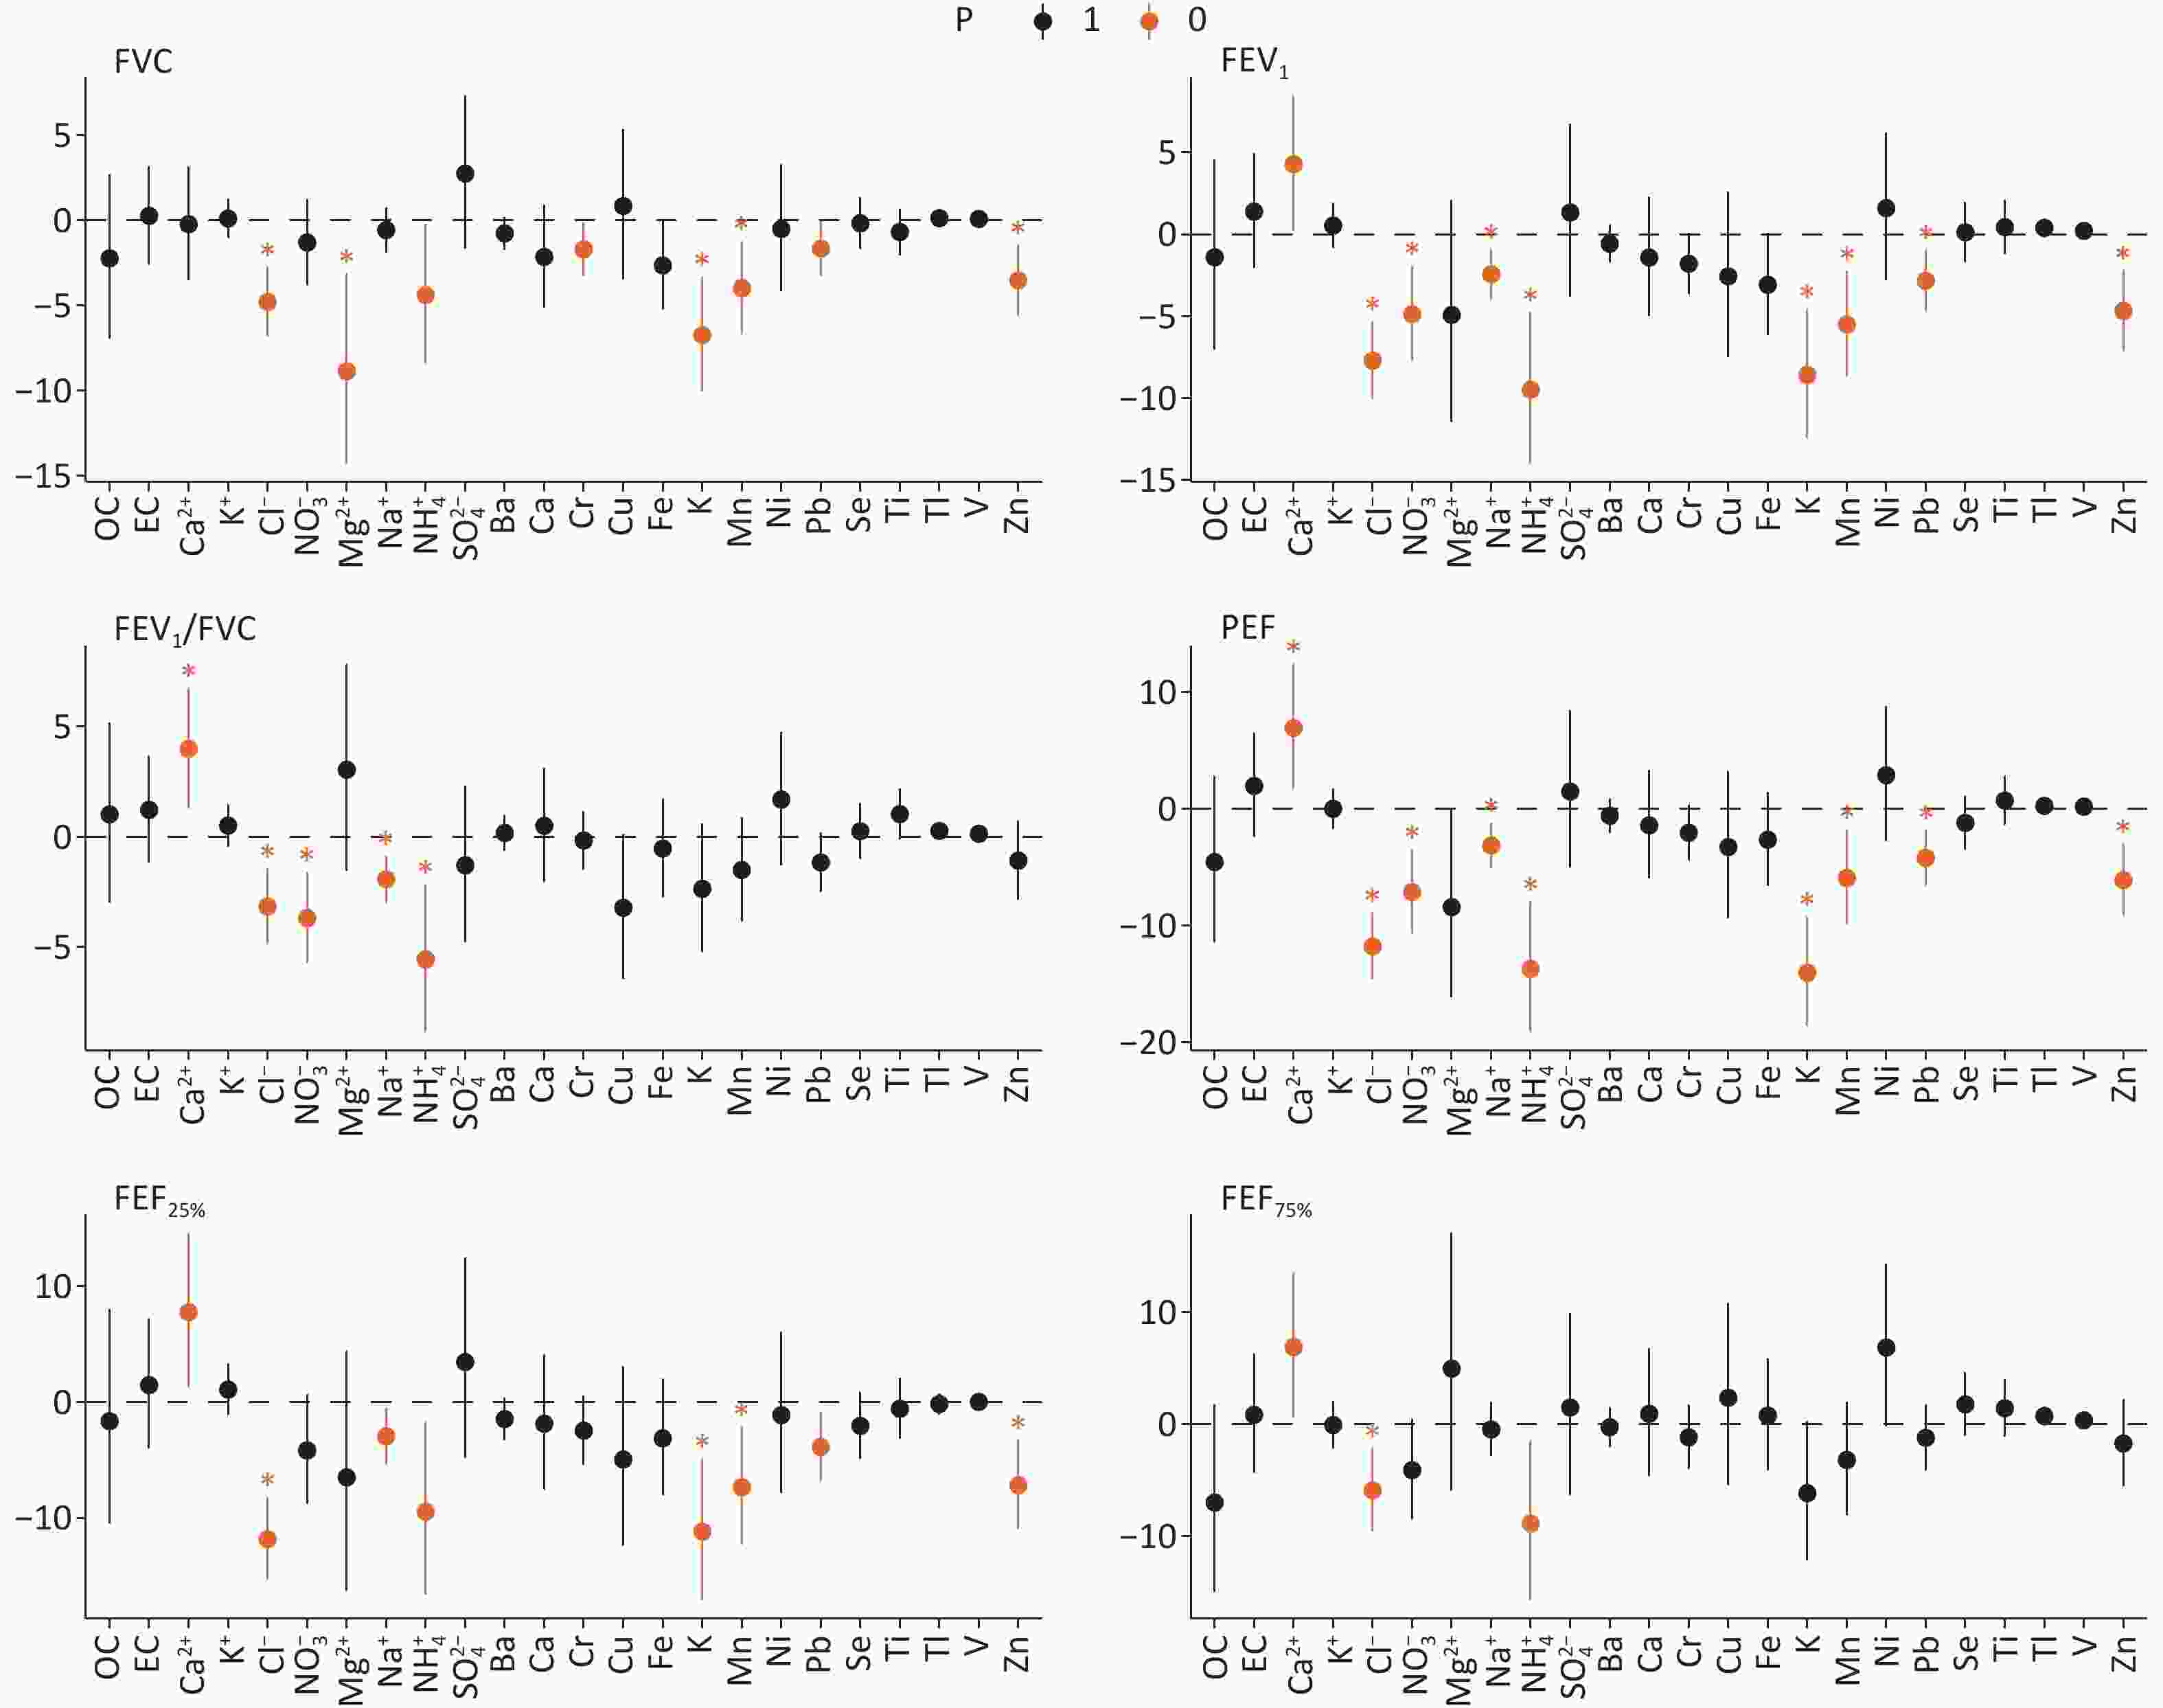
Figure 2. Percent change (95% confidence interval [CI]) in lung function associated with an IQR increase in PM2.5 constituents at lag1. Significant associations (P value < 0.05) indicated in orange. Significant associations with the false discovery rates (FDR < 0.05) are marked by "*"; FVC, forced vital capacity; FEV1, forced expiratory volume in 1 second; FEV1/FVC, one-second rate; PEF, peak expiratory flow; FEF25%, forced expiratory flow at 25% of FVC; FEF75%, forced expiratory flow at 75% of FVC; OC, organic carbon; EC, elemental carbon; Ca2+, calcium ion; Cl-, chlorine ion; Mg2+, magnesium ion; Na+, sodium ion; K+, potassium ion; NH4+, ammonium ion; SO42-, sulfate ion; NO3-, nitrate ion; Ba, barium; Ca, calcium; Cr, chromium; Cu, copper; Fe, iron; Mn, manganese; K, potassium; Ni, nickel; Pb, lead; Se, selenium; Zn, zinc; V, vanadium; Ti, titanium; Tl, thallium.
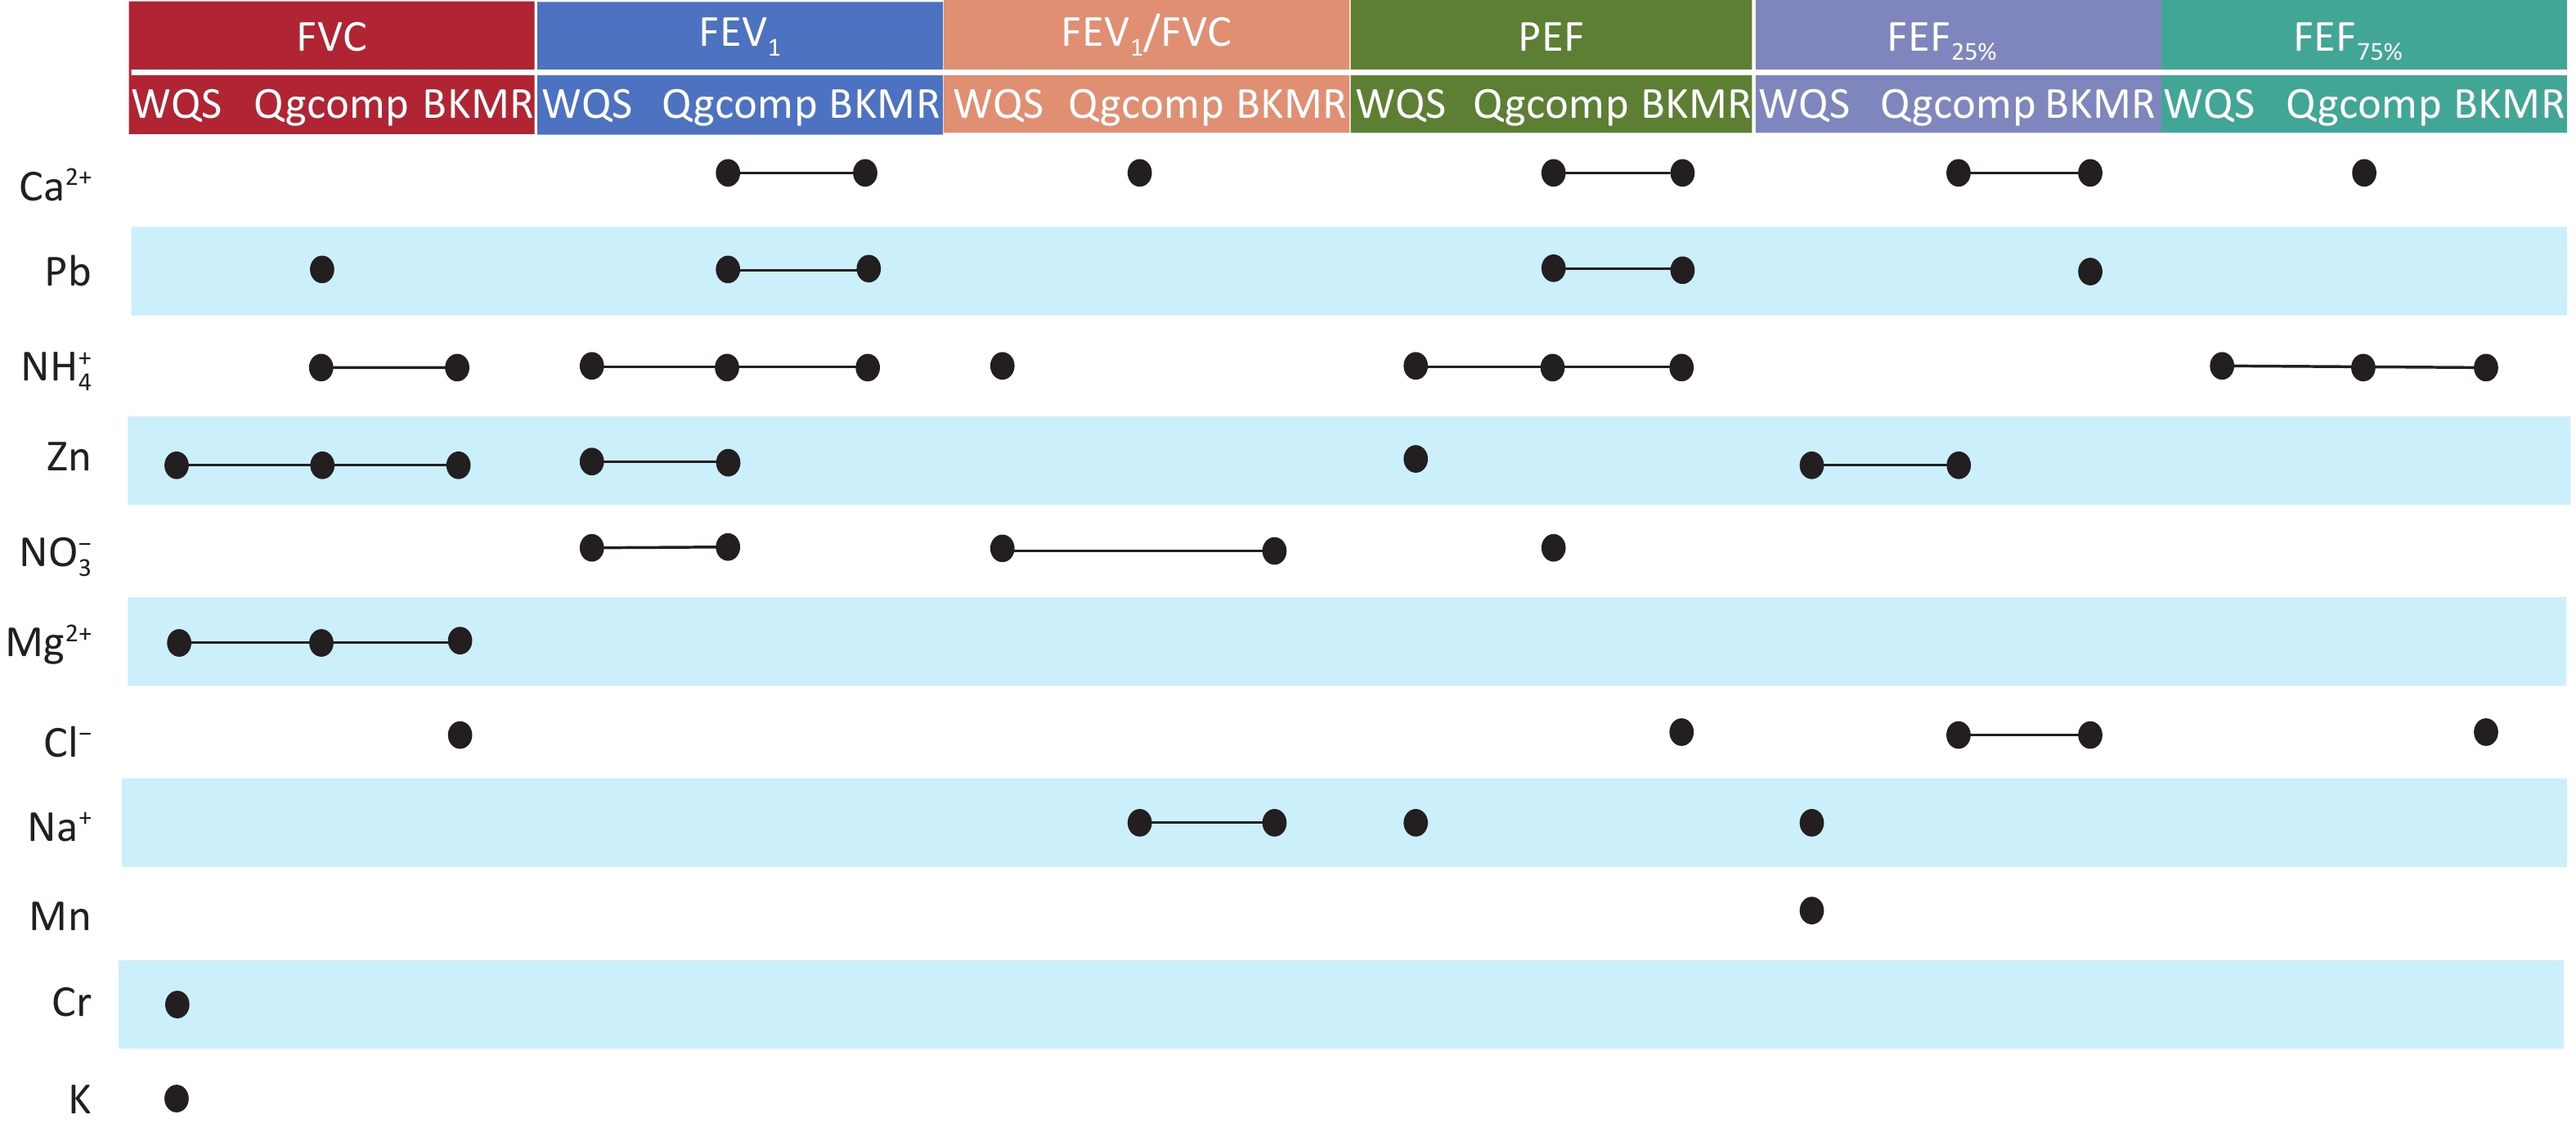
In the Qgcomp model (A), FVC, FEV1/FVC, PEF, FEF25% and FEF75% exhibited a linear decline with increased PM2.5 mixture exposure (Supplementary Figure S3A). The BKMR model indicated a significant inverse relationship between the PM2.5 component mixture, and lung function (Supplementary Figure S3B). Supplementary Figure S4 summarizes the results from the WQS, Qgcomp, and BKMR models, showing the PM2.5 component weights and their estimated effects on lung function for each IQR increase in component concentration. Consistent evidence from the WQS, Qgcomp, and BKMR models demonstrated that simultaneous exposure to PM2.5 components contributed to reduced lung function. Figure 3 summarizes the key components with significant effects identified in the different mixed-exposure models. Notably, all the mixed-exposure models identified Zn and Mg2+ as the key components associated with FVC, whereas NH4+ was identified as the key component related to FEV1, PEF, and FEF75%.
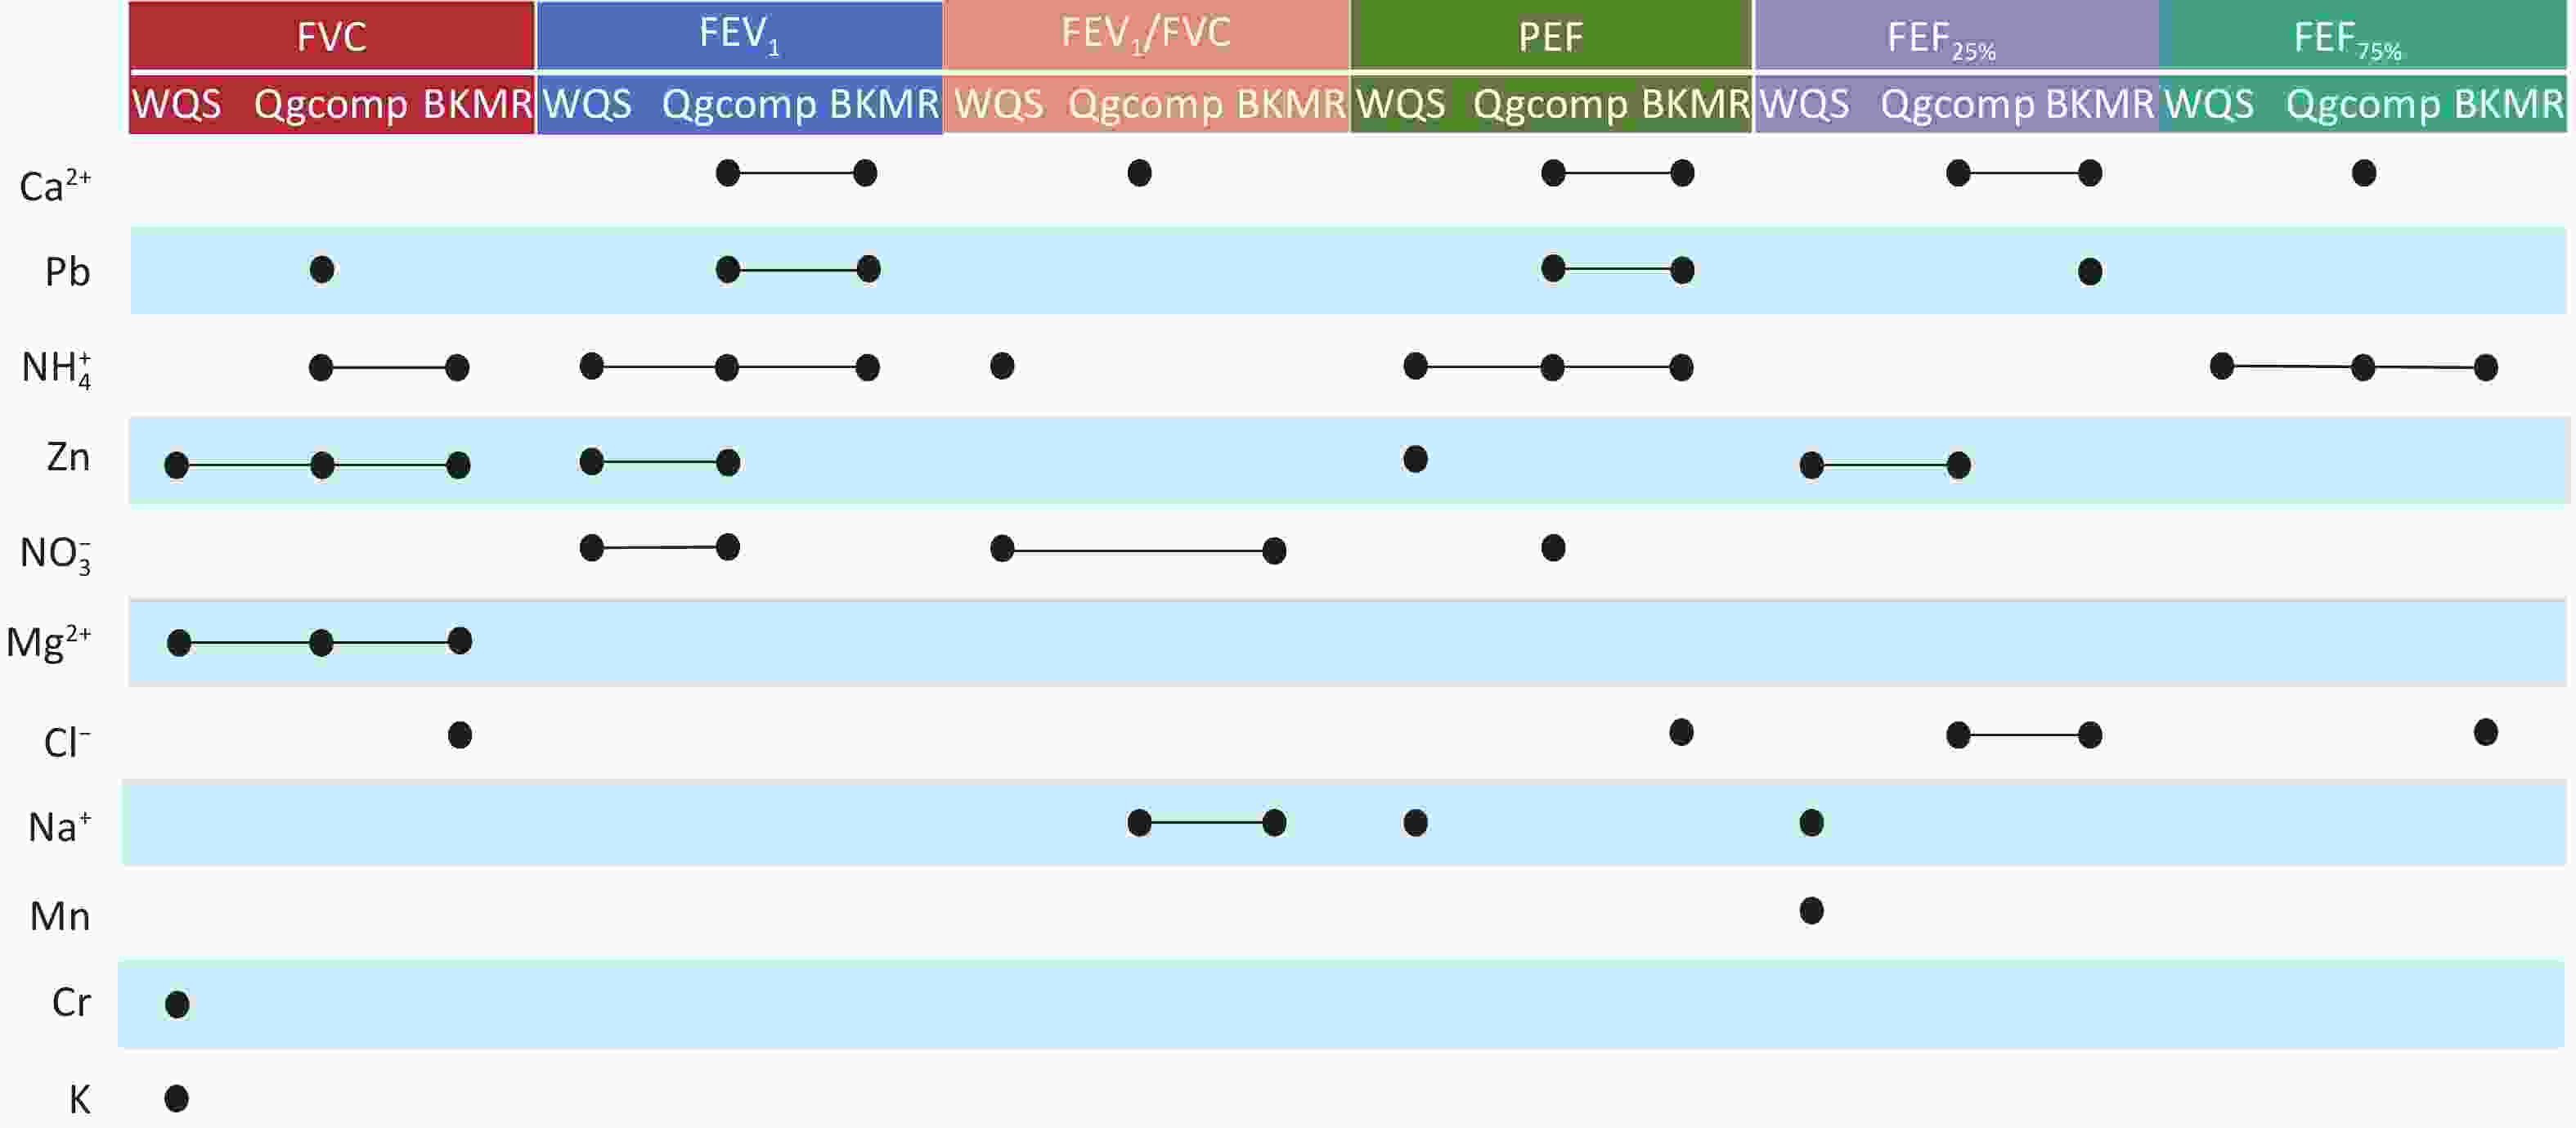
Figure 3. Components that contribute significantly to lung function in the mixed-exposure model. FVC, forced vital capacity; FEV1, forced expiratory volume in 1 second; FEV1/FVC, one-second rate; PEF, peak expiratory flow; FEF25%, forced expiratory flow at 25% of FVC; FEF75%, forced expiratory flow at 75% of FVC; Ca2+, calcium ion; Cl-, chlorine ion; Mg2+, magnesium ion; Na+, sodium ion; NH4+, ammonium ion; NO3-, nitrate ion; Cr, chromium; K, potassium; Mn, manganese; Pb, lead; Zn, zinc.
This study demonstrated that PM2.5 was linked to decreases in FVC, FEV1, FEV1/FVC, PEF, and FEF25%, which is consistent with the findings of previous studies[4,5]. For instance, a study involving 115 adults in Zhuhai City showed that PM2.5 exposure was associated with decreased PEF, MMF, FEF50%, and FEF75%[4]. In a South Korean study involving 59 athletes, reductions in FEV1 and FEV6 were observed with an increase PM2.5 exposure. FEV1 decreased by 32.31 mL, although FEV6 declined by 36.93 mL with PM2.5 increasing by every 10 μg/m3[5]. We found that the negative relationship between PM2.5 exposure, and lung function was stronger among individuals aged ≥ 60 years, with significant decreases observed in FVC, FEV1, PEF, and FEF25%, whereas no significant effects were observed among middle-aged adults. This may be attributed to the age-related decline in lung function among the older adults, coupled with weakened antioxidant defense mechanisms and repair abilities, which increase their sensitivity to air pollutants[6]. Furthermore, non-smokers exhibited a greater reduction in lung function after PM2.5 exposure compared with smokers in this study. Conversely, another study reported that PM2.5 had a greater impact on smokers[4]. These differences may be attributable to variations in the study population characteristics, smoking intensity, exposure profiles, and outcome definitions.
Studies have examined how PM2.5 components relate to lung function; however, the findings remain inconsistent[3,7]. Kang et al. observed that BC, NO3-, and OM exposure correlated with declines in FEV1, FVC, PEF, and FEF50%, whereas NH4+ was specifically linked to reductions in FEV1 and FVC[7]. In contrast, research conducted in Beijing has reported that short-term contact with PM2.5, including Cl-, Zn, Cu, V, Pb, and Ca, corresponded to improvements in lung function[3]. Mixed-exposure models were used in this study to better address inter-component interactions. We observed that increased exposure to PM2.5 component mixtures led to declines in lung function, with Zn, Mg2+, and NH4+ contributing the most. Similarly, Zhang et al. reported that PM2.5-bound heavy metals was linked with declines in FEV1/FVC, MMF, and FEF75%, primarily driven by Pb, Sb, Mn, and V[8]. Differences in specific components contributing to lung function impairment across studies may be attributable to variations in PM2.5 concentration levels and to dominant emission sources. Specifically, NH4+ is associated with secondary inorganic aerosol formation and agricultural ammonia emissions; Mg2+ originates from soil dust, coal combustion, and industrial emissions; and Zn levels are related to traffic and industrial emissions[9,10]. Additionally, differences in study populations and individual sensitivities may have led to heterogeneity in the reported associations.
This study benefitted from a multicenter design capturing diverse PM2.5, the use of multiple mixed models to identify key components, and standardized protocols to ensure reliable lung function assessment. Nevertheless, this study had some limitations that warrant consideration. First, the cross-sectional design limited causal inference; thus, the findings should be interpreted as associations rather than causal relationships, and extrapolation to other settings should be performed with caution. Second, exposure assessment relied on PM2.5, concentrations from fixed-site monitoring stations rather than personal measurements, which fail to capture individual-level variability, particularly indoor–outdoor activity patterns. This may cause exposure to be misclassified, thereby affecting the estimates of the effect. Third, because this study involved individuals aged 40–89 years, caution is warranted when extrapolating the results to other populations. Moreover, this study only analyzed PM2.5, its carbonaceous components, WSIIs, and elemental components, without considering organic pollutants such as polycyclic aromatic hydrocarbons.
In conclusion, our multi-center cross-sectional study of the BTH region and surrounding areas found that exposure to PM2.5 component mixture led to reduced lung function in middle-aged and older participants. Zn, Mg2+, and NH4+ were the dominant components. These findings highlight the importance of component-specific air quality management in protecting respiratory health in older populations and provide epidemiological evidence to inform targeted air pollution control strategies.
HTML
Competing Interests The authors have no competing interests to declare.
Ethics This study was approved by the Ethical Review Committee of National Institute of Environmental Health, Chinese Center for Disease Control and Prevention (No. 201820).
Authors’ Contributions Conceptualization, data analysis and interpretation, and drafting of the manuscript: Yunhan Zou; Design of the study, visualization: Yunhan Zou, Ning Li; Supervision and project management: Jianlong Fang, Yu Wang, Jiaonan Wang, Chen Chen and Xiaoming Shi; Funding acquisition: Chen Chen, Jianlong Fang; resources: Jianlong Fang, Xiaoming Shi; writing, review, and editing: Yu Wang, Jiaonan Wang, Chen Chen, Jianlong Fang, and Xiaoming Shi.
Reference

 Quick Links
 DownLoad: