
-
Chronic liver diseases cause around two million deaths annually worldwide, which constitutes four percent of all global mortality[1]. Hepatic fibrosis, as a key pathological stage in chronic liver disease progression, develops from various chronic liver injuries (viral infections, alcohol, metabolic disorders, toxins) and is characterized by excessive extracellular matrix deposition in liver tissue[2,3]. This pathological accumulation impairs hepatic structure and function and may further develop into liver cirrhosis or hepatocellular carcinoma[4]. Hepatic fibrosis serves as a significant indicator for predicting the incidence and mortality of liver-related diseases. As fibrosis stages advance, the risk of liver-related mortality increases exponentially at each stage of fibrosis progression[5-7]. Emerging evidence indicates that traditional risk factors for hepatic fibrosis, such as hepatitis viruses, excessive alcohol consumption, dietary patterns, and medications, can no longer fully account for disease onset, suggesting the existence of additional risk factors that have not been fully elucidated[8-10]. Against this background, the role of environmental pollutants in hepatic fibrosis risk has attracted increasing attention.
Heavy metals and metalloids (HMMs), characterized by their environmental persistence, bioaccumulation, and non-biodegradability, have been shown to exert toxic effects on multiple organ systems and are classified as priority pollutants for monitoring and control[11,12]. The liver, as a primary organ of heavy metal accumulation, is particularly vulnerable to functional impairment from these exposures. Accumulating evidence indicates that multiple HMMs including lead (Pb), mercury (Hg), cadmium (Cd), arsenic (As), and manganese (Mn), accumulate in the liver and contribute to the onset and development of hepatic fibrosis through mechanisms including oxidative stress, disrupted cellular signaling pathways, and altered lipid metabolism, positioning them as potentially modifiable risk factors[13-17]. However, there is still inconsistent epidemiological data about the link between exposure to HMMs and hepatic fibrosis. Most existing research has focused on typical environmental heavy metals such as Pb, Cd, and Hg, preliminarily revealing the possible roles of these particular metals in the progression of hepatic fibrosis[18,19]. In contrast, trace metals such as cobalt (Co), Mn, and tin (Sn) have received considerably less attention, and their health risks have not been systematically evaluated. Studies conducted in Chinese populations are further constrained by relatively small sample sizes and limited geographical coverage[8]. These gaps not only hinder the identification of environmental risk factors for hepatic fibrosis but also impede the development and implementation of precise prevention and intervention strategies to mitigate HMMs-related hepatic damage.
In addition, endocrine-disrupting effects represent a critical pathway through which environmental pollutants exert pathogenic effects. Several heavy metals are recognized as typical endocrine disruptors interfering with the hypothalamic-pituitary-thyroid axis by influencing thyroid hormones production, secretion, transport, and metabolism, ultimately leading to abnormal circulating thyroid hormone levels[20,21]. Dysregulated thyroid hormone levels constitute a known risk factor affecting liver disease, influencing the transcription of genes related to detoxification, protein synthesis, hepatic lipid, glucose, and protein metabolism[22,23]. Consequently, alterations in thyroid hormone levels may exert a modifying influence on the links between exposure to HMMs and hepatic fibrosis risk, potentially acting as an effect modifier. Although both the thyroid-disrupting effects of heavy metals and their direct hepatotoxicity have been confirmed, studies systematically examining the links between exposure to various metals, changes in thyroid hormone levels, and hepatic fibrosis risk in Chinese adults remain scarce.
Leveraging data from the China National Human Biomonitoring (CNHBM), this research seeks to (1) systematically characterize the associations between exposure to multiple HMMs and hepatic fibrosis risk, and (2) investigate the potential modifying role of thyroid hormones in these associations, providing an epidemiological basis for the early identification of environmental risk factors for hepatic fibrosis and the development of effective environmental intervention strategies to prevent irreversible liver damage.
-
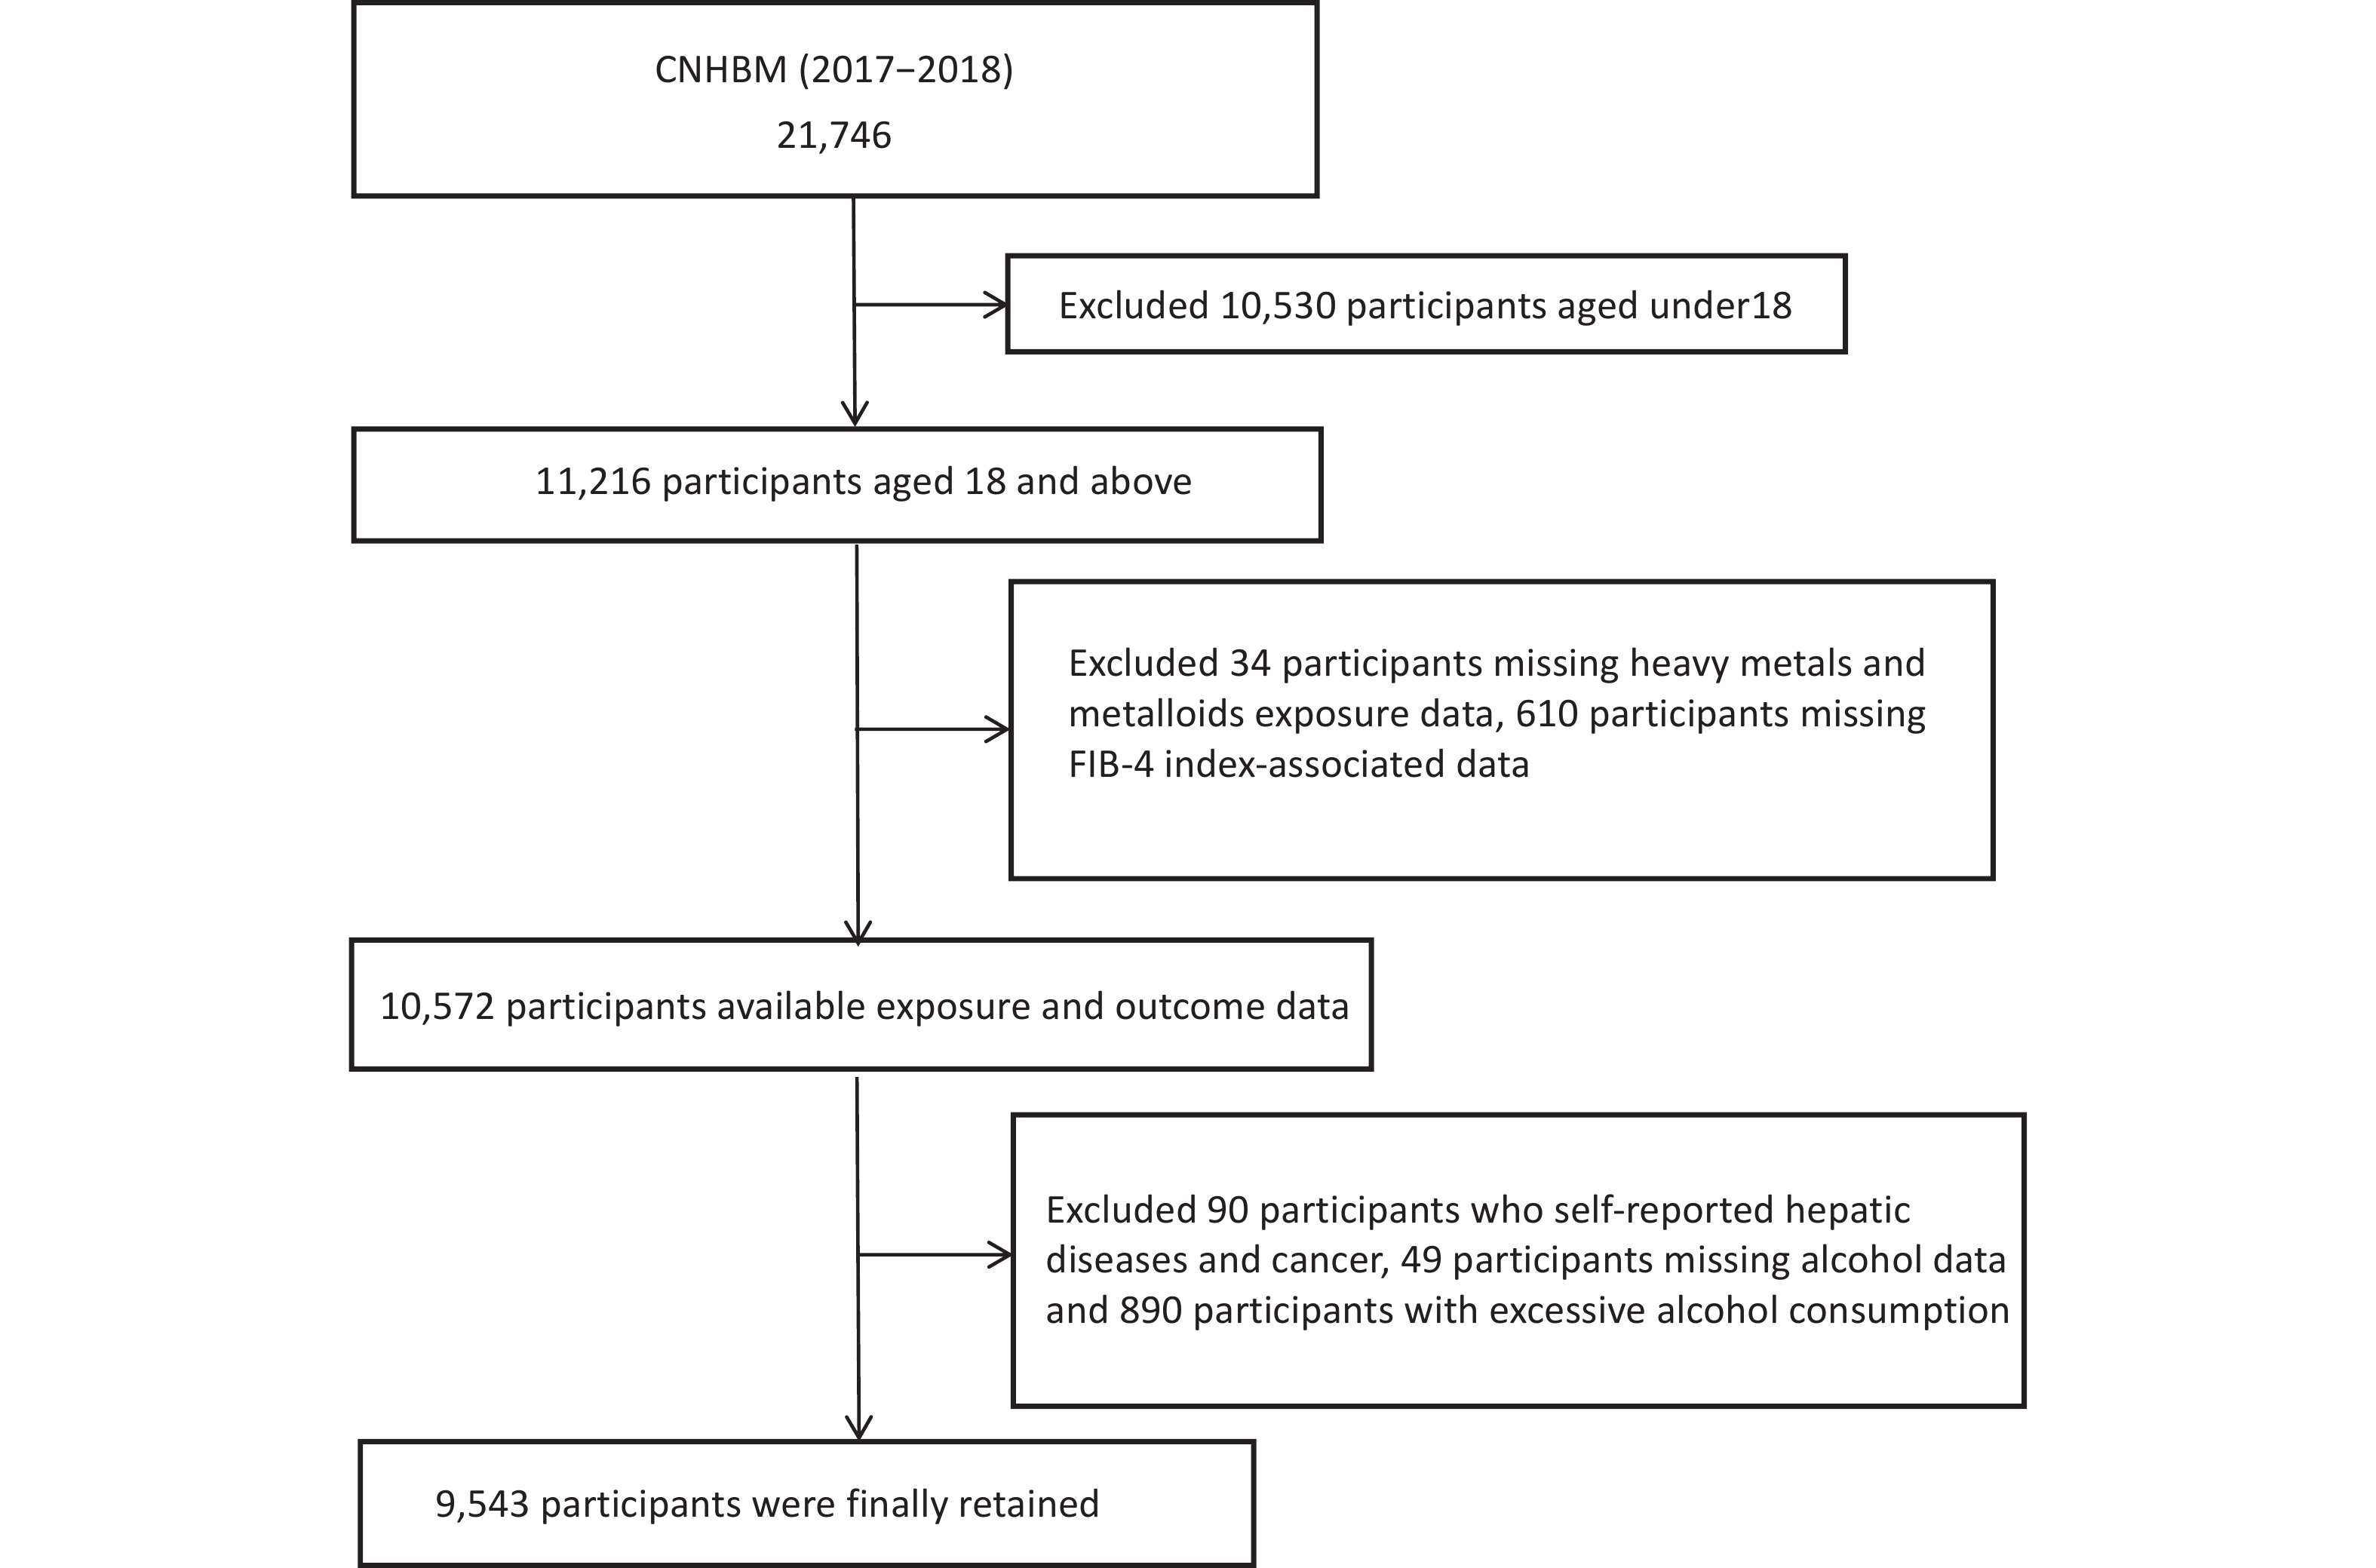
The CNHBM (2017–2018) employed a three-phase stratified sampling approach to recruit a nationally representative sample of individuals ranging from 3 to 79 years. The 31 provinces of China were clustered and stratified based on factors such as population size, urbanization rate, and secondary sector employment rate, resulting in 152 monitoring sites and 456 survey units. Within each unit, stratified sampling was conducted by gender and age group, with 48 residents randomly selected from each group. Through questionnaires, physical examinations, and the collection of blood and urine samples, the study collected data on demographic characteristics, health history, and lifestyle, and tested clinical and exposure biomarkers. After excluding participants aged < 18 years, those with missing data on HMMs, the Fibrosis-4 Index (FIB-4) related variables, or alcohol consumption, those with self-reported liver disease or cancer, and those with excessive alcohol consumption, 9,543 participants were ultimately included in the final analysis (Figure 1). The ethics committee of the Chinese Center for Disease Control and Prevention's National Institute of Environmental Health granted approval to this study (No.201701). Written informed permission was signed by each participant. A previous study provided information on the project design details[24].

Figure 1. Flowchart of participant enrollment.
-
We measured the concentrations of 13 HMMs, including arsenic (As), Cd, chromium (Cr), Co, Hg, molybdenum (Mo), Mn, nickel (Ni), Pb, antimony (Sb), Sn, selenium (Se), and thallium (Tl). Inductively coupled plasma-mass spectrometry (ICP-MS) was used to measure them using a multi-element analytical method (PerkinElmer NexI ON350, Turku, Finland). For sample preparation, 1 mL of whole blood was mixed with an aqueous solution containing 0.10% nitric acid and 0.01% Triton X-100 to a final volume of 10 mL, while 1.0 mL of urine was diluted with 1% nitric acid. Every thirty unknown samples were analyzed simultaneously with blank and internal quality control samples from reference materials (SeronormTM Trace Elements Blood L-2, SPEX, USA) for internal quality assurance and control. All 13 metals had detection rates exceeding 85% in blood and urine. The analysis included Co, Cr, Mn, Pb, Sb, and Se measured in blood, as well as As, Cd, Hg, Mo, Ni, Sn, and Tl measured in urine, with the rationale for biomarker selection summarized in Supplementary Table S1. LOD/2 was used to replace values that fell below the limit of detection (LOD). Urinary creatinine concentrations were measured on-site using picric acid spectrophotometry within 4 hours of sample collection to normalize urinary heavy metal concentrations for dilution effects.
-
FIB-4 presents a specificity and sensitivity both exceeding 0.8 for identifying liver fibrosis, making it one of the most widely used serum-based non-invasive screening markers[25,26]. Additionally, it serves well in disease monitoring to identify the phases of fibrosis and impairment of liver function. According to the guideline consensus, FIB-4 exceeding 2.67 was defined in this study as a high risk of advanced hepatic fibrosis[27-30]. The following method is used to compute it based on age, platelet concentration, aspartate aminotransferase (AST), and alanine aminotransferase (ALT):
$$ FIB-4=\frac{age(years) ×AST(U/L)}{platelet({10}^{9}/L) ×\sqrt{ALT(U/L)}} $$ (1) A Roche Cobas C702 automated biochemical analyzer (Tokyo, Japan) was used to quantify the amounts of ALT and AST in fasting serum (100 µL), using the International Federation of Clinical Chemistry (IFCC) technique for ALT and a colorimetric method for AST. An automated hematology analyzer (Hitachi 7180, Kyoto, Japan) was used to measure platelet concentrations.
-
The measurement of serum triiodothyronine(T3) and thyroxine(T4) concentrations was conducted at Dian Diagnostics (Dian Diagnostics Group Co., Ltd., Hangzhou, Zhejiang, China) utilizing an electrochemiluminescence immunoassay (ADVIA Centaur®XP, Siemens Healthcare Diagnostics Inc., Tarrytown, NY).
-
Trained interviewers conducted face-to-face questionnaires, and professional healthcare workers performed health examinations and collected biological samples. The standardized questionnaire collected data on lifestyle and demographics including age, gender (male or female), areas (areas were divided into six major geographical zones based on the characteristics of China's national territory: North China, Northeast, East China, Central South, Northwest, and Southwest), marital status (single, married, divorced, bereaved), education level (elementary school or below, middle or high school, college or above), annual income (< 10,000, 10,000–30,000, 30,000–60,000, 60,000–100,000, > 100,000, unknown/prefer not to say), nationality (Han nationality or ethnic minority), smoking status (smoking or not), and alcohol consumption (none or low-moderate). Body mass index (BMI) served as the basis for identifying four weight status categories: underweight (< 18.5 kg/m2), normal weight (18.5–23.9 kg/m2), overweight (24.0–27.9 kg/m2), and obesity (≥ 28.0 kg/m2)[31]. Systolic blood pressure ≥ 140 mmHg or diastolic blood pressure ≥ 90 mmHg, or a previous clinical diagnosis with concomitant antihypertensive drug usage, were defined as hypertension. The following was used to define diabetes: fasting blood glucose levels ≥ 7.0 mmol/L (126 mg/dL), self-reported use of insulin or oral hypoglycemic medicines, or a diagnosis from the doctor. The diagnosis of chronic kidney disease (CKD) was made on the basis of an estimated glomerular filtration rate (eGFR) < 60 mL/min/1.73 m2, which was computed from serum creatinine applying the Chronic Kidney Disease Epidemiology Collaboration (CKD-EPI) equation[32]. A Roche Cobas C702 automated biochemical analyzer (Tokyo, Japan) was used to measure fasting serum triglyceride (TG) concentrations (100 µL) using a colorimetric technique. Enzymatic colorimetry was used to determine the levels of high-density lipoprotein cholesterol (HDL-C) in 100 µL of fasting serum[33].
-
For descriptive analysis, continuous variables following a normal distribution are shown as mean ± standard deviation, while non-normal continuous variables are expressed as median (interquartile range), and categorical variables are summarized by frequency and percentage. Given the skewed distribution of blood and urinary HMMs, we calculated the median and interquartile range (IQR) and applied natural logarithmic transformation to HMMs concentrations in subsequent weighted logistic and linear regression models. To account for variations in urine dilution among individuals, all urinary heavy metal concentrations were adjusted using urinary creatinine levels. The correlations between the HMMs were evaluated using Spearman's correlation coefficient.
-
Missing values for covariates included in the multivariable models were addressed using random forest imputation prior to model fitting. The associations between HMMs quartiles and ln-transformed HMMs and hepatic fibrosis risk were assessed using weighted multiple logistic regression models. Additionally, the associations between HMMs quartiles and ln-transformed HMMs with FIB-4 were assessed using weighted linear regression models. The potential confounding factors were controlled by constructing three stepwise corrected models: Model 1 included age, gender, marriage, nationality, residence, education level, income, areas, smoking status, alcohol consumption, and BMI; Model 2 further incorporates TG and HDL-C on the basis of Model 1. Model 3 accounted for hypertension, diabetes, and CKD in addition to the variables in Model 2. The results were presented as odds ratios (ORs) with 95% confidence intervals (CIs) for logistic regression models or as regression coefficients (β) with 95% CIs for linear regression models.
-
To assess the dose-response associations of HMMs with both FIB-4 and hepatic fibrosis risk, RCS models were used for analysis. RCS regression is based on the principle of splines, flexibly fitting the nonlinear relationship between exposure and outcome by connecting polynomial functions at multiple preset nodes. First, several key points (nodes) are preset within the range of the independent variable, and a smooth continuous curve is fitted based on these points. Subsequently, the significance of the relationship curve is tested using a likelihood ratio test, followed by a nonlinear test to determine whether there is a statistical difference from a linear relationship[34,35]. The 50th percentile was used as the reference point in this study, and knots were placed at the 10th, 50th, and 90th percentiles.
-
Stratified analyses were conducted to assess potential effect modification by age (< 40, ≥ 40 years), sex (male, female), alcohol consumption (yes, no), T3 levels (group with low T3, group with high T3), and T4 levels (group with low T4, group with high T4) on the associations between HMMs exposure and both hepatic fibrosis risk and FIB-4. High and low levels of T3 and T4 were defined based on their respective median values as cutpoints. We performed several sensitivity analyses to assess the robustness of our results. First, recognizing that alcohol consumption represents a well-established risk factor for hepatic fibrosis and may confound the associations between HMMs exposure and both hepatic fibrosis risk and FIB-4, we restricted the analysis to non-drinkers. Second, to minimize the potential for reverse causation, we excluded participants with diabetes or CKD. Finally, considering the potential confounding effect of central obesity, we further adjusted for waist circumference in the model.
R software (version 4.5.0; R Development Core Team) was used for all statistical analyses. The significance level for the two-sided statistical tests was established at α = 0.05.
-
Participant demographics from the CNHBM baseline survey are presented in Table 1. Among the 9,543 enrolled participants, the mean age was 47.78 ± 16.11 years, with 46.3% being male and 1,521 (15.9%) individuals were categorized as being at high risk for advanced hepatic fibrosis. The overall population was predominantly composed of females, urban residents, individuals with a middle or high school education, married individuals, non-smokers, and non-drinkers. Individuals at high risk for advanced hepatic fibrosis were more likely to be older, have lower education levels, and reside in rural areas than those not at high risk. Additionally, they had a higher prevalence of diabetes, CKD, and hypertension. Supplementary Table S2 provides detailed information on the LOD, detection rates, and distribution characteristics of blood and urine HMMs. Supplementary Table S3 illustrates the distribution of HMMs across participants with different risks of hepatic fibrosis. Compared with participants at non-high risk of hepatic fibrosis, those at high risk had significantly higher concentrations of blood Pb, urinary Cd, and urinary Mo, but lower concentrations of blood Sb and Se, as well as urinary Sn and Tl. Spearman correlation coefficients among the concentrations of HMMs in blood and urine are presented in Supplementary Figure S1. Strong correlations among urinary HMMs, whereas weak correlations were found both among blood HMMs and between blood and urinary HMMs. Specifically, the strongest correlation was found between Cd and Tl in urine (r = 0.56), and between Co and Mn in blood (r = 0.40).
Characteristics Total Non-high risk of hepatic fibrosis high risk of hepatic fibrosis P (N = 9,543) (N = 8,022) (N = 1,521) Age (years), mean ± SD 47.78 ± 16.11 45.13 ± 15.43 61.73 ± 11.87 < 0.001 Gender, N(%) 0.14 Female 5,125 (53.7) 4,335 (54.0) 790 (51.9) Male 4,418 (46.3) 3,687 (46.0) 731 (48.1) Nationality, N(%) 0.008 Han 8,297 (86.9) 6,942 (86.5) 1,355 (89.1) Minority 1,246 (13.1) 1,080 (13.5) 166 (10.9) Residence, N(%) 0.03 Urban 5,252 (55.0) 4,454 (55.5) 798 (52.5) Rural 4,291 (45.0) 3,568 (44.5) 723 (47.5) Marriage, N(%) < 0.001 Single 933 (9.8) 903 (11.3) 30 (2.0) Married 7,950 (83.3) 6,651 (82.9) 1,299 (85.4) Divorced 475 (5.0) 301 (3.8) 174 (11.4) Bereaved 185 (1.9) 167 (2.1) 18 (1.2) Family income ( RMB/year) , N(%) < 0.001 < 10,000 1,438 (15.1) 1,073 (13.4) 365 (24.0) 10,000-30,000 1,089 (11.4) 966 (12.0) 123 (8.1) 30,000-60,000 2,126 (22.3) 1,804 (22.5) 322 (21.2) 60,000-100,000 2,244 (23.5) 1,935 (24.1) 309 (20.3) > 100,000 1,427 (15.0) 1,228 (15.3) 199 (13.1) Unknown/prefer not to say 1,219 (12.8) 1,016 (12.7) 203 (13.3) Educational level, N(%) < 0.001 Elementary school or below 1,612 (16.9) 1,517 (18.9) 95 (6.2) Middle or high school 3,208 (33.6) 2,380 (29.7) 828 (54.4) College or above 4,723 (49.5) 4,125 (51.4) 598 (39.3) Area, N(%) < 0.001 Central South 1,320 (13.8) 1,167 (14.5) 153 (10.1) East China 907 (9.5) 838 (10.4) 69 (4.5) North China 2,558 (26.8) 2,114 (26.4) 444 (29.2) Northeast 2,183 (22.9) 1,816 (22.6) 367 (24.1) Northwest 1,486 (15.6) 1,154 (14.4) 332 (21.8) West East 1,089 (11.4) 933 (11.6) 156 (10.3) Cigarette smoking, N(%) 0.898 No 7,118 (74.6) 5,986 (74.6) 1,132 (74.4) Yes 2,425 (25.4) 2,036 (25.4) 389 (25.6) Alcohol consumption, N(%) < 0.001 No 5,941 (62.3) 4,909 (61.2) 1,032 (67.9) Low-moderate 3,602 (37.7) 3,113 (38.8) 489 (32.1) BMI (kg/m2), N(%) 0.004 < 18.5 480 (5.0) 393 (4.9) 87 (5.7) ≥ 18.5 to < 24.0 4,411 (46.2) 3,669 (45.7) 742 (48.8) ≥ 24.0 to < 28.0 3,196 (33.5) 2,695 (33.6) 501 (32.9) ≥ 28.0 1,456 (15.3) 1,265 (15.8) 191 (12.6) Diabetes, N(%) < 0.001 No 8,584 (90.0) 7,282 (90.8) 1,302 (85.6) Yes 959 (10.0) 740 (9.2) 219 (14.4) Hypertension, N(%) < 0.001 No 6,171 (64.7) 5,420 (67.6) 751 (49.4) Yes 3,372 (35.3) 2,602 (32.4) 770 (50.6) CKD, N(%) < 0.001 No 8,965 (93.9) 7,626 (95.1) 1,339 (88.0) Yes 578 (6.1) 396 (4.9) 182 (12.0) T3 (nmol/L), mean ± SD 47.78 ± 16.11 45.13 ±1 5.43 61.73 ± 11.87 < 0.001 T4 (nmol/L), mean ± SD 1.79 ± 0.52 1.79 ± 0.53 1.79 ± 0.45 0.598 HDL-C (mean ± SD) 104.02 ± 23.55 103.89 ± 23.58 104.72 ± 23.43 0.208 TG (mean ± SD) 1.70 ± 1.28 1.70 ± 1.30 1.65 ± 1.15 0.097 Note. Data are presented as means (standard deviations) for continuous variables and numbers (percentages) for categorical variables. Abbreviations: SD: standard deviation; BMI, body mass index; CKD, chronic kidney disease; T3: triiodothyronine; T4: thyroxine; HDL-C: high density lipoprotein cholesterol; TG: triglyceride; Table 1. Characteristics of the study population (n = 9,543)
-
To evaluate the hepatic fibrosis risk associated with HMMs in blood and urine, weighted logistic regression was performed (Tables 2 and 3). After comprehensive adjustment for confounders (Model 3), the highest quartiles (Q4) of blood Co and Mn showed a significantly increased risk of hepatic fibrosis in comparison to the reference quartile (Q1), with ORs of 1.613 (95% CI: 1.126, 2.310) for Co and 1.699 (95% CI: 1.238, 2.331) for Mn. In contrast, ln-transformed urinary Sn exhibited an inverse association with hepatic fibrosis risk (OR = 0.888, 95% CI: 0.797, 0.990). Additionally, the associations between HMMs and FIB-4 were assessed using weighted multiple linear regression, and the results were consistent with hepatic fibrosis risk findings, except for Sn (Supplementary Tables S4 and S5). The dose-response associations between HMMs and FIB-4 and hepatic fibrosis risk based on RCS function are presented in Supplementary Figures S2–S5. Notably, nonlinear associations with hepatic fibrosis risk were observed for blood Co, blood Mn, and urinary Sn (all P for nonlinear <0.001). These three HMMs also exhibited nonlinear trends with FIB-4 (all P for nonlinear <0.001).
Blood
HMMsCrude model Model 1 Model 2 Model 3 OR (95%CI) OR (95%CI) OR (95%CI) OR (95%CI) Co Q1 Reference Reference Reference Reference Q2 1.374 (1.070, 1.764)# 1.283 (0.961, 1.712) 1.270 (0.951, 1.696) 1.270 (0.952, 1.694) Q3 1.711 (1.257, 2.329)# 1.522 (1.097, 2.112)# 1.478 (1.063, 2.053)# 1.470 (1.058, 2.042)# Q4 1.291 (0.930, 1.792) 1.660 (1.162, 2.371)# 1.615 (1.127, 2.314)# 1.613 (1.126, 2.310)# lnCo 1.075 (0.992, 1.165) 1.104 (0.997, 1.223) 1.099 (0.991, 1.219) 1.097 (0.990, 1.215) Cr Q1 Reference Reference Reference Reference Q2 0.959 (0.716, 1.286) 0.807 (0.573, 1.135) 0.802 (0.569, 1.131) 0.805 (0.569, 1.138) Q3 1.207 (0.869, 1.677) 1.077 (0.755, 1.537) 1.074 (0.755, 1.529) 1.081 (0.759, 1.539) Q4 1.094 (0.767, 1.561) 1.070 (0.721, 1.590) 1.051 (0.710, 1.556) 1.057 (0.714, 1.565) lnCr 1.037 (0.942, 1.142) 1.018 (0.909, 1.139) 1.014 (0.906, 1.135) 1.015 (0.907, 1.136) Mn Q1 Reference Reference Reference Reference Q2 0.951 (0.784, 1.154) 1.144 (0.908, 1.440) 1.141 (0.905, 1.438) 1.140 (0.904, 1.436) Q3 0.954 (0.749, 1.213) 1.145 (0.873, 1.502) 1.145 (0.875, 1.498) 1.145 (0.877, 1.495) Q4 1.246 (0.957, 1.621) 1.708 (1.245, 2.343)# 1.700 (1.240, 2.331)# 1.699 (1.238, 2.331)# lnMn 1.086 (0.908, 1.299) 1.415 (1.095, 1.829)# 1.408 (1.094, 1.813)# 1.406 (1.091, 1.812)# Pb Q1 Reference Reference Reference Reference Q2 0.940 (0.729, 1.212) 0.796 (0.594, 1.067) 0.804 (0.602, 1.074) 0.803 (0.602, 1.071) Q3 0.903 (0.688, 1.187) 0.741 (0.542, 1.014) 0.742 (0.542, 1.015) 0.737 (0.539, 1.009) Q4 1.085 (0.785, 1.499) 0.718 (0.514, 1.002) 0.728 (0.521, 1.016) 0.722 (0.515, 1.013) lnPb 1.100 (0.922, 1.313) 0.888 (0.765, 1.031) 0.893 (0.769, 1.036) 0.891 (0.768, 1.035) Sb Q1 Reference Reference Reference Reference Q2 0.922 (0.715, 1.189) 0.991 (0.749, 1.312) 0.999 (0.755, 1.323) 0.997 (0.753, 1.321) Q3 0.807 (0.606, 1.075) 1.000 (0.710, 1.408) 1.012 (0.722, 1.418) 1.007 (0.718, 1.413) Q4 0.779 (0.533, 1.140) 0.942 (0.625, 1.418) 0.932 (0.619, 1.403) 0.923 (0.613, 1.391) lnSb 0.893 (0.717, 1.112) 0.926 (0.705, 1.216) 0.923 (0.701, 1.214) 0.918 (0.701, 1.204) Se Q1 Reference Reference Reference Reference Q2 0.699 (0.517, 0.946)# 0.947 (0.684, 1.310) 0.930 (0.674, 1.284) 0.930 (0.674, 1.283) Q3 0.697 (0.498, 0.976)# 1.067 (0.754, 1.510) 1.056 (0.748, 1.489) 1.059 (0.750, 1.497) Q4 0.714 (0.506, 1.007) 1.068 (0.751, 1.516) 1.042 (0.739, 1.470) 1.041 (0.738, 1.467) lnSe 0.831 (0.655, 1.054) 1.048 (0.772, 1.423) 1.028 (0.768, 1.377) 1.025 (0.768, 1.369) Note. Model 1 Adjusted for age, gender, marriage, nationality, residence, education level, income, areas, smoking status, alcohol consumption, body mass index; Model 2 further adjusted for TG and HDL-C. Model 3 further adjusted for hypertension, diabetes and CKD. #: P < 0.05;*: P < 0.001. Abbreviations: HMMs: heavy metals and metalloids; OR: Odds ratios; CI: confidence interval; HDL-C: high density lipoprotein cholesterol; TG: triglyceride; CKD, chronic kidney disease; Co: cobalt; Cr: chromium; Mn: manganese; Pb: lead; Sb: antimony; Se: selenium. Table 2. Association between blood HMMs and hepatic fibrosis risk in all participants
Urine
HMMsCrude model Model 1 Model 2 Model 3 OR (95%CI) OR (95%CI) OR (95%CI) OR (95%CI) As Q1 Reference Reference Reference Reference Q2 1.197 (0.906, 1.581) 1.289 (0.980, 1.695) 1.286 (0.976, 1.694) 1.281 (0.972, 1.687) Q3 1.235 (0.928, 1.645) 1.193 (0.889, 1.600) 1.199 (0.894, 1.606) 1.193 (0.888, 1.603) Q4 1.069 (0.783, 1.458) 1.000 (0.726, 1.377) 0.997 (0.721, 1.378) 0.987 (0.714, 1.366) lnAs 0.986 (0.902, 1.078) 0.954 (0.873, 1.042) 0.950 (0.867, 1.039) 0.948 (0.866, 1.037) Cd Q1 Reference Reference Reference Reference Q2 1.276 (0.974, 1.671) 0.982 (0.727, 1.327) 0.969 (0.719, 1.306) 0.969 (0.718, 1.306) Q3 1.377 (1.041, 1.822)# 0.851 (0.624, 1.160) 0.834 (0.611, 1.137) 0.831 (0.607, 1.137) Q4 2.072 (1.546, 2.778)* 1.133 (0.823, 1.560) 1.127 (0.818, 1.555) 1.124 (0.816, 1.550) lnCd 1.285 (1.160, 1.424)* 1.059 (0.957, 1.171) 1.056 (0.954, 1.170) 1.054 (0.952, 1.167) Hg Q1 Reference Reference Reference Reference Q2 0.899 (0.669, 1.209) 0.985 (0.725, 1.338) 0.987 (0.727, 1.340) 0.984 (0.725, 1.336) Q3 0.855 (0.640, 1.141) 0.922 (0.664, 1.281) 0.924 (0.666, 1.282) 0.927 (0.667, 1.289) Q4 0.993 (0.726, 1.358) 1.104 (0.774, 1.577) 1.085 (0.763, 1.542) 1.083 (0.763, 1.538) lnHg 1.001 (0.918, 1.091) 1.039 (0.941, 1.148) 1.035 (0.938, 1.141) 1.034 (0.938, 1.140) Mo Q1 Reference Reference Reference Reference Q2 1.060 (0.805, 1.395) 0.961 (0.725, 1.273) 0.946 (0.716, 1.251) 0.943 (0.714, 1.245) Q3 1.234 (0.960, 1.586) 0.949 (0.717, 1.255) 0.935 (0.710, 1.232) 0.930 (0.704, 1.227) Q4 1.197 (0.871, 1.645) 0.792 (0.561, 1.117) 0.792 (0.562, 1.115) 0.788 (0.558, 1.112) lnMo 1.074 (0.979, 1.179) 0.957 (0.874, 1.048) 0.955 (0.871, 1.047) 0.954 (0.870, 1.045) Ni Q1 Reference Reference Reference Reference Q2 1.129 (0.856, 1.490) 1.055 (0.771, 1.444) 1.042 (0.761, 1.427) 1.037 (0.760, 1.416) Q3 1.378 (1.083, 1.753)# 1.149 (0.889, 1.485) 1.130 (0.875, 1.460) 1.125 (0.871, 1.454) Q4 1.244 (0.986, 1.570) 0.928 (0.723, 1.190) 0.906 (0.705, 1.164) 0.905 (0.704, 1.164) lnNi 1.073 (0.998, 1.153) 0.977 (0.906, 1.055) 0.972 (0.899, 1.049) 0.970 (0.897, 1.050) Sn Q1 Reference Reference Reference Reference Q2 0.957 (0.745, 1.230) 0.995 (0.734, 1.348) 1.004 (0.741, 1.361) 1.009 (0.745, 1.365) Q3 0.600 (0.451, 0.798)# 0.643 (0.468, 0.883)# 0.642 (0.468, 0.881)# 0.646 (0.471, 0.888)# Q4 0.689 (0.522, 0.909)# 0.739 (0.531, 1.028) 0.727 (0.523, 1.011) 0.729 (0.523, 1.015) lnSn 0.870 (0.792, 0.956)# 0.893 (0.801, 0.995)# 0.888 (0.797, 0.989)# 0.888 (0.797, 0.990)# Tl Q1 Reference Reference Reference Reference Q2 0.899 (0.665, 1.214) 0.864 (0.608, 1.227) 0.849 (0.595, 1.211) 0.847 (0.593, 1.208) Q3 0.945 (0.693, 1.290) 0.912 (0.648, 1.283) 0.904 (0.644, 1.269) 0.901 (0.641, 1.267) Q4 0.996 (0.725, 1.369) 0.842 (0.597, 1.188) 0.829 (0.587, 1.171) 0.822 (0.581, 1.163) lnTl 0.983 (0.883, 1.094) 0.946 (0.846, 1.058) 0.941 (0.841, 1.053) 0.939 (0.839, 1.051) Note: Model 1 Adjusted for age, gender, marriage, nationality, residence, education level, income, areas, smoking status, alcohol consumption, body mass index; Model 2 further adjusted for TG and HDL-C. Model 3 further adjusted for hypertension, diabetes and CKD. #: P < 0.05;*: P < 0.001. Abbreviations: HMMs: heavy metals and metalloids; OR: Odds ratios; CI: confidence interval; HDL-C: high density lipoprotein cholesterol; TG: triglyceride; CKD, chronic kidney disease; As: arsenic; Cd: cadmium; Hg: mercury; Mo: molybdenum; Ni: nickel; Sn: tin; Tl: thallium. Table 3. Association between urine HMMs and hepatic fibrosis risk in all participants
-
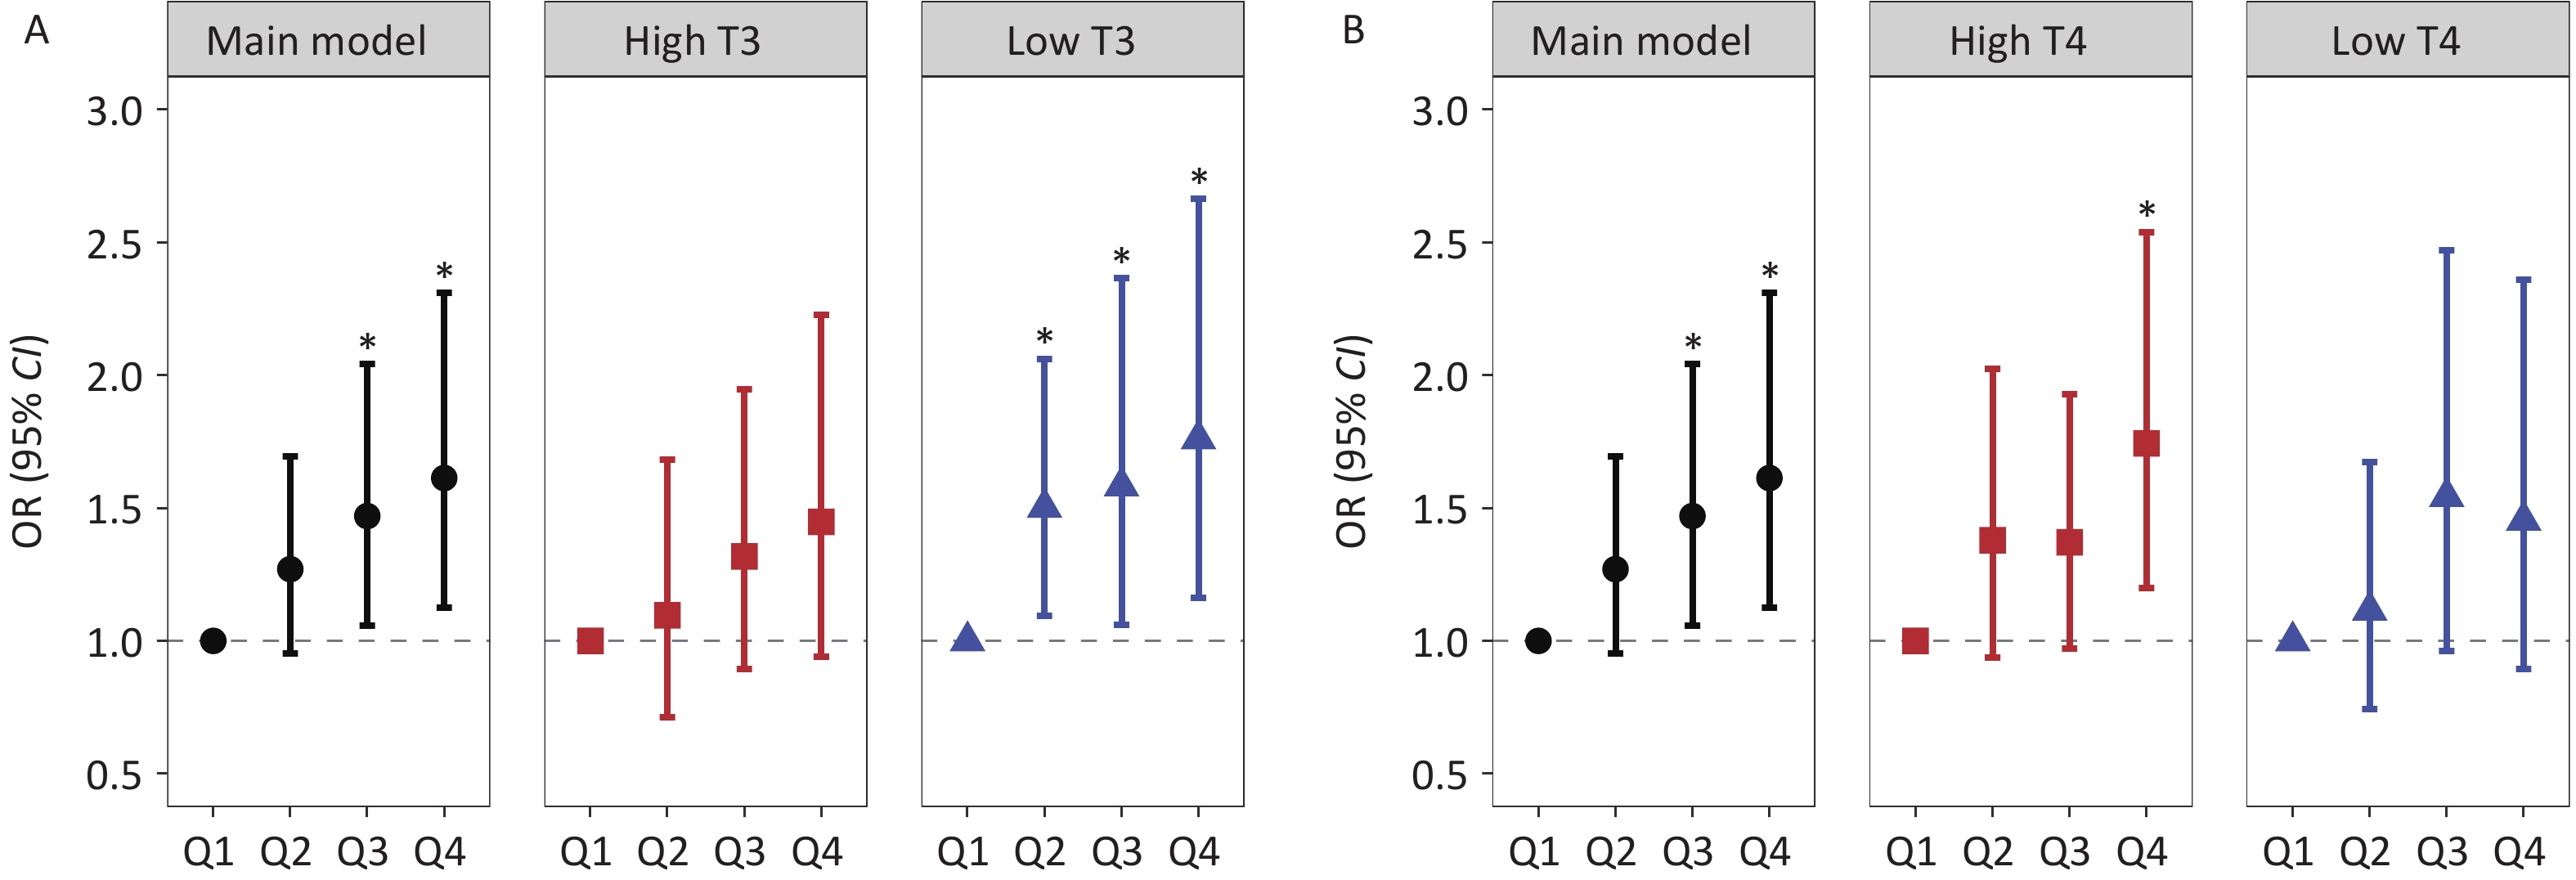
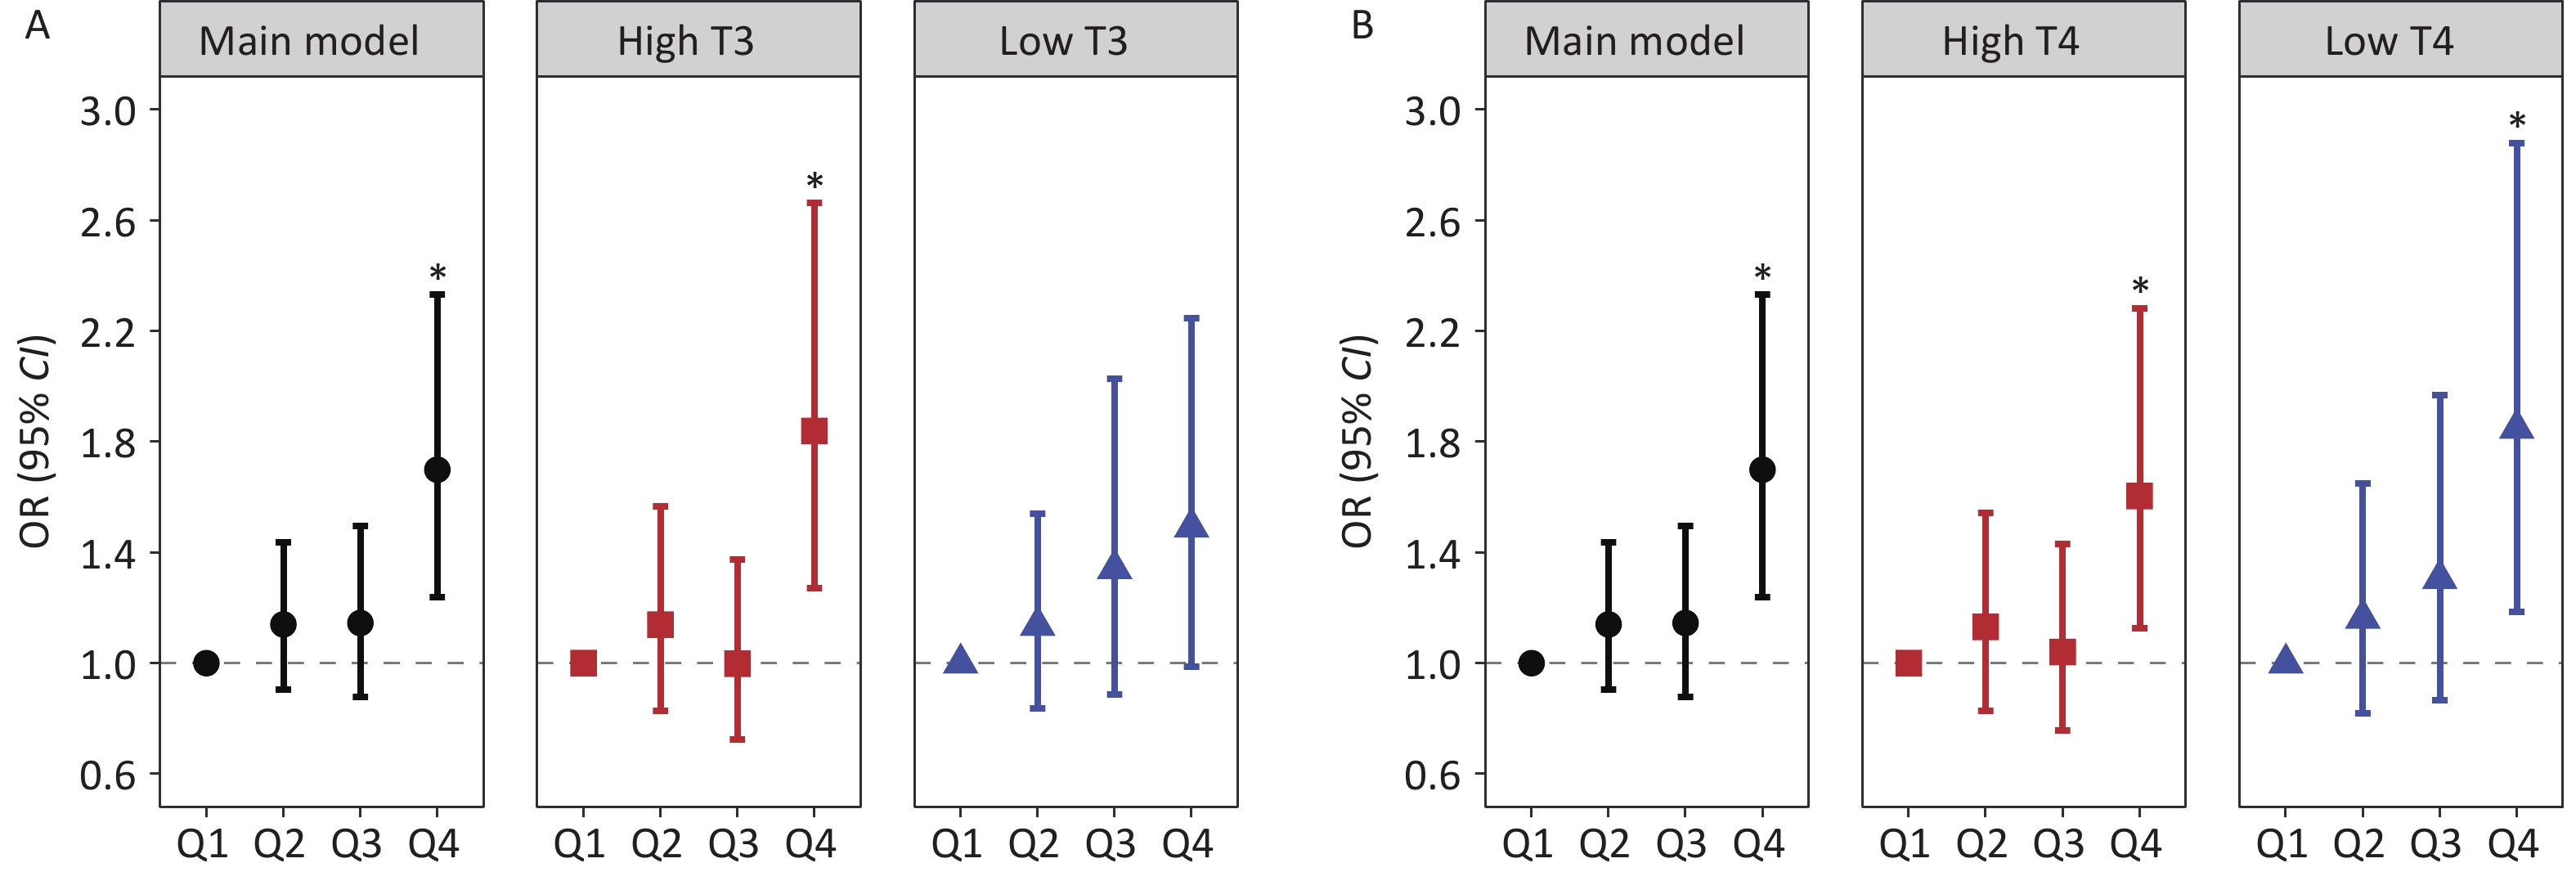
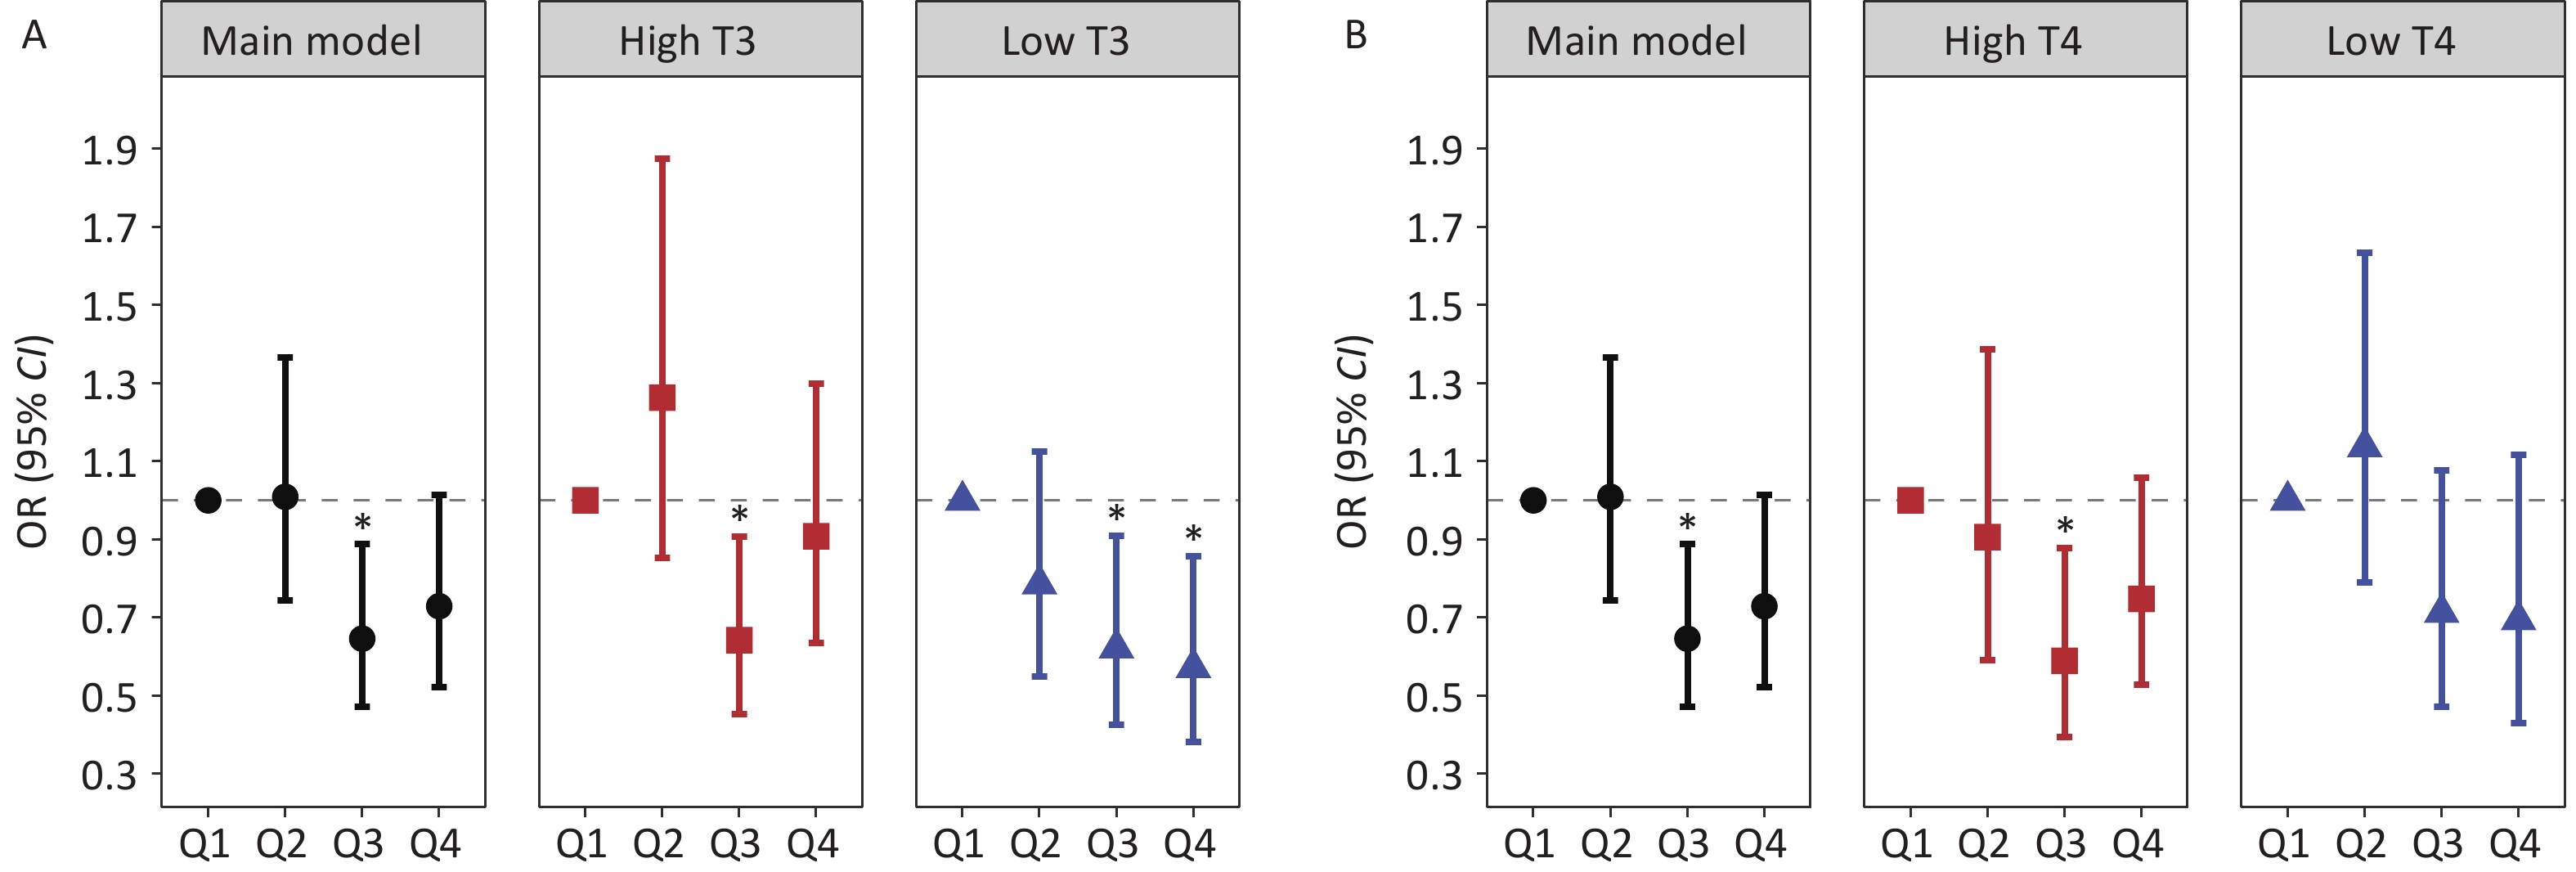
Stratified analysis by thyroid hormone levels revealed a significant increasing trend in hepatic fibrosis risk across ascending blood Co quartiles, specifically within the low T3 subgroup, with ORs (95% CI) of 1.502 (1.094, 2.062) for Q2, 1.583 (1.060, 2.365) for Q3, and 1.760 (1.163, 2.664) for Q4. For Mn, the highest quartile (Q4) showed a significant positive association with hepatic fibrosis risk in the high T3 group (OR = 1.839, 95% CI: 1.270, 2.663). Conversely, urinary Sn exhibited inverse associations with hepatic fibrosis risk among individuals with low thyroid hormone levels. Specifically, in the low T3 subgroup, the negative association between urinary Sn concentrations at the Q3 and Q4 levels and hepatic fibrosis risk showed a decreasing trend, with corresponding ORs of 0.622 (95% CI: 0.425, 0.910) and 0.572 (95% CI: 0.381, 0.858). Stratified analyses by T4 levels revealed that Co, Mn, and Sn were significantly associated with hepatic fibrosis risk in specific quartiles, with effect directions consistent with the primary findings (Figures 2-4 and Supplementary Tables S9-10). The analysis results of the thyroid hormone subgroup of these HMMs and FIB-4 were basically similar to those of hepatic fibrosis risk (Supplementary Tables S14-15).
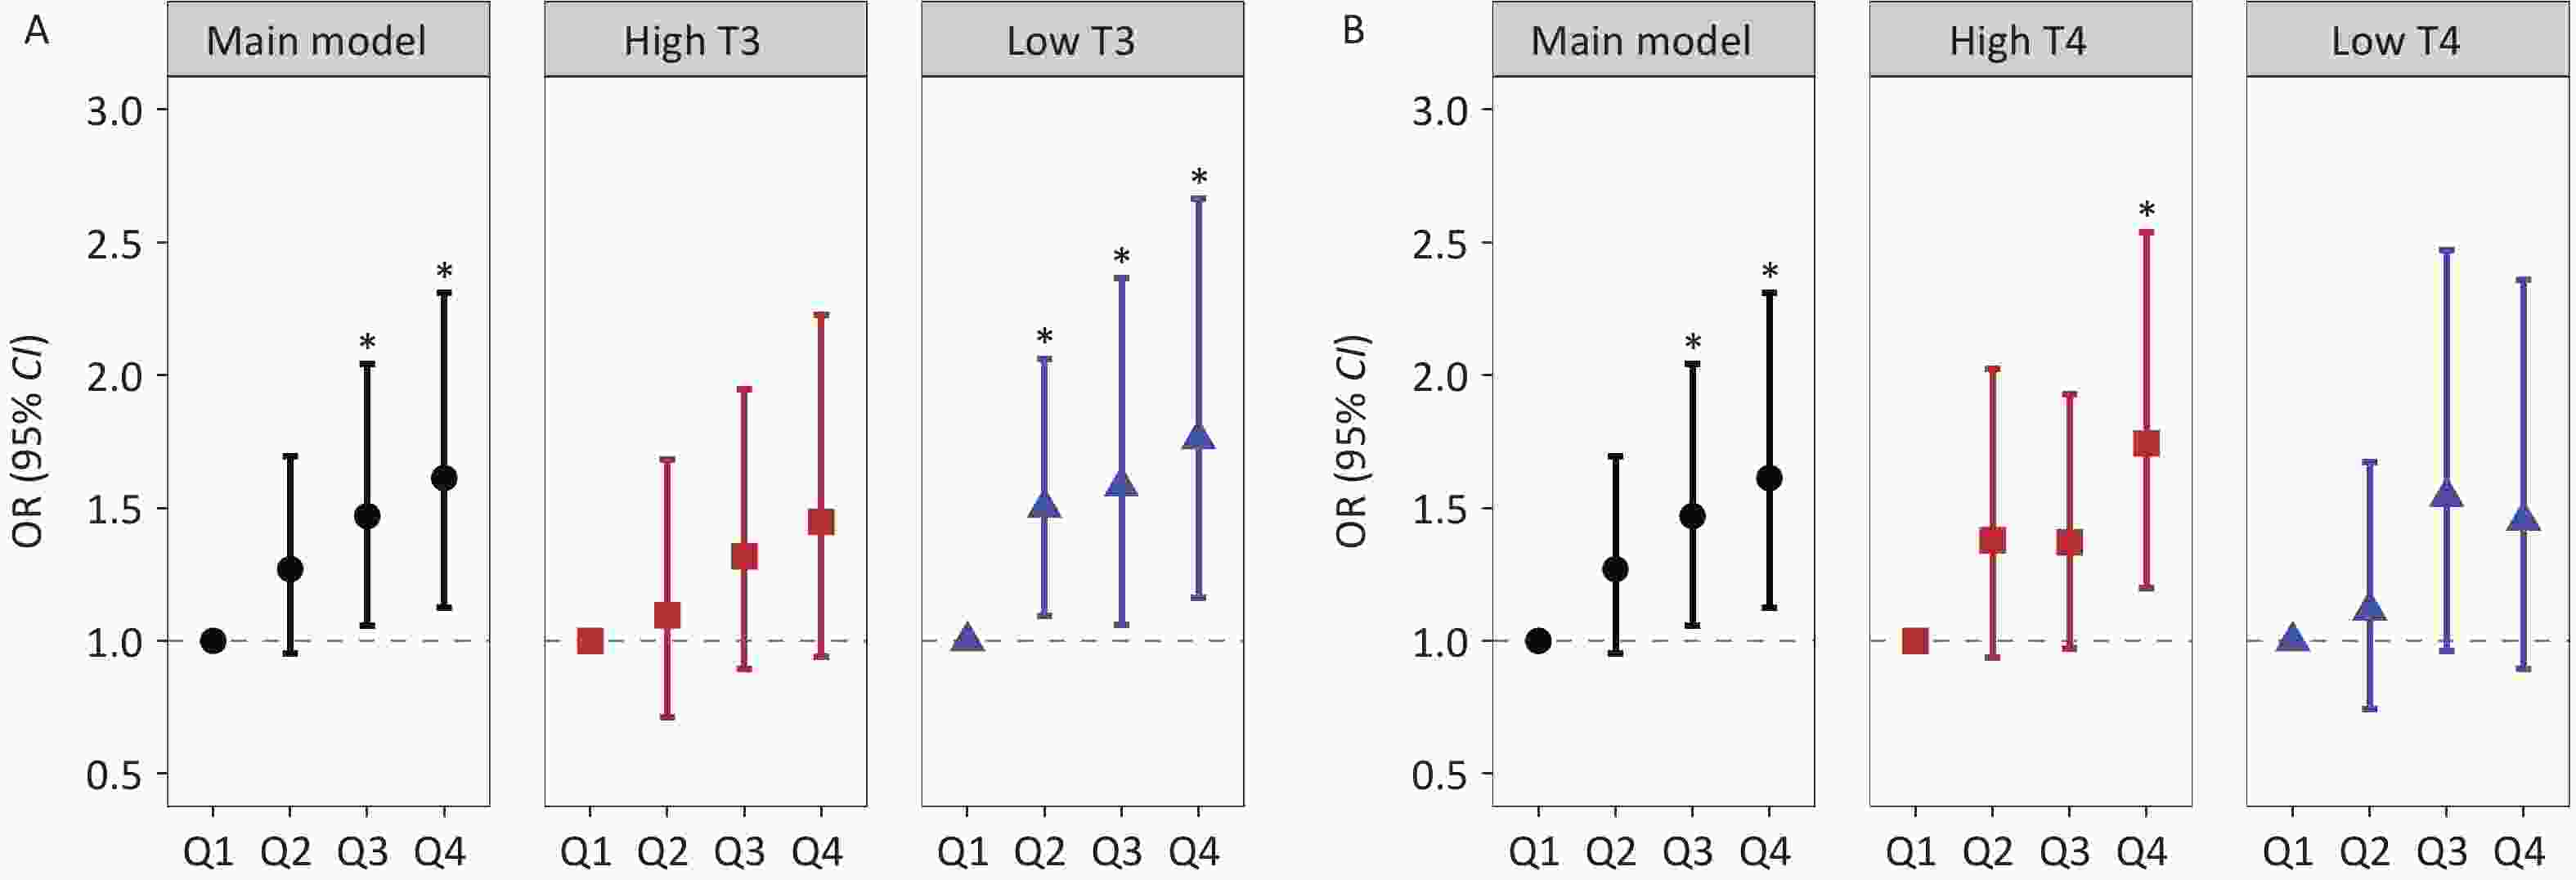
Figure 2. Stratified analyses of the association between Co exposure and hepatic fibrosis risk across the T3 and T4 strata: (A) Co exposure and hepatic fibrosis risk in subgroup T3, (B) Co exposure and hepatic fibrosis risk in subgroup T4. Note: Black circles indicate the main model results, red squares indicate high T3 and T4 subgroups, and blue triangles indicate low T3 and T4 subgroups. *: P < 0.05.
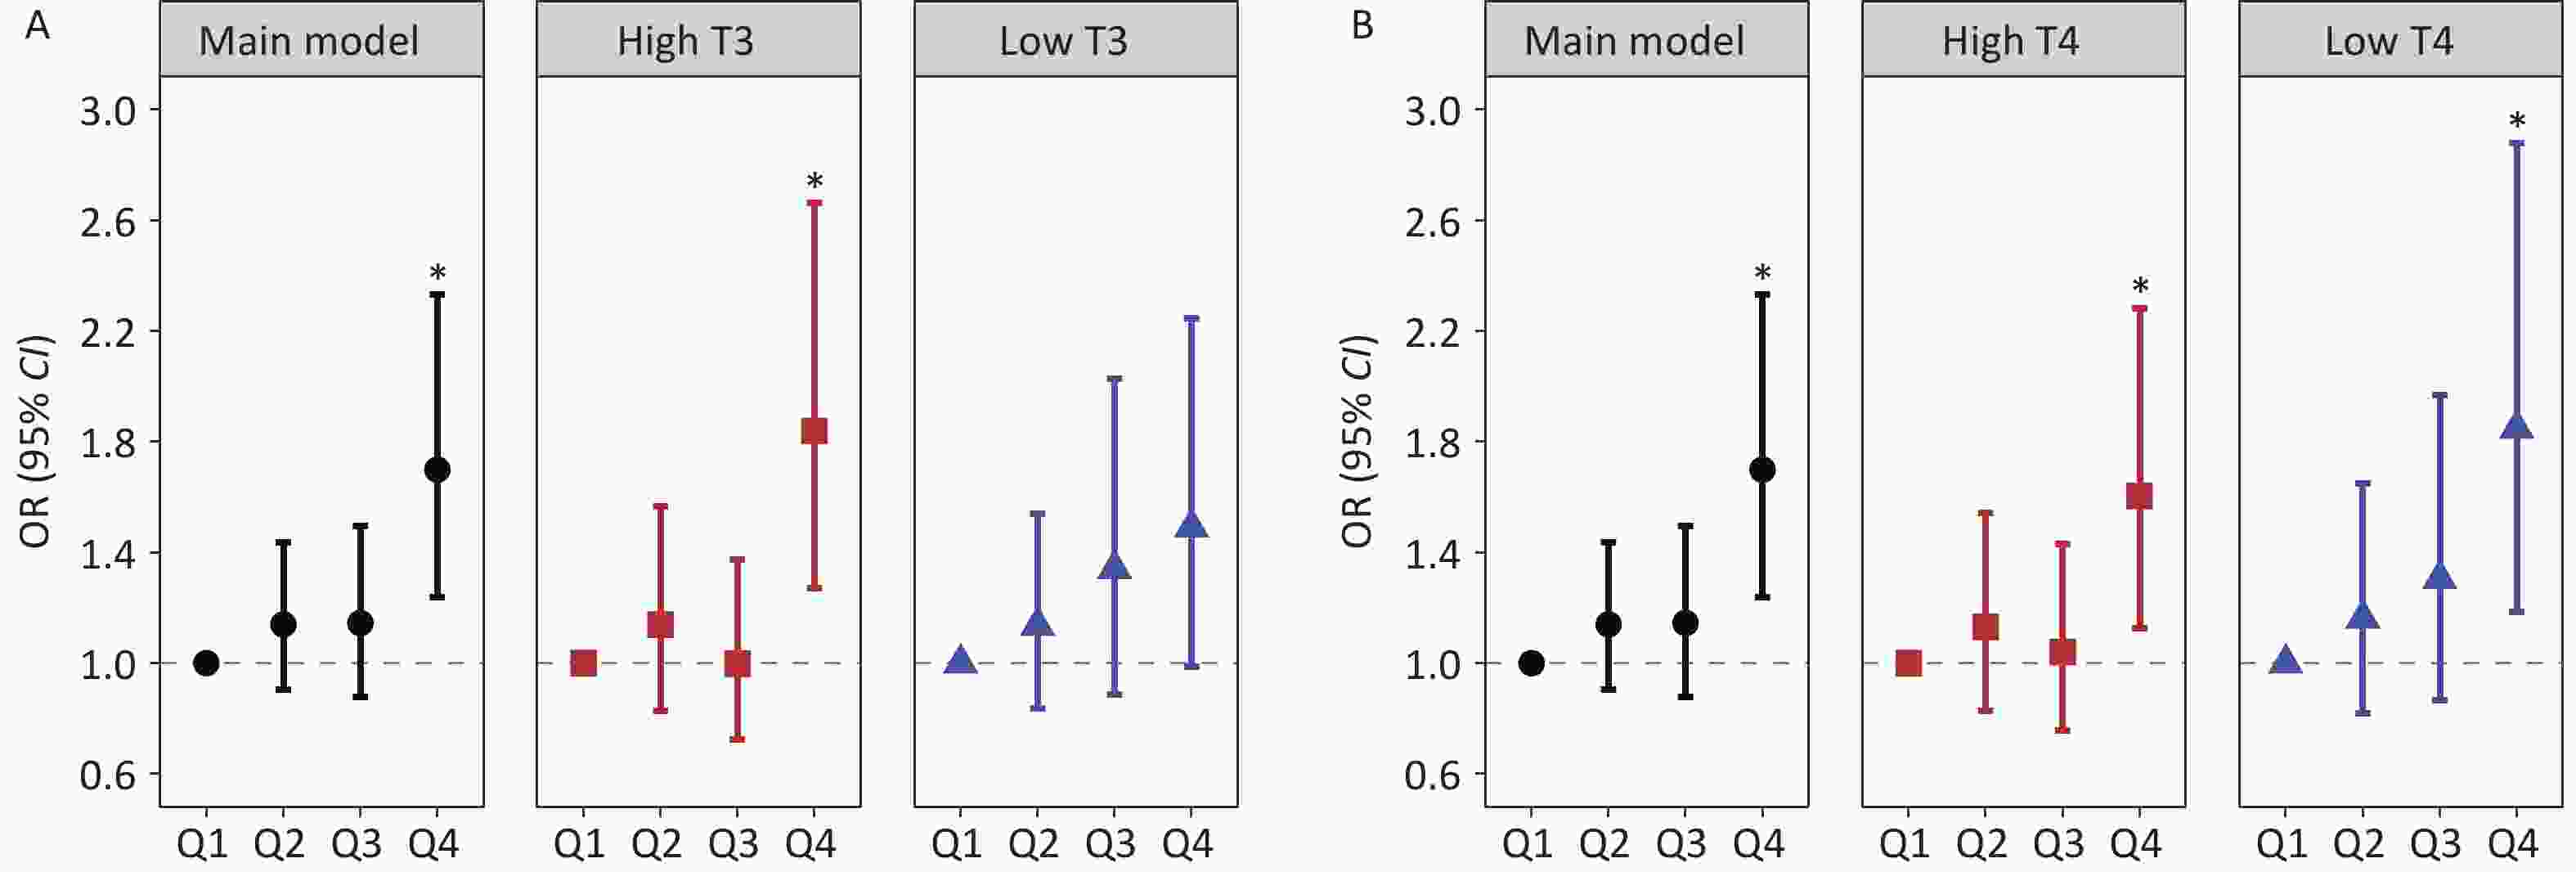
Figure 3. Stratified analyses of the association between Mn exposure and hepatic fibrosis risk across the T3 and T4 strata: (A) Mn exposure and hepatic fibrosis risk in subgroup T3, (B) Mn exposure and hepatic fibrosis risk in subgroup T4. Black circles indicate the main model results, red squares indicate high T3 and T4 subgroups, and blue triangles indicate low T3 and T4 subgroups. *: P < 0.05.
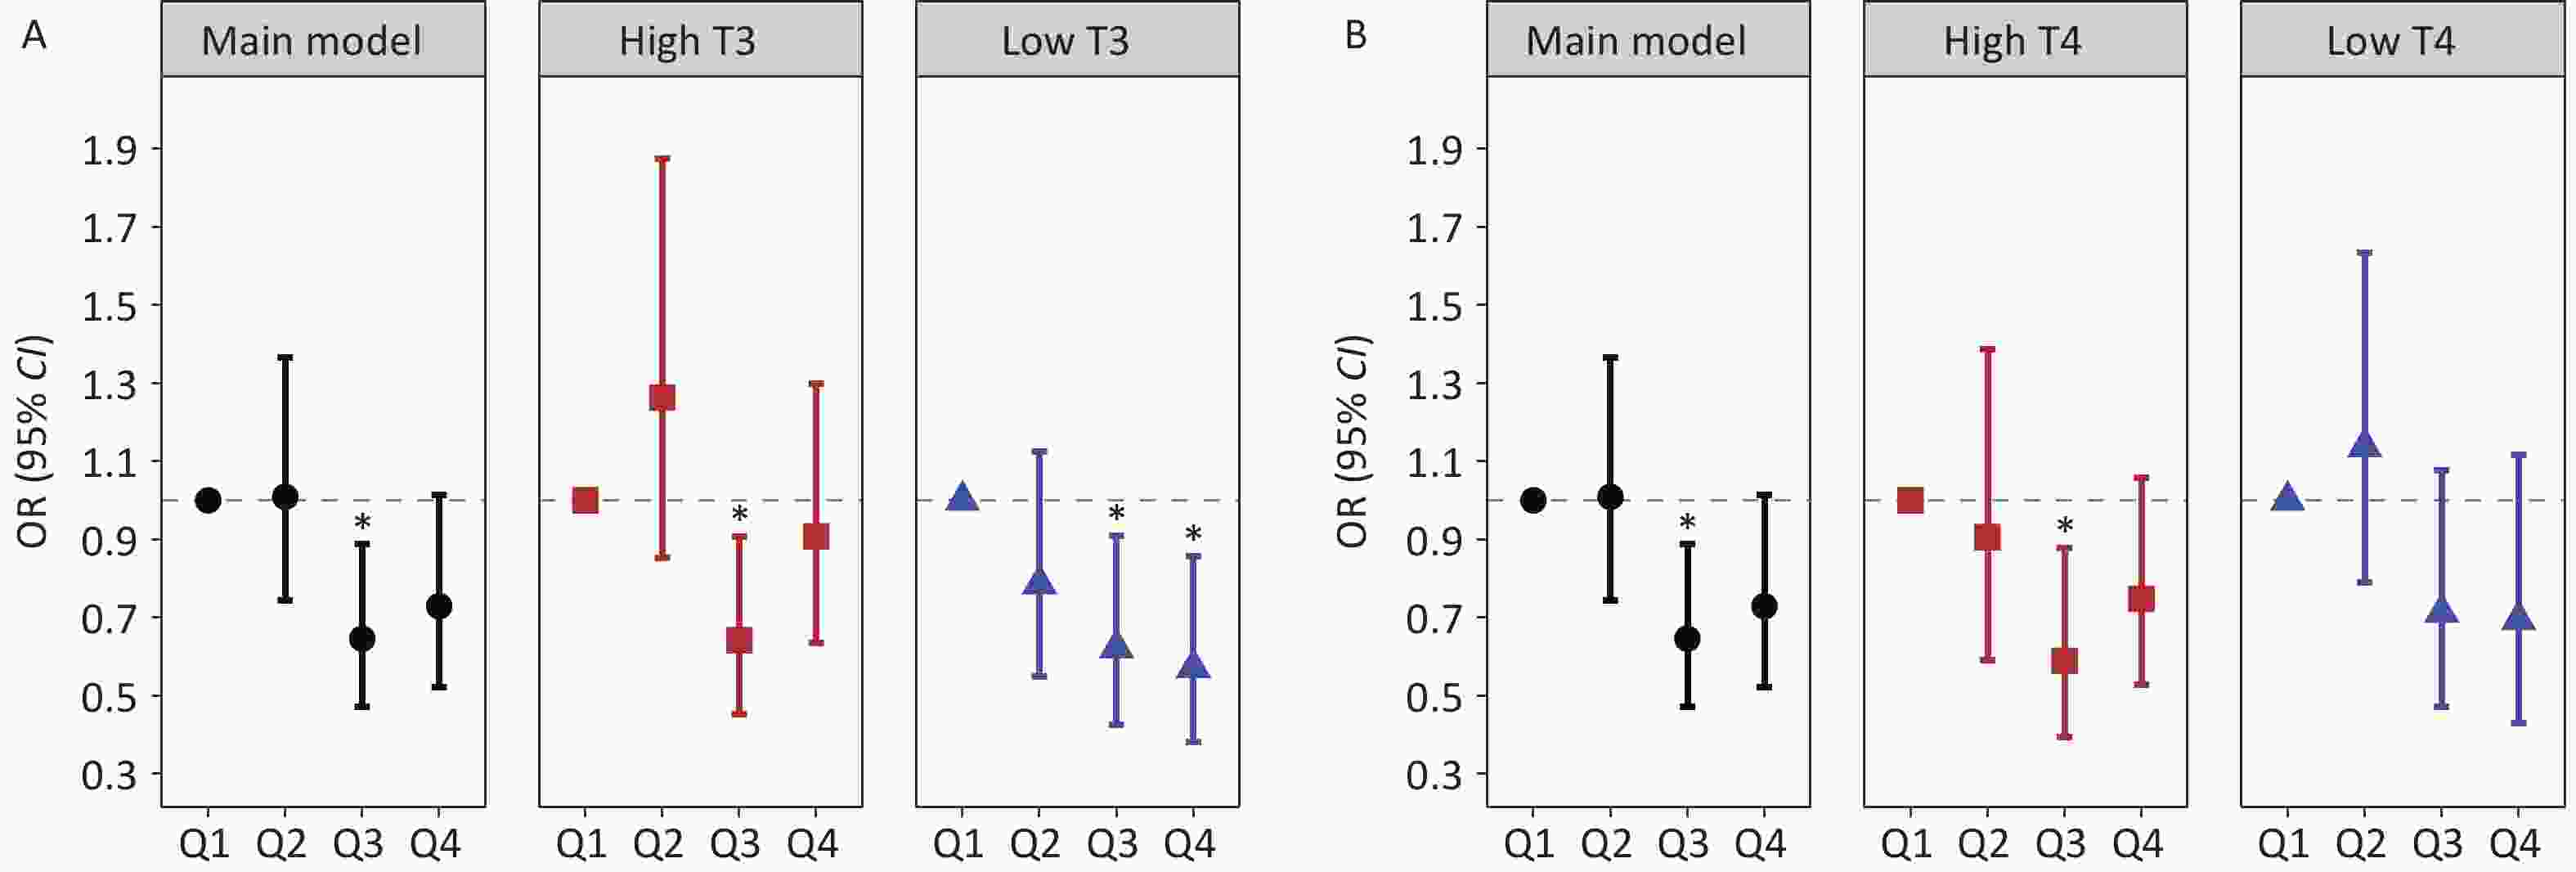
Figure 4. Stratified analyses of the association between Sn exposure and hepatic fibrosis risk across the T3 and T4 strata: (A) Sn exposure and hepatic fibrosis risk in subgroup T3, (B) Sn exposure and hepatic fibrosis risk in subgroup T4. Black circles indicate the main model results, red squares indicate high T3 and T4 subgroups, and blue triangles indicate low T3 and T4 subgroups. *: P < 0.05.
-
Stratified by age, sex, and alcohol consumption, the associations of HMMs with hepatic fibrosis risk and FIB-4 are detailed in Supplementary Tables S6-S8. Age stratification indicated that the observed positive associations of blood Co and Mn to hepatic fibrosis risk did not differ significantly across age groups. In the gender-stratified analysis, positive associations of blood Co and Mn with hepatic fibrosis risk were observed in females, while no comparable association was found in males. Among participants reporting alcohol consumption in the past year, blood Mn was positively associated with hepatic fibrosis risk, whereas a significant positive association was observed between blood Co and hepatic fibrosis risk in non-drinkers. For urinary HMMs, the associations with hepatic fibrosis risk and FIB-4 are presented in Supplementary Tables S11-S13. A significant inverse association was found between urinary Sn and hepatic fibrosis risk exclusively in females, with no similar association observed in males. The negative association of urinary Sn with hepatic fibrosis risk was significant in non-drinkers. The subgroup analysis results of HMMs and FIB-4 were similar to those of hepatic fibrosis risk across all stratification variables.
After excluding the participants with alcohol consumption, the associations of blood Co and urinary Sn with hepatic fibrosis risk, as well as with FIB-4, remained consistent and statistically significant (Supplementary Tables S16-S17). When participants with diabetes or CKD were excluded, the associations of blood Co and blood Mn with hepatic fibrosis risk were slightly strengthened compared to the main estimates (Supplementary Tables S18-S19). In sensitivity analyses with further adjustment for waist circumference, the estimated association of HMMs concentration with hepatic fibrosis risk and FIB-4 were similar to those in the main model (Supplementary Tables S20-S21).
-
Our study provides the first nationally representative evidence from Chinese adults that integrated both blood and urine exposure data, systematically evaluated the association between HMMs and hepatic fibrosis risk, and preliminarily explored the potential modifying effect of thyroid hormones. Our findings demonstrate that blood Co and blood Mn exhibit significant nonlinear positive associations with hepatic fibrosis risk and FIB-4. In contrast, urinary Sn demonstrates a nonlinear inverse association with hepatic fibrosis risk. Our findings indicate that thyroid hormone status may modify the associations between heavy metal exposure and hepatic fibrosis risk, with this effect exhibiting a metal-specific pattern. Specifically, low T3 levels are associated with an increased risk of hepatic fibrosis from Co exposure and a correspondingly enhanced protective effect of Sn, while high T3 levels exacerbate the hepatic fibrosis risk associated with Mn exposure. In addition, the association of HMMs with hepatic fibrosis risk differed across gender and alcohol consumption subgroups. These findings provide new epidemiological evidence for a deeper understanding of the complex associations between environmental HMMs exposure and hepatic fibrosis development.
Co is an essential trace element that plays critical physiological roles, including stimulating hematopoiesis and participating in coenzyme reactions[36]. Evidence from animal experiments has suggested that Co accumulation in the body promotes reactive oxygen species (ROS)-mediated oxidative stress and inhibits calmodulin activity, causing hepatocellular injury and ultimately contributing to the progression of hepatic fibrosis[37,38]. Previous epidemiological studies have also provided evidence linking Co exposure to hepatic fibrosis. Urinary Co and FIB-4 were shown to be positively associated in NHANES 2005-2020 data[39]. Similarly, analysis of NHANES 2017-2018 data revealed a link between blood Co exposure and elevated risk of advanced hepatic fibrosis, though this link did not retain statistical significance after adjustment for traditional risk factors[40]. Our study is consistent with these previous reports, demonstrating a significant positive association between blood Co and both FIB-4 and hepatic fibrosis risk. These results suggest that blood Co plays a potential pathogenic role in the development of hepatic fibrosis. It should be noted that blood Co was used as an exposure biomarker in this study. Compared with urinary Co, blood Co provides a more reliable assessment of Co exposure due to its stable binding to Co-transporting proteins, longer biological half-life and more stable concentration in the body[41-43]. Importantly, the direction of association between blood Co and hepatic fibrosis risk was consistent with that of urinary Co. The consistent direction of association across different biomarkers provides additional evidence for the pathogenic involvement of cobalt in hepatic fibrosis.
Similar to blood Co, Mn is also an essential trace element that serves as an activator and cofactor for various metalloenzymes, playing critical roles in physiological processes including antioxidant defense and energy metabolism[44]. However, excessive Mn accumulation in the liver may contribute to severe hepatic injury through potential mechanisms such as inducing oxidative stress, mitochondrial dysfunction, inflammation, and apoptosis, thereby accelerating the progression of hepatic fibrosis[45-47]. Animal studies have provided mechanistic support, showing that high Mn exposure induces hepatic fibrosis and inflammation in rat models of subacute toxicity[48]. Considering that blood Mn may be superior to urine Mn in reflecting the overall body burden[49], we selected blood Mn as the biomarker for assessing Mn exposure in this study. Our findings regarding the hepatic effects of blood Mn are consistent with previous studies, based on NHANES data from 2017 to 2018, which linked blood Mn to an increased risk of hepatic fibrosis[16,50]. Meanwhile, Liu et al. observed a positive association of urinary Mn with advanced hepatic fibrosis, with a similar trend noted for blood Mn exposure[51,52]. Overall, evidence from studies using different biomarkers consistently suggested an association between Mn exposure and hepatic fibrosis risk, further supporting Mn as an environmental risk factor for hepatic fibrosis.
Notably, our study observed a negative association between urinary Sn and hepatic fibrosis risk, a finding that has not been reported in previous epidemiological studies. A study based on 2017-2020 NHANES data, including 2,283 adults aged 18 years and older, reported a similar inverse trend between urinary Sn levels and hepatic fibrosis, although the association was not statistically significant[13]. As an trace element, Sn functions as a cofactor for various enzymes and participates in the biological reactions of flavoenzyme, potentially acting as an important protective factor for hepatic fibrosis[53]. Experimental studies have shown that Sn-containing extracts can improve the histological structure of liver tissues in hepatitis model rats, and reduce the expression of cytochrome c, which is one of the mechanisms of liver cell death[54]. In addition, Li et al. experimentally demonstrated that Sn-porphyrin-based nanozymes exhibit catalytic activity comparable to that of native superoxide dismutase, effectively scavenging superoxide radical anions, highlighting their potential as superoxide dismutase-mimicking artificial enzymes for the clinical treatment of oxidative stress-related diseases[55]. These findings providing mechanistic context for the observed negative association between urinary Sn levels and hepatic fibrosis in the present study. These findings provide mechanistic context for the observed negative association between urinary Sn levels and hepatic fibrosis in the present study. However, the molecular mechanisms underlying these protective effects remain to be elucidated. Future studies should investigate them using in vitro hepatocyte models to explore cellular pathways and in vivo animal models to assess hepatic histological changes.
Thyroid hormones are essential for maintaining metabolic homeostasis and facilitating adaptive responses to changing energy demands[23]. Thyroid hormones mainly exist in two forms: T3 and T4. T3 is the major active form that directly binds to target cell receptors to initiate biological effects. In contrast, T4 is a prohormone with relatively weak biological activity, requiring conversion to active T3 through deiodination before effectively exerting its physiological functions[56,57]. Studies have shown that thyroid dysfunction, encompassing both hypothyroidism and hyperthyroidism, modulates the transcription of genes that govern lipid, glucose, and protein metabolism and influences protein synthesis and detoxification pathways, establishing a biological basis for their role in promoting liver injury and fibrosis[22]. Additionally, thyroid hormones play an important regulatory role in the metabolic process, which can affect the absorption, distribution, and excretion of metals, thereby influencing the toxic effects of metals[58,59]. Existing studies indicate that relatively low T3 levels within the normal range constitute an independent risk factor for advanced hepatic fibrosis[60]. Experimental studies demonstrate that T3 can mitigate hepatic inflammation and fibrosis progression in NASH mice by restoring autophagy and mitochondrial biogenesis and by negatively regulating the NLRP3 signaling pathway[61,62]. Based on these findings, it is plausible that low T3 may compromise hepatic metabolic and antioxidant capacity, increasing hepatocellular susceptibility to Co-induced oxidative stress and thereby exacerbating Co-related hepatic fibrosis. Under these compromised conditions, Sn might show a more readily observable protective effect. Conversely, high T3 levels may increase the risk of Mn-related hepatic fibrosis, consistent with experimental evidence of the dose-dependent effects of T3: moderate T3 concentrations reduced inflammation and oxidative damage, whereas high concentrations had the opposite effect, suggesting that T3 levels modulate Mn-induced hepatotoxicity and fibrosis in a dose-dependent manner[63]. The underlying mechanisms require further experimental validation. In addition, we found that the associations between Co, Mn, and Sn exposure and hepatic fibrosis risk were significant in women, consistent with previous research[13]. These gender-specific associations may be attributed to hormonal, genetic, and metabolic factors[64]. Furthermore, we observed that the association between HMMs and hepatic fibrosis risk varied across alcohol consumption subgroups. Especially, the positive association between blood Mn and hepatic fibrosis risk was more significant in drinkers, which has been supported by existing studies[65]. This pattern indicates that alcohol may synergistically enhance its hepatotoxicity by exacerbating oxidative stress or disrupting with the Mn metabolic pathways[66].
The findings of this study emphasize that thyroid function status, as a critical individual characteristic, may modify the susceptibility to hepatotoxicity of specific HMMs. Furthermore, the differences in the intensity of associations between gender and subgroups of alcohol consumption observed in the study further suggest the existence of population heterogeneity in heavy metal hepatotoxicity. This understanding is of great significance for accurately identifying high-risk populations exposed to HMMs and formulating personalized prevention and intervention strategies.
This study has several strengths. First, the research data were obtained through multi-stage stratified sampling of the Chinese population, with the sampling framework accounting for heterogeneity in both geographical distribution and demographic characteristics. The samples are nationally representative, and the conclusions drawn have strong generalizability, providing reliable references for related research across the country. Second, the analysis focused on 13 HMMs, covering not only widely concerned environmental heavy metals such as Pb and Cd, but also easily overlooked trace elements like Co and Sn. Finally, this study represents the first preliminary investigation into differences in the HMMs-hepatic fibrosis risk association across varying thyroid hormone levels, providing preliminary evidence for the potential modifying role of thyroid hormones in metal hepatotoxicity. This study also has some limitations. First, given the cross-sectional design of this study and the single-time-point assessment of HMMs and thyroid hormone levels, causal links among HMMs exposure, thyroid hormone levels, and hepatic fibrosis risk could not be established, and these measurements may not fully reflect long-term exposure or stable hormonal status. Secondly, despite controlling for multiple potential confounders and obtaining robust results in sensitivity analyses, residual confounding may remain. Finally, while the epidemiological findings explore statistical associations and effect modification, the specific biological mechanisms underlying the interaction between HMMs and thyroid hormones in driving liver injury remain to be elucidated through experimental studies.
-
This study revealed that nonlinear positive associations between blood Co and blood Mn with both hepatic fibrosis risk and FIB-4, as well as a nonlinear negative association between urinary Sn and hepatic fibrosis risk. Importantly, our findings also suggested the potential role of thyroid hormones in the associations between Co, Mn, Sn, and hepatic fibrosis risk. In summary, this study adds novel evidence linking HMMs exposure to liver disease, highlighting the role of thyroid hormones as a potential modifier. These findings underscore the critical need to integrate both environmental pollutants and endocrine factors in future research aimed at preventing and managing hepatic fibrosis.
HTML
Study Population
HMMs Exposure Assessment
Measurement of Hepatic Fibrosis Risk
Measurement of Thyroid Hormone in Serum
Covariates
Statistical Analysis
Weighted Multivariate Logistic and Linear Regression Models
Restricted Cubic Spline (RCS) Functions with Knots
Stratified Analyses and Sensitivity Analyses
Characteristics of Participants
Association of Individual HMMs with Hepatic Fibrosis Risk and FIB-4
Modification Effects of Thyroid Hormones
Subgroup Analysis and Sensitivity Analysis
Competing Interests The authors declare that they have no known competing financial interests or personal relationships that could have appeared to influence the work reported in this paper.
Ethics The ethics committee of the Chinese Center for Disease Control and Prevention's National Institute of Environmental Health granted approval to this study (No.201701). Written informed permission was signed by each participant.
Authors’ Contributions Lu Yu, Writing - original draft, Writing - review & editing, Methodology, Data analysis, Visualization. Zheng Li, Writing - review & editing, Methodology, Investigation. Peijie Sun, Writing - review & editing, Methodology, Visualization. Shuyang Yan, Writing - review & editing, Visualization. Wanying Shi, Writing - review & editing, Methodology, Data curation. Wenqi Hao, Writing - review & editing, Investigation. Wanling Li, Writing - review & editing, Investigation. Dejin Yang, Writing - review & editing, Investigation. Mingkun Yu, Writing - review & editing, Investigation. Yingli Qu, Writing - review & editing, Data curation, Funding acquisition. Saisai Ji, Writing - review & editing, Data curation. Wenli Zhang, Writing - review & editing, Investigation. Feng Zhao, Writing - review & editing, Project administration. Yawei Li, Writing - review & editing, Investigation. Haocan Song, Writing - review & editing, Investigation. Jiayi Cai, Writing - review & editing, Investigation. Ying Zhu, Writing - review & editing, Investigation. Song Tang, Writing - review & editing, Funding acquisition. Feng Tan, Writing - review & editing, Supervision, Methodology, Conceptualization. Yuebin Lv, Writing - review & editing, Supervision, Methodology, Project administration, Funding acquisition. Xiaoming Shi, Writing - review & editing, Supervision, Project administration, Funding acquisition.

 Quick Links
 DownLoad: