


-
Population aging is a major challenge worldwide. In China, the oldest old (adults aged ≥ 80 years) represent a rapidly expanding subgroup[1]. Malnutrition and underweight are prevalent in the oldest old, driven in part by age-related physiological decline, reduced sensory function, and impaired digestion and absorption, which may increase vulnerability to chronic disease and mortality[2,3].
Body mass index (BMI) is a simple and commonly used indicator for assessing obesity and nutritional status. Evidence has shown that BMI is a significant independent predictor of cardiovascular disease (CVD) and mortality in the adult population[4]. However, the relationship between BMI and adverse outcomes may differ later in life. Recent research has indicated the emergence of an 'obesity paradox' among the oldest old population, whereby higher BMI levels do not necessarily increase mortality risk and may even be associated with lower mortality rates[5–7]. This finding necessitates a re-evaluation of the established relationship between BMI and disease, functional decline, and mortality risk in this population.
The current BMI standards and management strategies for the general adult population require targeted adjustments. China has issued the Guidelines for the Prevention and Control of Overweight and Obesity in Chinese Adults, which recommend a uniform BMI reference range for adults aged ≥ 18 years[8]. Meanwhile, screening methods and criteria for overweight and obesity have also been established among school-aged children and adolescents aged 6–18 years[9]. However, population-specific recommendations for an appropriate BMI range and weight management standards for the oldest old population remain lacking.
To address these gaps and provide actionable guidance for health professionals, the "Appropriate body mass index range and weight management standards for the oldest old (WS/T 868—2025)" (a recommended national health professional standard) was developed. It defines an appropriate BMI range for the oldest old and specifies the operational requirements for BMI assessment and weight management in medical institutions and integrated medical–eldercare facilities.
-
The WS/T 868-2025 is a recommended national health professional standard developed under the standardization framework of the National Health Commission of the People's Republic of China.
It provides guidance on the appropriate BMI range and weight management for the oldest old population. This standard is applicable to healthcare professionals in healthcare institutions and to integrated medical care service providers. It is used to evaluate BMI levels and manage weight among the oldest old population.
The standard comprises six core sections: scope, normative references, terms and definitions, age calculation and recommended BMI range, BMI measurement, and weight management.
-
This standard is designed to guide BMI assessment and weight management for the oldest old in China. It is intended for professionals working in healthcare institutions and integrated medical–eldercare facilities.
-
In accordance with the stipulations set out in the WS/T 868-2025, reference is made to the “Anthropometric measurements method in health surveillance (WS/T 424-2013)”[10] for anthropometric measurement methods and to “The standard for healthy Chinese older adults (WS/T 802-2022)”[11] with regard to health standards of older adults. These standards support measurement standardization and contextual assessment before recommending physical activity.
-
The standard defines the “oldest old” population as individuals aged ≥ 80 years and defines BMI as weight (kg) divided by height squared (m2). The text further defines the “appropriate BMI range” as a BMI interval associated with relatively lower risks of adverse health outcomes and “cut-off points” as thresholds used to classify whether the BMI falls within that interval.
-
The age of an individual was determined using an integer value calculated by subtracting the date of birth from the measurement date. According to the stipulations set out in the WS/T 868-2025, the recommended BMI range for the oldest old is 22.0–26.9 kg/m2.
-
The WS/T 868-2025 adopted the anthropometric measurement procedures specified in the WS/T 424-2013 for assessing height and weight. Standing height should be measured using standardized positioning. For individuals who are unable to stand, height may be estimated using supine body length or knee-height-based prediction equations.
Body weight should be measured using calibrated scales under standardized conditions. Weight can be estimated using the difference method for wheelchair users or individuals with mobility impairments by subtracting the weight of the wheelchair or assistive device.
Considering the high prevalence of spinal deformities and age-related height reduction among older adults, this standard emphasizes measurement consistency and repeatability. Standardized procedures are recommended to ensure reliable longitudinal monitoring.
-
The standard emphasizes individualized weight management strategies for the oldest old population, with specific management goals defined according to BMI categories. Health status assessment is recommended in accordance with the WS/T 802-2022. This standard defines BMI-based stratification as follows: a BMI < 22.0 kg/m2 is below the recommended range, a BMI 22.0–26.9 kg/m2 is within the recommended range, and a BMI > 26.9 kg/m2 is above the recommended range. Individuals with BMIs outside the recommended range should undergo long-term monitoring and be included in ongoing health management. In addition, the standard specifies general principles for weight monitoring and early warning of weight change, and provides overall recommendations for dietary and physical activity management based on national standards.
-
This standard represents the first national health professional standard developed specifically to define an appropriate BMI range and weight management strategies for adults aged ≥80 years in China. The development process incorporated evidence from a systematic review to determine the lower boundary of the recommended BMI range, together with empirical analyses based on data from the Chinese Longitudinal Healthy Longevity Survey (CLHLS)[12]. The upper boundary of the recommended BMI range was determined using weighted BMI distribution data with reference to international cutoff point selection practices adopted by organizations such as the World Health Organization (WHO)[13] and the U.S. Centers for Disease Control and Prevention (CDC)[14].
-
The development of this standard was informed by a systematic review conducted to support evidence-based recommendations for the appropriate BMI range for the oldest old population. This review focuses on studies involving older East Asian adults and examines the association between BMI and a range of health outcomes, including all-cause mortality, CVD mortality, cardiovascular events, cognitive impairment, frailty or weakness, and limitations in activities of daily living.
Relevant studies were retrieved from both Chinese and international databases, including the CNKI, Wanfang, and VIP databases, as well as PubMed and Embase, using predefined search strategies based on exposure and outcome terms. After screening and eligibility assessment, 10 studies met the inclusion criteria and were included in the evidence synthesis. The main characteristics of these studies are summarized in Table 1.
Literature Study design Source of the population Exposure Outcome Sample size Evidence Lv et al.[15].
(2018)Prospective cohort study Chinese
(age 91.8 ± 7.5 years)1) BMI categories:
underweight (<18.5 kg/m2);
normal weight (18.5 ≤ BMI < 24.0 kg/m2);
overweight/obese (≥ 24.0 kg/m2).
2) Sex-specific BMI tertiles:
men (<19.1; 19.1–22.0; ≥ 22.0 kg/m2);
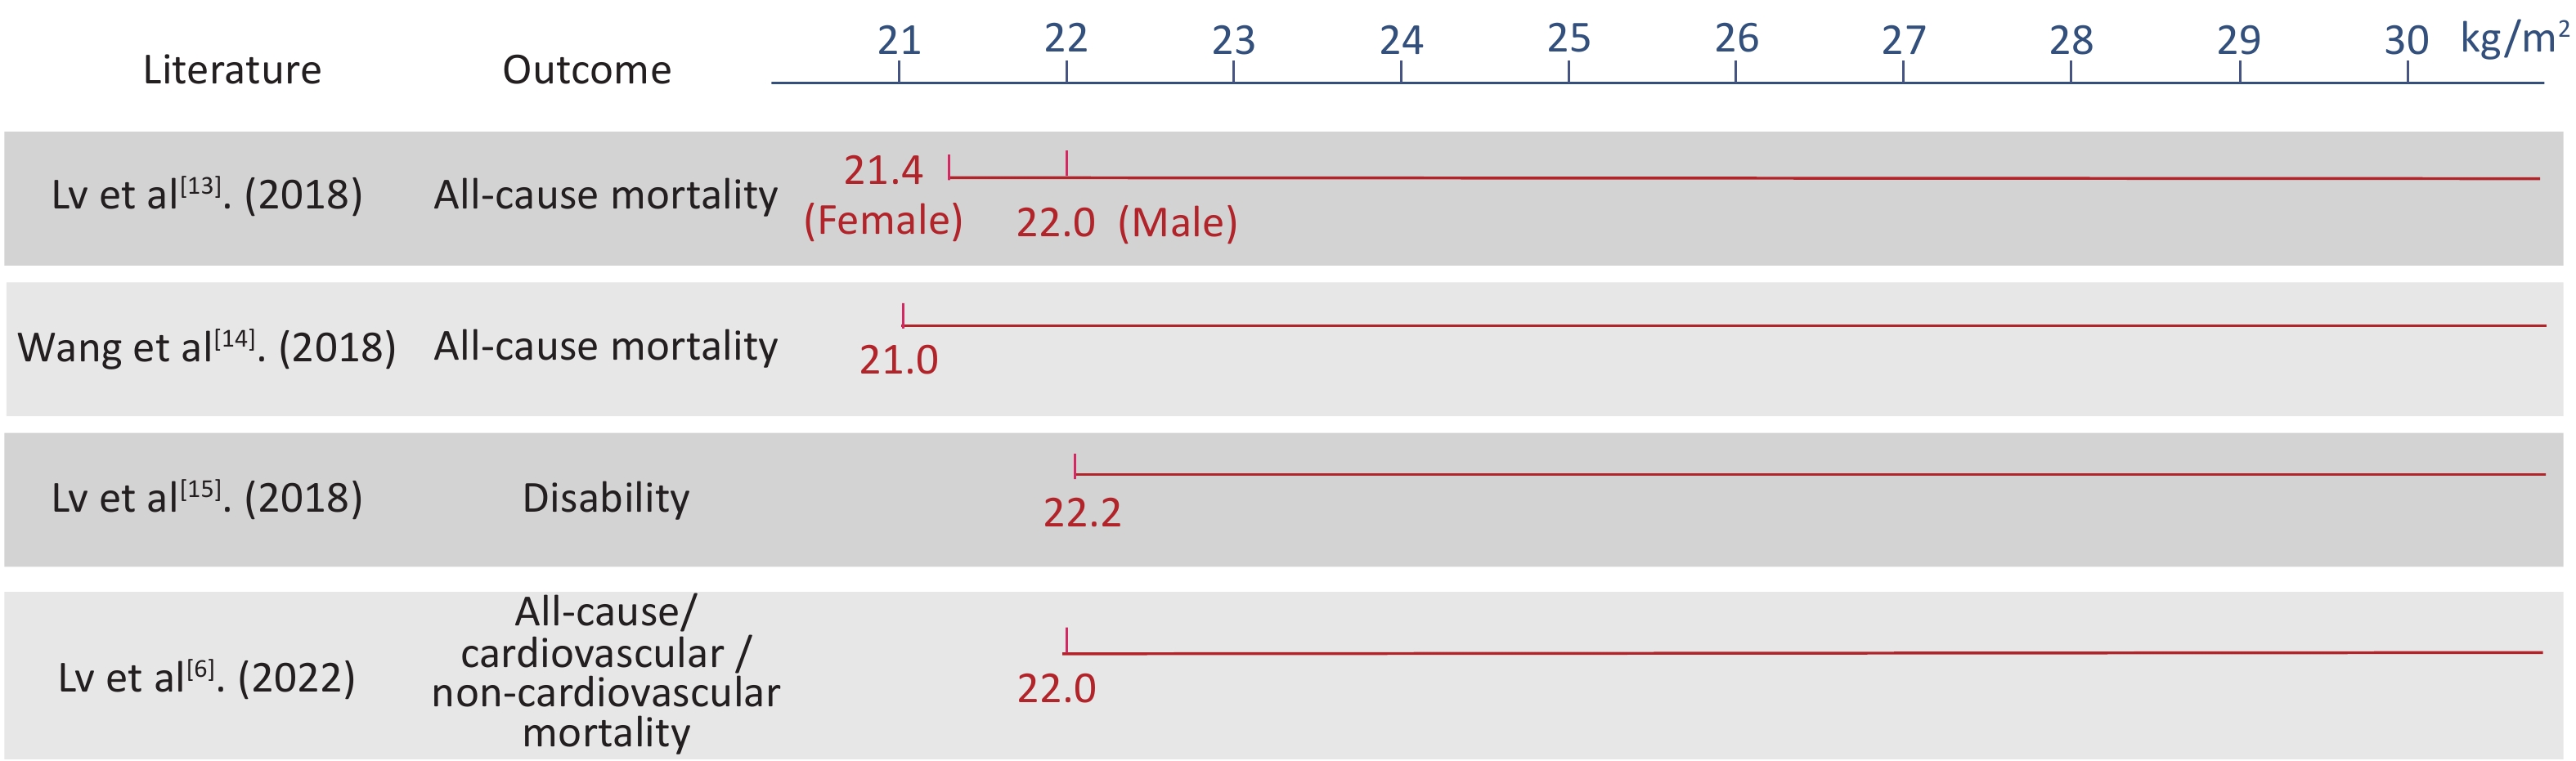
women (<18.2; 18.2–21.4; ≥ 21.4 kg/m2).All-cause mortality 4,361 1. Higher BMI was linearly associated with lower mortality risk.
2. The overweight/obese group exhibited the lowest mortality.
3. The lowest-risk BMI thresholds were ≥22.0 kg/m2 in men and ≥21.4 kg/m2 in women.Wang et al.[16].
(2018)Prospective cohort study Chinese
(Men age: 90.1 ± 6.9 years
Women age: 93.5 ± 7.7 years)1) BMI categories:
Underweight (<18.5 kg/m2);
Normal (18.5–23.9 kg/m2);
Overweight (24.0–27.9 kg/m2);
Obese (≥ 28.0 kg/m2).
2) BMI grouped in 0.9 kg/m2 increments from 12.0-39.9 (19 groups); ≥40.0 as one group.All-cause mortality 8,026 1. Relative to normal weight, underweight was associated with higher mortality, while overweight was associated with lower mortality.
2. The lowest all-cause mortality risk occurred at BMI ≥21.0 kg/m2.Lv et al.[17].
(2018)Prospective cohort study Chinese
(age 92.2 ± 7.2 years)1) BMI categories:
Underweight (<18.5 kg/m2);
Normal weight (18.5–23.9 kg/m2);
Overweight/obesity (≥ 24.0 kg/m2).
2) BMI quintiles:
Q1 (<16.2 kg/m2);
Q2 (16.2–17.9 kg/m2);
Q3 (18.0–19.8 kg/m2);
Q4 (19.9–22.1 kg/m2);
Q5 (≥ 22.2 kg/m2).Disability 16,022 1. BMI showed a linear relationship with disability risk.
2. Compared with normal weight, underweight significantly increased disability risk, whereas overweight/obesity significantly decreased risk.
3. Each 1.0 kg/m2 increase in BMI was associated with a 4.5% reduction in disability risk.
4. Lowest disability risk was observed at BMI ≥ 24.0 kg/m2 (by guideline cut-off points) or BMI ≥ 22.2 kg/m2 (by quintiles).Lv et al.[6].
(2022)Prospective cohort study Chinese
(age 92.7 ± 7.5 years)BMI categories:
Underweight (<18.5 kg/m2);
Normal (18.5–24.0 kg/m2);
Overweight (24.0–27.9 kg/m2);
Obese (≥28.0 kg/m2).All-cause / cardiovascular /
non-cardiovascular mortality27,026 1. BMI was inversely (reverse J-shaped) associated with mortality, with the lowest risk around overweight/mild obesity.
2. Compared to normal weight, overweight or obesity reduced non-CVD and all-cause mortality (but not CVD mortality).Jenny S W Lee et al.[18]. (2014) Prospective cohort study Hong Kong
(age 83.7 ± 8.4 years)BMI categories:
Underweight (<18.5 kg/m2);
Normal weight (18.5-22.9 kg/m2);
Overweight (23.0-25.0 kg/m2);
Obese (≥ 25.0 kg/m2).All-cause mortality 1,614 1. When modeled continuously, each 1-unit increase in BMI was associated with a 5%–10% lower mortality risk.
2. When modeled categorically, higher BMI groups had lower mortality risk compared with the underweight group.Nakazawa A et al.[19]. (2013) Prospective cohort study Japanese
(age 84.3 ± 8.1 years)BMI categories:
Q1: BMI < 17.3 kg/m2;
Q2: 17.3–19.2 kg/m2;
Q3: 19.3–21.1 kg/m2;
Q4: 21.2–23.5 kg/m2;
Q5: BMI ≥ 23.6 kg/m2.All-cause mortality 8,510 1. BMI was inversely associated with mortality risk.
2. Compared with Q5, Q1-Q3 (BMI ≤ 21.1 kg/m2) showed significantly higher all-cause mortality.Yutaka Takata
et al.[20]. (2007)Prospective cohort study Japanese
(age ≥ 80 years)BMI categories:
Underweight (<18.5 kg/m2);
Normal weight (18.5–24.9 kg/m2);
Overweight (≥ 25.0 kg/m2).All-cause / cardiovascular / cancer mortality 697 1. Overweight was associated with lower all-cause mortality compared with underweight and normal weight.
2. Compared with the underweight group, cardiovascular mortality was substantially lower in the overweight and normal weight groups.
3. Underweight participants had a 4.6-fold cardiovascular mortality risk compared with those in the normal weight group.
4. Cancer mortality was markedly lower in the overweight group than in the underweight group.Yutaka Takata
et al.[21].
(2013)Prospective cohort study Japanese
(age ≥ 80 years)BMI categories:
Most thin (<19.5 kg/m2);
Relatively thin (19.5–21.1 kg/m2);
Thin/normal (21.1–22.5 kg/m2);
Normal/overweight (22.5–23.8 kg/m2);
Relatively obese (23.8–26.0 kg/m2);
Most obese (> 26.0 kg/m2).All-cause / cardiovascular / respiratory mortality 675 1. Relative to the normal/overweight group, the most obese group was not associated with all-cause or cardiovascular mortality.
2. The most obese group showed the lowest risk of respiratory mortality.
3. The most thin group had the highest risk of all-cause or respiratory mortality.
4. The normal/overweight group tended to have lower all-cause or cardiovascular mortality than other BMI categories.Yamazaki K et al.[5]. (2017) Prospective cohort study Japanese
(age 73.92 ± 5.42 years)BMI categories:
Underweight (<18.5 kg/m2);
Normal weight (18.5–22.9 kg/m2);
Overweight (23.0–27.5 kg/m2);
Obesity (≥ 27.5 kg/m2).All-cause mortality 13,280 Compared with the normal weight group, the overweight/obesity group was associated with lower mortality risk. Kitamura K et al.[22]. (2010) Prospective cohort study Japanese
(age 83.6 ± 8.0 years)1) BMI quartiles:
Q1 (< 17.1 kg/m2);
Q2 (17.1–19.1 kg/m2);
Q3 (19.2–22.1 kg/m2);
Q4 (≥ 22.1 kg/m2).
2) BMI categories:
Group 1 (< 17.1 kg/m2)
Group 2 (≥ 17.1 kg/m2).All-cause mortality 205 1. Low BMI was a strong predictor of 2-year all-cause mortality among frail older adults.
2. Participants with BMIs < 17.1 kg/m2 had a fourfold higher risk of mortality than those with BMIs ≥ 17.1 kg/m2.Note. BMI, body mass index; Q1, 1st quartile; Q2, 2nd quartile; Q3, 3rd quartile; Q4, 4th quartile; Q5, 5th quintile. Table 1. (part 1 of 2). Summary of research evidence focusing on the body mass index of the oldest old population
Overall, the evidence synthesis suggests a generally inverse association between BMI and adverse health outcomes among older adults, with mortality and other adverse outcomes decreasing as the BMI increases. Based on this pattern, the lower boundary of the appropriate BMI range was set at 22.0 kg/m2 (Figure 1). However, the available literature does not provide sufficient direct evidence to define the upper BMI limit.
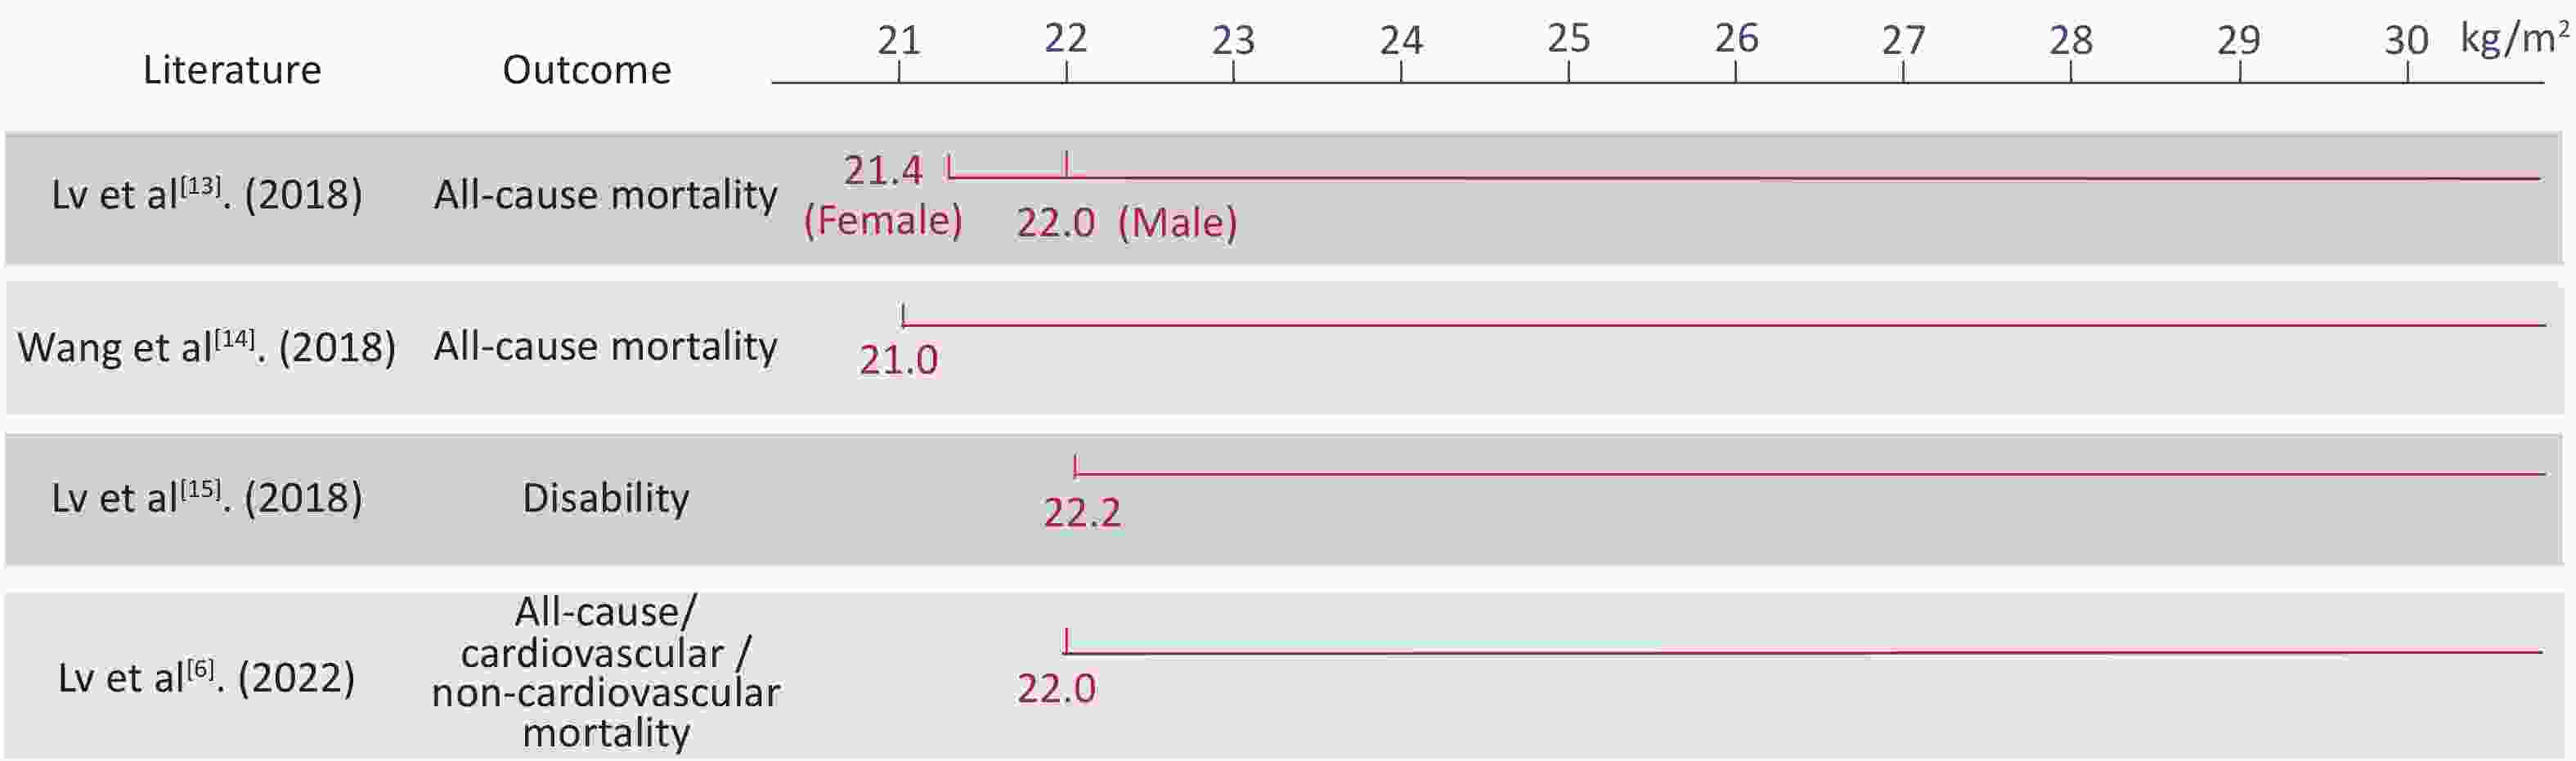
Figure 1. Basis for setting the lower limit of the recommended body mass index range
-
To determine the upper boundary of the recommended BMI range, population-based analyses were conducted using CLHLS data. BMI percentile distributions among older Chinese adults were examined to provide empirical support for defining an appropriate BMI range.
Using data from 9,481 older adults surveyed in 2018, BMI percentile distributions were estimated. The results indicated a gradual decline in BMI with increasing age among older adults. To improve representativeness, weighted BMI distributions were applied in the analysis to account for differences between the survey sample and underlying population structure.
Following the international methodological practices used by the WHO and the US CDC, which commonly select BMI cutoff points between the 85th and 95th percentiles, the 90th percentile (P90; 27.1 kg/m2) was adopted as the reference threshold (Table 2).
Quantile BMI (kg/m²) 95%CI, lower 95%CI, upper 1% 14.4 14.1 14.7 5% 16.4 16.2 16.6 10% 17.6 17.4 17.7 15% 18.3 18.2 18.4 20% 18.9 18.7 19.1 30% 20.0 19.9 20.1 40% 20.9 20.8 21.0 50% 21.9 21.8 22.0 60% 22.9 22.7 23.0 70% 23.9 23.8 24.1 80% 25.1 24.9 25.3 85% 26.0 25.8 26.2 90% 27.1 26.9 27.4 95% 28.9 28.6 29.1 99% 32.9 32.1 33.7 Note. BMI, body mass index; CI, confidence interval. Table 2. Weighted BMI distributions for the Chinese oldest old population
Taking into account the upper BMI limits recommended in the Guidelines for the Prevention and Control of Overweight and Obesity in Adults[8], as well as relevant WHO recommendations[13], the upper boundary of the appropriate BMI range for Chinese adults aged ≥ 80 years was ultimately set at 26.9 kg/m2.
-
Based on the evidence report and the predefined list of key issues, the drafting group developed the core content of the standard. Subsequently, expert consultation was conducted via email and online meetings. During this process, evidence from a systematic review, empirical analyses of the association between BMI and mortality risk, and weighted BMI distribution data from the older Chinese population were jointly considered.
Formulation of the recommended BMI range followed four guiding principles: scientific validity, practicality, acceptability, and scalability. In total, 123 comments were received from 29 experts, of which 115 were accepted, and 8 were not. No major unresolved disagreements were identified during the consultation process.
-
For individuals with a BMI within the recommended range and adequate dietary intake, the WS/T 868-2025 encourages a balanced and diverse diet with sufficient high-quality protein (including animal sources and soy products) and adequate fruit and vegetable intake in accordance with the Dietary guidelines for Chinese residents (2022)[23].
Food texture should be adapted to the individual’s chewing and swallowing abilities, and an appropriate energy density should be ensured. Oral and gastrointestinal health should be maintained through appropriate oral hygiene and timely management of chronic conditions.
Professional nutritional management and clinical nutritional therapy are recommended for individuals with chronic consumptive diseases or significant functional decline. In cases of swallowing difficulties, swallowing function should be assessed, and food viscosity or texture should be adjusted to reduce choking or aspiration risk. When necessary, fortified foods and nutritional supplements should be considered.
-
The WS/T 868-2025 recommends regular physical activity and reduced sedentary behavior. Functional status should be assessed before exercise planning in accordance with “The standard for healthy Chinese older adults (WS/T 802-2022)”[11] and the “Physical Activity Guidelines for Chinese (2021)”[24].
Exercise programs should emphasize safety, including familiar environments, appropriate warm-up, and fall prevention. Resistance training is encouraged to improve muscle strength, together with balance, flexibility, and coordination exercises.
Participation in cultural, recreational, and household activities within individual functional capacities is recommended. For individuals with impaired health status, activities should be undertaken with appropriate professional or caregiver support.
-
The WS/T 868-2025 provides a unified framework for BMI assessment and weight management among the oldest old population in China. The key features of the standard include (i) a population-specific recommended BMI range (22.0–26.9 kg/m2), (ii) standardized measurement procedures applicable to both ambulatory and non-ambulatory individuals, and (iii) practical monitoring and management recommendations that can be integrated into longitudinal care pathways.
The development materials for the standard suggest a triangulation of evidence in determining BMI cutoff points, integrating findings from systematic reviews, empirical analyses, and nationally representative BMI distribution data, together with expert consensus. An important implication for implementation is the emphasis on weight stability and the avoidance of unintended weight loss among individuals within or below the recommended BMI range, which reflects the balance of health risks in older populations.
This standard was developed primarily based on evidence derived from East Asian populations, particularly older Chinese adults, and its applicability should therefore be interpreted within this context. For populations outside of East Asia, BMI assessment and weight management should follow region- and population-specific standards. In addition, the standard does not incorporate evidence of body composition; therefore, assessments of body composition and related management strategies should refer to other relevant standards or professional recommendations.
Therefore, further research on health trajectories among older adults is required. In particular, long-term cohort studies examining the relationships between body composition, weight-change trajectories, and health outcomes, including mortality, functional status, and major chronic diseases, would strengthen the evidence base and inform future revisions to BMI-related standards in older populations. Notably, the evidence synthesis underpinning this standard incorporated studies from several East Asian populations in addition to Chinese cohorts. As a result, the recommended BMI range may have broader relevance across East Asian populations. With further validation, the framework proposed in this standard may provide a useful reference for ethnic Chinese and other Asian populations globally.
-
The WS/T 868-2025 defines an appropriate BMI range of 22.0–26.9 kg/m2 for adults aged ≥ 80 years in China and provides operational guidance for BMI measurement, monitoring, and individualized weight management. Its adoption in healthcare and integrated medical–eldercare settings may improve the consistency of BMI assessments and facilitate longitudinal, risk-informed weight management for the oldest old population.
HTML
Scope
Normative References
Terms and Definitions
Age Calculation and Recommended BMI Range
BMI Measurement
Weight Management
Evidence Synthesis
Determination of Upper BMI Cut-off Points
Expert Consultation and Consensus Development
Dietary and Nutritional Management
Physical activity management
Competing Interests The authors report no conflicts of interest in this work.
Authors' Contributions Xiaoyan Ma and Peiliang Chen contributed equally to this work. Xiaoyan Ma and Peiliang Chen drafted the manuscript, conducted the literature review, and performed data organization and analysis. Chen Chen, Xi Meng, Jinhui Zhou, and Shihao Lou participated in manuscript revision and literature organization. Jian Zhang, Yao He, Li Qi, and Wenhua Zhao provided constructive suggestions during the drafting of the standard and contributed to manuscript revision. Yuebin Lv, Chen Mao, and Xiaoming Shi supervised the overall study, guided the study design and manuscript preparation, revised the manuscript, and provided financial support. All authors reviewed and approved the final manuscript.
&These authors contributed equally to this work.

 Quick Links
 DownLoad: