





-
Mental health disorders, particularly anxiety and depression, have emerged as leading public health challenges worldwide owing to their high prevalence, disabling consequences, and association with an increased risk of dementia and suicide[1]. Accumulating evidence highlights that unhealthy dietary patterns, such as frequent consumption of sugary drinks, skipping breakfast, and excessive intake of processed foods, are linked to metabolic disturbances and adverse psychological outcomes. By contrast, regular physical activity promotes endorphin and dopamine release, alleviates emotional distress, and improves mood regulation[2]. Existing research in this area on Chinese populations has focused mainly on particular groups of people, such as adolescents[3] and older adults[4,5], and few studies have investigated the associations between dietary behavior, physical activity intensity, and anxiety or depressive symptoms in Chinese adults. Nonetheless, adults are better able to take charge of their own lives, exhibit more self-control, and are better suited to directly change their lifestyles, such as nutritional status and physical exercise level. A better understanding of the role of these lifestyle factors in the onset and progression of adult depressive symptoms is necessary, especially given their variable nature and their potential for use in the prevention and treatment of anxiety and depressive symptoms. Therefore, this study investigated the associations of dietary behaviors and physical activity intensity with anxiety and depressive symptoms among Chinese adults aged 18–60, using data from the PBICR program.
This cross-sectional study used data from the Psychology and Behavior Investigation of Chinese Residents (PBICR) Project conducted from to 2022–2023, using a multistage, stratified random sampling method. The survey covered 15 provinces, 148 cities, 202 districts and counties, 390 townships/towns/streets, and 780 communities/villages across China.. From a starting national sample of 21,916 individuals, the analysis was restricted to participants aged 18–60 years. Following the exclusion of cases with age out of range, logical errors, or implausible physical activity data, the final sample consisted of 14,358 adults.
Anxiety and depressive symptoms were assessed using two validated self-report instruments: the Generalized Anxiety Disorder Scale (GAD-7) and Patient Health Questionnaire-9 (PHQ-9). Anxiety and depressive symptoms were dichotomized at the clinically significant threshold of ≥ 10 for prevalence estimation and as the dependent variable in binary logistic regression models. Additionally, to examine dose-response relationships across the full spectrum of symptom severity, the ordinal categories (minimal/mild/moderate/severe) were used as the outcome in ordered logistic regression models. Detailed scoring criteria are provided in Supplementary Table S1. Unhealthy dietary behaviors were identified based on the Dietary Guidelines for Chinese Residents (2022), encompassing five domains: frequent consumption of sugary drinks, alcohol use, skipping breakfast, takeaway consumption, and dieting/fasting practices (Supplementary Table S2). Physical activity intensity was assessed using the International Physical Activity Questionnaire (IPAQ-7, short form) and categorized into low, moderate, and high levels according to MET minutes per week.
Descriptive statistics are presented as means and standard deviations for continuous variables and as frequencies and percentages for categorical variables. Chi-squared tests were used in order to compare anxiety and depressive symptoms across lifestyle categories. Ordered logistic regression models were employed to estimate the adjusted odds ratios (aORs) and 95% confidence intervals (CIs) for the associations between dietary behaviors, physical activity intensity, and mental health outcomes. After adjusting for variables such as age, gender, marital status, urban and rural status, education status, career status, residential status, insurance status and per capita monthly household income, two models were constructed:Model I: Included the total number of unhealthy dietary behaviors and physical activity intensity.Model II: Further incorporated specific types of unhealthy dietary behaviors and physical activity intensity. Restricted cubic spline analyses were applied in order to examine potential dose-response relationships between the number of unhealthy dietary behaviors and the prevalence of anxiety and depressive symptoms. All analyses were two-sided, with a significance level of P < 0.05. Statistical analyses were conducted using SAS 9.4 (SAS Institute Inc., Cary, NC, USA) and R 4.2.2 (drc package).
Among the 14,358 adults included, anxiety was self-reported by 1,879 participants (13.09%) and depressive symptoms were self-reported by 3,084 participants (21.48%). There were significant differences seen among the different groups in terms of age, sex, education status, region, career status, monthly household income per capita, marital status, living alone, and health insurance (P < 0.05)(Supplementary Table S3–S4). We also examined the distribution of unhealthy dietary behaviors and physical activity intensity in patients with anxiety and depression. A total of 15.93%, 12.52%, and 13.08% of participants with low, moderate, and high physical activity levels, respectively, suffered from anxiety. A total of 19.41%, 15.14%, 23.31%, 16.94%, and 23.86% of people with preference for sugary beverages, being drunk, skipping breakfast, takeaways, and on a diet, suffer from anxiety. Individuals who engaged in low, moderate, and high levels of physical activity experienced depressive symptoms at a rate of 24.55%, 21.21%, and 21.04%, respectively. And individuals who preferred for sugary beverages, being drunk, skipping breakfast, takeaways, and on a diet exhibited depressive symptom rates of 30.47%, 25.17%, 34.77%, 26.49%, and 35.71%, respectively (Table 1).
Anxiety Depressive Overall Mild
(%)Moderate
(%)Severe
(%)P value Overall Mild
(%)Moderate
(%)Severe
(%)P value Poor dietary behaviors Preference for sugary beverages 19.41 36.34 14.82 4.59 < 0.0001 30.47 37.92 17.83 12.64 < 0.0001 Being drunk 15.14 36.59 11.74 3.39 < 0.0001 25.17 37.74 15.52 9.65 < 0.0001 Skipping breakfast 23.31 34.94 17.79 5.51 < 0.0001 34.77 34.68 12.43 15.81 < 0.0001 Preference for takeaway 16.94 36.74 11.82 5.13 < 0.0001 26.49 38.73 15.30 11.19 < 0.0001 On a diet 23.86 32.58 9.45 2.51 < 0.0001 35.71 35.78 12.97 7.02 < 0.0001 Physical activity level 0.005 < 0.0001 Low 15.93 31.86 11.45 4.48 24.55 33.72 13.72 10.83 Mid 12.52 33.72 9.85 2.67 21.21 37.31 13.41 7.8 High 13.08 33.25 10.11 2.97 21.04 35.49 13.52 7.52 Table 1. Distribution of poor dietary behaviors and physical activity intensity in patients with anxiety and depressive
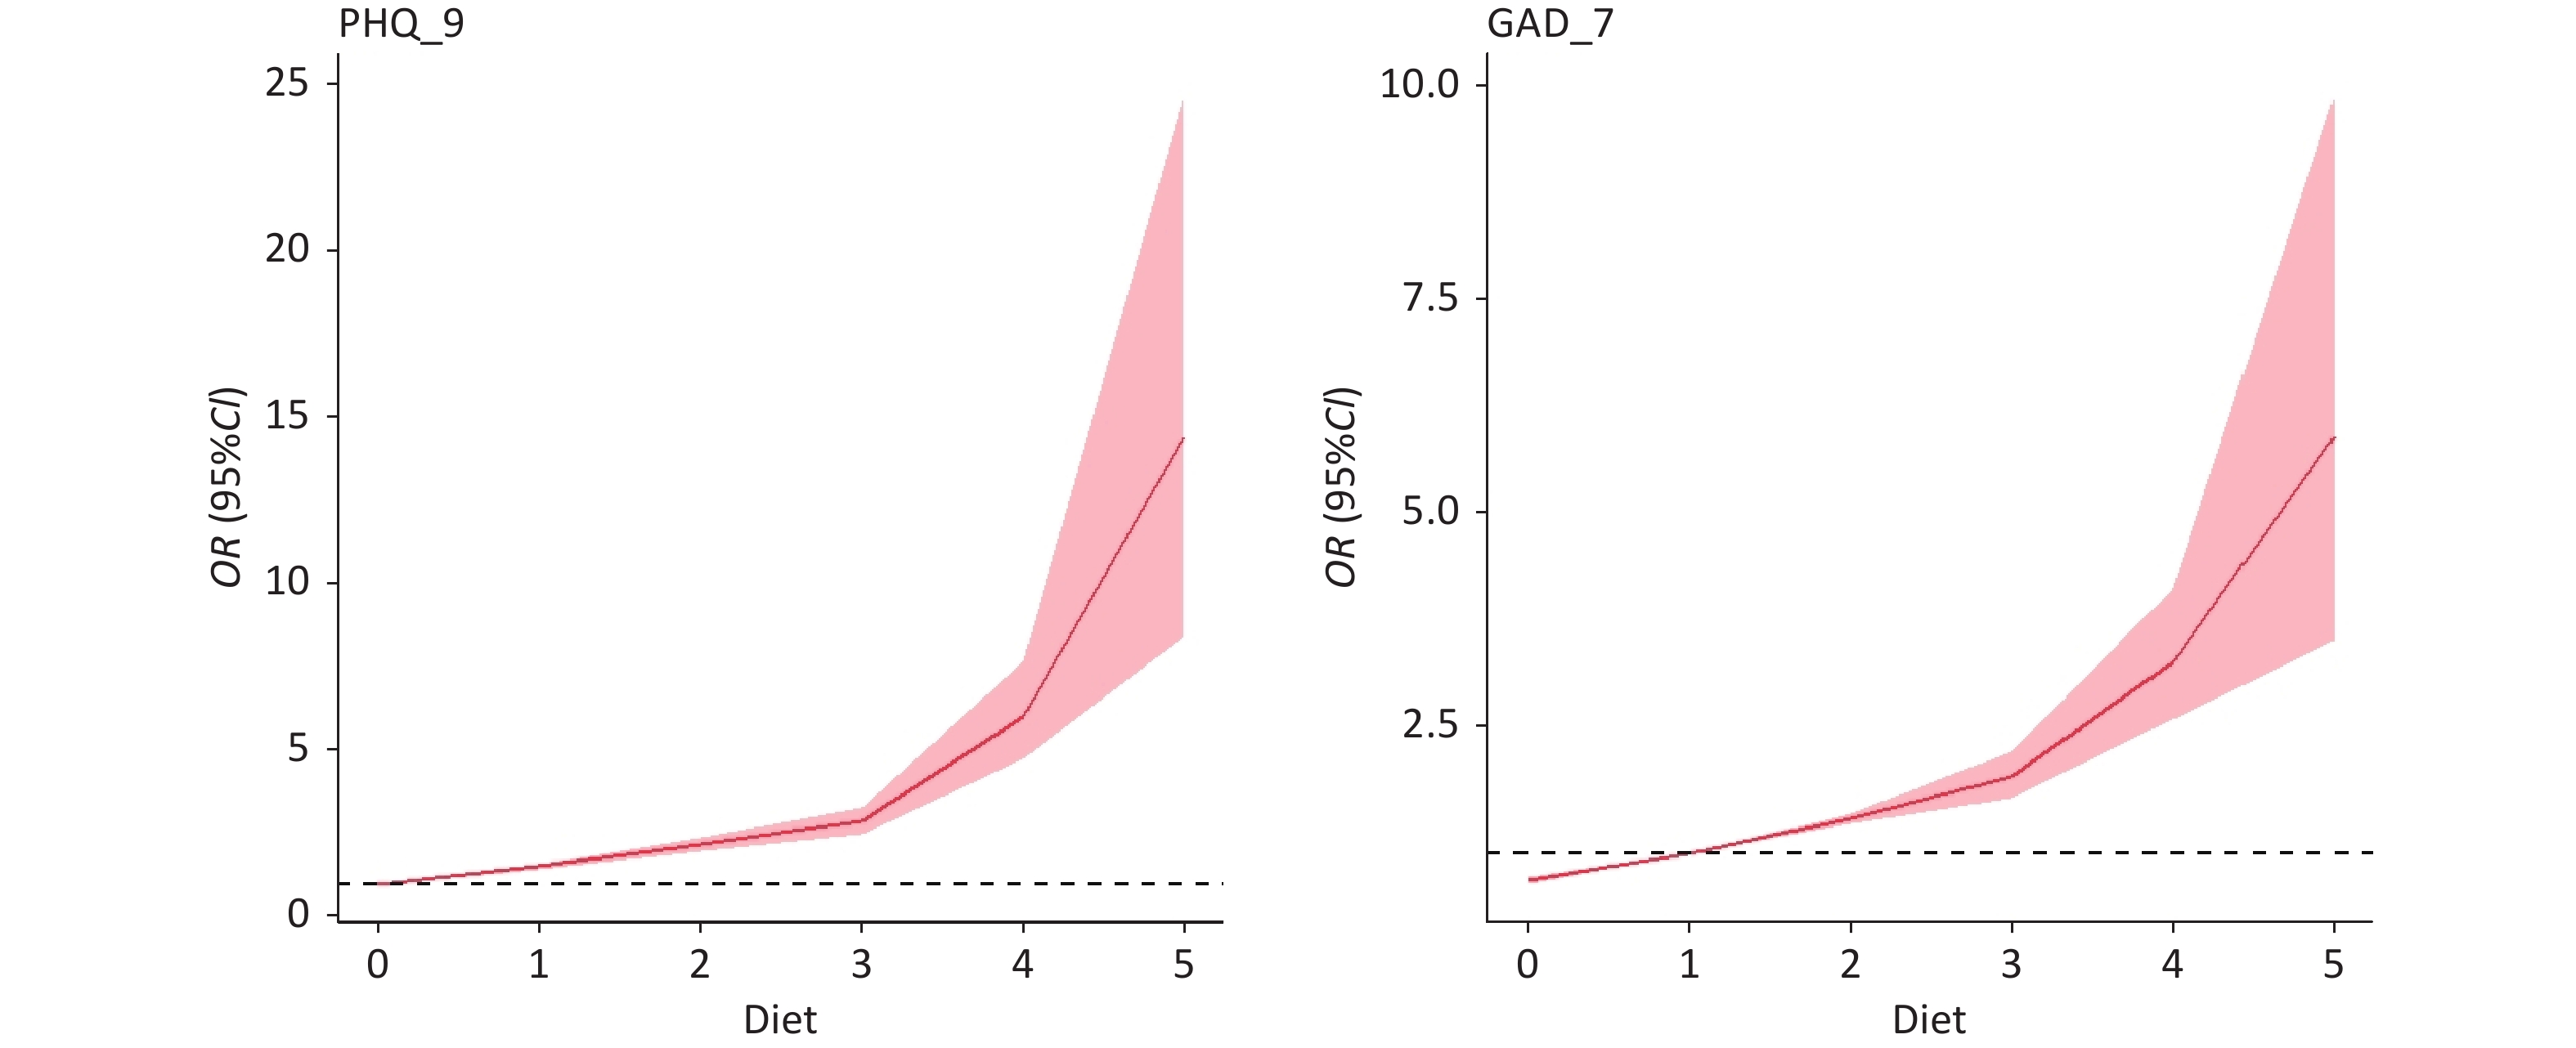
Model I showed that, compared with those reporting no unhealthy dietary behaviors, people with less unhealthy dietary behaviors had lower odds of developing anxiety and depressive symptoms. Model II showed that the types of unhealthy eating behaviors and levels of physical activity were positively correlated with anxiety and depression severity (Table 2). Restricted cubic spline analysis revealed a monotonic dose-response relationship was observed between the number of unhealthy dietary behaviors and both outcomes (Figure 1). Subgroup analyses stratified according to sex and age confirmed the robustness of these associations (Table 3).
Anxiety Depressive Model I Model Ⅱ Model I Model Ⅱ No. of poor dietary behavior 0 1.00 1.00 1 1.47 (1.36–1.58) 1.53 (1.42–1.64) 2 2.03 (1.85–2.24) 2.14 (1.95–2.35) 3 2.75 (2.38–3.18) 2.84 (2.46–3.27) 4 4.59 (3.42–6.17) 5.59 (4.19–7.47) 5 8.37 (3.59–19.55) 16.46 (6.64–43.09) Poor dietary behaviors Preference for sugary beverages 1.40 (1.29–1.52) 1.52 (1.40–1.64) Being drunk 1.32 (1.22–1.43) 1.34 (1.24–1.44) Skipping breakfast 1.65 (1.51–1.80) 1.73 (1.59–1.89) Preference for takeaway 1.15 (1.06–1.26) 1.13 (1.04–1.22) On diet 1.97 (1.77–2.19) 2.02 (1.82–2.25) Physical activity level Mid 1.00 1.00 1.00 1.00 Low 1.06 (0.95–1.19) 1.07 (0.95–1.19) 1.02 (0.92–1.13) 1.02 (0.92–1.14) High 1.04 (0.97–1.11) 1.04 (0.98–1.12) 0.97 (0.90–1.03) 0.97 (0.91–1.04) Note. Adjusted variables: age, gender, marital status, urban and rural status, education, career status, residential status, insurance status, and per capita monthly household income; Model I: effect of the number of poor eating behaviors versus physical activity on anxiety and depression; Model II: effect of poor eating behaviors versus physical activity on anxiety and depression. Table 2. Results of the ordered logistic regression of poor dietary behaviors and physical activity intensity with anxiety and depressive
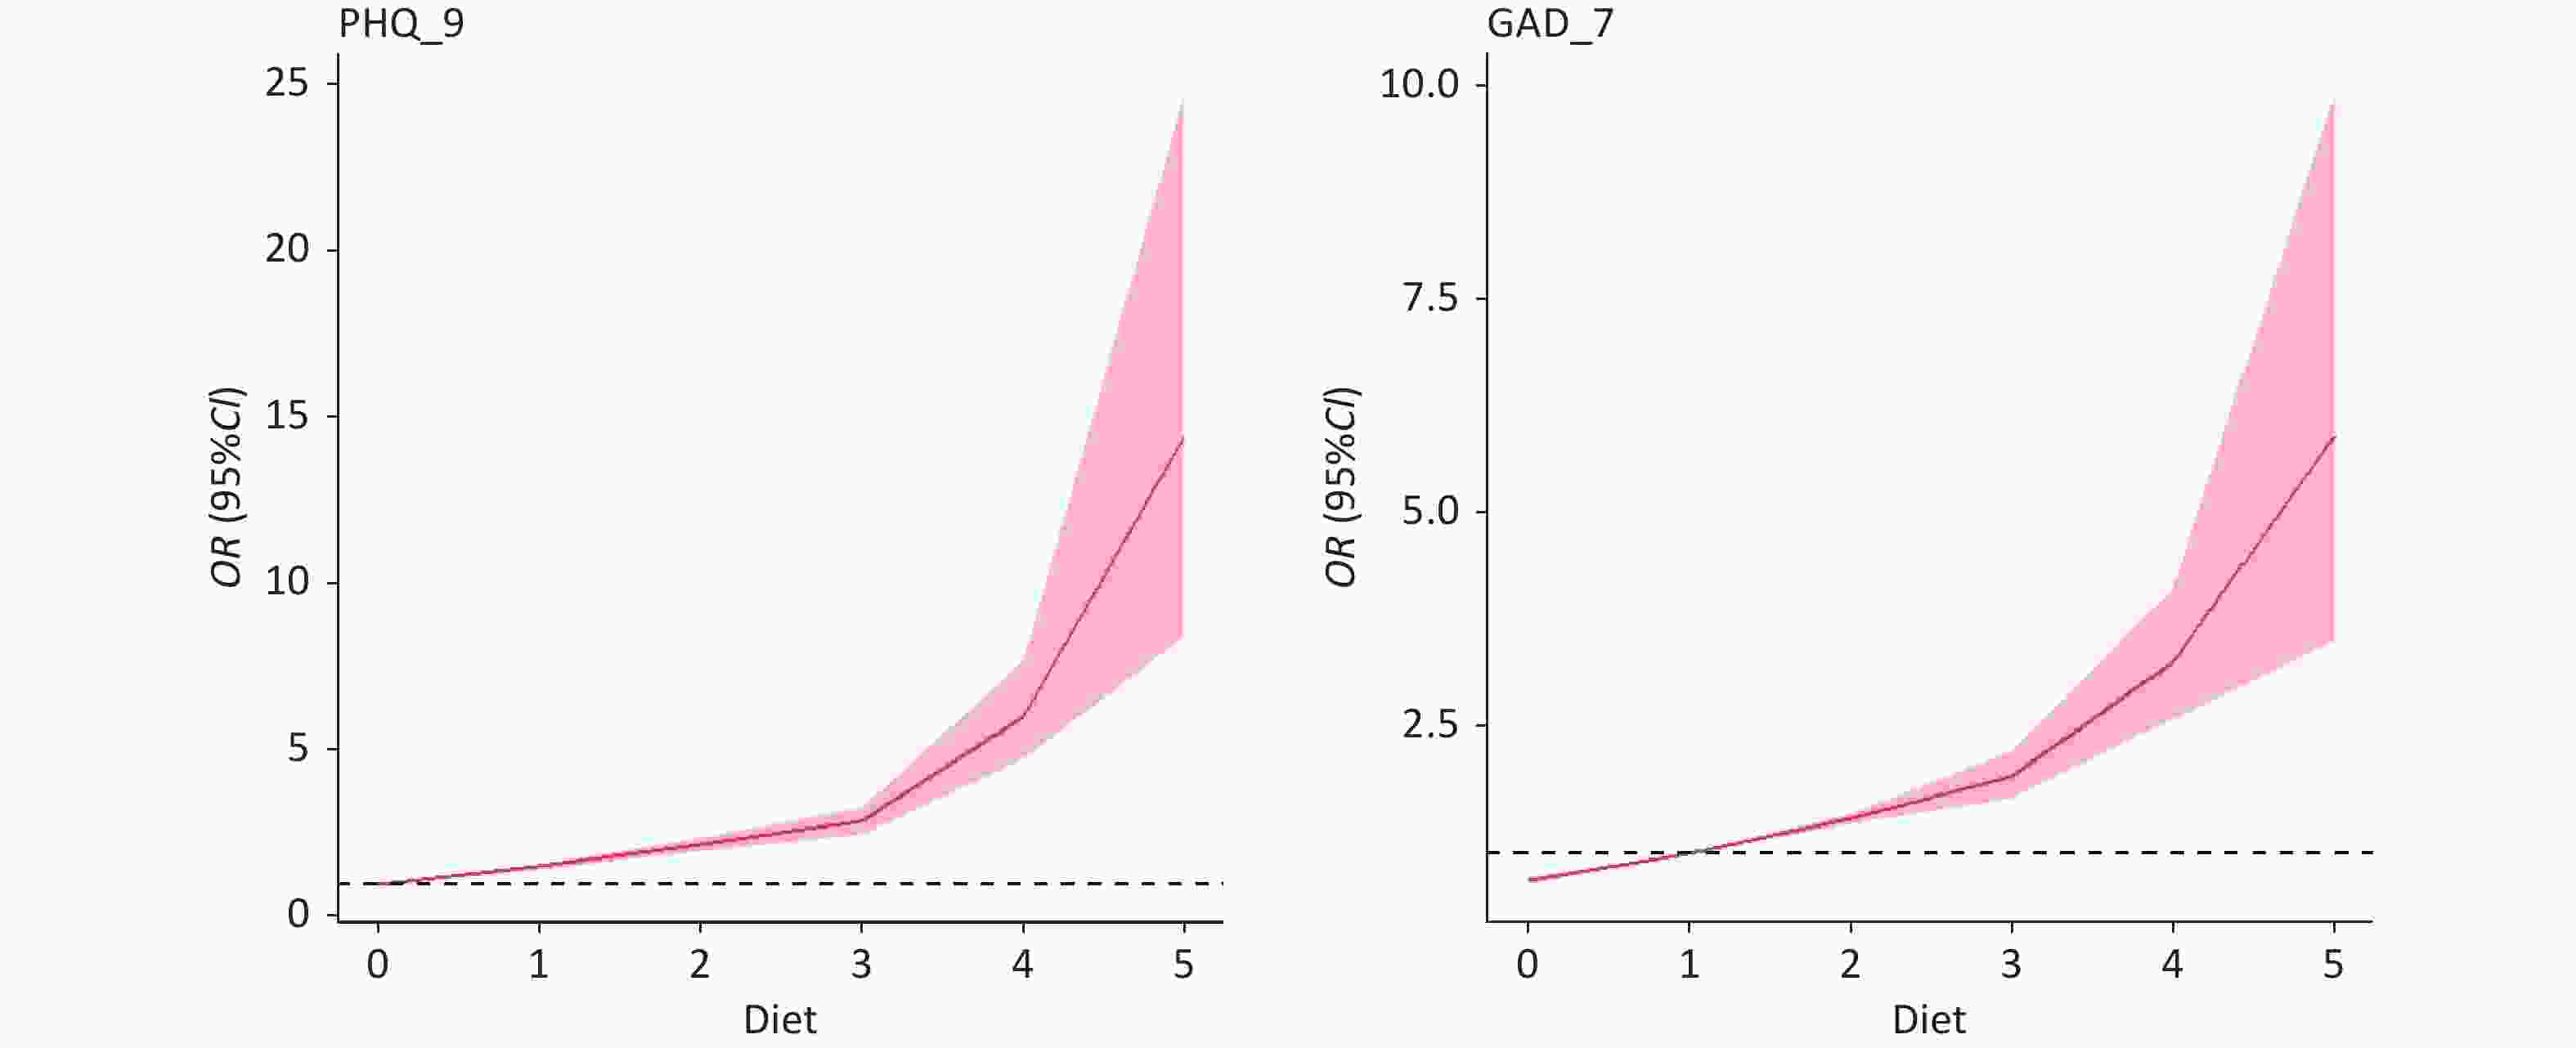
Figure 1. Dose-response relationship between the number of unhealthy dietary behaviors and the prevalence of anxiety and depressive.
Dependent variables Independent variables No. of unhealthy dietary behavior Physical activity level 0 1 2 3 4 5 Mid L
owHigh Anxiety Age
(years)18–34 1.00 1.49
(1.34–1.66)2.01
(1.78–2.28)2.61
(2.21–3.10)4.44
(3.21–6.15)11.64
(4.68–29.16)1.00 1.05
(0.90–1.21)0.99
(0.90–1.08)35–44 1.00 1.48
(1.25–1.76)2.47
(1.97–3.09)2.94
(1.99–4.34)4.24
(1.92–9.36)2.02
(0.23–15.14)1.00 1.09
(0.84–1.41)1.16
(0.99–1.35)45–60 1.00 1.46
(1.27–1.67)1.82
(1.46–2.26)3.91
(2.50–6.12)9.29
(1.72–51.26)– 1.00 1.09
(0.86–1.37)1.07
(0.94–1.22)Gender Males 1.00 1.46
(1.30–1.63)2.07
(1.81–2.36)2.86
(2.36–3.46)4.32
(2.93–6.37)7.28
(2.68–19.94)1.00 1.06
(0.89–1.26)1.10
(1.00–1.22)Females 1.00 1.51
(1.36–1.68)2.01
(1.75–2.32)2.57
(2.05–3.22)4.97
(3.14–7.85)10.99
(2.22–55.90)1.00 1.06
(0.92–1.23)0.97
(0.88–1.07)Depressive Age
(years)18–34 1.00 1.57
(1.42–1.74)2.16
(1.91–2.43)2.89
(2.45–3.41)5.82
(4.22–8.03)20.72
(7.63–61.99)1.00 1.01
(0.88–1.17)0.92
(0.84–1.00)35–44 1.00 1.48
(1.25–1.74)2.38
(1.92–2.96)2.35
(1.61–3.43)4.19
(1.99–8.80)6.55
(0.60–68.27)1.00 1.00
(0.78–1.28)1.16
(1.00–1.34)45–60 1.00 1.51
(1.32–1.72)1.94
(1.57–2.39)3.62
(2.30–5.68)10.71
(1.89–63.75)– 1.00 1.06
(0.85–1.32)0.95
(0.84–1.07)Gender Males 1.00 1.53
(1.38–1.70)2.23
(1.96–2.53)2.86
(2.37–3.45)5.35
(3.68–7.79)18.72
(6.23–62.84)1.00 1.03
(0.87–1.22)0.99
(0.91–1.09)Females 1.00 1.56
(1.41–1.72)2.06
(1.79–2.36)2.81
(2.25–3.50)5.81
(3.71–9.15)11.42
(2.31–62.81)1.00 1.02
(0.88–1.17)0.93
(0.85–1.02)Table 3. Associations of unhealthy dietary behavior and physical activity level with depressive and anxiety symptoms according to age and gender
The prevalence of self-reported depressive symptoms (21.48%) and anxiety prevalence (13.09%) in our study is consistent with recent large-scale surveys among Chinese adults, which have reported rates ranging from 16.3% to 24.9% using comparable screening instruments[6]. These concordances support the representativeness of our sample despite its cross-sectional design.
Diet has a significant effect on mental health. According to the current study, eating poorly increases anxiety and depressive symptoms. There is a noticeable detrimental effect on people's experiences of anxiety and depressive symptoms when the number of unhealthy eating habits reaches three or more. Furthermore, individuals who preferred for sugary beverages (OR = 1.40, 95% CI 1.29–1.52) and being drunk(OR = 1.32, 95% CI 1.22–1.43) had an impact on anxiety and depressive symptoms in relation to the type of diet. Similar to our results, Oliván et al. demonstrated that consuming multiple carbonated or sugar-filled beverages daily is indicative of increased depressive symptoms[7]. Daily intake of carbonated or soft drinks, including sugar, has been linked to an increased level of anxiety, according to a randomized controlled experiment. Additionally, daily consumption of carbonated or soft drinks containing sugar and non-nutritive sweeteners has been linked to increased depressive symptoms[8]. Claims regarding alcohol consumption have been controversial; however, a 2018 study published in The Lancet showed that the safest amount of alcohol to consume is 0 mL, with no drops recommended[9]. Although drinking alcohol and sugary drinks can stimulate hormone secretion in the body and produce excitement to a certain extent, as a dietary behavior, prolonged intake will still have an impact on mental health, and dependence on addiction will, in contrast, cause psychological stress. Furthermore, consuming excessive alcohol and sweet drinks can harm one's organs and increase the risk of heart disease, stroke, and other conditions that can worsen anxiety and depressive symptoms[10].
The results of this study revealed that poor dietary behavior was a risk factor for anxiety and depressive symptoms. A cross-sectional study demonstrated that people who rarely ate breakfast were most likely to have a profile of psychological issues (OR = 3.59; 95% CI: 2.52–5.11)[11]. Zhang et al. reported that the odds ratios and 95% confidence intervals for depressive symptoms were 1.35 (1.08–1.68) and 1.40 (1.07–1.83) when breakfast consumers were compared to occasional consumers and skippers, respectively[12]. Yun et al. reported a correlation between depressive symptoms and the frequency of eating breakfast and ate out[13]. Zhang et al. assessed 3337 commuters in total and discovered a strong correlation between eating out frequently and a greater risk of mental symptoms, particularly when dining out for lunch and supper. Individuals who ate at home were least likely to experience mental symptoms, followed by those who ate in the canteen at work[14].
In contrast to the robust dietary effects, our study found no significant association between PA level and anxiety or depressive symptoms after adjustment for covariates. This null finding appears to differ from the prevailing consensus that regular PA protects against depression and anxiety. Numerous systematic reviews and meta-analyses have shown that regular physical activity protects against depression and anxiety. For instance, early cross-sectional studies demonstrated that individuals with moderate-to-high levels of physical activity exhibited substantially lower anxiety and depression symptom scores than their sedentary counterparts[15]. Subsequently, Baumeister et al. provided further evidence linking domain-specific physical activity (both exercise and leisure time) with reduced rates of anxiety and depressive symptoms[16]. "Notably, a prospective cohort study of adults identified a linear inverse relationship between 4–7 hours/week of moderate-to-vigorous physical activity and incident depression, whereas > 7 hours/week conferred no additional benefit, suggesting a ceiling effect or optimal dose range rather than unlimited protection[17]. Guo et al. also showed a nonlinear dose-response relationship between leisure-time physical activity (LTPA) and depression risk; low and moderate doses were protective against incident depression, whereas high doses were associated with increased risk[18].
Several explanations may account for the null findings in our study. First, dietary behaviors and physical activity are often correlated lifestyle factors; individuals with healthier diets may also engage in more physical activity. When both are included in the same model, the variance in mental health outcomes explained by these correlated behaviors may be predominantly captured by the dietary risk score, which showed a stronger and more graded association with anxiety and depression than PA level. This statistical collinearity may have reduced the independent contribution of PA to the model. Second, the cross-sectional design precludes determination of temporal sequence; any protective effect of regular PA may require longer exposure durations than captured by a single-point measurement to manifest detectable mental health benefits.
This study has several limitations, including its cross-sectional design, self-reported data, and semi-quantitative dietary assessment. Despite these limitations, our findings highlight the strong dose-response relationship between cumulative unhealthy dietary behaviors and mental health symptoms, underscoring the potential importance of dietary interventions. The null findings for physical activity warrant further longitudinal research to confirm causality and explore potential effect modifiers such as PA type, intensity, and context.
HTML
Competing Interests The authors declare that they have no known competing financial interests or personal relationships that could have appeared to influence the work reported in this paper.
Authors’ Contributions Data curation, Formal analysis, Visualization: Jia Fu; Writing – original draft: Shige Qi; Conceptualization, Writing – review & editing: Xiaobing Liu; Writing – review & editing: Yanli Xue, Yu Zhang and Haoyan Guo. These authors contributed equally to this work.
&These authors contributed equally to this work.
Reference

 Quick Links
 DownLoad: