
-
Gliomas are the most common primary brain tumors in adults[1,2]. They are highly aggressive, with a poor prognosis. Under the standard treatment regimen of surgery, radiotherapy, and temozolomide, the median overall survival is only 14–15 months, and the 2-year survival rate is approximately 20%[3]. The immunosuppressive microenvironment of gliomas is characterized by abundant regulatory T cells and inhibitory factors such as tumor growth factor beta (TGF-β), resulting in an objective response rate below 5% for monotherapy with programmed cell death-1/programmed death-ligand 1 checkpoint inhibitors and no significant improvement in overall survival[4].
Transporter associated with antigen processing 1 (TAP1) is an adenosine triphosphate-binding cassette transporter that translocates peptides into the endoplasmic reticulum for major histocompatibility complex (MHC) class I antigen presentation[5,6]. TAP1 dysregulation has been linked to prognosis and immune escape in multiple solid tumors[7,8], and is closely associated with immune-related pathways, immune infiltration, and immune checkpoint expression[9]. However, the immunological and clinical significance of TAP1 in gliomas remain unclear. This study aims to define a novel glioma subtype characterized by high TAP1 expression, which exhibits a unique “functionally suppressed immune activation” phenotype.
Transcriptomic data for 34 cancer types and glioblastoma multiforme and lower-grade gliomas (GBMLGG) were obtained from The Cancer Genome Atlas (TCGA) and Gene Expression Omnibus (GEO) databases. Wilcoxon tests were used to assess differences in TAP1 expression between tumor and normal tissues. Immune infiltration was estimated using the single-sample gene set enrichment analysis (ssGSEA) algorithm, and correlations were analyzed using Spearman’s rank correlation method.
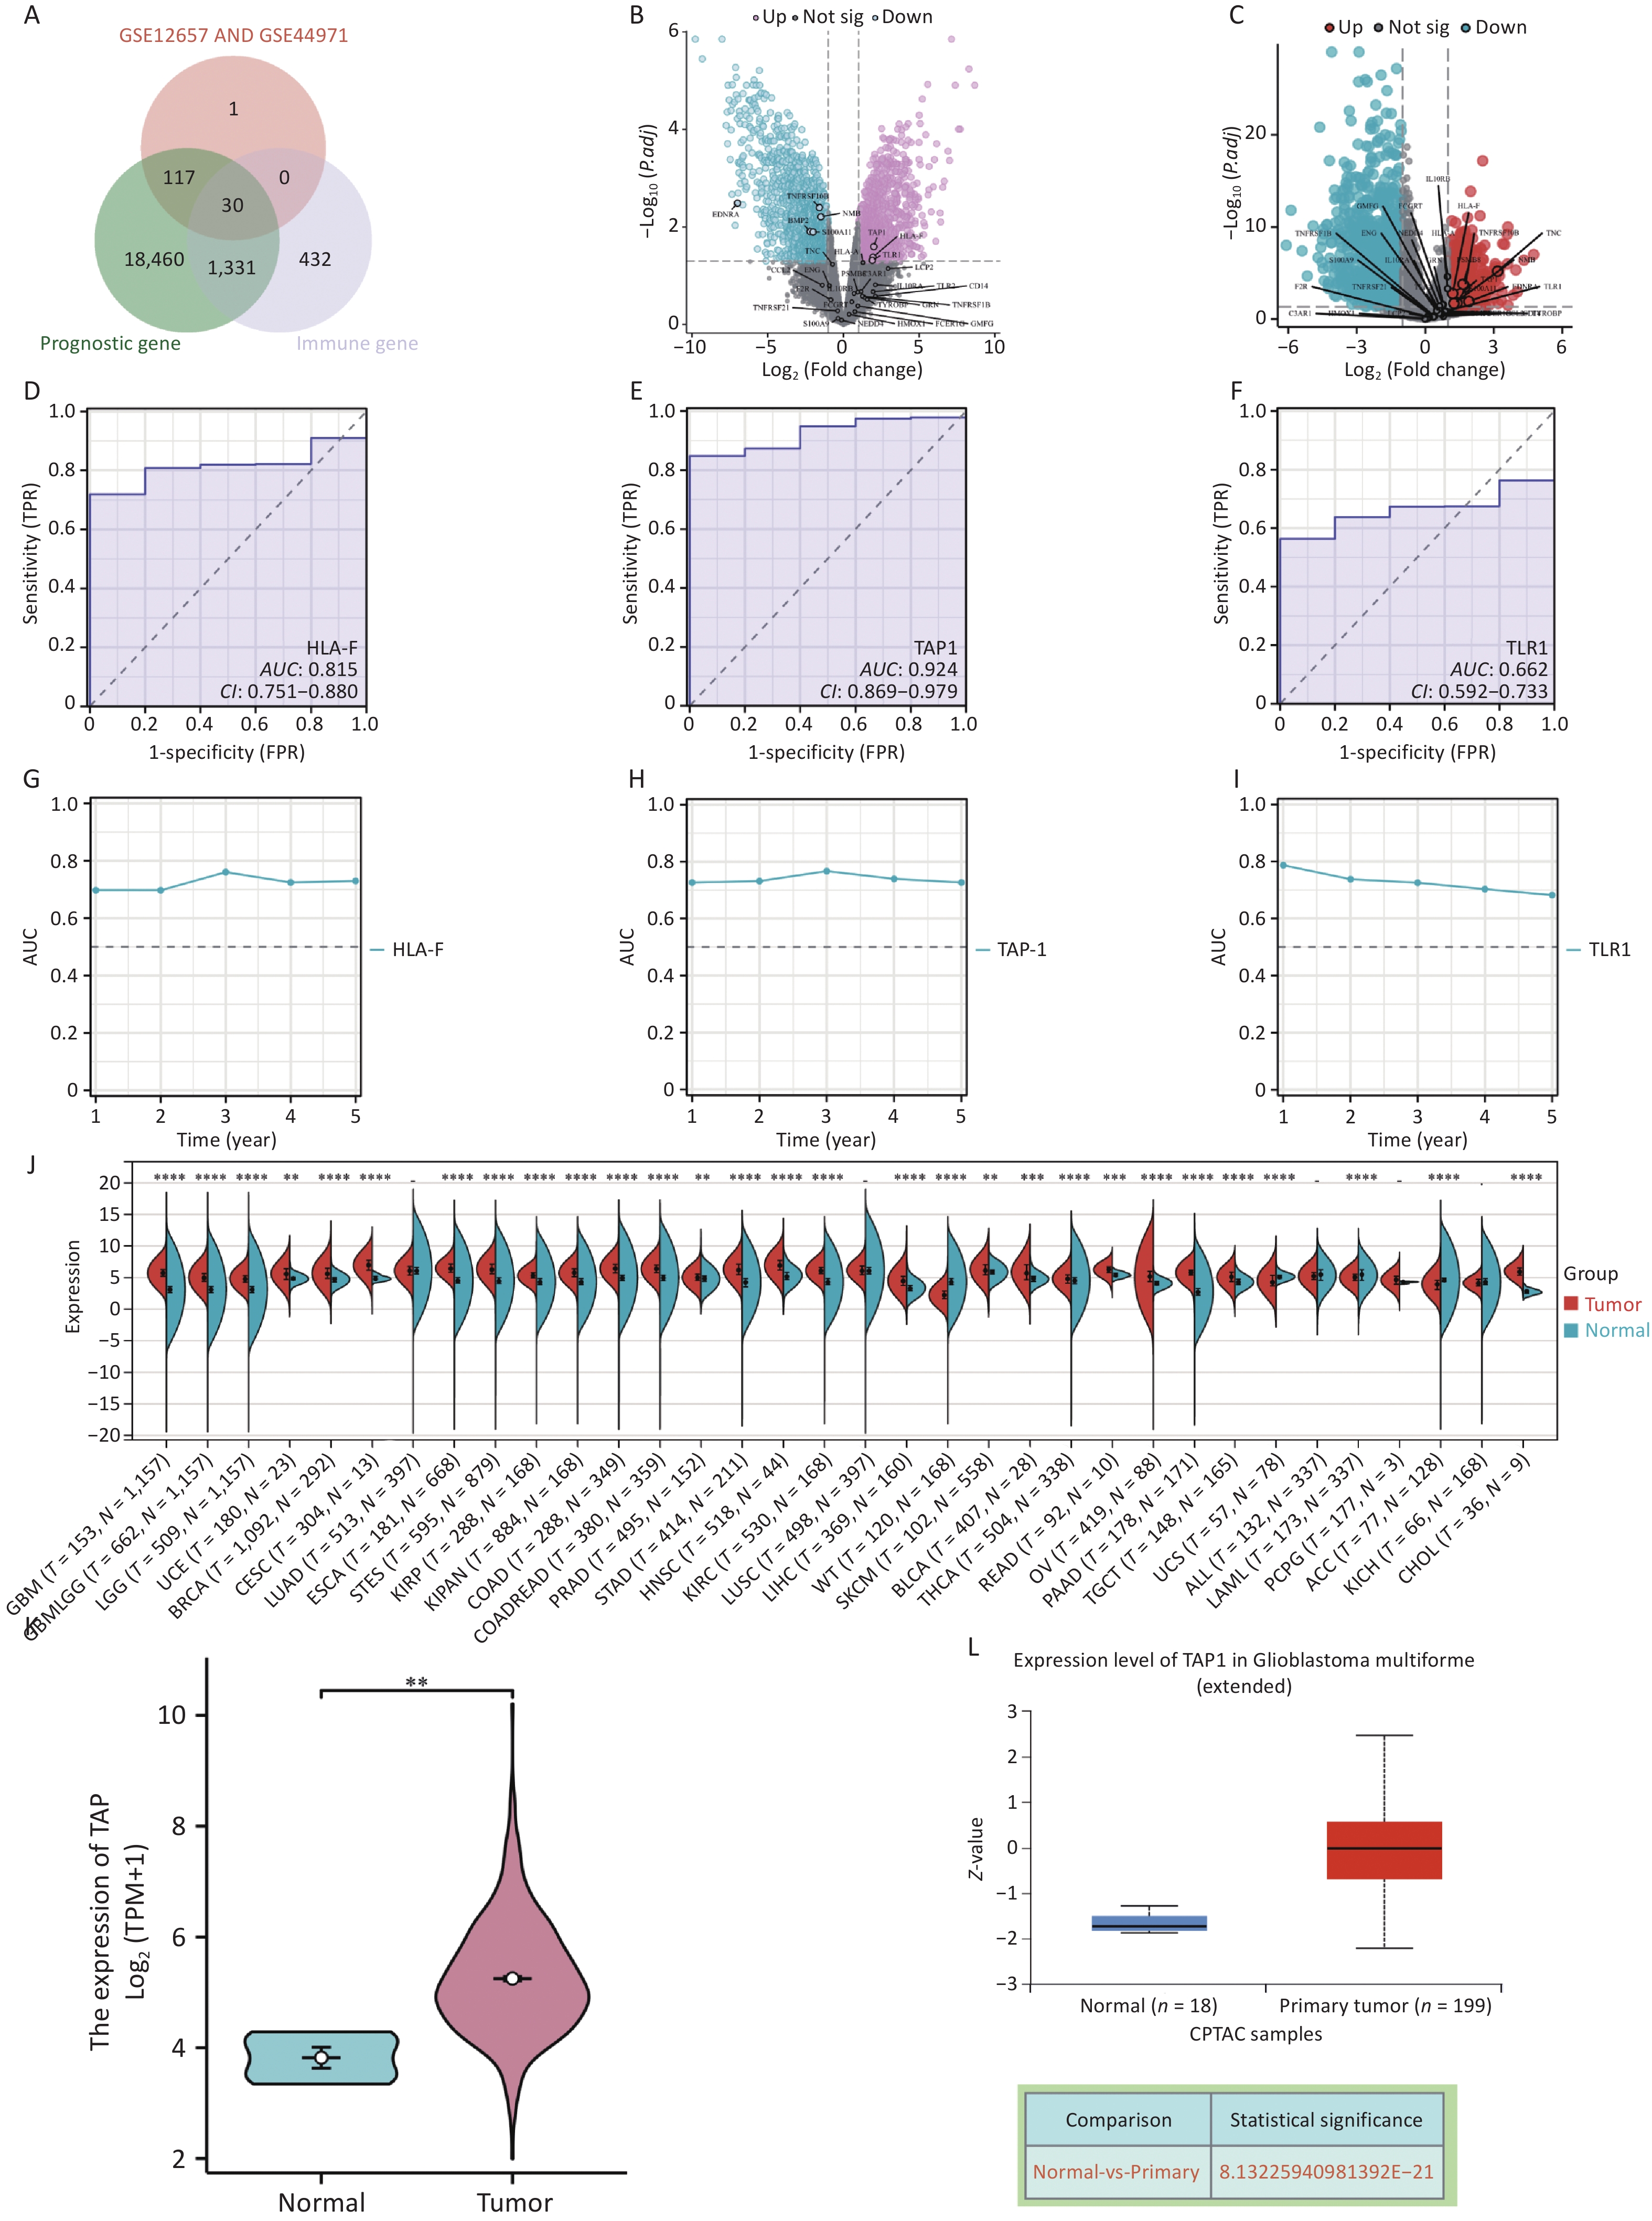
This study utilized the GEO datasets GSE12657 and GSE44971 to identify 148 genes upregulated in glioblastoma tumor tissues, which were then intersected with prognosis- and immune-related genes, resulting in 30 candidate genes (Figure 1A). To validate the upregulation of these 30 genes, we confirmed that TAP1, HLA-F, and TLR1 were potential key genes in the independent GEO datasets GSE34152 and GSE7696 (Figure 1B, C). Subsequently, we performed receiver operating characteristic (ROC) diagnostic and time-dependent ROC analyses of TAP1, HLA-F, and TLR1 in gliomas. TAP1 exhibited excellent discriminative ability in the diagnostic model (area under the curve [AUC] = 0.924, 95% confidence interval [CI]: 0.869–0.979) (Figure 1D–F). Furthermore, time-dependent ROC analysis demonstrated that TAP1 maintained AUC values between 0.7 and 0.8 over the 5-year period, indicating a consistently robust diagnostic performance (Figure 1G–I). Based on these results, we selected TAP1 as a candidate biomarker for further investigation of gliomas.
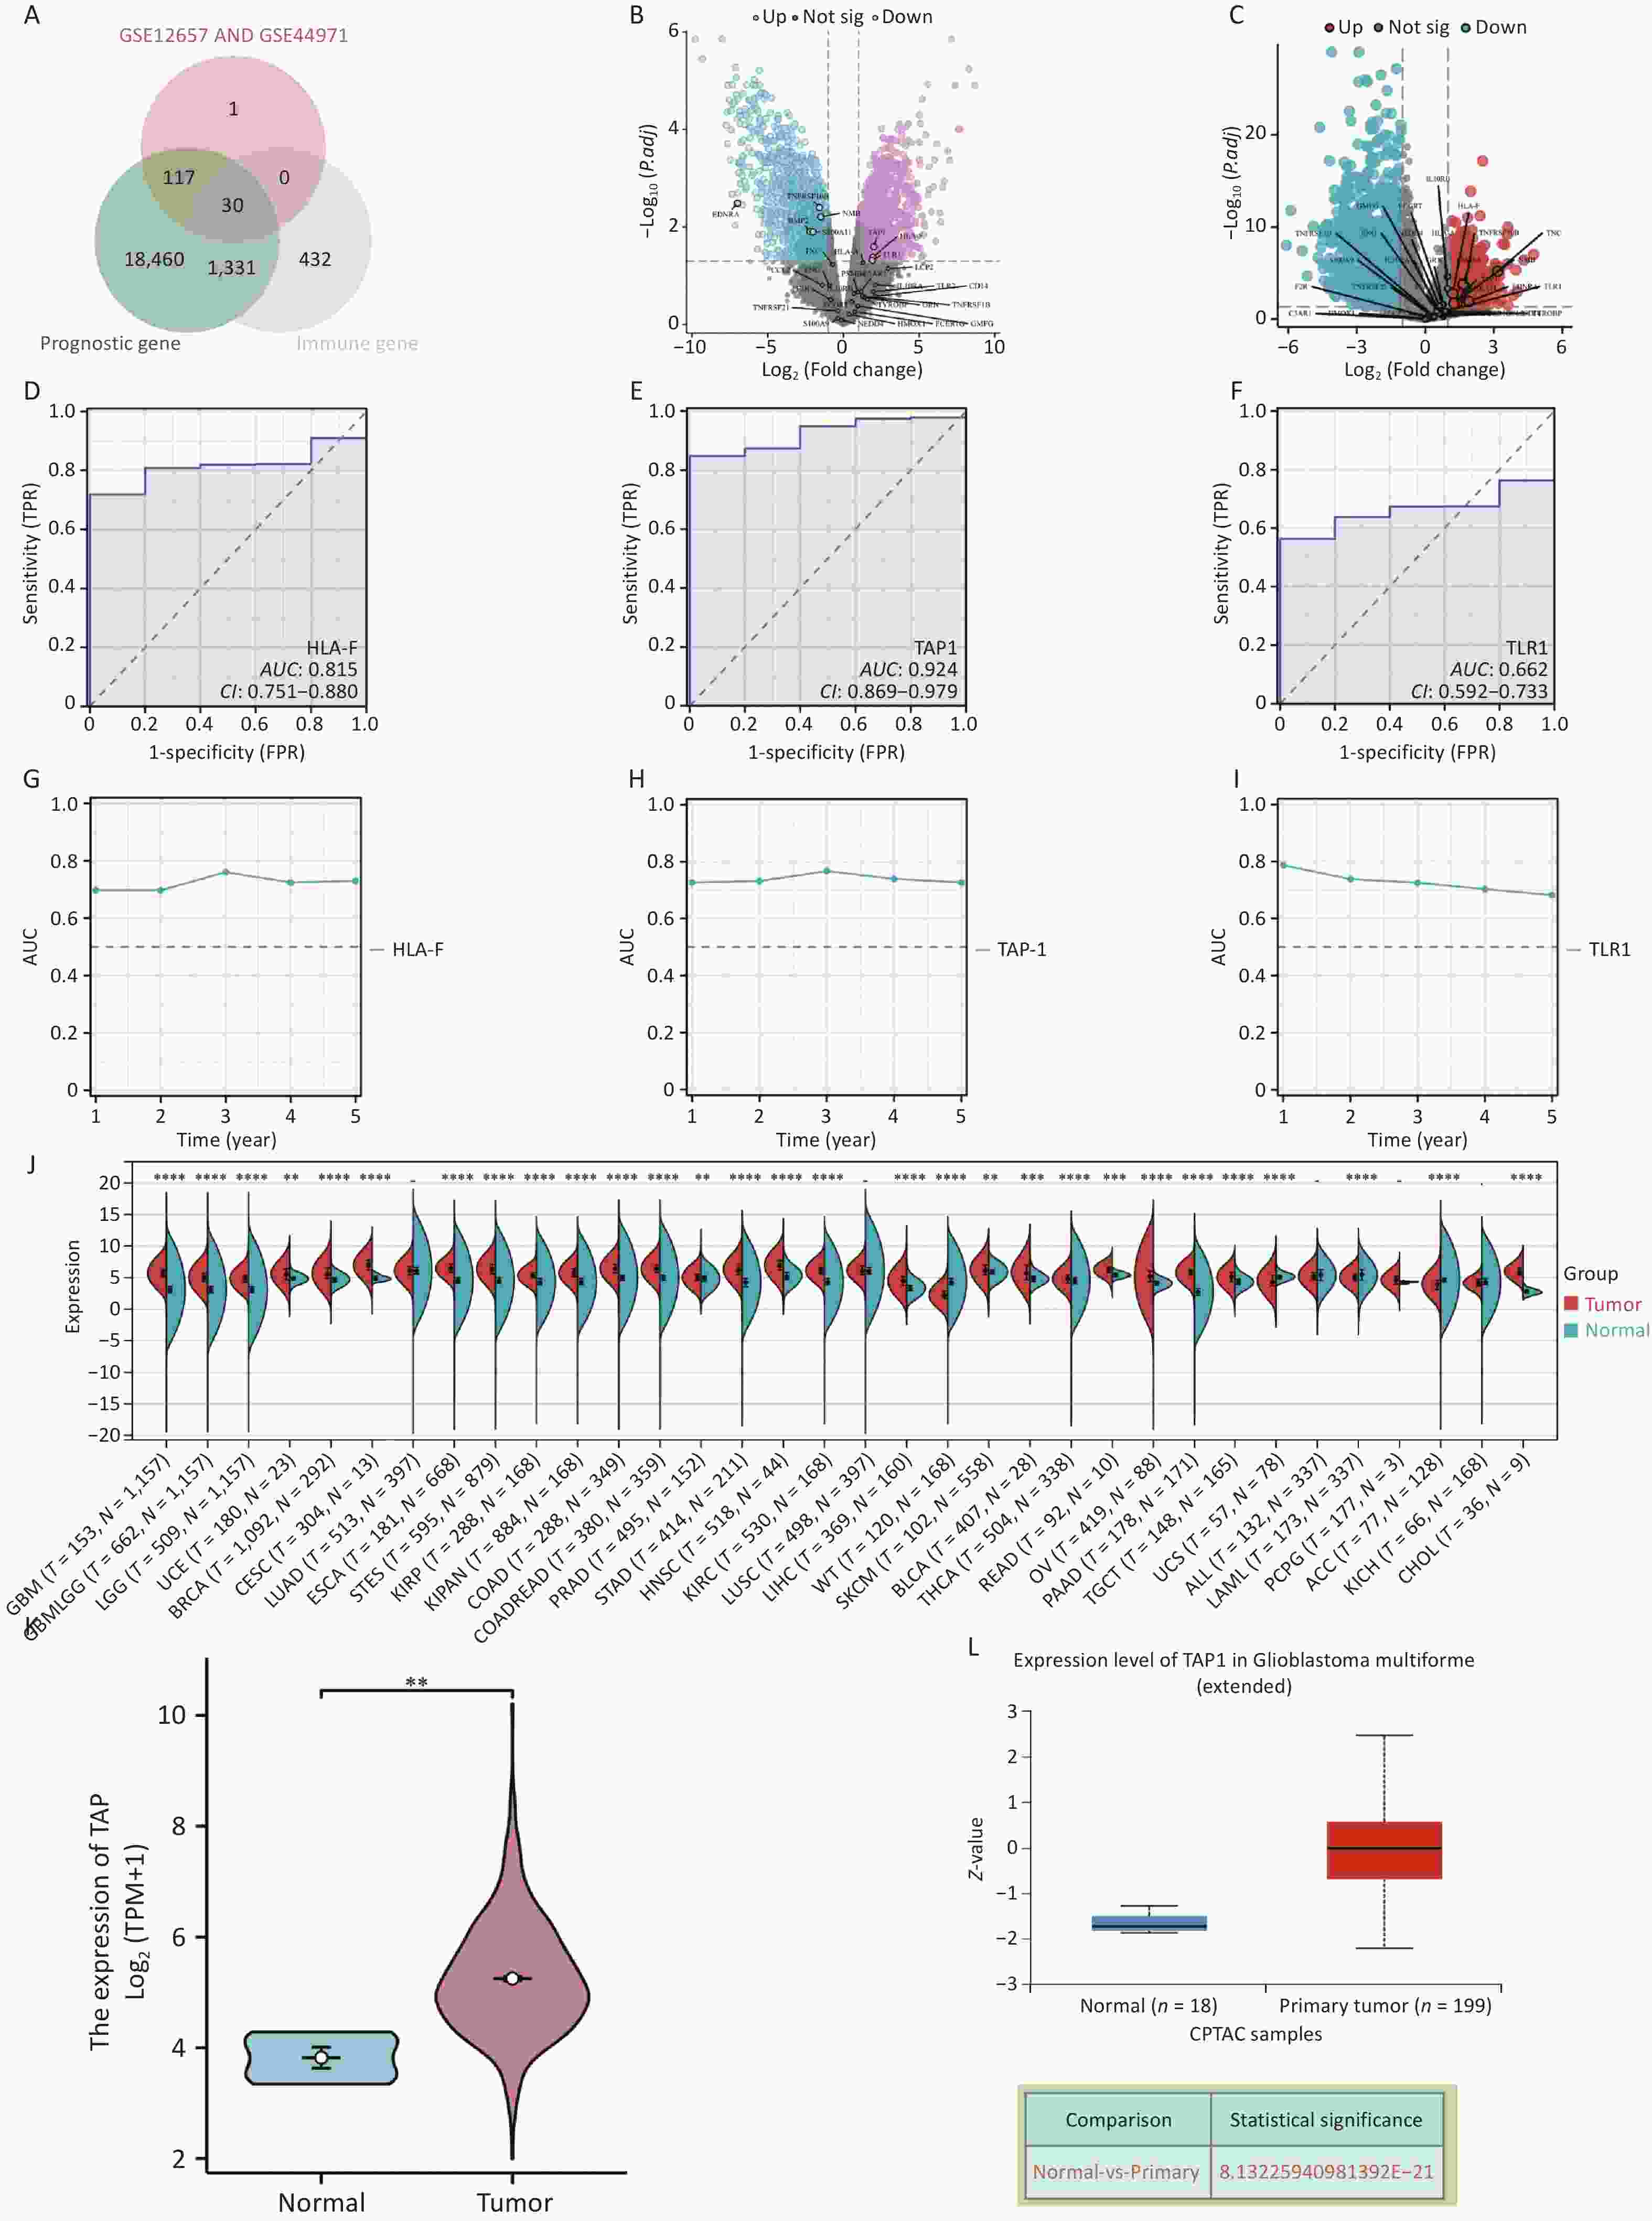
Figure 1. (A) Venn diagrams of GSE12657 and GSE44971, prognostic differentially expressed genes (DEGs), and immune-related genes in GBMLLG cancer and normal tissues. (B) Volcano plot of DEGs selected based on the GSE34152. Upregulated DEGs are colored red, and downregulated DEGs are colored blue. X-axis represents LogFC, and Y-axis represents −Log10. (C) Volcano plot of DEGs selected based on the GSE7696. Upregulated DEGs are colored red, and downregulated DEGs are colored blue. X-axis represents LogFC and Y-axis represents −Log10. (D) Receiver operating characteristic (ROC) curve for human leukocyte antigen F (HLA-F) in GBMLGG. (E) ROC curve for transporter associated with antigen processing 1 (TAP1) in GBMLGG. (F) ROC curve for Toll-like receptor 1 (TLR1) in GBMLGG. (G) Time-dependent ROC analysis of HLA-F. (H) Time-dependent ROC analysis of TAP1. (I) Time-dependent ROC analysis of TLR1. (J) TAP1 mRNA expression in pan-cancer (The Cancer Genome Atlas [TCGA] database). (K) Unpaired differential analysis of TAP1 mRNA in the TCGA database.*P < 0.05, **P < 0.01, ***P < 0.001. (L) Differential protein expression of TAP1.
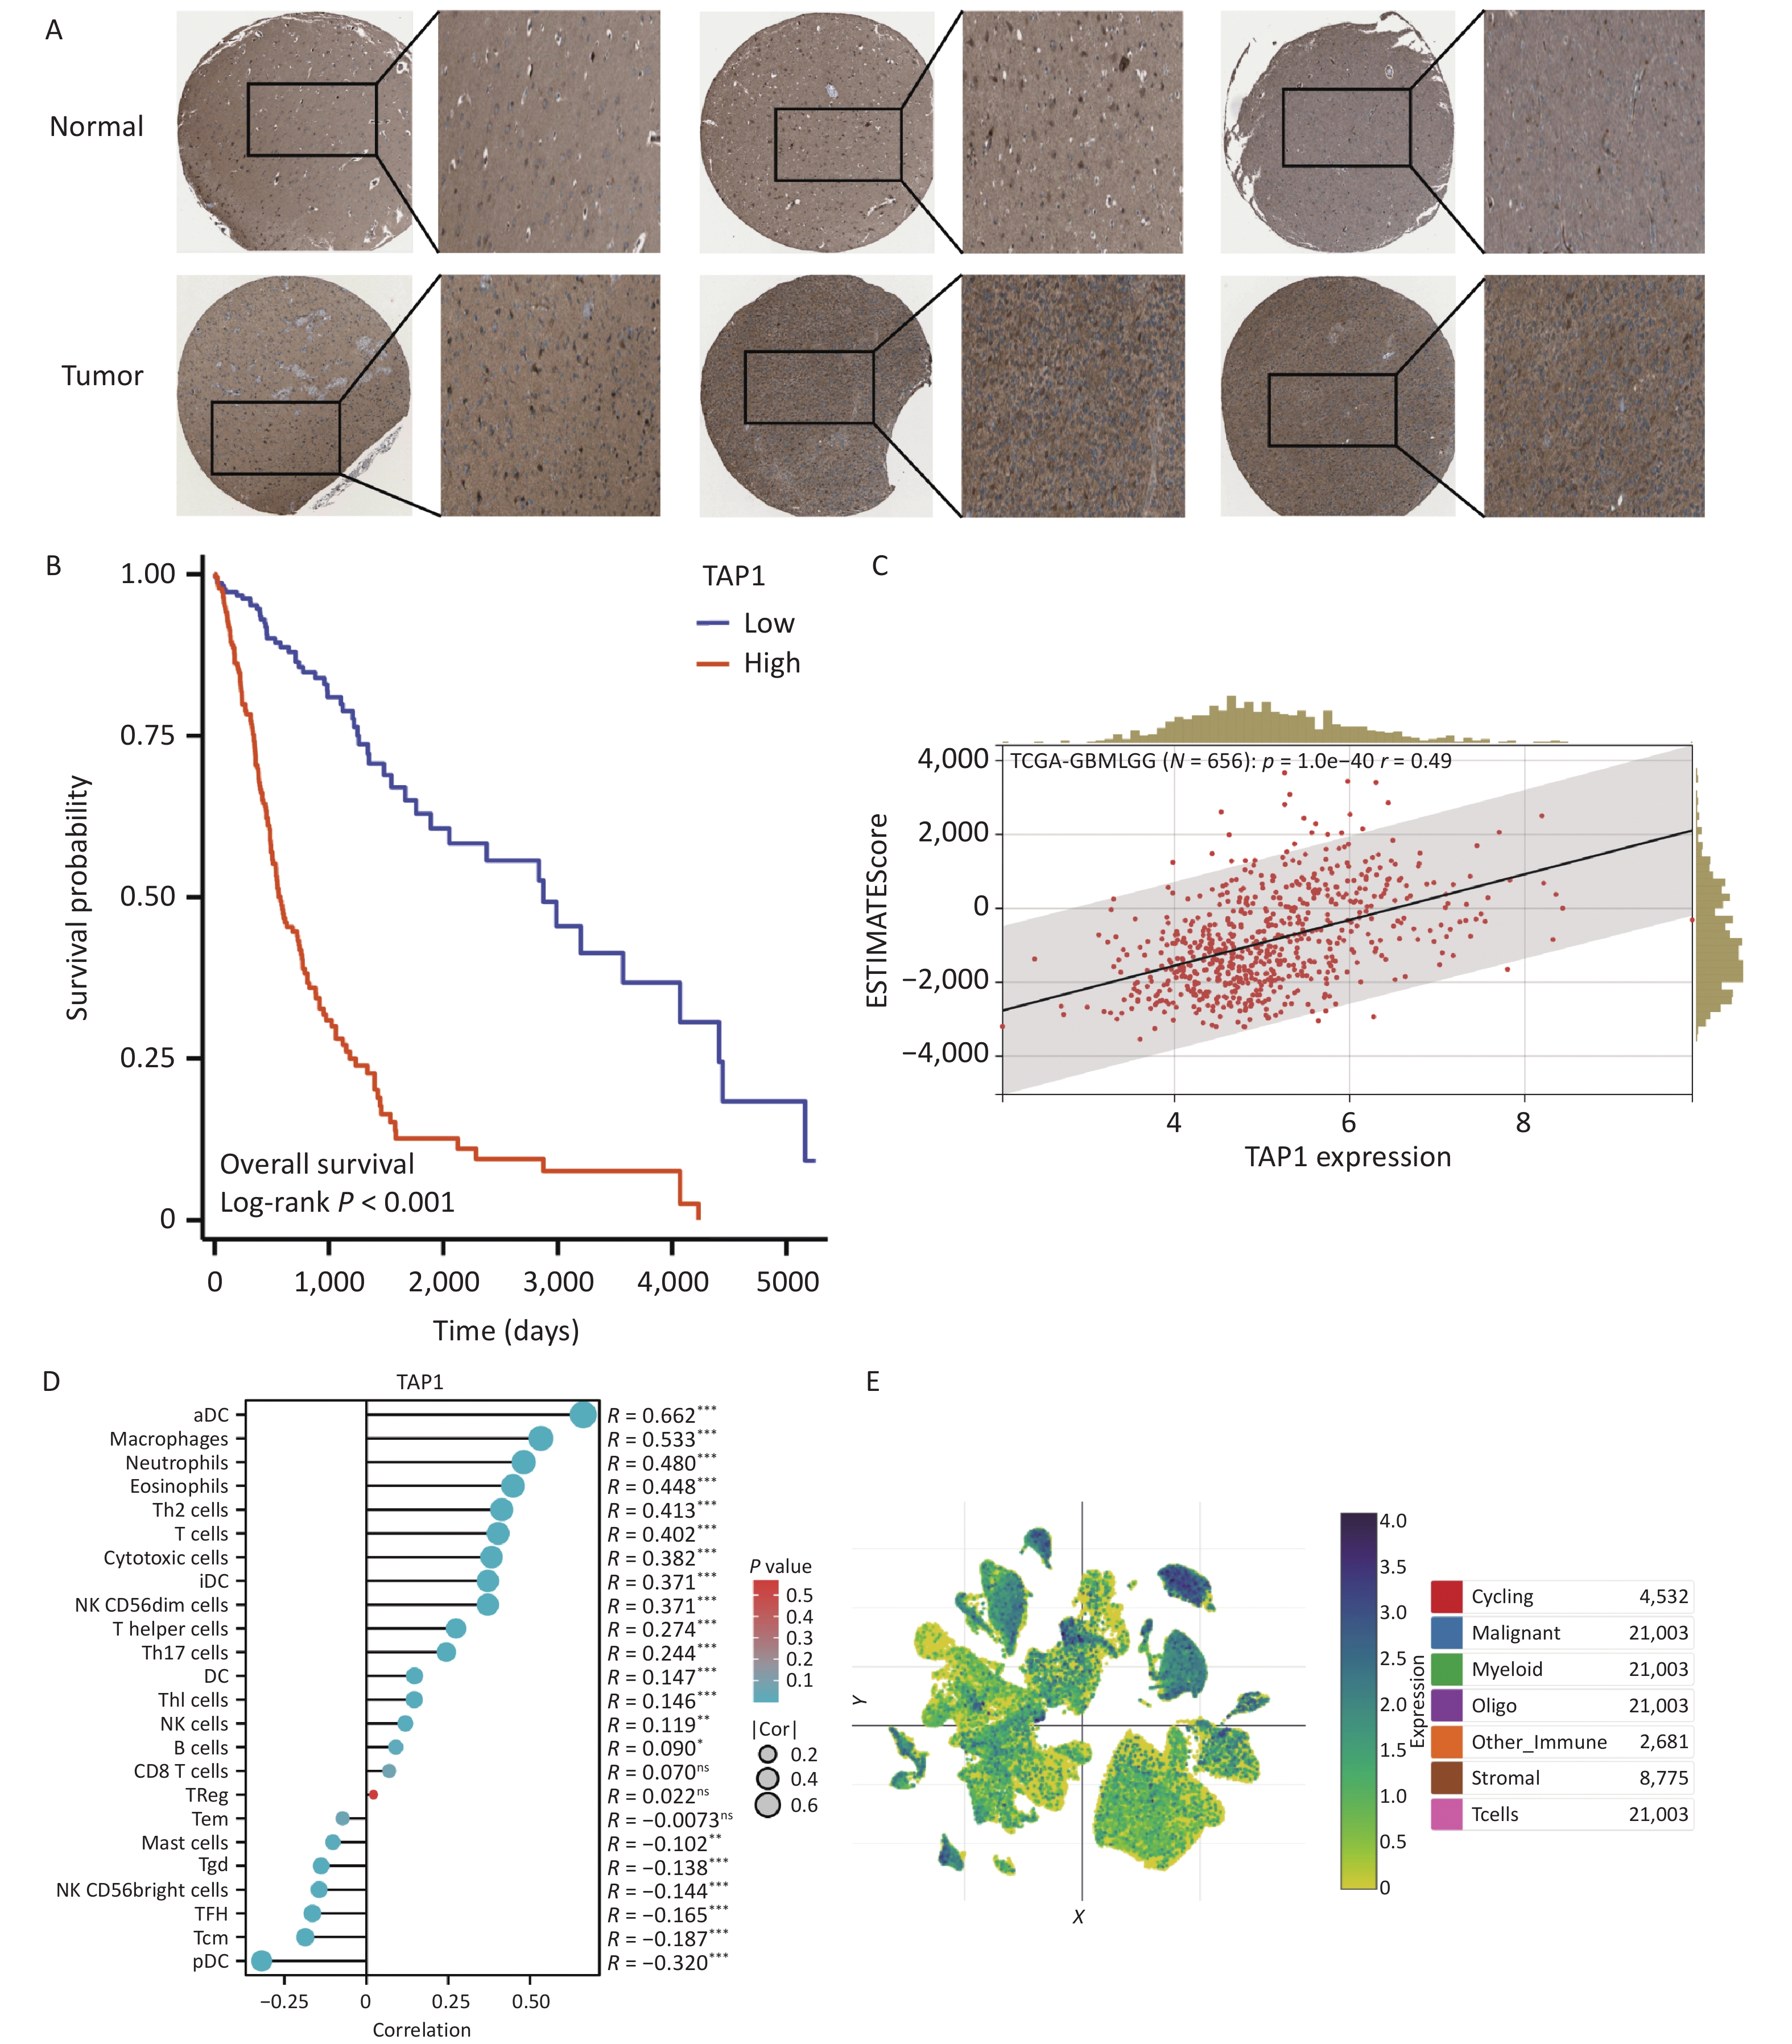
We investigated the subcellular localization of TAP1 and determined that it was primarily localized in the endoplasmic reticulum and centriolar satellites (Supplementary Figure 1A). We explored the pan-cancer expression of TAP1 using the TCGA-GBMLGG dataset and observed that it was highly expressed in glioblastomas (P < 0.0001) (Figure 1J). Further unpaired analysis revealed elevated TAP1 expression levels in both tumor and adjacent normal tissues (P < 0.01) (Figure 1K). At the protein level, analysis using the UALCAN database and TCGA and CPTAC datasets showed that high TAP1 expression in primary glioblastomas compared with normal brain tissues (P = 8.13 × 10⁻²¹) (Figure 1L). We subsequently compared TAP1 protein expression in tumor tissues and adjacent normal tissues from GBMLGG cases in the Human Protein Atlas database using immunohistochemistry, which confirmed TAP1 overexpression in tumor tissues (Figure 2A). Based on the comprehensive evidence presented, TAP1 was consistently overexpressed in cancer tissues at both the mRNA and protein levels. Subsequently, we performed a Kaplan–Meier survival curve analysis for TAP1. Patients with GBMLGG and high TAP1 expression exhibited significantly lower overall survival rates than their counterparts (Figure 2B).
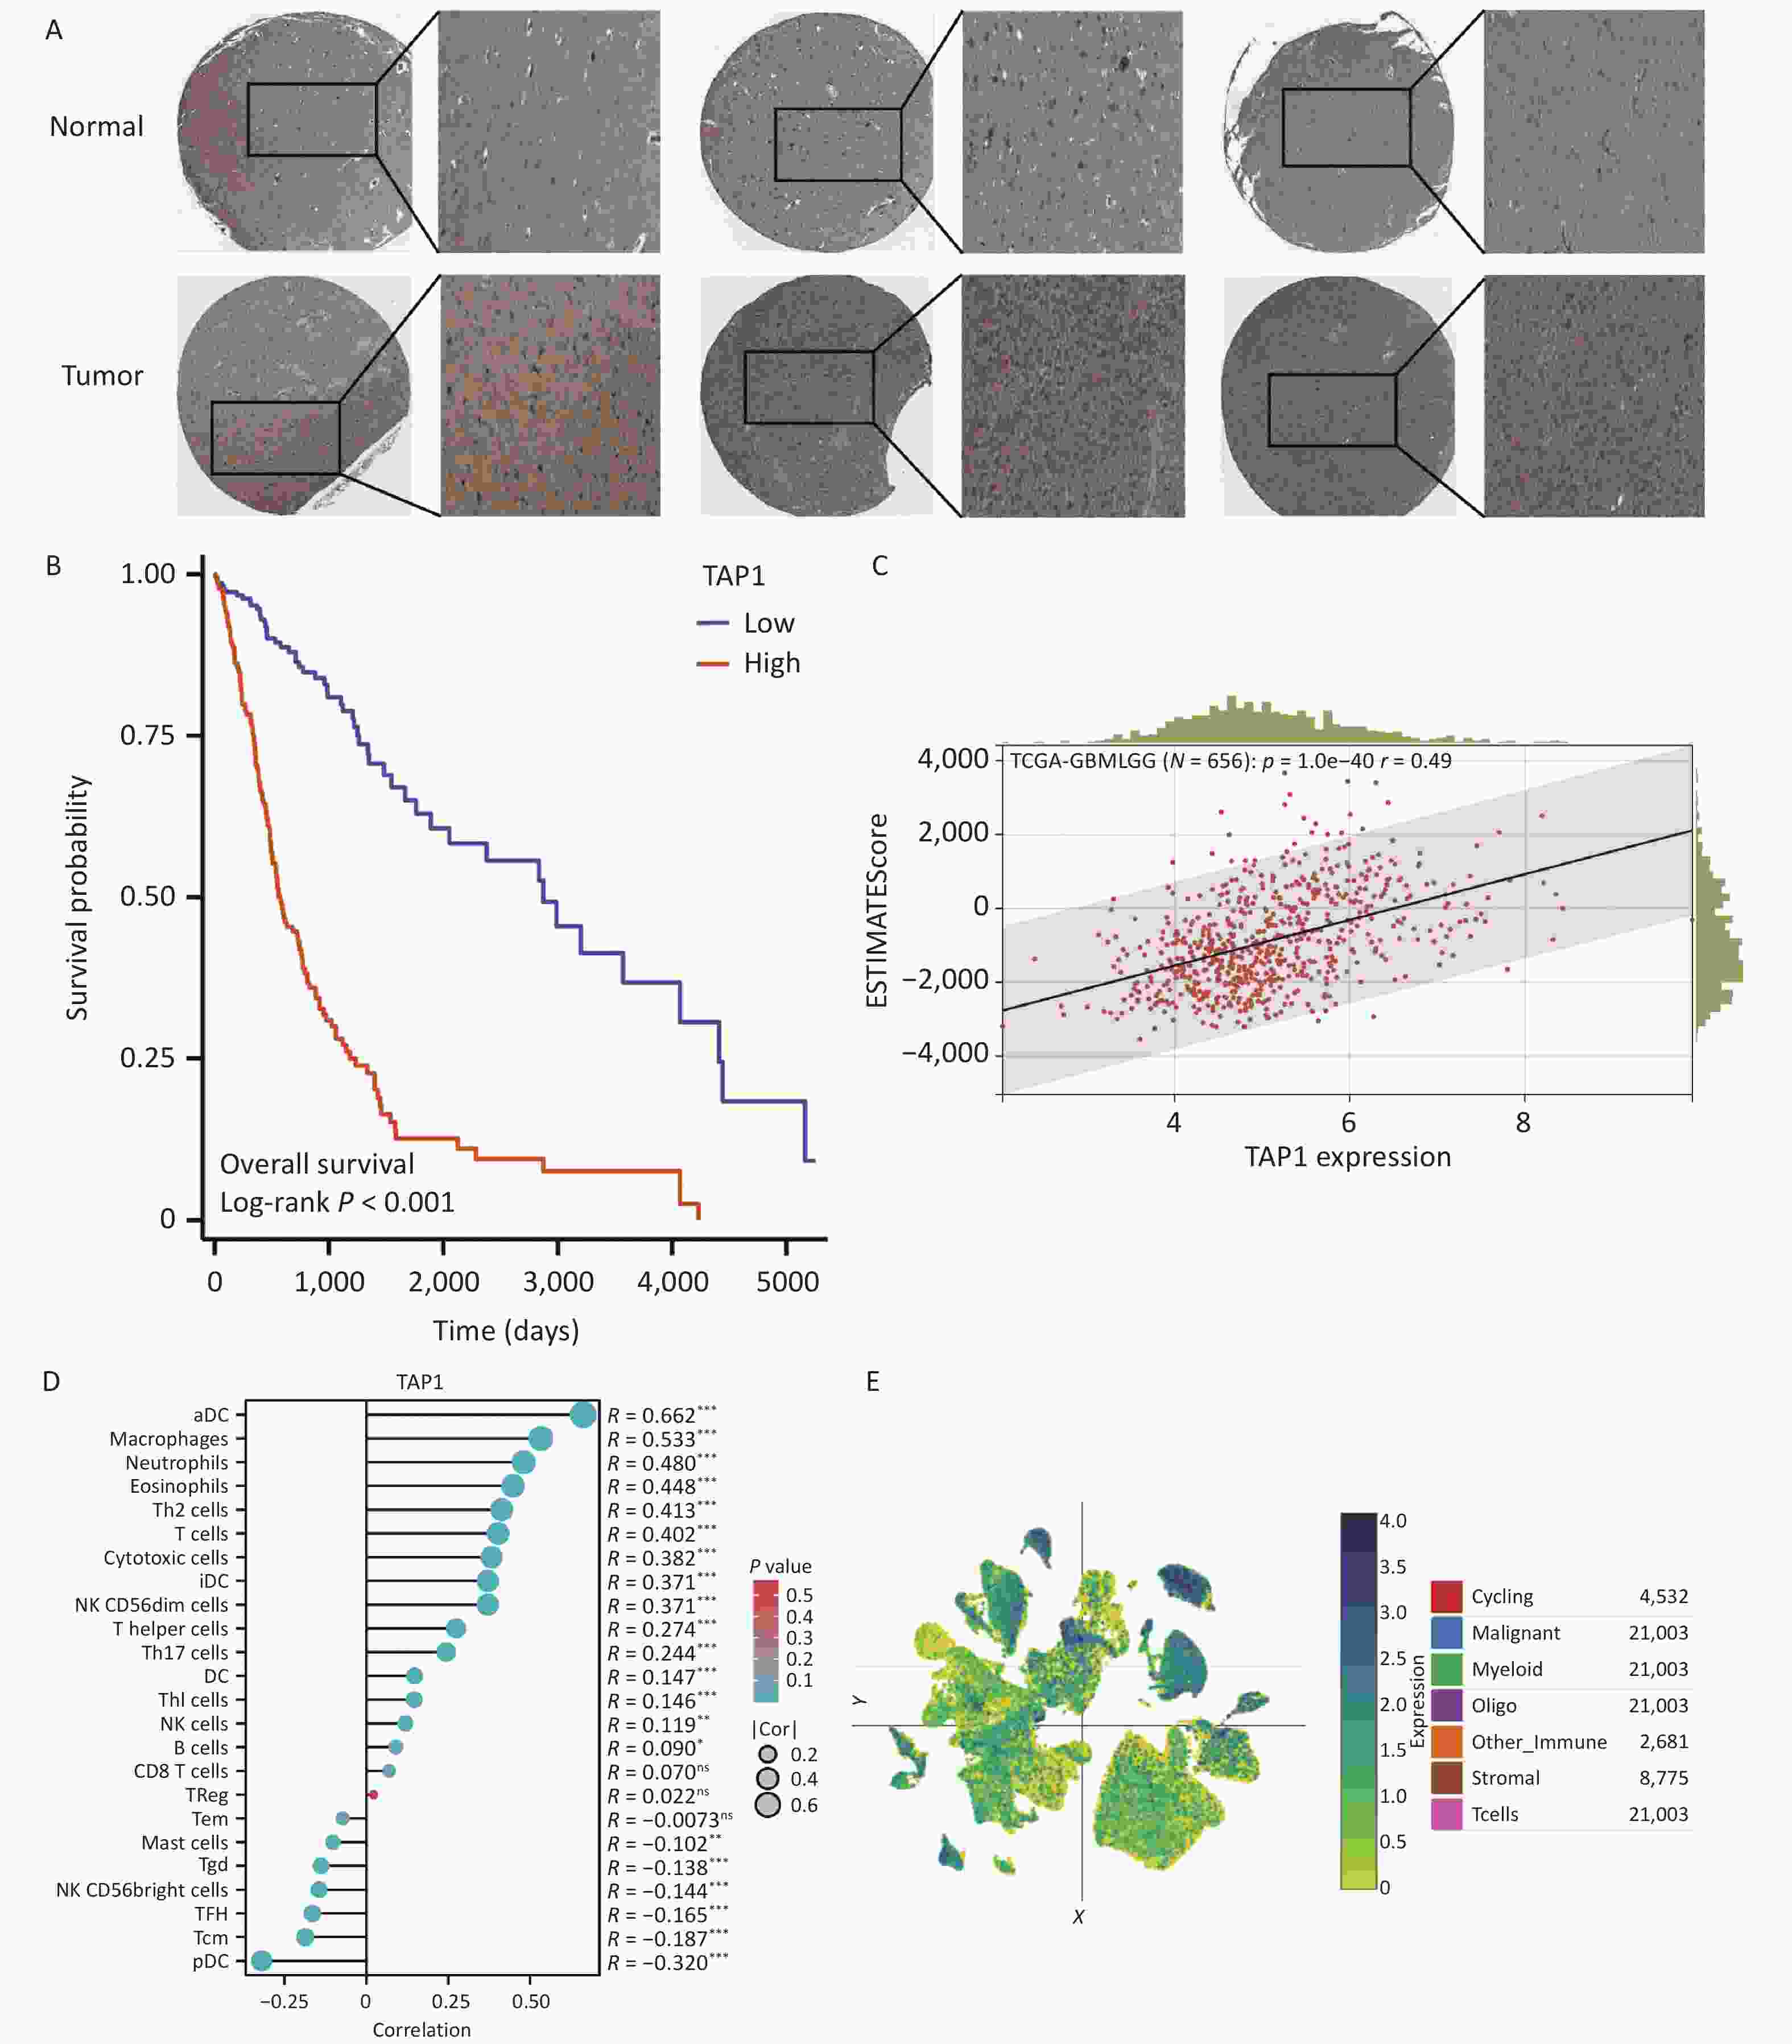
Figure 2. (A) Transporter associated with antigen processing 1 (TAP1) protein expression in cancer tissues and normal tissues of glioblastoma multiforme and lower-grade glioma (GBMLGG) (Human Protein Atlas database). (B) Prognostic analysis of TAP1 in GBMLGG. P < 0.05 was statistically significant. (C) Correlation analysis between TAP1 expression and tumor immune infiltration level (ESTIMATE). P < 0.05 was statistically significant. (D) TAP1 expression association with immune infiltrating cells in GBMLGG. *P < 0.05, **P < 0.01, ***P < 0.001. (E) Distribution of TAP1 in all GBMLGG cells.
We evaluated the relationship between TAP1 expression and prognosis in patients with gliomas using univariate and multivariate Cox regression analyses (Table 1). The univariate analysis showed that high TAP1 expression was significantly associated with poor prognosis (hazard ratio [HR] = 2.898, 95% CI: 2.243–3.746, P < 0.001), with a risk level second only to the World Health Organization grade (G4 vs. G2: HR = 18.600, P < 0.001) and wild-type isocitrate dehydrogenase (IDH) status (HR = 0.116, P < 0.001). However, after adjusting for confounding factors, the multivariate analysis revealed that high TAP1 expression was no longer an independent prognostic factor (HR = 0.967, P = 0.872). Logistic regression analysis further showed that high TAP1 expression was closely associated with poor prognostic features (Table 2), including high-grade tumors (odds ratio [OR] = 8.626, P < 0.001), wild-type IDH status (OR = 0.183, P < 0.001), and older age (OR = 3.090, P < 0.001). Therefore, although high TAP1 expression was associated with an invasive glioma phenotype, it is not an independent prognostic marker; it works together with other key drivers to shape the malignant biological behavior of the tumor.
Characteristics Total (N) Univariate analysis Multivariate analysis Hazard ratio (95% CI) P value Hazard ratio (95% CI) P value Age 698 ≤ 60 555 Reference Reference > 60 143 4.696 (3.620 − 6.093) < 0.001 4.213 (2.559 − 6.935) < 0.001 Gender 698 Female 297 Reference Reference Male 401 1.250 (0.979 − 1.595) 0.073 1.805 (1.153 − 2.826) 0.010 WHO grade 636 G2 223 Reference Reference G3 245 2.967 (1.986 − 4.433) < 0.001 1.990 (1.253 − 3.163) 0.004 G4 168 18.600 (12.448 − 27.794) < 0.001 6.848 (2.139 − 21.927) 0.001 IDH status 688 WT 246 Reference Reference Mut 442 0.116 (0.089 − 0.151) < 0.001 0.506 (0.302 − 0.848) 0.010 1p/19q codeletion 691 Non-codel 520 Reference Reference Codel 171 0.225 (0.147 − 0.346) < 0.001 0.646 (0.375 − 1.112) 0.115 Primary therapy outcome 464 PD 112 Reference Reference SD 148 0.440 (0.294 − 0.658) < 0.001 0.369 (0.222 − 0.612) < 0.001 PR 65 0.167 (0.073 − 0.385) < 0.001 0.204 (0.073 − 0.572) 0.002 CR 139 0.131 (0.063 − 0.273) < 0.001 0.166 (0.077 − 0.358) < 0.001 TAP1 698 Low 348 Reference Reference High 350 2.898 (2.243 − 3.746) < 0.001 0.967 (0.645 − 1.451) 0.872 Note. P < 0.05, and the results were statistically significant. Table 1. Univariate and multivariate analyses of clinicopathological parameters in patients with GBMLGG
Characteristics Total (N) OR (95% CI) P value WHO grade (G4 vs. G2&G3) 637 8.626 (5.427–13.710) < 0.001 IDH status (Mut vs. WT) 689 0.183 (0.129–0.259) < 0.001 Histological type (Oligoastrocytoma&Oligodendroglioma vs. Glioblastoma) 503 0.105 (0.065–0.170) < 0.001 Gender (Male vs. Female) 699 1.157 (0.857–1.561) 0.342 Primary therapy outcome (PD vs. SD) 260 1.438 (0.877–2.356) 0.150 Race (Black or African American vs. Asian) 46 0.472 (0.121–1.842) 0.280 Age (> 60 vs. <= 60) 699 3.090 (2.073–4.605) < 0.001 Note. P < 0.05, and the results were statistically significant. Table 2. TAP1 expression associated with clinicopathological characteristics (logistic regression)
This study evaluated the correlation between TAP1 expression and tumor immune infiltration in GBMLGG using the ESTIMATE algorithm. A significant positive correlation was identified between TAP1 expression and the proportion of immune/stromal cells in the tumor microenvironment (Figure 2C) (P = 1.0 × 10-40). Thus, TAP1 may play an important role in the recruitment of immune cells to tumor sites. To further delineate the specific immune cell subpopulations recruited by TAP1, we employed ssGSEA to quantify the correlation between TAP1 expression and the infiltration levels of 24 immune cell types (Figure 2D). The results demonstrated strong positive correlations between TAP1 and myeloid cells, moderate positive correlations with adaptive immune cells, and significant negative correlations with specific immune subsets, such as pDC, Tcm, TFH, and NK CD56bright cells. To validate the cellular distribution of TAP1 in tumor tissues, we performed single-cell RNA sequencing analysis of gliomas (Figure 2E, Supplementary Figure 1B). TAP1 was predominantly expressed in malignant tumor, myeloid, and T cells, further supporting its close association with myeloid and T cell-mediated immune processes. Thus, TAP1 may act as a key immunoregulatory hub, driving a robust myeloid cell-mediated inflammatory response, while suppressing the function or infiltration of specific immune subsets. Based on these findings, we investigated the relationship between TAP1 and immune checkpoint molecules (Figure 3A). TAP1 expression not only showed positive correlations with T cell-associated inhibitory checkpoints but was also associated with elevated expression of myeloid-derived immunosuppressive molecules IDO1 and ARG1. TAP1 also showed positive correlations with genes reflecting T cell activation and recruitment, such as IFNG, GZMA, PRF1, and CXCL9/10. In tumors with high TAP1 expression, despite the presence of an active T cell response, both T and myeloid cells demonstrated concurrent functional exhaustion. We further analyzed the genes related to immune regulation (Figure 3B). TAP1 expression was positively correlated with immunostimulatory molecules, MHC-related genes, immune suppression-related genes, and key chemokines. Therefore, TAP1 upregulation could promote chemokine secretion, establishing chemical gradients that recruit immune cells such as T cells, NK cells, and myeloid cells to the tumor site. Based on this, we propose a novel glioma subtype with high TAP1 expression, characterized by a “functionally suppressed immune activation” phenotype. It exhibited extensive immune cell infiltration and activated anti-tumor mechanisms, yet simultaneously activated immunosuppressive pathways, creating a “hot but exhausted” microenvironment with high immune infiltration but limited functional activity.
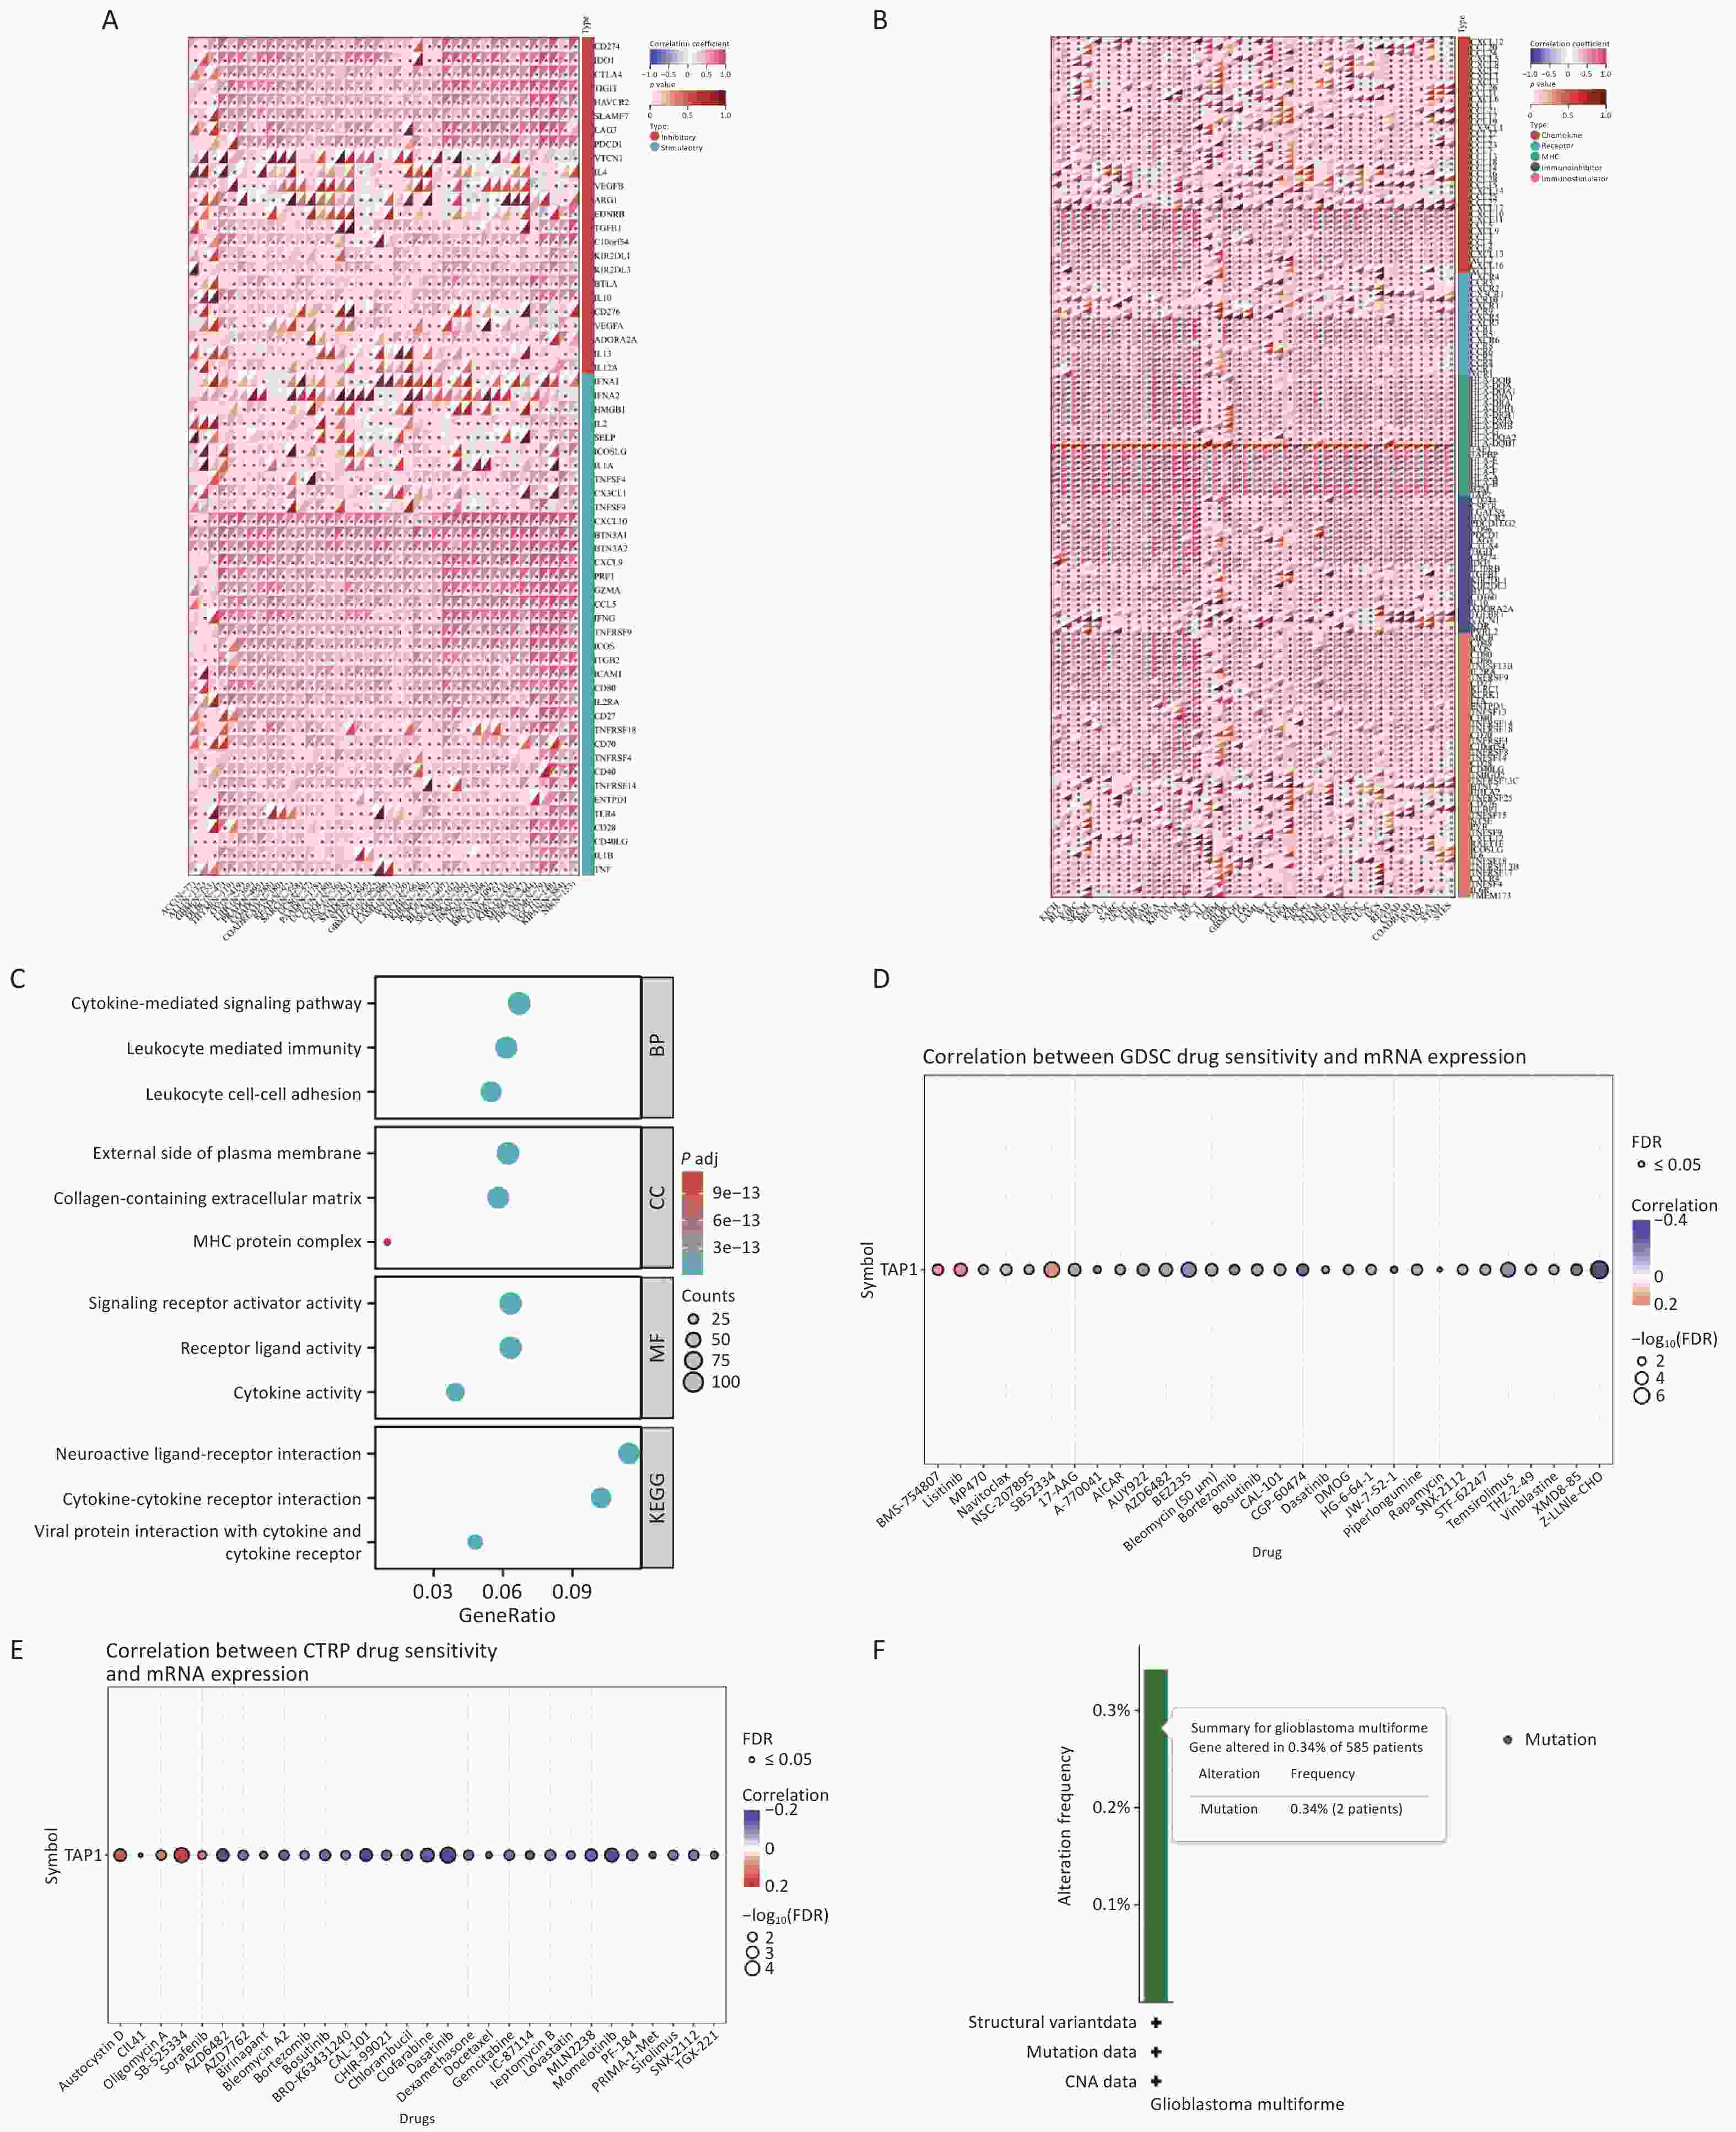
Figure 3. (A) Transporter associated with antigen processing 1 (TAP1) mRNA in relation to 60 immune checkpoints in pan-cancer. (B) TAP1 mRNA in relation to immune regulatory genes in pan-cancer. (C) TAP1 mRNA in relation to immune regulatory genes. (D) Heat map of TAP1 and drug sensitivity correlation in the Genomics of Drug Sensitivity in Cancer (GDSC) database. P < 0.05 was statistically significant. (E) Heat map of TAP1 and drug sensitivity correlation in Cancer Therapeutics Response Portal database. P < 0.05 was statistically significant. (F) Type and frequency of TAP1 variants in glioblastoma multiforme and lower-grade glioma in the cBioPortal database.
To investigate the mechanisms by which TAP1 influences the tumor immune microenvironment, we performed Kyoto Encyclopedia of Genes and Genomes (KEGG) and Gene Ontology analyses of TAP1 (Figure 3C). These genes were significantly enriched in multiple immune-related biological processes, including cytokine-mediated signaling pathways, leukocyte immunity, and intercellular adhesion. Their molecular functions were mainly associated with signaling receptor activation, receptor ligand activity, and cytokine activity. The KEGG pathway analysis further demonstrated significant enrichment of these genes in pathways such as neuroactive ligand–receptor and cytokine–cytokine receptor interactions. Therefore, at the functional genomic level, a coordinated and complete immune regulatory program was activated in gliomas with high TAP1 expression. This program not only involved the recruitment and activation of immune cells, but also encompassed the simultaneous upregulation of antigen presentation and immune suppression mechanisms. This provides molecular mechanistic support for the assertion that such gliomas represent the “functionally suppressed immune activation” subtype.
To further investigate which drugs the TAP1-high expression tumor subtype was sensitive to, we analyzed the sensitivity of TAP1-related drugs (Figure 3D, E). Analysis of the CTRP and GDSC datasets revealed a correlation between TAP1 expression levels and drug sensitivity. TAP1 exhibited significant sensitivity to proteasome inhibitors, PI3K/mTOR signaling pathway inhibitors, and multi-targeted kinase inhibitors. Thus, the survival and proliferation of this subtype were highly dependent on protein metabolic homeostasis, PI3K/AKT/mTOR signaling axis, and kinase network regulation. By contrast, this subtype was generally insensitive to inhibitors of IGF-1R, TGF-β signaling, and mitochondrial metabolism, which indicates that its growth and survival did not depend on the aforementioned signaling pathways and energy metabolism modes. This characteristic drug response pattern confirms TAP1-high glioma as a subtype with unique molecular dependencies, providing experimental evidence for its molecular classification and guiding clinically targeted therapy strategies. This suggests prioritizing proteasome and PI3K/mTOR pathway inhibitors while avoiding ineffective drugs such as IGF-1R inhibitors, thereby laying the foundation for precision therapy for this subtype.
To investigate the genomic variations in TAP1 in gliomas, we analyzed data derived from a large cohort. The mutation frequency of TAP1 in gliomas was extremely low, accounting for only 0.34% (2/585), and TAP1 was not a frequently mutated driver gene (Figure 3F). Copy number variation analysis revealed that the genetic alteration of TAP1 was dominated by copy number gain, with the frequency of gain (n = 7) being slightly higher than that of loss (n = 5) (Supplementary Figure 1C). Further analysis confirmed that copy number gain of TAP1 was the most common genetic alteration, which was considerably more prevalent than truncating or missense mutations (Supplementary Figure 1D). Compared with well-recognized high-frequency mutated driver genes, such as TP53 (73%), phosphatase and tensin homolog (98%), and epidermal growth factor receptor (69%), TAP1 exhibited a significantly lower mutation rate (0.2%) (Supplementary Figure 1E, F). Therefore, the oncogenic function of TAP1 may be mediated by copy number gain-induced upregulation or transcriptional regulation, rather than gene mutations.
This study systematically revealed through multiomics data that a high TAP1 expression defined a novel immune subtype of glioma. This subtype exhibited a unique “hot yet exhausted” paradoxical phenotype. Further analysis confirmed that this subtype was not driven by TAP1 gene mutations but may achieve increased expression through copy number gain, thereby reshaping the tumor microenvironment. Importantly, this subtype showed unique sensitivity to proteasomes and PI3K/mTOR pathway inhibitors, thus providing a clear and precise treatment strategy and molecular subtyping basis for this group of patients with refractory tumors. Further validation of the prognostic significance of TAP1 in different molecular and clinical subgroups constitutes a key research direction.
HTML
Authors’ Contributions Conceptualization: Lei Liu; Supervision: Jun Zhang; Data curation and writing–original draft preparation: Jianlei An; Methodology and software: Hongru Liu.
&These authors contributed equally to this work.
Reference

 Quick Links
 DownLoad: