
-
Type 2 diabetes (T2D) represents a tremendous disease burden to humans worldwide[1]. Fine particulate matter (PM2.5, particulate matter with aerodynamic diameter of ≤ 2.5 μm) air pollution is a major risk factor for cardiometabolic diseases[2-4]. A growing body of evidence indicates that short-term exposure to PM2.5 is associated with an increased risk of diabetes morbidity and mortality[5-8]. Importantly, a nationwide, individual-level, case-crossover study reported that short-term exposure to PM2.5 may precipitate death from T2D via exaggerating diabetic ketoacidosis (DKA), one of the major acute and fatal complications of diabetes[5]. Per interquartile range (IQR) increment in 3-day moving-average PM2.5 concentrations were associated with 2.54% (1.04% – 4.06%) increase in DKA mortality[5]. Consistent with these finding, a time-series study in Chile also revealed positive associations of DKA hospitalizations with short-term PM2.5 exposure, particularly among older populations[8]. Despite accumulating epidemiological evidence linking short-term PM2.5 exposure to DKA, animal studies are still lacking to support the biological plausibility for this association.
Elevated circulating ketone bodies serve as a key biomarker for DAK. Ketone bodies mainly comprise acetoacetate, β-hydroxybutyrate, and acetone. Of these, β-hydroxybutyrate is the most abundant and stable circulating form, accounting for approximately 70–90% of total ketone bodies, and is therefore widely used as a biomarker of ketosis. It remains uncertain whether PM2.5 exposure increases ketone body levels among diabetic individuals. Furthermore, as the central organ in regulating energy metabolism, the liver plays a vital role in fatty acid oxidation, ketone body production, and glucose homeostasis, making it a key target for studying metabolic disturbances related to diabetes. Previous epidemiological studies have indicated that PM2.5 exposure is associated with an increased risk of chronic liver diseases[9,10]. Emerging toxicological evidence also suggests that PM2.5 may impair hepatic glucose utilization by reducing tricarboxylic acid cycle capacity and may promote hepatic lipid dysregulation through enhancing de novo lipogenesis, altering phospholipid metabolism, and inhibiting fatty acid oxidation[11-13]. However, it has not been ascertained whether alterations in hepatic physiological activity mediate increases in ketone body levels following PM2.5 exposure, especially in diabetic individuals. Transcriptome analysis is a powerful tool for understanding how environmental stimuli affect gene activity, and has been widely applied to discern early biological responses to air pollution exposure[14,15]. We have hypothesized that acute PM2.5 exposure enhances ketogenesis in T2D by disrupting hepatic metabolism that can be detected by transcriptomic alterations in the liver.
-
PM2.5 was collected from the rooftop of Building 8 in the West Zone of Fenglin Campus, Fudan University (Shanghai, China) between December 2020 and February 2021, using quartz fiber filters. The average mass concentration of PM2.5 during the sampling period was approximately 39 μg/m3. Prior to deployment, these filters underwent rigorous preparation procedures. In specific, the filters were baked in a furnace at 400 °C for 6 hours and then held in a chamber at 25 °C and 50% relative humidity for 24 hours. The conditioned filters were then installed on a TH-1000CII high-volume air particulate sampler equipped with a PM2.5 cutter, with the sampling flow rate set at 1.05 m3/min. Samples were collected on each filter for 20 hours per day over three days. After sampling, the filters were reconditioned in the chamber for an additional 24 hours. The filters were then cut into pieces (approximately 1 × 3 cm), submerged in double-distilled water for 12 hours, and cleaned by ultrasonic vibration five times for 20 minutes each. The resulting liquid was filtered into a 50 mL centrifuge tube and centrifuged at 12,000 g for 20 minutes at 4 °C. The supernatant was discarded, leaving a small amount of liquid at the bottom of the tube. Particulate matter pelleted on tube walls was scraped into this liquid and resuspended. The PM2.5 suspension was transferred to a hanging bottle, frozen at −80 °C for 12 hours, and then subjected to vacuum freeze-drying for 24 hours. The collected PM2.5 samples were stored at –20 °C until further use.
-
Our prior study that linked PM2.5 to DKA mortality occurred in a population with T2D[5], therefore the current study used seventeen-week-old male BKS db/db mice obtained from Finoc Biotech, Shanghai (n = 20). Male mice were selected to minimize the potential confounding effects from fluctuating female sex hormones on lipid and glucose metabolism. The BKS db/db mouse is a well-established leptin receptor-deficient model that spontaneously develops T2D phenotypes, including hyperglycemia, hyperinsulinemia, and insulin resistance, thereby rendering it particularly suitable for investigating diabetes-related outcomes. All mice were acclimated for one week under controlled conditions (temperature: 20 ± 2 °C; relative humidity: 40%–70%) on a 12-h light/ dark cycle, with free access to standard chow and water. The protocols and the use of animals were approved by the Fudan University Animals Ethical and Uses Committee.
Mice were randomly assigned to receive intratracheal instillation of either PM2.5 (5 mg/kg, collected from the aforementioned filters) suspended in 50 μL phosphate-buffered saline (PBS; 0.01 M, pH7.4), or 50 μL PBS alone (control). Toxicological studies have reported that exposure to 5 mg/kg induces metabolic disturbances and systemic inflammation in mice[16,17]. The PBS administered to the control group was prepared by extracting blank quartz filters. These blank filters underwent the exact same processing, sonication, and handling procedures as the PM2.5-laden filters. Exposures were performed once daily for three consecutive days, corresponding to the exposure window used in our previous human study[5]. Prior to administration, the suspension was sonicated for 20 minutes to reduce particle aggregation and vortexed for 30 seconds to ensure uniform dispersion. Mice were euthanized for blood and tissue collection within 24 hours from the final instillation (Day 3).
-
Blood was collected via eyeball enucleation, placed at room temperature for 1 hour, and centrifuged at 1000 g for 10 minutes at 4°C. The serum supernatant was then collected and stored at –80 °C until analyzed. Serum β-hydroxybutyrate levels were measured using the ketone body assay kit (Sigma-Aldrich, MAK134). Samples exhibiting severe hemolysis were excluded from the analysis of β-hydroxybutyrate, resulting in a final sample size of n = 9 for the PBS group.
-
Liver tissue was harvested, flash frozen immediately and stored at -80°C until used for RNA isolation, sequencing and analysis. The transcriptomics assays include sample quality testing, library construction, library quality testing, and library sequencing. Specifically, liver RNA was extracted using TRIZOL (TRIzol® Reagent, Invitrogen, USA). RNA quality and integrity were assessed by agarose gel electrophoresis, NanoPhotometer spectrophotometer, Qubit 2.0 Fluorometer, and Agilent 2100 Bioanalyzer. These analyses included determination of RNA integrity, DNA contamination, concentration, and purity (A260/A280 and A260/A230 ratios). Only samples with RNA Integrity Number (RIN) ≥ 7 were considered eligible for downstream analysis. Purified RNA was used to establish the RNA library using the Illumina TruSeq™ RNA Sample Prep Kit (Illumina, San Diego, CA, USA). Initially, seven mice were randomly selected from each group for the analysis. The pre-defined quality criterion (RIN ≥ 7) resulted in one sample from the PM2.5-exposed to be excluded from analysis, leading to libraries from seven PBS-exposed and six PM2.5-exposed mice to be sequenced. All sequencing was performed with an Illumina Truseq SBS Kit (300cycles) on an Illumina NovaSeq 6000 platform. Raw reads were processed to remove low-quality reads and adapters. Clean reads were aligned to the mouse reference genome (GRCm39) using HISAT2 (v2.2.1). Gene-level read counts were quantified using featureCounts (v2.0.1). All samples were processed using the same experimental conditions to minimize batch variation. The mapping rates exceeding 95% for all samples, indicating high-quality sequencing data.
-
Serum β-hydroxybutyrate levels were measured in 19 mice (PBS control group, n = 9; PM2.5-exposed group, n = 10). The normality of serum β-hydroxybutyrate levels was assessed using the Shapiro–Wilk test. Given that the data were not normally distributed, comparisons were performed using the Mann–Whitney U test. A two-sided P-value < 0.05 was considered statistically significant. To strengthen the interpretation of the results beyond p-values, the Hodges–Lehmann estimate for the difference in location alongside 95% confidence intervals (CIs) are reported. Additionally, the effect size (r) was calculated (r = $ Z/\sqrt{N} $) to quantify the magnitude of the observed effects (categorized as small < 0.3, moderate: 0.50–0.70, large ≥ 0.70).
Liver transcriptomic analysis was conducted in 13 mice (PM2.5-exposed group, n = 6; PBS control group, n = 7). Differentially expressed genes (DEGs) following PM2.5 exposure were determined. Gene expression levels were initially represented by unnormalized raw counts, defined as the number of reads mapped to per gene. Genes were excluded if they had fewer than 10 raw counts or if counts per million (CPM) were < 1 in more than half of the samples in each group[14]. After filtering, 11,842 genes were retained for downstream liver transcriptome analysis. Specifically, principal component analysis (PCA) was firstly conducted to assess with-in-group consistency and between-group separation based on the top 500 Variance Stabilizing Transformation-normalized genes with the highest variance. Differential expression analysis was performed using DESeq2 (version: 1.48.2) based on raw counts[18]. To control for multiple testing, p-values were adjusted using the Benjamini–Hochberg false discovery rate (FDR)[19]. Fold change (FC) between treatment and control groups was also calculated on a linear scale. Genes with FC > 1.50 or < 0.66 and FDR < 0.01 were considered differentially expressed and visualized using volcano plots. Gene Ontology (GO) enrichment and Kyoto Encyclopedia of Genes and Genomes (KEGG) pathway analyses were performed using the clusterProfiler package (version: 4.16.0) to identify biological significances. Finally, to identify potential candidate genes linking PM2.5 exposure to elevated ketone bodies, Spearman’s rank correlation analysis between all DEGs (FC > 1.50 or < 0.66 and FDR < 0.01) and serum β-hydroxybutyrate levels among the 13 mice were performed. To balance the risk of false positives with the retention of plausible biological signals in this analysis, an unadjusted P-value < 0.05 threshold was applied for prioritization. Genes meeting this criterion were considered putative associations requiring further functional validation. All analyses were performed using R (version 4.5.1).
-
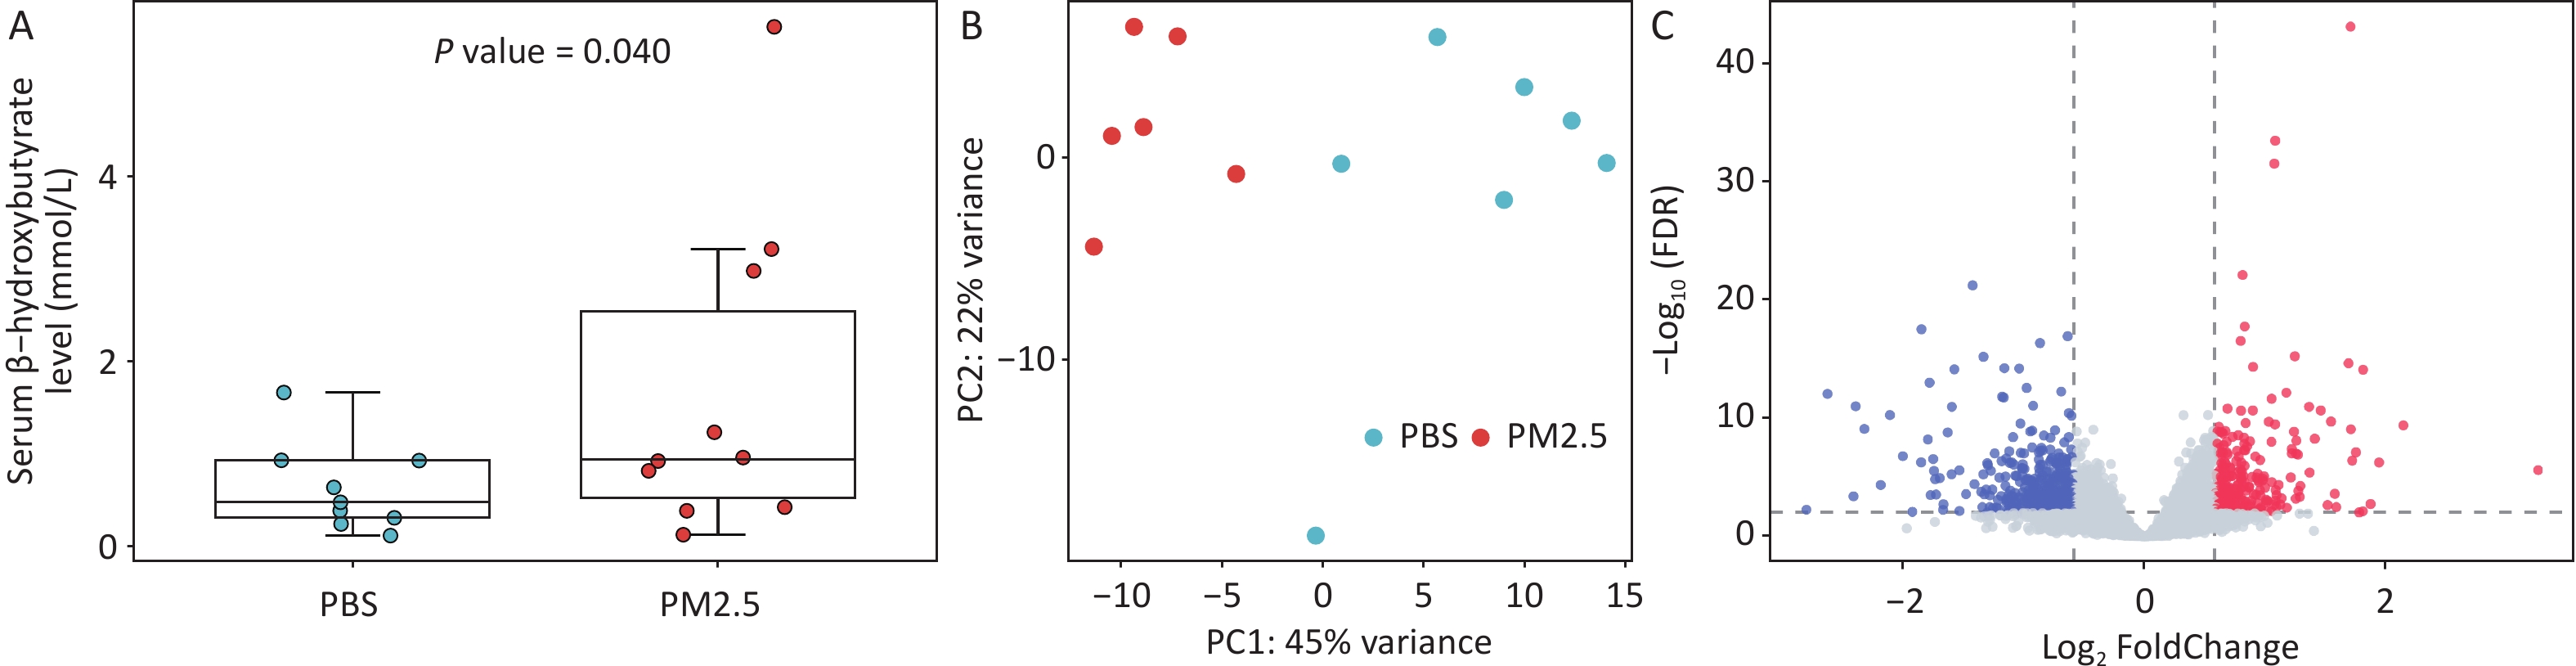
No significant differences in baseline body weight were observed between groups. Throughout the 3-day exposure period, all animals survived, and changes in body weight remained comparable between the PM2.5-exposed and control groups (P > 0.05; Supplementary Table S1). A significant elevation in serum ketone body levels was seen in the PM2.5-exposed group (median = 0.94 mmol/L; mean = 1.66 mmol/L) compared to the controls (median = 0.43 mmol/L; mean = 0.63 mmol/L) (Figure 1A). PCA further demonstrated distinct transcriptomic profiles between the two groups, with inter-group variation clearly exceeding intra-group variation (Figure 1B). Differential expression analysis identified 651 genes significantly altered following PM2.5 exposure, including 234 upregulated and 417 downregulated genes (Figure 1C). A complete list of these DEGs is provided in Supplementary Table S2.

Figure 1. Effect of PM2.5 exposure on serum ketone bodies and liver transcriptome. (A) Circulating ketone bodies, n = 9 or 10 per group; (B) Principal component analysis for liver transcriptome. Red circles refer to mice in PM2.5 group, and blue circles refer to mice in PBS group. n = 6-7 per group; (C) Volcano plot for the liver transcriptome following PM2.5 exposure. Red, blue, and gray circles refer to up-regulated (FDR < 0.01 & fold change > 1.5), down-regulated (FDR < 0.01 & fold change < 2/3), and unchanged genes, respectively, after PM2.5 exposure. PBS, phosphate-buffered saline; PM2.5, fine particulate matter; FDR, false discovery rate.
-
A total of 573 GO terms were significantly enriched following PM2.5 exposure, including 481 biological processes, 70 molecular functions, and 22 cellular components (Supplementary Table S3). For biological processes, the top 20 enriched terms indicated that DEGs were largely related to lipid metabolism and inflammatory immune responses. Affected pathways included fatty acid metabolism, carboxylic acid biosynthesis, organic acid biosynthesis, steroid metabolism, monocarboxylic acid biosynthesis, and fatty acid biosynthesis (Table 1). The top 20 terms of molecular function were mostly related to energy metabolism and redox activity, such as oxidoreductase activity, monooxygenase activity, heme binding, and sulfur compound binding (Table 2). For cellular components, the top 20 enriched terms were primarily related to membrane and organelle structures, including endoplasmic reticulum membrane, intrinsic and integral component of endoplasmic reticulum membrane, intrinsic and integral component of organelle membrane, protein-lipid complex, basement membrane and membrane raft (Table 3). KEGG pathway analysis identified 21 significantly enriched pathways, the majority were related to lipid synthesis and metabolism. These included fatty acid metabolism, steroid biosynthesis, biosynthesis of unsaturated fatty acids, and the peroxisome proliferators-activated receptors (PPAR) signaling pathway (Table 4).
ID Biological processes FDR Count GO:0006631 Fatty acid metabolic process < 0.001 51 GO:0046394 Carboxylic acid biosynthetic process < 0.001 37 GO:0016053 Organic acid biosynthetic process < 0.001 37 GO:0008202 Steroid metabolic process < 0.001 40 GO:0072330 Monocarboxylic acid biosynthetic process < 0.001 30 GO:0032103 Positive regulation of response to external stimulus < 0.001 38 GO:0006633 Fatty acid biosynthetic process < 0.001 21 GO:1901617 Organic hydroxy compound biosynthetic process < 0.001 26 GO:0006695 Cholesterol biosynthetic process < 0.001 13 GO:1902653 Secondary alcohol biosynthetic process < 0.001 13 GO:0006066 Alcohol metabolic process < 0.001 32 GO:0001676 Long-chain fatty acid metabolic process < 0.001 18 GO:0006694 Steroid biosynthetic process < 0.001 21 GO:0016126 Sterol biosynthetic process < 0.001 13 GO:1902652 Secondary alcohol metabolic process < 0.001 20 GO:0006790 Sulfur compound metabolic process < 0.001 30 GO:0042060 Wound healing < 0.001 32 GO:0120254 Olefinic compound metabolic process < 0.001 20 GO:0046889 Positive regulation of lipid biosynthetic process < 0.001 16 GO:0046890 Regulation of lipid biosynthetic process < 0.001 22 Note. FDR < 0.05 were considered statistically significant. GO, Gene Ontology; PM2.5, fine particulate matter; FDR, false discovery rate. Table 1. Top 20 pathways of biological processes enriched by the differentially expressed genes following PM2.5 exposure
ID Molecular function FDR Count GO:0016705 Oxidoreductase activity, acting on paired donors, with Incorporation or reduction of molecular oxygen < 0.001 31 GO:0016717 Oxidoreductase activity, acting on paired donors, with Oxidation of a pair of donors resulting in the reduction of molecular oxygen to two molecules of water < 0.001 8 GO:0004497 Monooxygenase activity < 0.001 21 GO:0020037 Heme binding < 0.001 19 GO:1901681 Sulfur compound binding < 0.001 26 GO:0046906 Tetrapyrrole binding < 0.001 19 GO:0005506 Iron ion binding < 0.001 19 GO:0008395 Steroid hydroxylase activity < 0.001 11 GO:0016712 Oxidoreductase activity, acting on paired donors, with incorporation or reduction of molecular oxygen, reduced flavin or flavoprotein as one donor, and incorporation of one atom of oxygen < 0.001 11 GO:0016709 Oxidoreductase activity, acting on paired donors, with incorporation or reduction of molecular oxygen, NAD(P)H as one donor, and incorporation of one atom of oxygen < 0.001 10 GO:0101021 Estrogen 2-hydroxylase activity 0.002 5 GO:0030246 Carbohydrate binding 0.002 21 GO:0005496 Steroid binding 0.002 13 GO:0048029 Monosaccharide binding 0.002 11 GO:0005201 Extracellular matrix structural constituent 0.003 14 GO:0033218 Amide binding 0.004 27 GO:0043295 Glutathione binding 0.004 5 GO:0070643 Vitamin D 25-hydroxylase activity 0.004 4 GO:1900750 Oligopeptide binding 0.005 5 GO:0052689 Carboxylic ester hydrolase activity 0.005 14 Note. FDR < 0.05 were considered statistically significant. GO, Gene Ontology; PM2.5, fine particulate matter; FDR, false discovery rate. Table 2. Top 20 pathways of molecular function enriched by the differentially expressed genes following PM2.5 exposure
ID Cell composition FDR Count GO:0062023 Collagen-containing extracellular matrix 0.001 29 GO:0031227 Intrinsic component of endoplasmic reticulum membrane 0.009 15 GO:0030176 Integral component of endoplasmic reticulum membrane 0.013 14 GO:0031301 Integral component of organelle membrane 0.014 24 GO:0031300 Intrinsic component of organelle membrane 0.014 25 GO:0005583 Fibrillar collagen trimer 0.014 4 GO:0098643 Banded collagen fibril 0.014 4 GO:0032994 Protein-lipid complex 0.022 7 GO:0005604 Basement membrane 0.023 11 GO:0045121 Membrane raft 0.025 23 GO:0098857 Membrane microdomain 0.025 23 GO:0033116 Endoplasmic reticulum-Golgi intermediate Compartment membrane 0.025 4 GO:0022626 Cytosolic ribosome 0.025 10 GO:0005777 Peroxisome 0.025 12 GO:0042579 Microbody 0.025 12 GO:0045171 Intercellular bridge 0.040 9 GO:0034358 Plasma lipoprotein particle 0.040 6 GO:1990777 Lipoprotein particle 0.040 6 GO:0009925 Basal plasma membrane 0.040 17 GO:0098644 Complex of collagen trimers 0.040 4 Note. FDR < 0.05 were considered statistically significant. GO, Gene Ontology; PM2.5, fine particulate matter; FDR, false discovery rate. Table 3. Top 20 pathways of cell composition enriched by the differentially expressed genes following PM2.5 exposure
ID KEGG pathways FDR Count mmu00100 Steroid biosynthesis < 0.001 8 mmu01040 Biosynthesis of unsaturated fatty acids < 0.001 9 mmu03320 PPAR signaling pathway < 0.001 14 mmu00480 Glutathione metabolism 0.004 11 mmu04979 Cholesterol metabolism 0.004 9 mmu01212 Fatty acid metabolism 0.004 10 mmu00983 Drug metabolism - other enzymes 0.004 12 mmu05417 Lipid and atherosclerosis 0.005 20 mmu01524 Platinum drug resistance 0.005 11 mmu00830 Retinol metabolism 0.006 12 mmu05204 Chemical carcinogenesis - DNA adducts 0.006 11 mmu00982 Drug metabolism - cytochrome P450 0.006 10 mmu05418 Fluid shear stress and atherosclerosis 0.007 15 mmu00061 Fatty acid biosynthesis 0.01 5 mmu04115 p53 signaling pathway 0.025 9 mmu00980 Metabolism of xenobiotics by cytochrome P450 0.026 9 mmu05207 Chemical carcinogenesis - receptor activation 0.028 18 mmu04650 Natural killer cell mediated cytotoxicity 0.028 12 mmu04936 Alcoholic liver disease 0.029 13 mmu00591 Linoleic acid metabolism 0.029 7 Note. FDR < 0.05 were considered statistically significant. KEGG, Kyoto Encyclopedia of Genes and Genomes; PM2.5, fine particulate matter; FDR, false discovery rate. Table 4. Top 20 KEGG pathways enriched by the differentially expressed genes following PM2.5 exposure
-
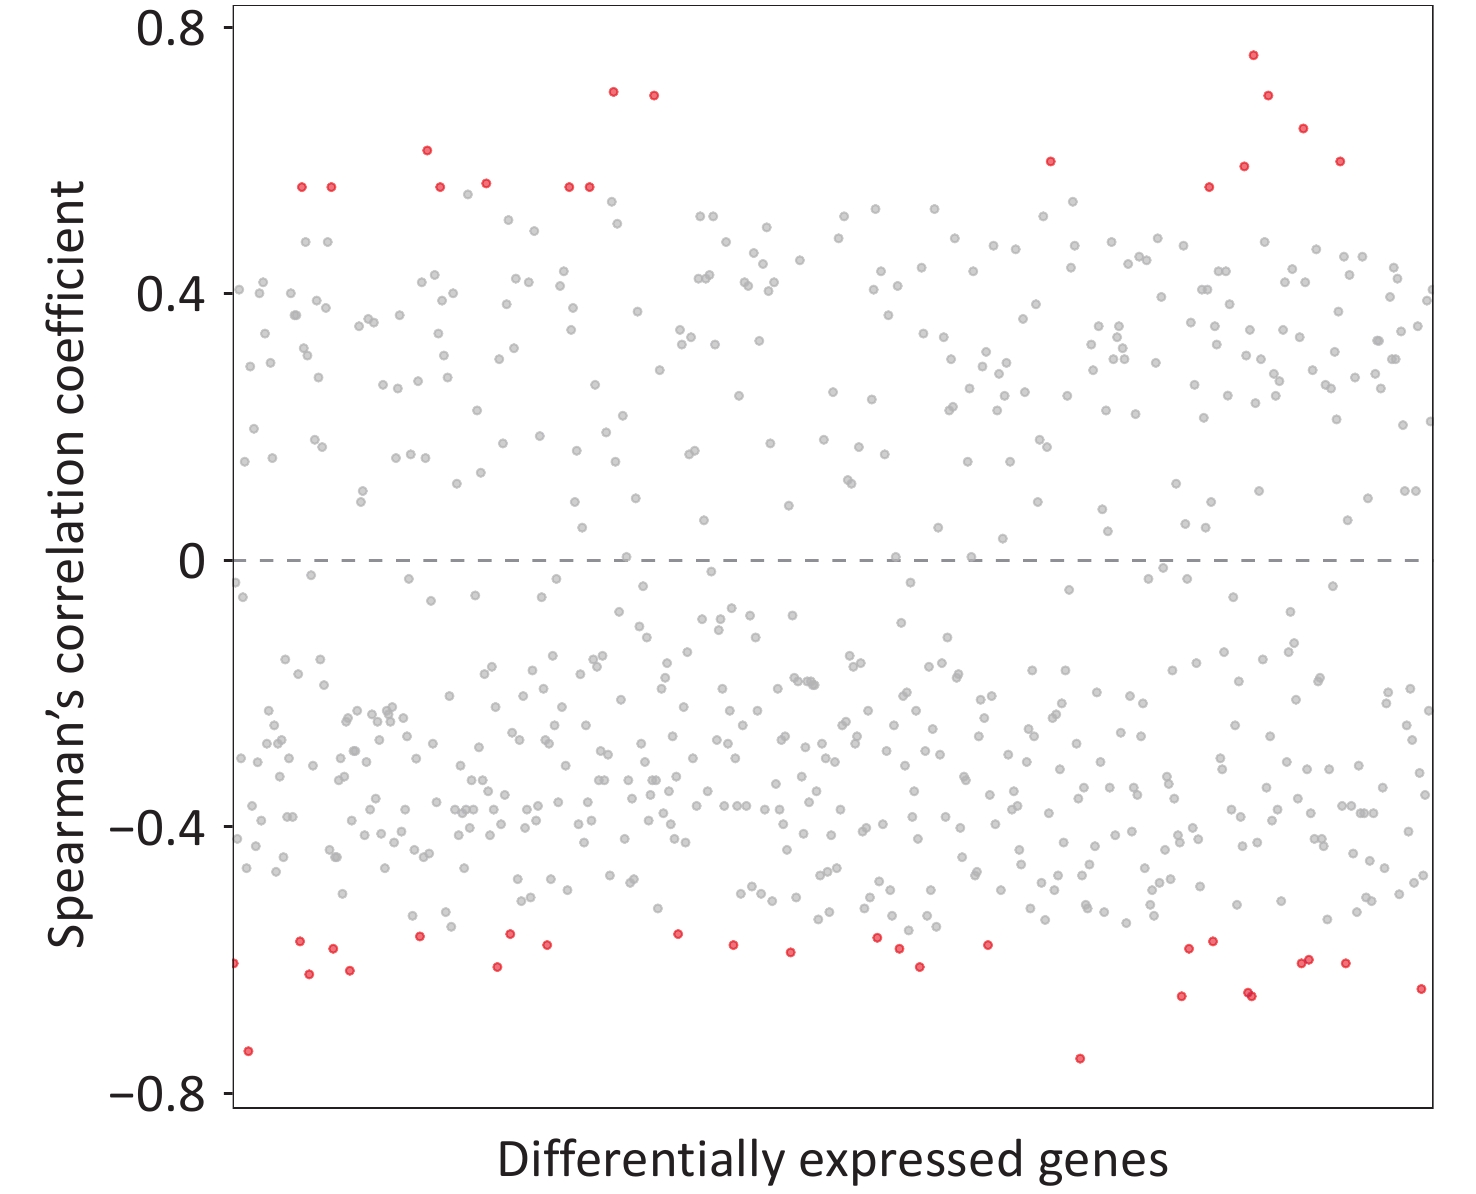
We identified 43 DEGs that significantly correlated with serum β-hydroxybutyrate level, including 16 with positive and 27 with negative correlations (Figure 2). The absolute correlation coefficients ranged from 0.56 to 0.76, indicating moderate to strong associations (Figure 2; Table 5). As summarized in Table 5, these genes were primarily involved in lipid and carbohydrate metabolism, insulin resistance, inflammation, and immune response (Supplementary Table S3; Table 4).
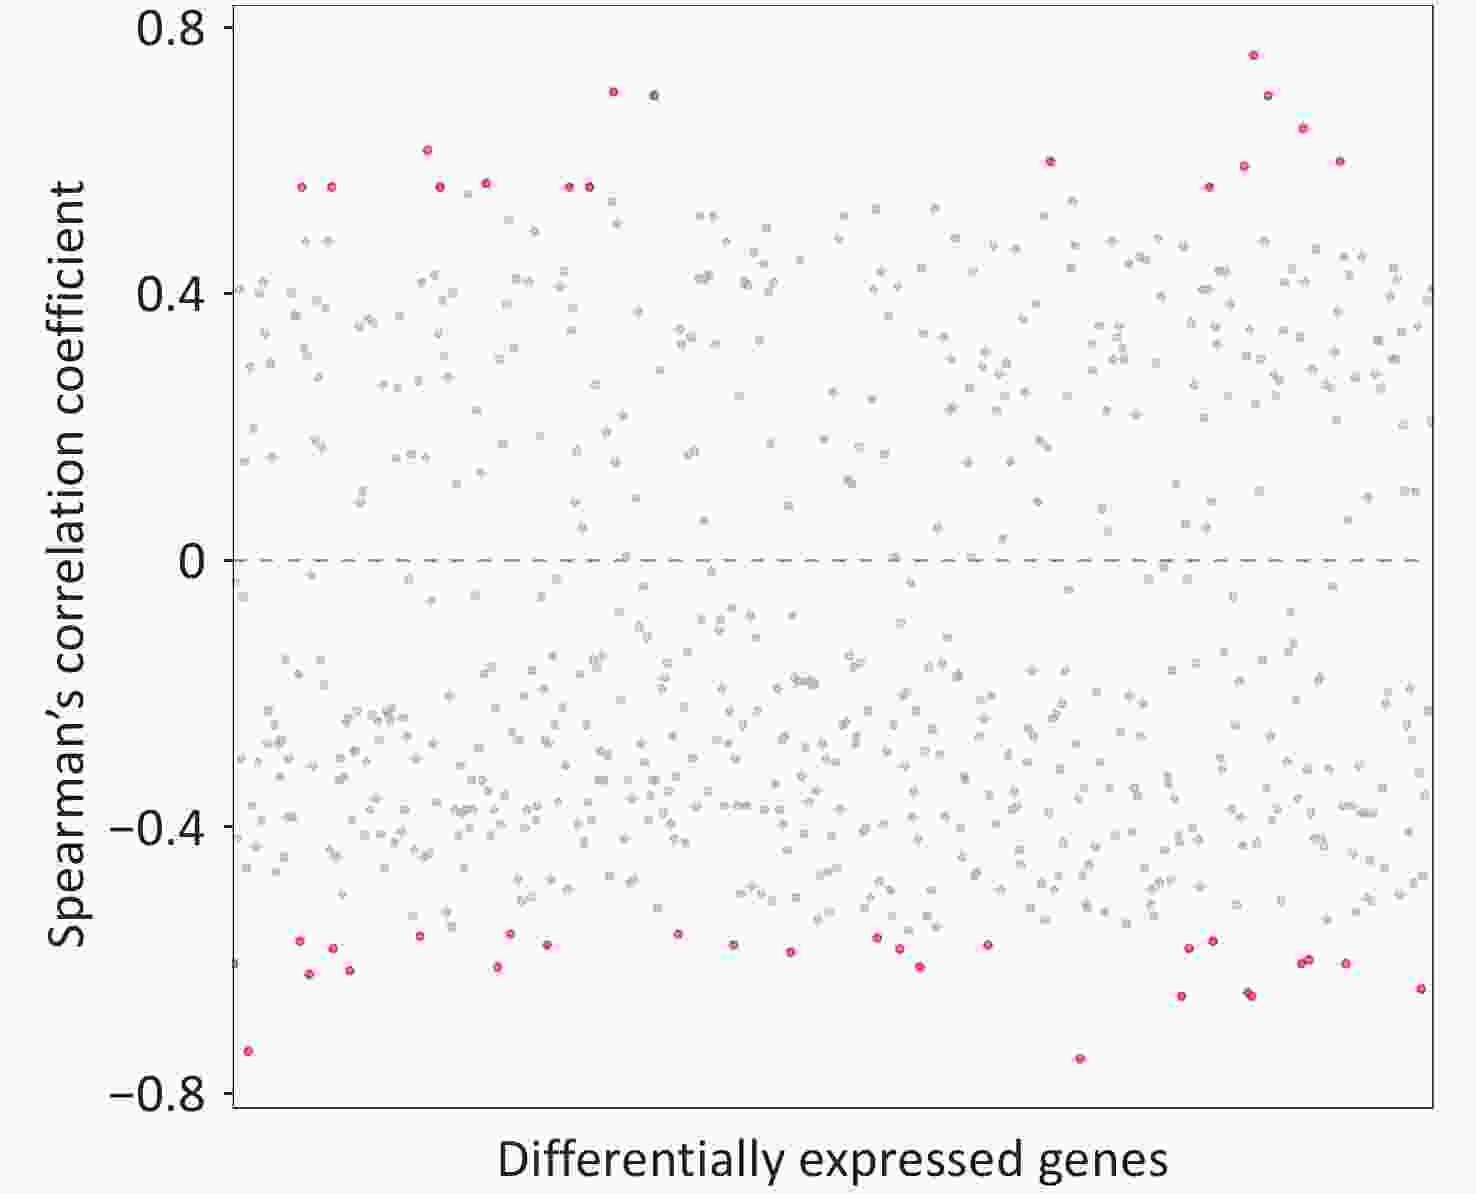
Figure 2. The Spearman’s correlation between serum ketone bodies and differentially expressed genes. Each dot represents a differentially expressed genes, with red indicating statistically significant correlation between (P < 0.05) serum ketone bodies and differentially expressed genes, and gray indicating non-significant correlation.
ID Gene name Chang following PM2.5 exposure r * P value Lipid metabolism ENSMUSG00000060675 Plaat3 Up 0.76 0.004 ENSMUSG00000060131 Atp8b4 Down −0.65 0.020 ENSMUSG00000008035 Mid1ip1 Down −0.62 0.027 ENSMUSG00000020776 Fbf1 Up 0.62 0.029 ENSMUSG00000029553 Tfec Down −0.58 0.043 ENSMUSG00000056220 Pla2g4a Down −0.57 0.045 ENSMUSG00000022092 Ppp3cc Up 0.57 0.047 ENSMUSG00000022816 Fstl1 Down −0.56 0.050 ENSMUSG00000021135 Slc10a1 Up 0.56 0.050 ENSMUSG00000025260 Hsd17b10 Up 0.56 0.050 ENSMUSG00000015224 Cyp2j9 Up 0.56 0.050 Glucose metabolism and insulin resistance ENSMUSG00000043013 Onecut1 Down −0.75 0.005 ENSMUSG00000016494 Cd34 Down −0.62 0.029 ENSMUSG00000068083 Cyp2d40 Down −0.6 0.032 ENSMUSG00000000058 Cav2 Down −0.6 0.032 ENSMUSG00000068762 Gstm6 Down −0.6 0.034 ENSMUSG00000034785 Dio1 Down −0.58 0.040 ENSMUSG00000039005 Tlr4 Down −0.58 0.043 Inflammation ENSMUSG00000027360 Hdc Up 0.70 0.010 ENSMUSG00000060441 Trim5 Down −0.65 0.018 ENSMUSG00000022360 Atad2 Down −0.61 0.030 ENSMUSG00000059970 Hspa2 Up 0.59 0.033 ENSMUSG00000028037 Ifi44 Down −0.56 0.050 ENSMUSG00000056054 S100a8 Up 0.56 0.050 Others ENSMUSG00000001143 Lman2l Down −0.74 0.006 ENSMUSG00000026525 Opn3 Up 0.70 0.010 ENSMUSG00000062794 Zfp599 Up 0.70 0.010 ENSMUSG00000053886 Sh2d4a Down −0.65 0.018 ENSMUSG00000068101 Cenpm Up 0.65 0.020 ENSMUSG00000105096 Gbp10 Down −0.64 0.021 ENSMUSG00000035910 Dcdc2a Down −0.61 0.030 ENSMUSG00000073678 Pgap1 Down −0.60 0.032 ENSMUSG00000040767 Snrnp25 Up 0.60 0.034 ENSMUSG00000072964 Bhlhb9 Up 0.60 0.034 ENSMUSG00000030956 Fam53b Down −0.59 0.038 ENSMUSG00000015340 Cybb Down −0.58 0.040 ENSMUSG00000054404 Slfn5 Down −0.58 0.040 ENSMUSG00000024691 Fam111a Down −0.58 0.043 ENSMUSG00000020681 Ace Down −0.56 0.045 ENSMUSG00000006219 Fblim1 Down −0.57 0.045 ENSMUSG00000033792 Atp7a Down −0.57 0.047 ENSMUSG00000006241 Ccdc159 Up 0.56 0.050 ENSMUSG00000026035 Ppil3 Up 0.56 0.050 Note. P values < 0.05 were considered statistically significant. *, the correlation coefficients between ketone bodies and differentially expressed genes. PM2.5, fine particulate matter. Table 5. Details of differentially expressed genes that significantly altered by PM2.5 exposure and associated with serum ketone bodies
-
This study supports previous epidemiological findings linking short-term PM2.5 exposure to DKA. We observed significantly elevated serum ketone bodies in T2D mice following PM2.5 exposure. Transcriptomic profiling of liver tissue revealed substantial alterations in gene expression induced by PM2.5. Importantly, a subset of these DEGs, particularly those involved in glycolipid metabolism, showed significant correlations with serum ketone body levels. Together, these findings support the hypothesis that acute PM2.5 exposure exacerbates diabetes and drives ketogenesis through disruption of hepatic glycolipid metabolic processes.
Although more studies have shown exacerbated diabetes in association with acute exposure to PM2.5, animal models supporting theses finding have been limited. Previous studies on mechanism of action have focused on the chronic effects of PM2.5 on glucose metabolism. For example, Rajagopalan et al.[20] reported that long-term exposure of C57BL/6J mice to high concentrations of PM2.5 for 14 weeks impaired glucose tolerance and insulin sensitivity, accompanied by marked transcriptomic alterations in liver, adipose, and muscle tissues. Similarly, Liu et al.[21] found that diabetic mice exposed to PM2.5 for 4–8 weeks exhibited disrupted energy metabolism, reduced insulin sensitivity, and impaired glucose tolerance, with activation of inhibitor of nuclear factor kappa-B kinase subunit beta (IKK-β) as a potential cause. A few epidemiological and toxicological studies have reported the acute effects of air pollution on glucose metabolism with inconsistent results[22-24]. For example, several panel studies reported that short-term exposure to PM2.5 is associated with imbalances in glucose and insulin homeostasis[22,23]. Whereas, a toxicological study reported no changes in blood glucose levels following acute exposure to PM2.5[24]. Importantly, the acute exacerbation of diabetes is often driven by the development of severe complications, rather than merely fluctuations in blood glucose. Therefore, it is essential to investigate the mechanisms by which PM2.5 exposure may affect acute diabetic complications, such as DKA. This exploration is crucial for establishing a biological rationale underlying how short-term PM2.5 exposure leads to the acute deterioration of diabetes.
Currently, limited studies have investigated the associations between air pollution and ketone bodies[25,26]. In diabetic mouse models, circulating β-hydroxybutyrate levels are typically below 1.0 mmol/L under physiological conditions. In our study, PM2.5 exposure induced a pronounced right-skewed increase in β-hydroxybutyrate levels (median: 0.90 mmol/L; mean: 1.66 mmol/L), indicating that a subset of diabetic mice developed ketosis approaching metabolic decompensation following exposure. In contrast, the control group remained metabolically stable (median: 0.52 mmol/L; mean: 0.63 mmol/L). These results align with earlier findings in wild-type mice, where PM2.5 exposure elevated ketone body levels in serum[26] and in cardiac tissue[27], particularly after exposure to water-soluble PM2.5 components[26]. Conversely, another study reported reduced hepatic ketone bodies following intratracheal exposure to PM2.5[25]. These discrepancies may be related to differences in mouse model backgrounds, exposure route, or PM2.5 components. Furthermore, our study identified a number of genes that may play a significant role in PM2.5-induced ketogenesis, most of which are involved in carbohydrate and lipid metabolism, inflammatory responses, and related biological processes.
This study reports that PM2.5 exposure altered lipid metabolism pathways, particularly by shifting the hepatic balance toward fatty acid mobilization and mitochondrial β-oxidation. Enhanced breakdown of hepatic- and phosphor-lipids provide an abundant supply of free fatty acids (FFAs), which serve as the primary substrates for ketone body production. The upregulation of mitochondrial β-oxidation pathways also accelerates the conversion of these FFAs into acetyl-CoA, the direct precursor for ketogenesis. These findings contrast with other recent evidence suggesting that short-term PM2.5 exposure may inhibit lipolysis and fatty acid oxidation in the livers of wild-type mice[28]. That evidence indicated that increased lipolysis and fatty acid oxidation occur only after long-term exposure, possibly as an adaptive response[28]. Of note, we observed such enhancement even after short-term exposure in our study. This discrepancy may be attributable to differences in mouse models, route of exposure or PM2.5 composition. Although the exact molecular mediators require further validation, transcriptomic data reported here highlights several candidate genes that warrant further study through targeted mechanistic approaches. For instance, the upregulation of hydroxysteroid (17-beta) dehydrogenase 10 (Hsd17b10) and cytochrome P450, family 2, subfamily j, polypeptide 9 (Cyp2j9) could potentially facilitate mitochondrial fatty acid β-oxidation[29,30].
Beyond lipid oxidation, pathways involved in intra- and intercellular lipid transport may also play a role in regulating ketogenesis[31], as suggested by altered gene expression we identified that link PM2.5 exposure to elevated ketone body levels. For example, Mid1 interacting protein 1 (Mid1ip1), an upstream regulator of acetyl-CoA carboxylase (ACC), normally promotes fatty acid carboxylation, thereby restricting entry into mitochondria β-oxidation[32]. We observed that PM2.5 exposure suppressed Mid1ip1 expression that also negatively correlated with ketone body levels, suggesting reduced Mid1ip1 may lower ACC activity and subsequently facilitate mitochondrial fatty acid β-oxidation, ultimately enhancing ketone body production. Also found were genes related to glucose metabolism and insulin function that may mediate the relationship between PM2.5 and ketogenesis, such as one cut domain, family member 1 (Onecut1), cytochrome P450, family 2, subfamily d, polypeptide 40 (Cyp2d40) and glutathione S-transferase, mu 6 (Gstm6)[33-35]. Normally, hepatic insulin signaling promotes glycolysis and lipogenesis. When signaling is impaired following PM2.5 exposure[36,37], normal energy pathways are compromised, and fatty acid oxidation is accelerated as an alternative energy source, leading to increased ketone body production. Inflammation is also reported to exacerbate localized insulin resistance and disrupt glucose metabolism[38]. Here the finding that PM2.5 exposure appears to activate inflammatory cascades, as suggested by DEGs such as histidine decarboxylase (Hdc) and ATPase family, AAA domain containing 2 (Atad2)[39,40], alongside with targets like lectin, mannose-binding 2-like (Lman2l), opsin 3 (Opn3), zinc finger protein 599 (Zfp599), and SH2 domain containing 4A (Sh2d4a), whose roles in metabolism remain to be fully elucidated, suggests further study is needed.
It is important to note that ketosis is a multi-organ metabolic disruption. While our transcriptomic analysis focused on the liver as the primary site of ketogenesis, PM2.5 exposure likely exerts systemic effects. For instance, systemic inflammation induced by PM2.5 may exacerbate insulin resistance and trigger lipolysis in adipose tissue, releasing excessive FFAs into the circulation to serve as substrates for hepatic ketogenesis[41]. Additionally, PM2.5 might impair the utilization of ketone bodies in peripheral tissues, such as skeletal muscle[42]. Future studies analyzing multi-organ transcriptomics are needed to fully elucidate the systemic mechanisms mediating PM2.5-induced ketosis.
The major strength of this study is that it provides biological plausibility for the association between short-term PM2.5 exposure and acute exacerbation of diabetes. The non-targeted transcriptomic profiling further yielded valuable insights for future mechanistic investigations. Nevertheless, several limitations should be noted. First, PM2.5 exposure was administered via intratracheal instillation rather than in an inhalation chamber. Although intratracheal exposure is widely used in short-term toxicology studies, it does not fully replicate the natural inhalation process, and replication using inhalation chambers is warranted. Second, the effects of PM2.5 may vary depending on composition. For example, water-soluble PM2.5 components, rather than insoluble components, were found to increase serum ketone body levels in wild-type mice[26]; Liu et al.[43] revealed that exposure to PM2.5 enriched with metals such as Mn, Cu, and Ni may cause significant hepatic mitochondrial damage. In the present study, the effects of individual PM2.5 components on ketogenesis were not characterized due to lack of relevant data. Therefore, the generalizability of our findings to PM2.5 from other regions or sources should be interpreted with caution. Third, while our study observed significantly elevated serum β-hydroxybutyrate levels indicating ketosis, we did not evaluate blood pH or bicarbonate levels. Clinically, DKA is defined by the triad of hyperglycemia, ketosis, and metabolic acidosis. Therefore, current findings primarily demonstrate that PM2.5 exacerbates ketosis, rather than confirming the development of DKA. Future studies incorporating comprehensive blood gas analyses are needed to confirm the occurrence of metabolic acidosis. Fourth, only male mice were used to minimize confounding variance from estrous cycle fluctuations. Future investigations should include both sexes to elucidate any sex-specific effects of PM2.5 on ketone body metabolism. Fifth, the present investigation relied on transcriptomic data using RNA sequencing that provides valuable insights into pathway alterations, the functional consequences of the observed gene expression changes require further validation at the protein and functional levels. Finally, the mouse model used here exhibits profound dysregulation of glycolipid metabolism, which may limit the generalizability of the observed metabolic abnormalities following PM2.5 exposure. However, this model was deliberately chosen to mimic advanced diabetes and thus fits the objective of testing whether PM2.5 exacerbates the disease. Moreover, the only difference between exposed and control groups was PM2.5 exposure, making it reasonable to attribute the observed differences to this exposure.
In conclusion, building on prior epidemiological evidence, we demonstrated that short-term exposure to PM2.5 may precipitate ketogenesis in diabetic individuals by altering hepatic transcriptomic profiles related to fatty acid oxidation, lipogenesis, lipid transport, glucose metabolism, and inflammation. Our study provides novel experimental evidence supporting the biological plausibility of the link between acute PM2.5 exposure and exacerbation of diabetes, highlighting potential molecular pathways through which air pollution can acutely aggravate disease. Nevertheless, further targeted and mechanistic investigations are warranted to validate and extend these preliminary observations. Clinical samples from T2D patients are needed to confirm these molecular pathways in humans.
HTML
Preparation of PM2.5 Suspensions
Animal Experiment
Measurements of Circulating Ketone Bodies
Liver Tissue Harvest, RNA Isolation and Sequencing
Statistical Analysis
Transcriptomic Alterations Following PM2.5 Exposure
Pathways in Relation to PM2.5 Exposure
Correlations between DEGs and Serum β-hydroxybutyrate
Competing Interests All authors declare no competing interests.
Authors’ Contributions Conceived and designed the study, acquired funding and revised the manuscript: Renjie Chen; Performed the experiments, investigation, formal analysis, and drafted the original manuscript: Huihuan Luo and Yuanting Xie; All authors reviewed and edited the manuscript. All authors had full access to all the data in the study. All authors have final responsibility for the decision to submit for publication.
&These authors contributed equally to this work.

 Quick Links
 DownLoad: