-
The recent global pandemic highlighted the profound societal challenges posed by the transmission of infectious diseases[1]. Particularly in densely populated and highly mobile environments, the rapid spread of infectious diseases and difficulty in implementing effective control measures have placed significant pressure on public health systems. Traditional prevention strategies, which are often reliant on fixed parameters and macro-level models, struggle to address the complexities of real-world scenarios, in which individual behaviors are dynamic and diverse. These challenges are further compounded by the influence of spatial environments and social interaction patterns, which play critical roles in shaping the transmission dynamics[2].
Research surveys have indicated that people spend most of their time indoors[3] in environments such as homes, offices, schools, shops, restaurants, and theaters. These spaces, which are characterized by a high population density and limited ventilation, frequently become hotspots for pathogen transmission and exposure, posing significant risks to public health through epidemics and daily infections[4]. To effectively mitigate outbreaks in high-density indoor environments, public health research must address three critical scientific questions. 1) What are the micromechanisms of pathogen propagation within enclosed spaces? 2) What is the collaborative threshold between viral detection and isolation intensity? 3) How can we balance the effectiveness of prevention and control with their impact on the daily lives of individuals? Traditional mathematical and macro-level epidemic models that operate on aggregate populations and static transition probabilities inherently struggle to answer these questions because of their inability to capture fine-grained behaviors and localized environmental constraints[5].
To overcome these limitations and address key scientific questions, agent-based modeling (ABM) has emerged as a crucial methodology for studying epidemic dynamics[6]. By simulating individual behaviors and their autonomous interactions, ABM provides detailed insights into transmission pathways at the micro level, while capturing disease spread at the macro level[7]. Crucially, by explicitly integrating fine-grained spatiotemporal relations and quantifying transmission risks based on the exact distance and duration of contact, a spatiotemporal ABM can effectively map the precise micromechanisms of enclosed propagation[8]. This allows researchers to stress-test complex intervention combinations to identify collaborative thresholds and mathematically evaluate methods to minimize disruptions to daily routines while maximizing the containment efficiency.
This study focused on epidemic transmission in a campus setting by constructing an agent-based artificial system grounded in realistic scenarios. This system integrates physical spatial modeling, individual activity planning, disease transmission dynamics, and control strategy simulations to analyze the transmission process in depth. The study provided three main contributions. First, it used fine-grained modeling to uncover the causal relationships between individual behaviors and transmission pathways. Second, this study evaluated the impact of various control measures such as testing, quarantine, and dynamic regulations on transmission reduction, offering valuable insights for optimizing public health strategies. Finally, the integration of micro-level behaviors and macro-level population dynamics enhanced the theoretical depth of epidemic modeling, while providing a practical framework for addressing real-world infectious disease challenges.
-
Infectious disease transmission modeling is a crucial tool for studying patterns of epidemic spread and evaluating the effectiveness of control measures[9]. Researchers have used modeling to determine the mechanisms of epidemic transmission in complex environments and provide scientific support for the design of control strategies[10]. Despite significant progress, limitations remain in simulating the dynamics, individual behavioral heterogeneity, and synergistic effects of multidimensional interventions. This section provides a brief overview of the related research to establish a theoretical foundation for the agent-based intervention strategy modeling investigated in this study.
-
The complexity and dynamic nature of epidemic transmission makes it a critical subject in public health research. Particularly in the context of global pandemics, a deeper understanding of the transmission mechanisms and optimization of control strategies are of significant scientific and practical value. Previous studies on epidemic transmission modeling have primarily adopted traditional mathematical, network-based, and agent-based transmission models, which offer unique perspectives on disease-spread mechanisms[11].
Research leveraging differential equations, network models, and deep-learning algorithms has provided the essential theoretical foundations and technical support for understanding infectious-disease transmission. Differential equation models, such as the classical susceptible-infectious-recovered (SIR) model and its extensions, define the dynamic relationships between different population groups and effectively capture macro-level transmission trends. However, these models typically assume homogeneity among individuals, limiting their ability to represent individual heterogeneity and the impact of complex behavioral rules. To address these limitations, researchers have proposed extensions, such as the SEIR (Susceptible, Exposed, Infected, Recovered) and spatial SEIR models[12]. Nevertheless, these models, which operate at the population level, struggle to capture the detailed individual-level transmission dynamics.
Network models represent individuals as nodes and their contacts as edges, using the topology of complex networks to simulate the transmission processes[13]. These models are effective in identifying critical nodes and transmission pathways[14]. However, these methods often assume relatively static network structures, making them suitable primarily for evaluating specific transmission paths and key nodes[15]. To address these limitations, researchers have proposed dynamic network models that incorporate temporal dimensions to capture network structural changes over time[16]. Additionally, Perra et al. introduced time-dependent contact patterns to simulate the epidemic spread in time-varying networks[17]. Although these advancements have enhanced the ability of network models to describe dynamic transmission patterns, they still face challenges when accounting for multifactorial interactions in complex environments.
In recent years, deep-learning algorithms have been increasingly used for epidemic transmission prediction[18]. By learning from multimodal data (e.g., time series and population mobility data), these methods achieve high predictive accuracy[19]. For instance, Fritz et al. developed a COVID-19 forecasting framework[13], which accurately predicted case numbers using time-series data, whereas Hu et al. utilized population mobility data to forecast the geographic spread of epidemics[14]. Despite their strengths in capturing complex nonlinear patterns, deep-learning models rely heavily on large-scale, high-quality datasets and lack sufficient explanatory power for the mechanisms[20]. This makes them less effective for directly guiding or evaluating control strategies. Specifically, deep-learning algorithms excel at producing predictive results but struggle to model the dynamic effects of policy interventions (e.g., isolation and mass testing) and how such measures influence the transmission processes.
In contrast, ABM provides a means to overcome these limitations by simulating individual behavioral rules and dynamic interactions. ABM not only captures individual-level transmission pathways in fine detail, but also incorporates heterogeneity[21], spatial characteristics[22], and intervention strategies[23] dynamically into the model. This approach avoids the homogeneity assumptions of traditional models and flexibly integrates real-world scenarios, such as constructing physical spatial layouts using geographic information system (GIS) data and stochastic factors, to enhance the adaptability to complex environments. Moreover, ABM offer strong scalability, enabling the dynamic integration of multidimensional constraints. For example, by defining agent behaviors and state transitions[24] (e.g., isolation[25], mass testing[26], and mobility restrictions[27]), ABM can adjust individual actions in real-time to reflect the effects of various control strategies. Compared with traditional methods, ABM excels in bridging micro-level behaviors with macro-level dynamics, offering novel solutions for studying epidemic transmission in complex environments.
-
Although progress has been made in modeling infectious-disease transmission, dynamic simulations and evaluations of control measures remain limited. Research has focused on intervention methods such as regional lockdowns, social distancing, and mass testing, which are crucial for epidemic prevention and control[28].
Gavin et al. utilized the SEIR model to demonstrate that the early implementation of lockdowns significantly delays the epidemic peak and reduces transmission rates[29]. However, such strategies have a substantial economic impact, necessitating more precise implementation approaches. Kuo and Wen showed that zonal quarantine effectively reduces cross-regional transmission[30], making it particularly suitable for the dynamic management of high-risk areas. Zhang et al. employed agent-based models to simulate the effects of gathering restrictions and testing frequencies and found that frequent testing and appropriate restrictions on gatherings are crucial for controlling epidemics[31]. Additionally, Alba et al. examined the effectiveness of combined intervention strategies and demonstrated that dynamically adjusted measures could simultaneously reduce transmission and minimize disruptions to economic and social activities[32]. These studies provide a theoretical foundation for optimizing epidemic prevention and control measures while highlighting the need for further research into dynamic individual behaviors, spatial characteristics, and the synergistic effects of multiple interventions.
Our study enhanced existing epidemic modeling approaches rather than replacing traditional methods. Agent-based modeling complements mathematical and network models and offers a multiperspective framework for epidemic transmission. It flexibly simulates testing, quarantine, and gathering restrictions, and optimizes interventions in contexts such as campuses. Its key advantage lies in its adaptability, enabling the real-time simulation of dynamic strategies and providing comprehensive support for public health decision-making.
-
We developed an agent-based system to simulate individual behaviors and interactions during epidemic transmission. The system models the dynamic relationship between activities and disease spread, and assesses the impact of prevention strategies through fine-grained behavior modeling. As shown in Figure 1A, it comprises four key components.
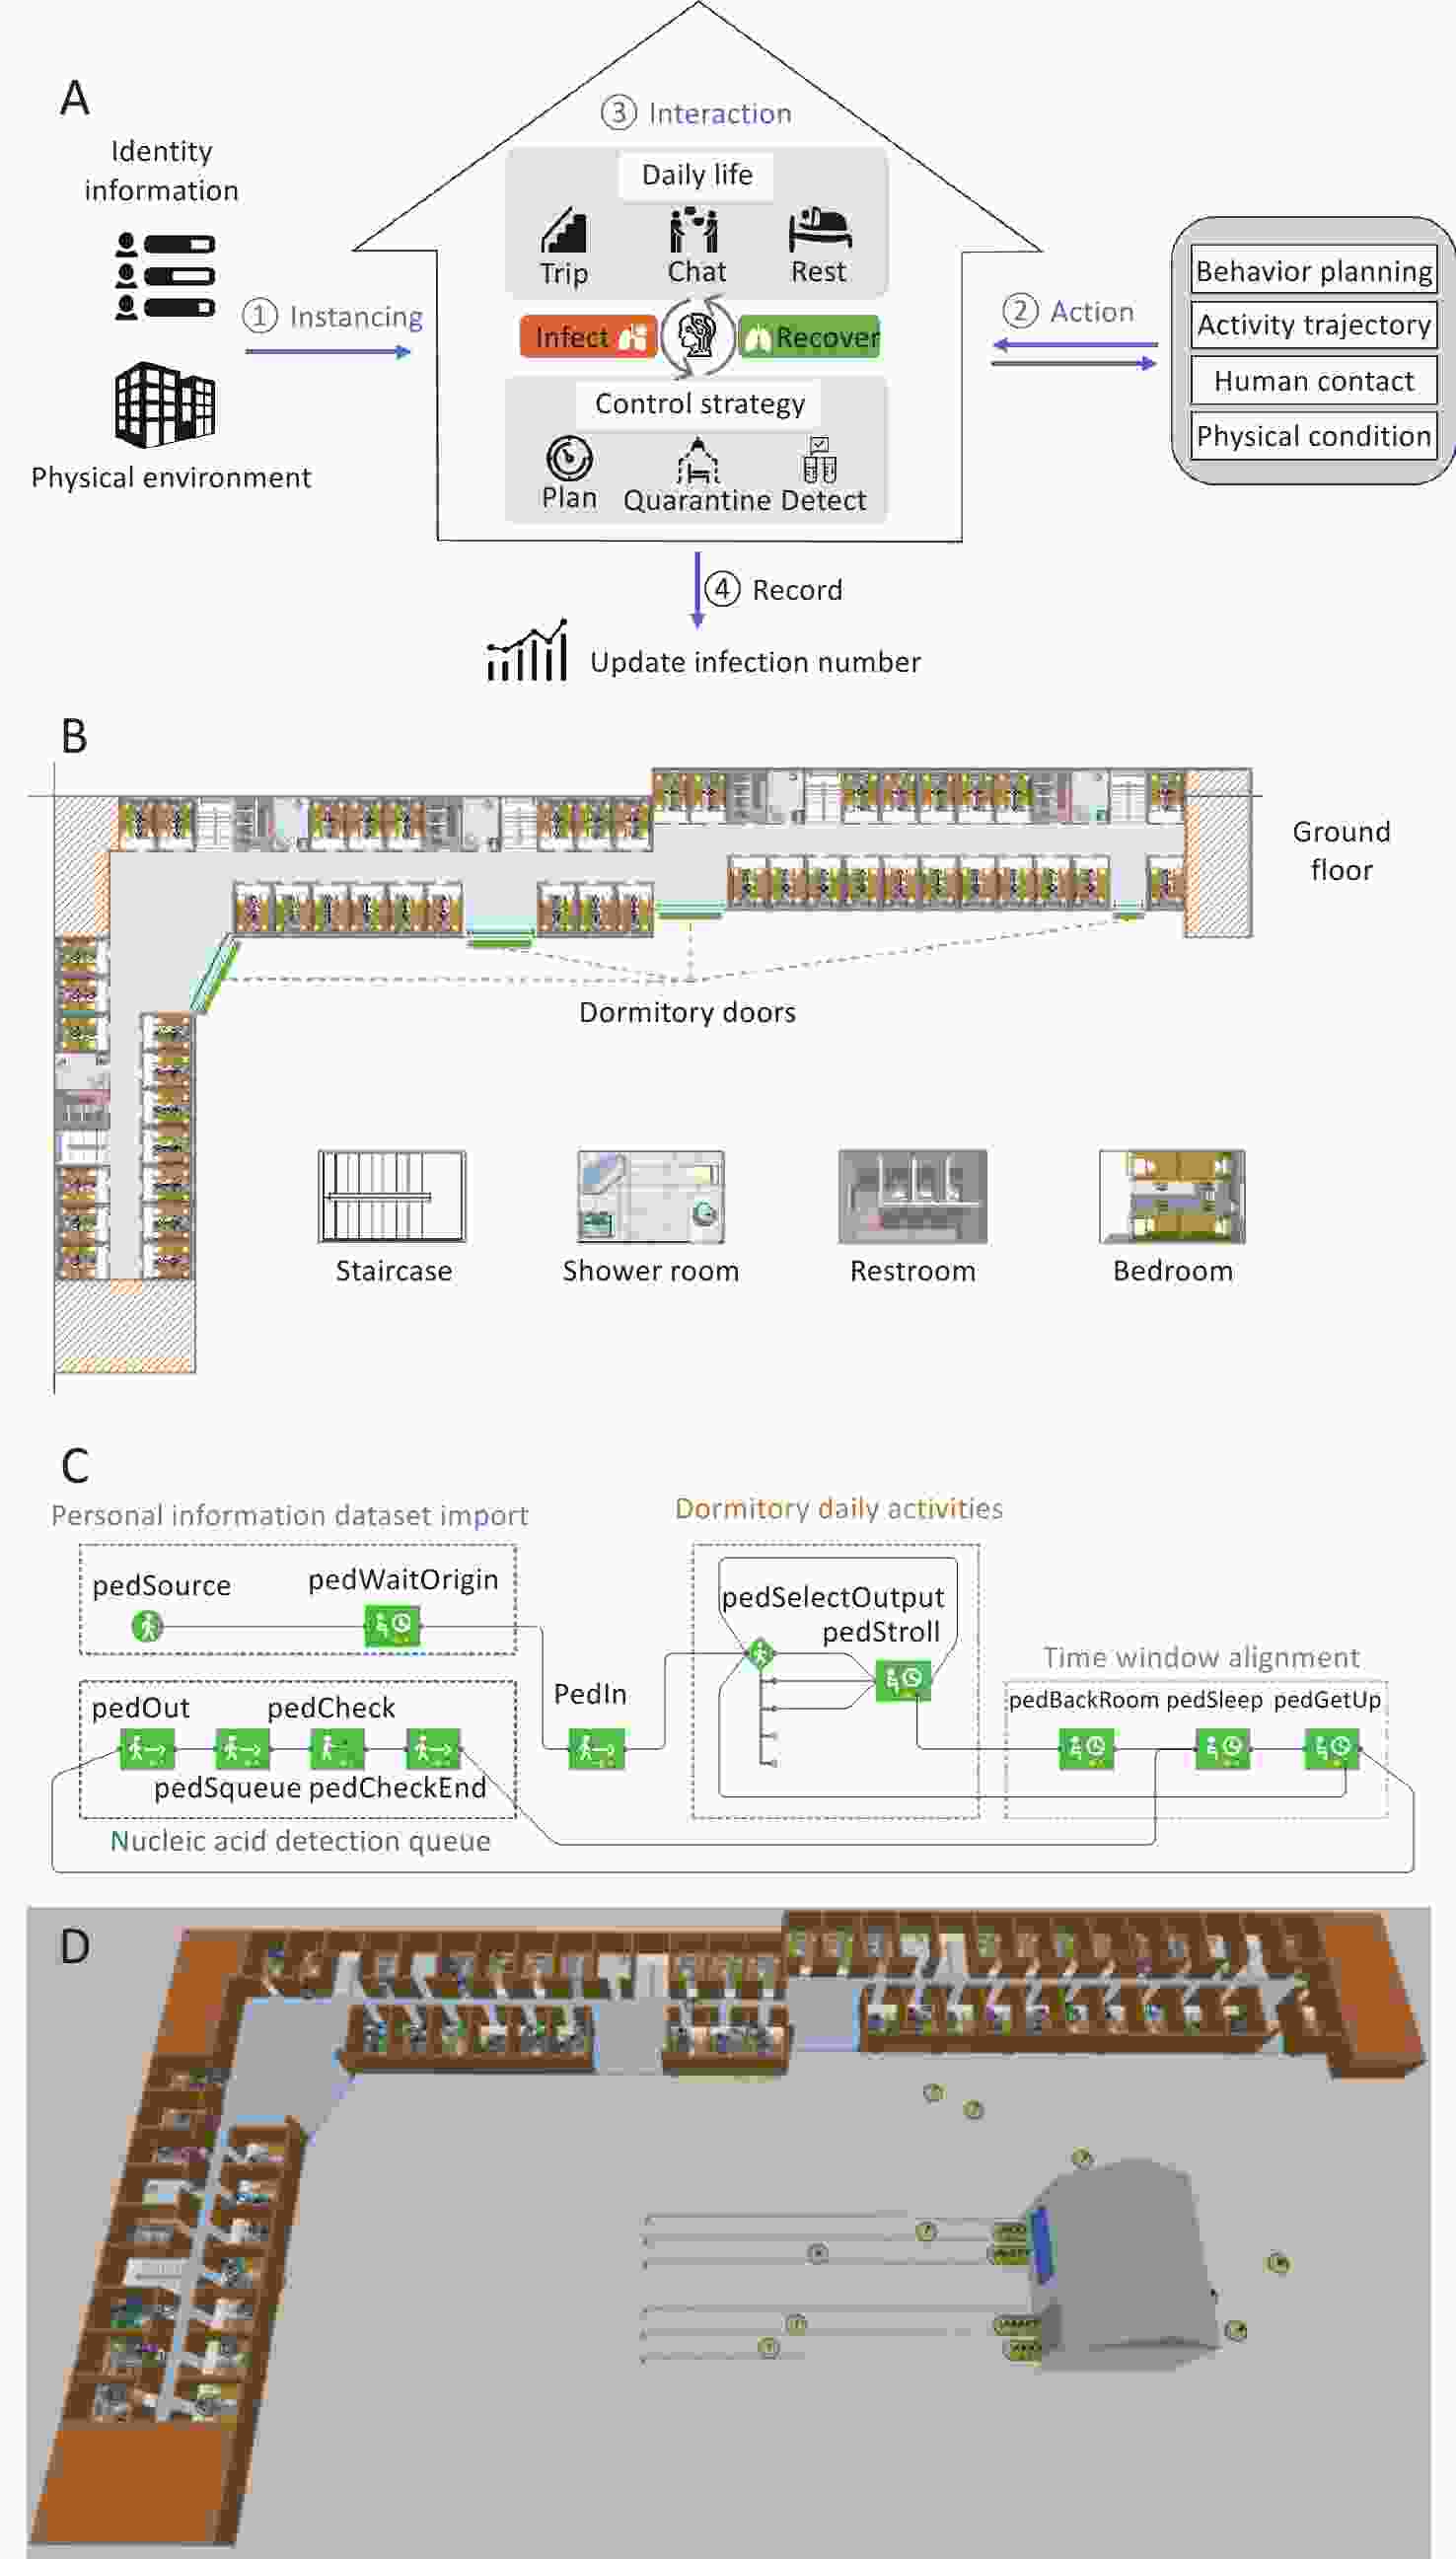
Figure 1. Simulation architecture and experimental scenario. (A) structure and logic of the artificial system, (B) floor plan of building model and functional room illustrations, (C) individual information import and behavior logic flow, and (D) 3D model of dormitory buildings and nucleic acid testing sites.
Instancing – Attributes are assigned to agents, including identity (class, dormitory room), health status (susceptible, infected, recovered), and initial activity plans, reflecting real-world epidemic conditions.
Action – Agents plan and execute behaviors, generating movement paths and interactions while adapting to control measures such as testing and quarantine.
Interaction – The system simulates daily activities (e.g., traveling and chatting) while dynamically updating health statuses based on contact conditions and transmission risks.
Record – The infection spread, quarantine status, and interactions are logged at each time step for transmission analysis and strategy evaluation.
Next, we delve into specific details, elaborating on the design and implementation of each part of the system, to support in-depth research on epidemic transmission and control strategies.
-
Physical scene modeling forms the foundation of an artificial system that provides spatial constraints for agent activities. Based on a middle school in Langfang, Beijing, the model integrates GIS data and custom segmentation to accurately replicate key areas such as classrooms, dormitory rooms, and testing points, as shown in Figure 1A. This approach ensures realistic spatial relationships and functional zoning, enabling the precise simulation of agent behaviors and epidemic transmission.
-
In a scenario-based experiment involving epidemic spread modeling, agents are defined as virtual entities capable of simulating individual behaviors and interactions within the environment, with the goal of depicting the dynamic transmission process of an epidemic within a population. Modeling the individual behaviors of agents and analyzing the overall group effects make it possible to analyze the transmission paths between individuals and dynamic evolution of group behavior at a finer granularity, enabling a better understanding and prediction of the dynamic patterns in complex systems.
Each agent in the model represents a specific individual (such as a student or resident) and possesses the following key characteristics and functions.
-
Agents carry basic attribute information, including identity information (such as class and dormitory room), their health status (such as susceptible, infected, or recovered), and social relationship information (such as interaction weights with individuals in the same class or dormitory room).
In an experiment, the identity information of the agents will first be initialized, as shown by the blue box in Figure 1A, and subsequent behaviors will be planned based on this identity information.
-
In environmental simulations, the behavior and daily activity planning of agents are among the core research topics. Agents simulate individual decision-making processes and movement trajectories in specific scenarios based on predefined behavioral rules and environmental interaction conditions.
Daily activity planning focuses on time and space as the core dimensions, taking into account the role attributes of and environmental constraints of agents (e.g., activity restrictions and location limitations) to allocate reasonable activity paths and schedules. The agent activity framework illustrated in Figure 1A consists of three main components: daily activity planning, nucleic acid testing, and alignment of the overall activity schedule, which correspond to the yellow, green, and gray modules in Figure 1C, respectively. Under baseline conditions (no intervention triggered), the daily logic of an agent follows a closed-loop "sleep–activity–sleep" routine, where daily actions are driven entirely by standard schedules. However, when a testing policy is enforced, the decision-making priority shifts, and the execution sequence of the agent dynamically updates to a high-priority "sleep–activity–testing–activity–sleep" logic. In this state, regular activities are temporarily paused or reorganized to accommodate mandatory compliance with public-health protocols.
Dormitory daily activities: The movement paths between different locations are determined based on the daily activity requirements of the agents, and their activities are dynamically adjusted according to their health status or control measures. For example, agents in isolation are restricted to dormitory areas, whereas agents in a normal state can move freely according to predefined rules.
Nucleic acid detection queue: Agents travel to designated testing points based on their daily activity plans, simulating all of the queuing, waiting, and testing processes. The scheduling of testing behaviors can be dynamically adjusted according to specific rules, such as fixed time slots or testing frequencies.
Time window alignment: A daily activity schedule is designed for the agents, including fixed-time activities (such as sleeping or nucleic acid testing) and random events (such as social interactions or visits to other dormitory rooms). To reduce the computational load of the simulation, the daily simulation duration was compressed using a 4-h cycle to represent a full day. This cycle included 1 h of rest, 1 h of free activity, and 2 h of nucleic acid testing (or an additional rest period if no testing was scheduled).
-
Transmission probability depends on the contact time, distance, and scenario; it is higher in rooms with prolonged contact, increases in crowded corridors despite short interactions, and increases linearly with the queuing time at testing points. Individual susceptibility also affects the risk of infection. Unlike discrete R0 models, this study used an individual infection function based on time and cumulative infected contacts to better capture the transmission dynamics.
First, when an individual is in a susceptible state, a health value, H0,S, is assigned to each individual.
$$ {H}_{0,S}={\text{Normal}}\;(100,30,20,150) $$ Next, infection probability Pinfect is calculated based on the distance, d, between the individual and nearby infected individual during contact. Here, α is a constant that controls the initial infection probability, while β is a decay factor.
$$ {P}_{infect}(d)=\alpha \cdot {e}^{-\beta d} $$ Finally, based on the time and total number of infected individuals encountered, the updated health value, Hi (t+1), of the individual is calculated.
$$ {H}^{i}(t+1)=H_{0,S}^{i}-\sum \limits_{\mathrm{t}}\left[\sum \limits_{j\in \textit{Infected}}\left(P_{infect}^{ij}\right)\right] $$ We use the health value as a key indicator to determine whether an individual is infected. If the health value drops to zero, the individual is considered infected.
In addition to the transition to an infected state, we provide a probabilistic description of the recovery process for patients. Starting from its onset, if the duration of the illness exceeds the statistical average duration, U, for that disease, the individual has a probability of transitioning from an infected state to a recovery state.
$$ U\sim Uniform(4,10) $$ (4) At the same time, considering that individuals develop antibodies after recovery, their new health value, H0,R, is updated to a higher level, which reduces the probability of re-infection in the short term.
$$ {H}_{0,R}={\text{Normal}}\;(100,30,20,150) $$ (5) -
This scenario simulates individual behaviors in a high-density environment, focusing on queuing at testing points where crowd density surges during peak periods. Uncertainties in testing, such as false positives and negatives, affect epidemic control. False positives lead to unnecessary isolation, whereas false negatives allow the spread of infections. Sensitivity, or the true-positive rate, measures the ability of the test to correctly identify infected individuals.
Sensitivity, which is also known as the true-positive rate, refers to the proportion of actual infections correctly identified as positive by the test.
$$ Sensitivity=\frac{TP}{TP+FN}=0.95 $$ Specificity, which is also known as the true negative rate, refers to the proportion of non-infected individuals that are correctly identified as negative by the test.
$$ Specificity=\frac{TN}{TN+FP}=0.9 $$ (7) We can calculate the probabilities of false positives and negatives based on the actual infection status of an individual, as well as the sensitivity and specificity of the test. These two types of errors affect the accuracy of quarantine measures, which in turn affect the implementation of isolation and prevention strategies.
-
Epidemic control strategies are modeled by restricting the activity ranges of individuals. Dormitory visits are based on the frequency of activities and social relationships (Table 1). Without control measures, individuals can access all rooms, with an 80% probability of visiting other dormitory rooms—90% within the same class and 10% outside (Table 1, Case 1).
Destination Room Selection Algorithm Input: person_isolate, room_isolate, all_rooms, isolate_rooms, current_room Result:person's next temp_room IF (room_isolate | person_isolate == FALSE) THEN // Case 1: No isolation for both individual and room IF random_value() <= 0.8 THEN temp_room = current_room; ELSE IF random_value() <= 0.9 THEN temp_room = Pick_room(classmate_rooms); ELSE temp_room = Pick_room(all_rooms); ELSE IF person_isolate == TRUE THEN // Case 2: person is in isolation IF ped.isolate is TRUE THEN temp_room = current_room; ELSE | IF random_value() <= 0.8 THEN | temp_room = current_room; | ELSE IF random_value() <= 0.9 THEN | temp_room = Pick_room(classmate_rooms); | ELSE | temp_room = Pick_room(all_rooms); ELSE IF room_isolate == TRUE THEN // Case 3: Room is in isolation IF ped.room in isolate_rooms THEN temp_room = current_room; ELSE | IF random_value() <= 0.8 THEN | temp_room = current_room; | ELSE IF random_value() <= 0.9 THEN | temp_room = Pick_room(classmate_rooms expect isolate_rooms); | ELSE | temp_room = Pick_room(all_rooms expect isolate_rooms); RETURN temp_room Table 1. Access algorithms under different strategies
Two control strategies are implemented. The first restricts only positive individuals, confining them to their dormitory while allowing uninfected dormmates to move freely, thus minimizing disruption (Table 1, Case 2). The second is stricter, isolating all dormitory members when a positive case emerges and prohibiting external access to prevent further spread (Table 1, Case 3). This approach effectively cuts the transmission chains within dormitory rooms.
The second control strategy enforces a strict quarantine. If one dormitory member tests positive, all residents are isolated regardless of their test results and non-residents are barred from entry (Table 1, Case 3). This measure aims to cut transmission chains swiftly by restricting all potential contacts and minimizing the spread of the epidemic.
-
Simulation models are vital for studying complex systems, particularly in infectious-disease research. This study employed AnyLogic for agent-based epidemic modeling by leveraging multilevel modeling, spatial visualization, and real-time intervention capabilities. The platform supports GIS-based scenario construction and integrates external data for precise parameterization. Using these features, a campus-based model was developed to simulate various control measures with enhanced accuracy and flexibility.
-
The simulation modelled a campus environment based on real dormitory structures, integrating GIS data to replicate key locations, such as dormitory rooms, corridors, and testing sites. Individual behaviors followed daily schedules and social networks, including learning, living, testing, and resting. The scenario also included intervention measures, such as isolation, testing, and activity restrictions, to simulate epidemic transmission and assess control strategies.
-
To simulate the spread of epidemics in a campus environment, this study constructed a three-dimensional visualized experimental environment based on the architectural structure of a real campus. This experimental environment included key areas, such as dormitory rooms, corridors, staircases, and nucleic acid testing sites, as shown in Figure 1D. In this figure, the brown sections represent dormitory walls, which effectively separate various activity spaces with physical barriers, ensuring that individuals follow realistic paths for movement and activities. The gray areas indicate nucleic acid testing sites, where students queue during designated time slots to complete their tests. The total number of testing queues was set to four, and the testing duration was configured based on actual operations. In this model, 200 students were randomly assigned to five classes and housed in 49 student rooms, with each room occupied by students from only one class. Among the five classes, four were assigned to 10 rooms each, whereas the remaining class was assigned to 9 rooms. The key parameters are listed in Table 2.
Parameter Quantity Unit Number of Dormitory Rooms 49 Dormitory Room Area 17.5 m2 Number of People per Room 4–6 Total Usable Area 1691.5 m2 Number of Entrances/Exits 4 Number of Testing Queues 4 Testing Duration uniform (0.4, 1.0) min Table 2. Key structural parameters for dormitory building modeling
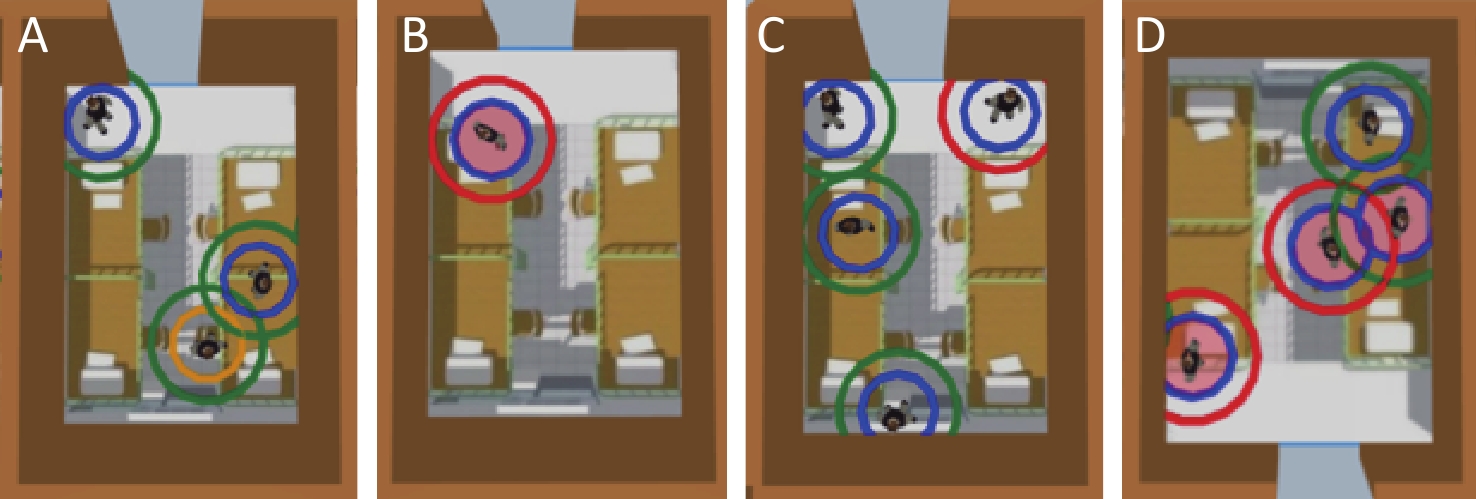
The activity of students was limited to the dormitory rooms, public areas inside the building, and nucleic acid testing sites outside the building. The initial health statuses were randomly distributed between susceptible and infected individuals, with 17 individuals identified as infected. The health and activity states of individuals were visualized in the simulation system, as shown in Figure 2, to better observe the individual activities and assess the effectiveness of the implemented control measures. The outer circles indicate the nucleic acid testing status, with red representing positive results and green representing negative results. The inner circles indicate the activity statuses, where blue indicated that the individual is in their own room, and yellow represents the opposite. The light red fill in the inner circle indicates that the individual carried the pathogen.
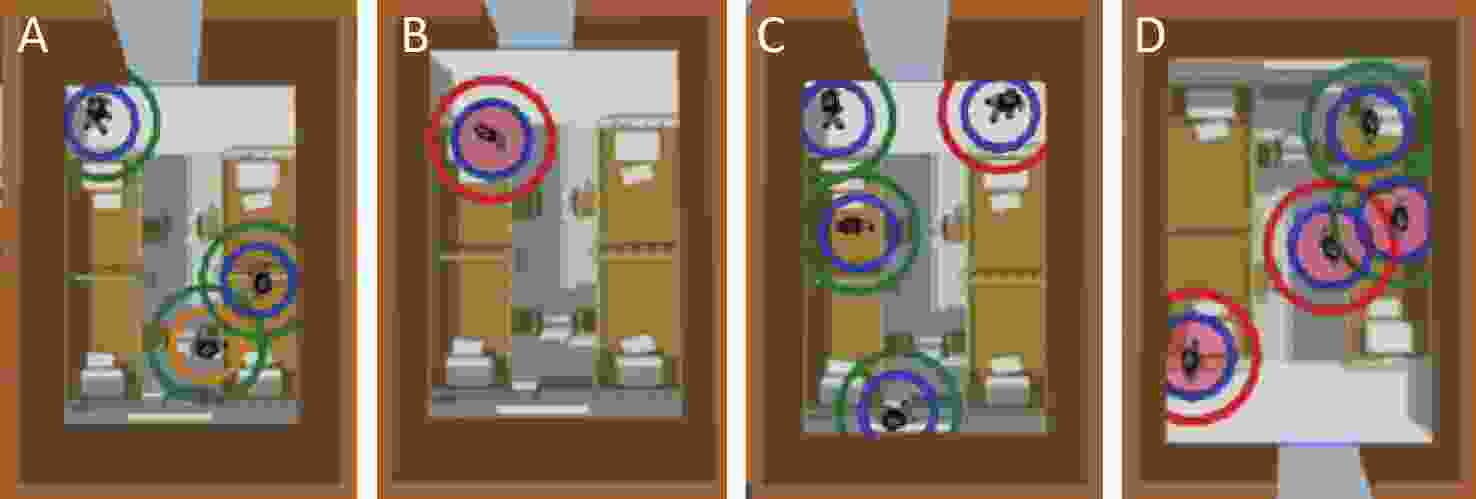
Figure 2. Visualization of individual activity and health statuses: (A) social activity, (B) patients testing positive, (C) false positives, and (D) false negatives.
The agent-based modeling consisted of free-movement and disease-transmission components. The free-movement modeling simulated individual behaviors in dormitory rooms, corridors, and testing sites using parameters such as the walking speed, collision volume, and activity range. It captured the movement randomness, contact events, and congestion effects to ensure realistic spatial dynamics. The disease transmission modeling defined the infection distance, rate, trigger frequency, recovery period, and health status. The transmission probability was calculated dynamically based on the contact duration and distance with real-time health status updates. The recovery parameters simulated the post-infection health levels. The key parameters are listed in Table 3.
Parameter Quantity Unit Walking Speed uniform (0.5, 1) m/s Collision Volume uniform (0.3, 0.4) m Effective Infection Distance 1 m Infection Trigger Frequency 1 s Infection Rate 0.005 Recovery Period uniform (4–10) day Health Status
(Pre-Infection)normal (5,20,15,2) Health Status (Post-Recovery) normal (15,50,45,2) Table 3. Key modeling parameters for agents
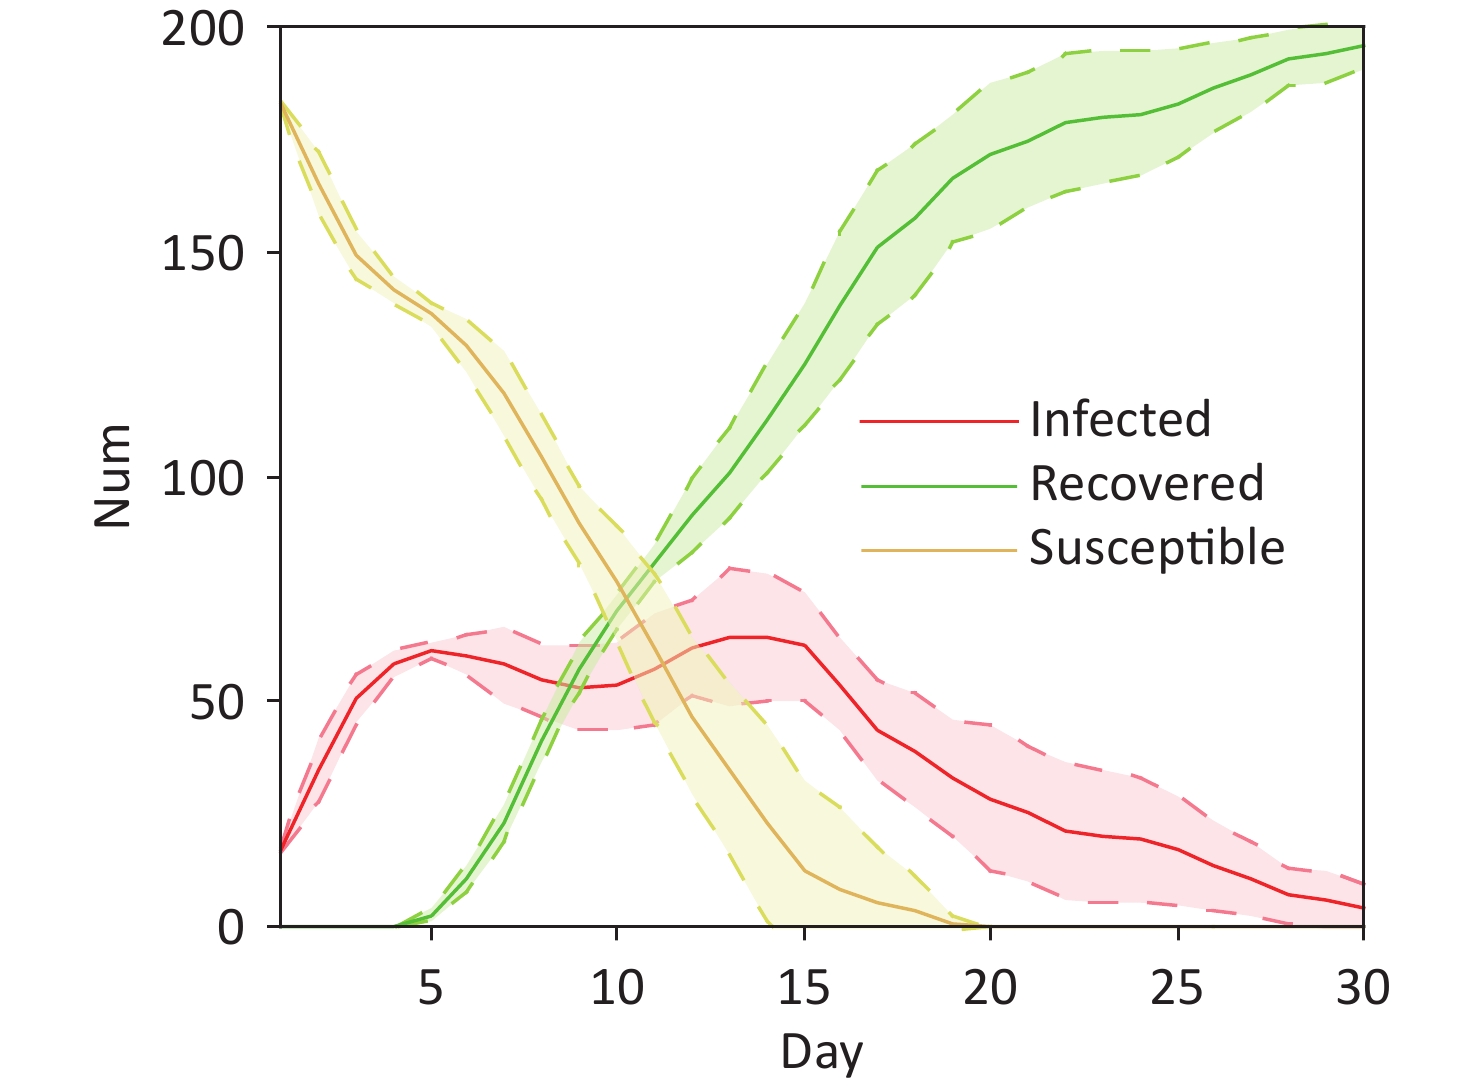
This dual-layered design effectively integrated spatial movement dynamics with changes in health status during disease transmission. It provided a comprehensive depiction of the interplay between individual behaviors, contact frequency, and health evolution, offering quantitative insights into the effectiveness of intervention measures, such as isolation or adjusted testing frequency, under different scenarios. Figure 3 illustrates the dynamic trajectories of the epidemic spread within the simulated environment under the baseline scenario, in which no intervention measures were implemented.
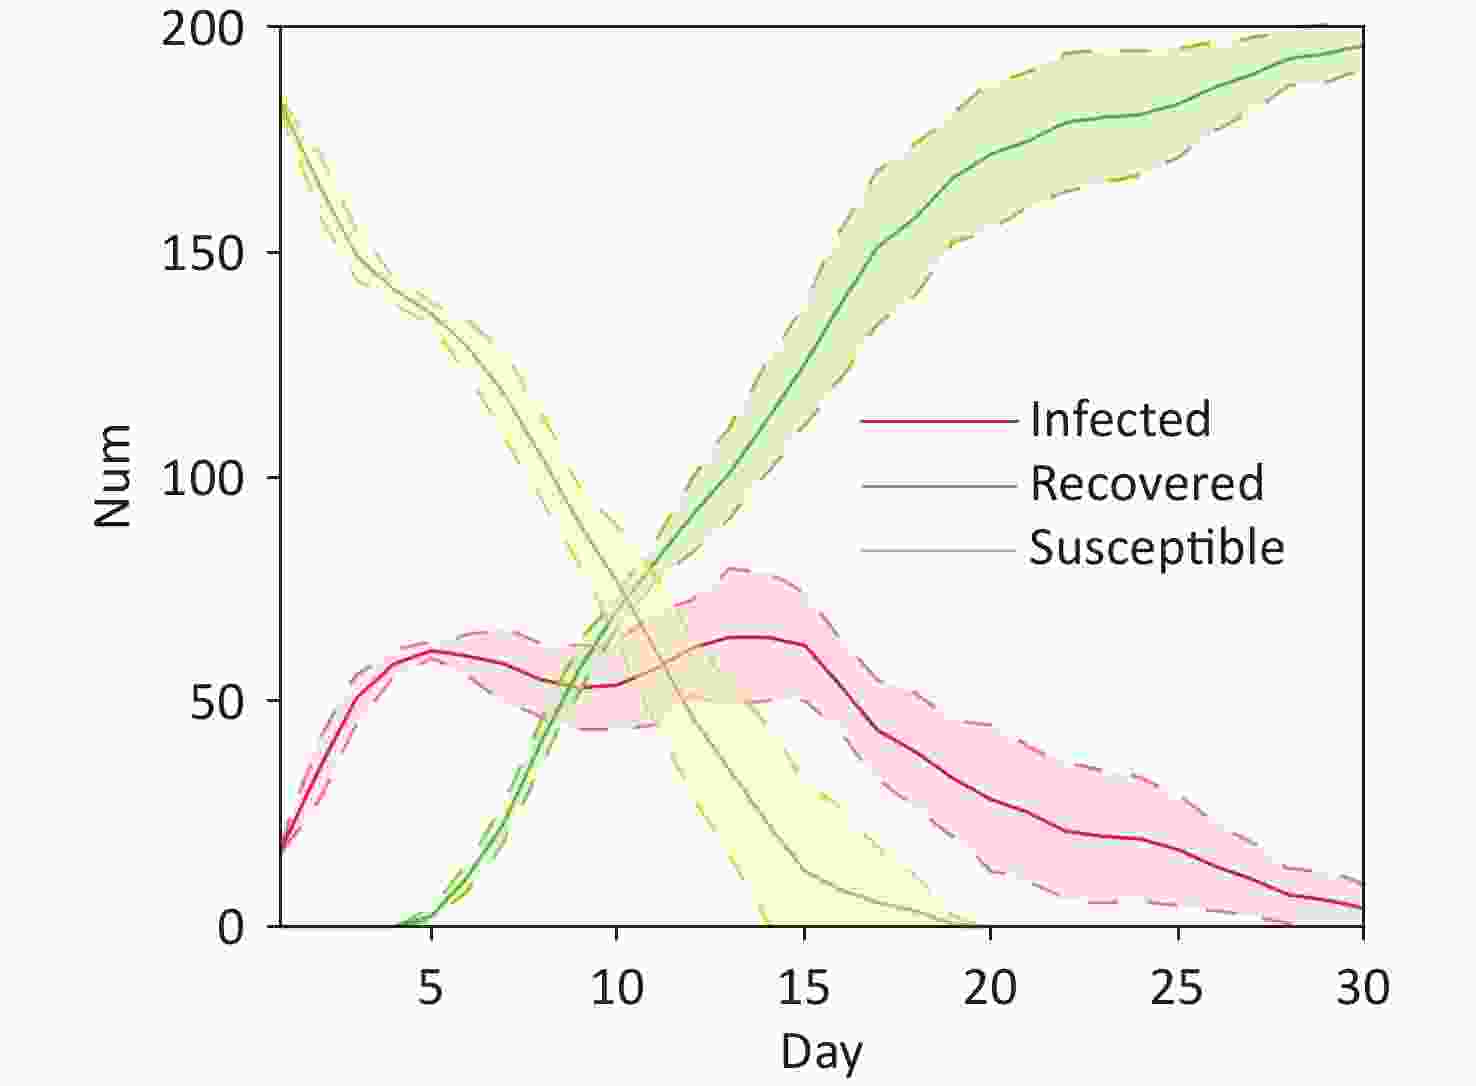
Figure 3. Infection dynamics over 30 days in dormitory.
-
As a pivotal measure in epidemic prevention and control, nucleic acid testing plays a crucial role in the timely identification of infected individuals and interruption of transmission chains[30]. The testing frequency impacts the infection detection and transmission control, but may increase crowd movement and secondary transmission risks, especially during queuing. The testing strategy, testing frequency, and congestion effects play crucial roles in the epidemic dynamics.
Using agent-based modeling, this study simulated individual movements under different testing strategies and assessed the secondary transmission risks. The model incorporated the queue density, contact duration, and infection distance, assuming a higher transmission probability within 1 m. It evaluated the testing coverage and population flow management by adjusting the testing scope and frequency.
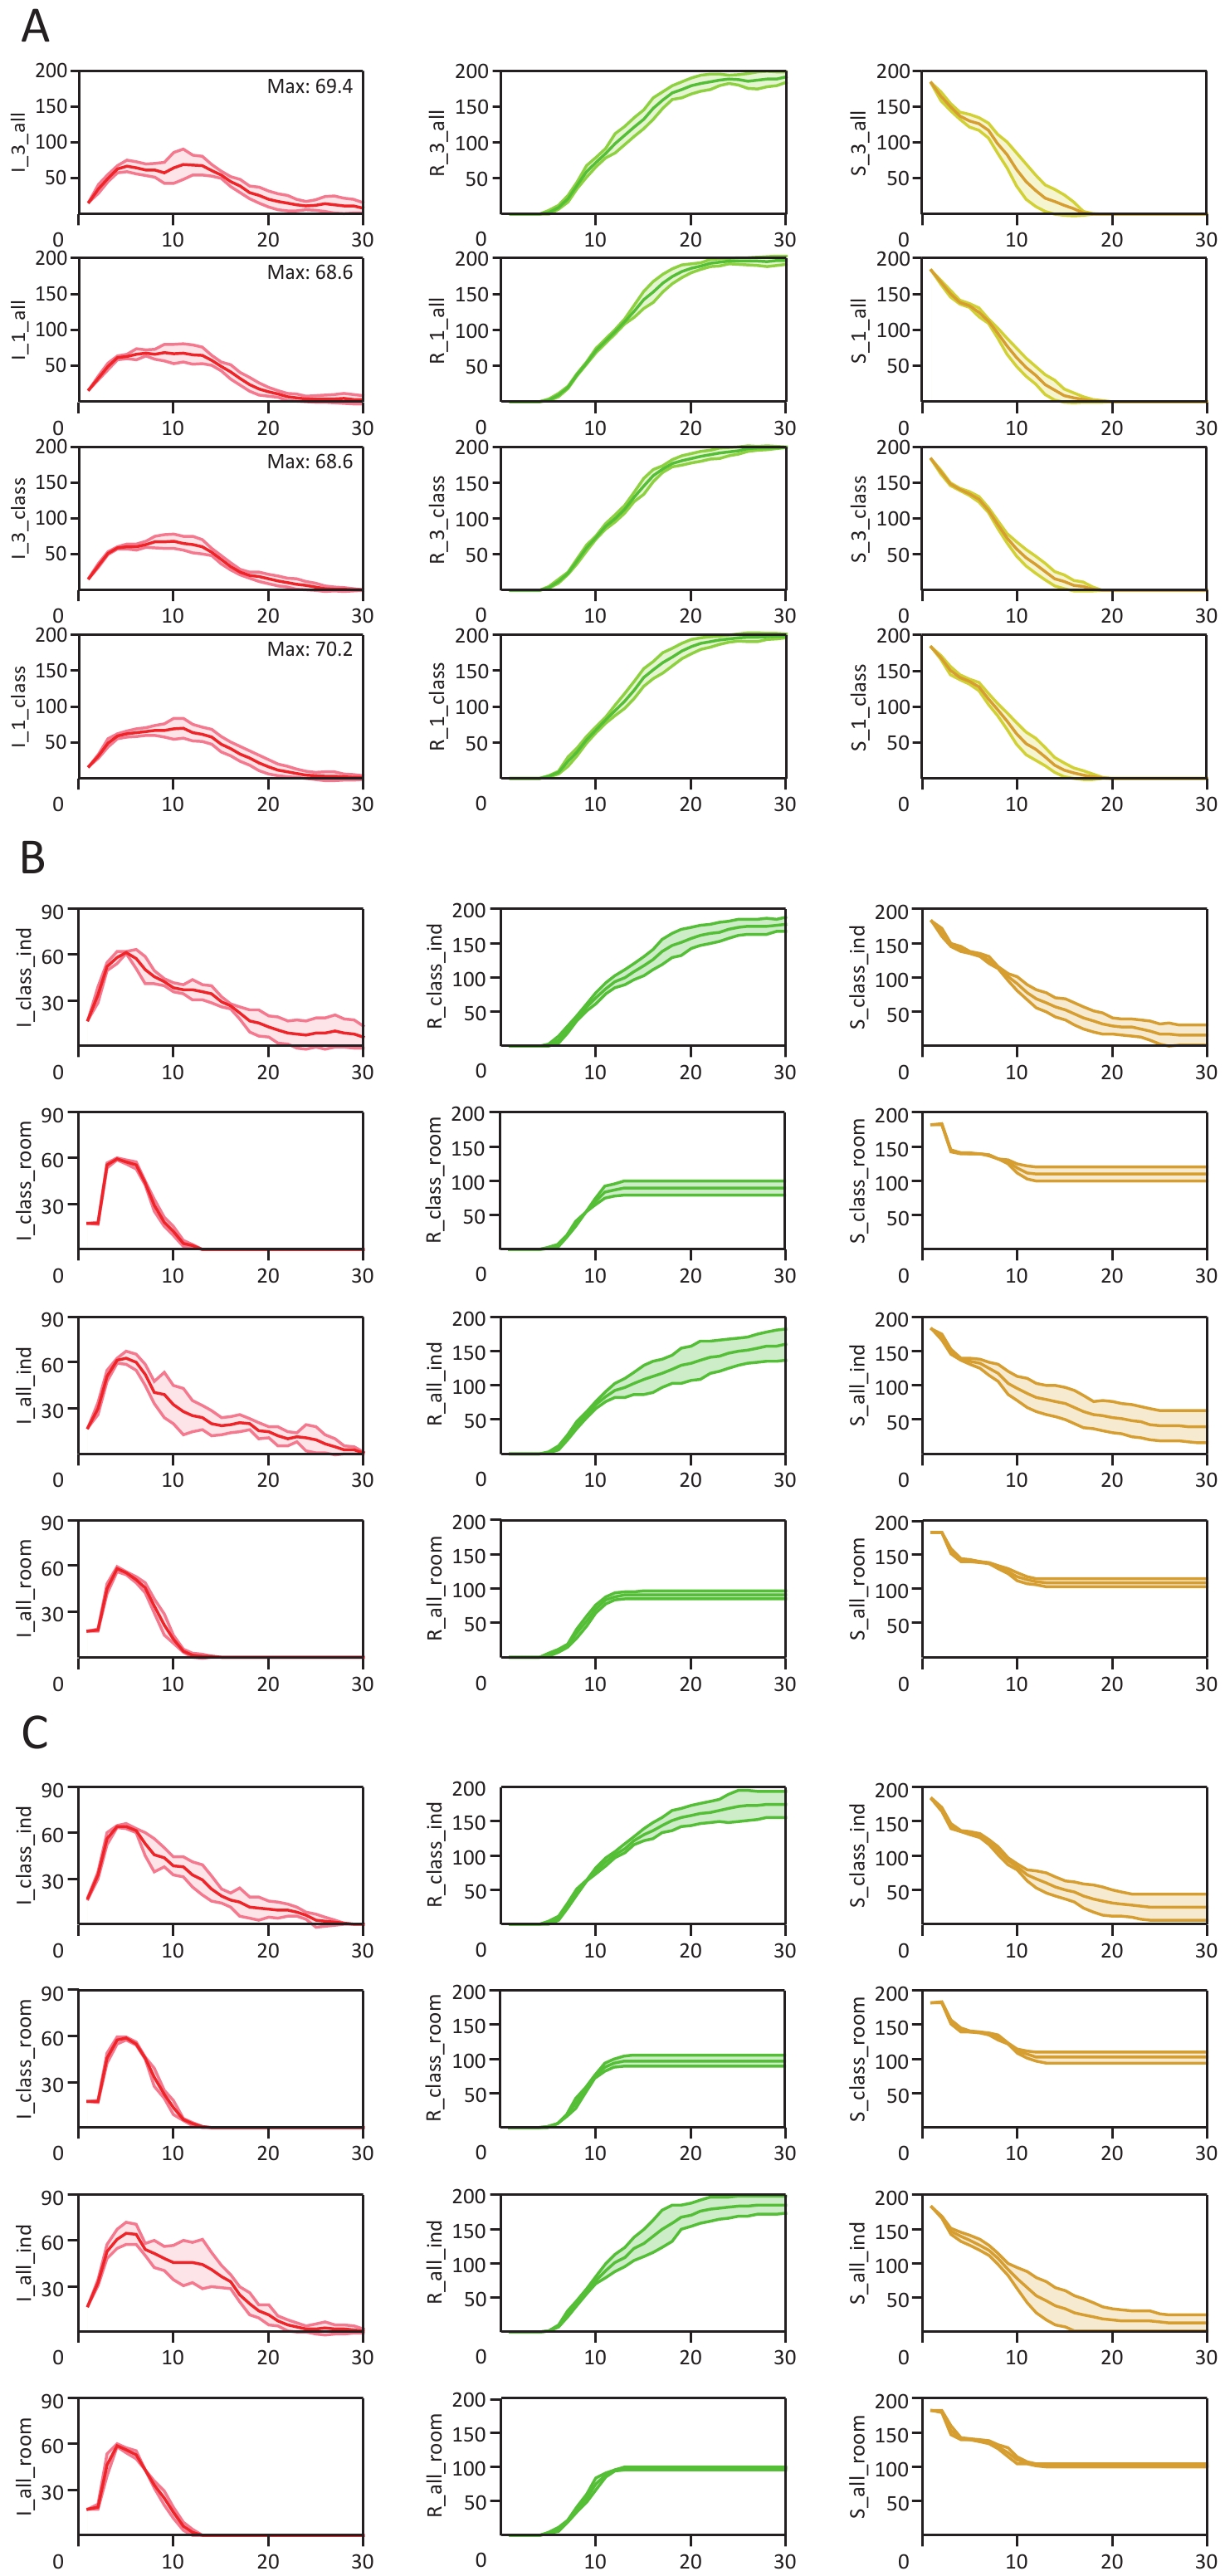
Two testing methods were established in the experimental simulation, class-based and collective testing, along with two testing frequencies: every 3 days and daily. The simulation results for the four combinations (class-based testing + every 3 days, class-based testing + daily, collective testing + every 3 days, and collective testing + daily) are plotted in Figure 4A. The results for each group were based on statistics from five independent experimental runs, and the key data are summarized in Table 4.
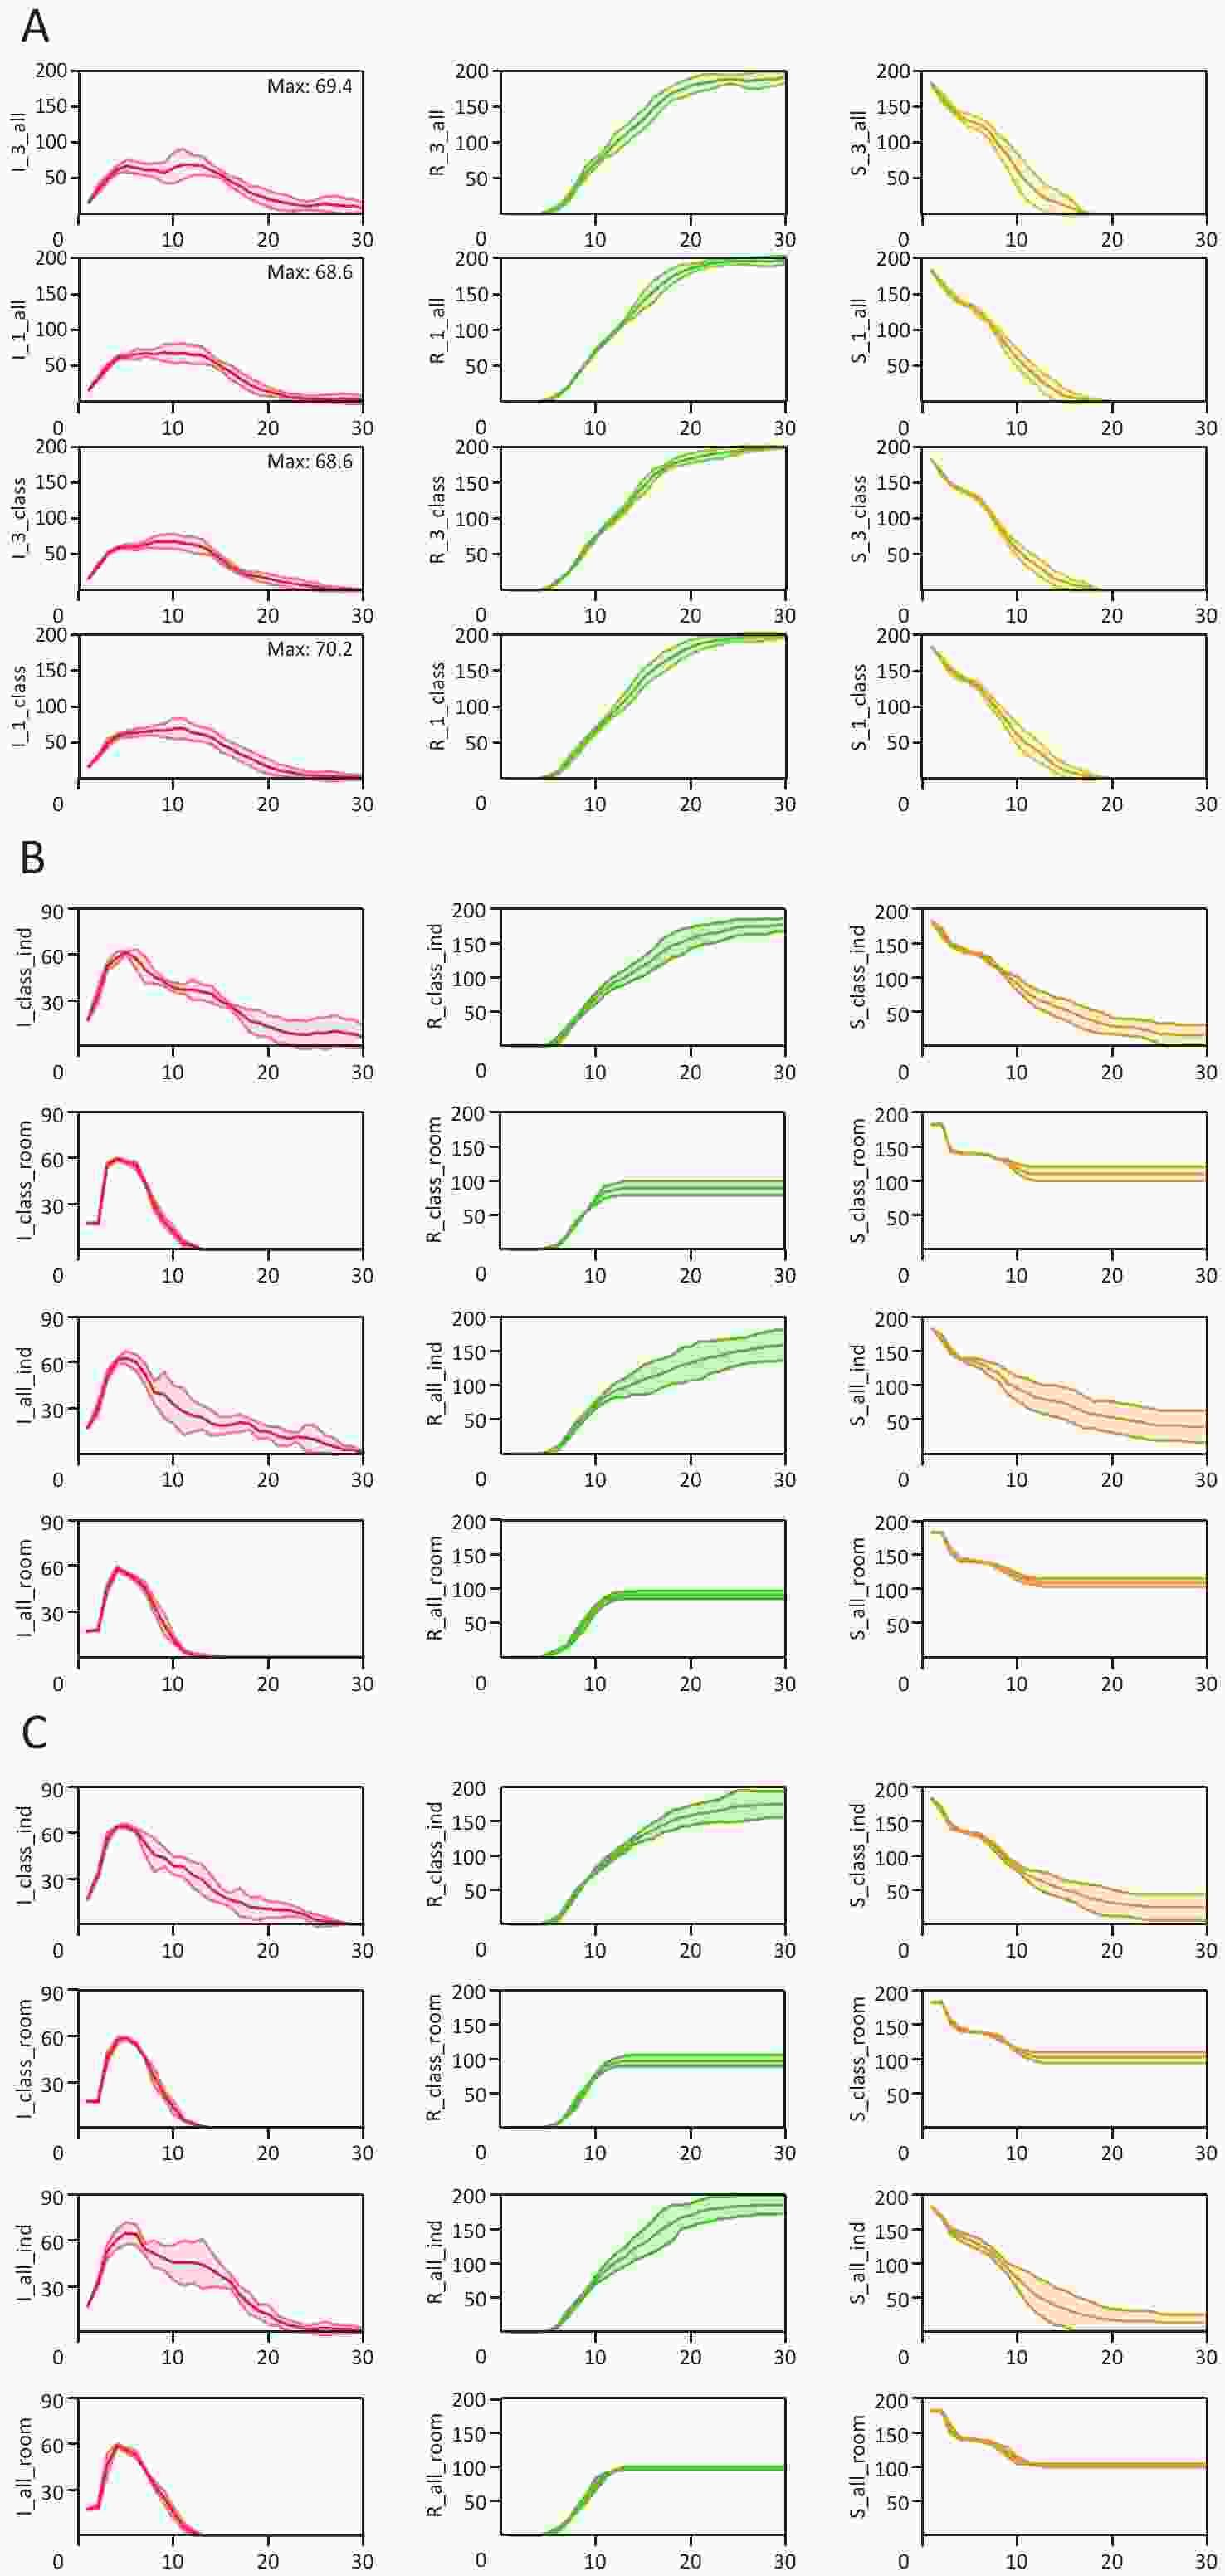
Figure 4. The results of the simulation experiment. (A) Analyses of virus transmission under different testing frequencies and scopes, (B) Results of transmission dynamics analysis of different testing methods and isolation measures under 1-day testing conditions, and (C) Results of transmission dynamics analysis of different testing methods and isolation measures under 3-day testing conditions.
Test methods Collective Class-Based 1-Day Testing 3-Day Testing 1-Day Testing 3-Day Testing Day (Cases down to 10%) 19 21 20 19 Day (Cases down to 5%) 22 30 22 23 Daily Case Peak 68.6 67.2 70.2 68.6 Final Infections 200 200 200 200 Daily Cumulative Cases 1,044.4 1,156.4 1,043 1,004.8 Rt (Max) 0.95 1.05 0.85 1.02 Rt (Days 1–3) 0.56 0.57 0.54 0.55 Table 4. Key epidemiological data comparison of different testing frequencies and scopes
A comparison of the testing frequencies showed that daily testing led to higher peak and cumulative cases, intensifying crowding and accelerating viral spread. This resulted in an "early infection, early conclusion" pattern, shortening the epidemic cycle but causing a rapid surge in infections.
Class-based testing showed minor differences from collective testing but performed better in key metrics, particularly under a 3-day frequency, reducing the cumulative cases and overall risk. It also slightly lowered the early phase transmission rates (Rt), making it more effective for initial outbreak control.
These findings highlight the risks of mass testing, and suggest optimization procedures involving staggered schedules, a larger number of testing points, and stricter distancing to reduce secondary transmission.
-
This experiment assessed the effectiveness of isolation measures under different testing frequencies and strategies. Isolation reduces the contact between infected and susceptible individuals and curbs viral transmission. By simulating various testing frequencies and isolation intensities, this study examined their impact on epidemic dynamics. Two main isolation strategies were compared.
Individual Isolation: Individuals who tested positive were confined to their dormitory room, whereas their roommates who test negative were allowed to move freely. External individuals were also permitted to enter the dormitory room.
Dormitory Isolation: If a positive case was detected in a dormitory room, everyone living in that room (regardless of their infection status) was strictly isolated. Individuals living in that dormitory room were not allowed to leave, and external individuals were prohibited from entering.
All of the simulation results were visualized using SIR dynamic curves. The experimental design incorporated three primary variables: the testing frequency, testing method, and isolation strategy. To facilitate a structured analysis, the results were grouped and plotted based on distinct testing frequencies.
Specifically, the individual analysis results in Figure 4B and Figure 4C allow for a direct comparison of how the different testing methods and isolation strategies affected epidemic propagation within a fixed timeline. A cross-analysis combining Figure 4B and Figure 4C further revealed the joint impacts of various testing frequencies, along with specific testing or isolation frameworks. Specifically, Figure 4B presents the simulation outcomes under a daily testing regimen (1-day frequency), whereas Figure 4C illustrates the trends under a three-day testing interval (3-day frequency). The critical statistical datasets corresponding to the analysis results of Figure 4B and Figure 4C are summarized in Table 5 and Table 6, respectively.
1-Day Testing Individual Control Dormitory Quarantine Class-Based Collective Class-Based Collective Day (Cases down to 10%) 18 18 9 10 Day (Cases down to 5%) 22 25 11 11 Daily Case Peak 61.3 63 59.3 58 Final Infections 184.3 160.7 89.3 91.3 Daily Cumulative Cases 805.3 718.3 371.3 363 Rt (Max) 0.98 0.75 2.19 1.55 Rt (Days 1–3) 0.55 0.56 0.76 0.63 Table 5. Key epidemiological data comparison under 1-day testing conditions
3-Day Testing Individual Control Dormitory Quarantine Class-Based Collective Class-Based Collective Day (Cases < 10%) 15 18 10 10 Day (Cases < 5%) 20 21 11 11 Daily Case Peak 64.3 64.7 58.7 59 Final Infections 175 186.7 97.7 98 Total Daily Cases 716.3 832.3 372.9 373.6 Rt (Max) 0.87 0.9 1.63 1.48 Rt (Days 1-3) 0.58 0.56 0.64 0.62 Table 6. Key epidemiological data comparison under 3-day testing conditions
-
Dormitory-based testing limited cross-class transmission, especially under relaxed measures, but may have increased within-class exposure if an infection existed. Frequent testing increased this risk, leading to higher daily and final infection rates. However, a reduced testing frequency lowered the peak and cumulative infections compared with collective testing, proving its effectiveness in blocking the spread. While it raised the within-dormitory room and classmate infection risks, it shortened the infection cycle, accelerating the decline of infections across all testing frequencies.
-
The daily testing experiment showed that isolating infected dormitory rooms was more effective than restricting individuals, reducing the transmission scope and cycle. While dormitory room infections peaked, uninfected dormitory rooms remain protected.
Data analysis indicated that class-based daily testing resulted in higher incidence and transmission rates than collective testing, because frequent contact between classmates accelerated the spread. In contrast, dormitory-based testing every three days lowered infection rates and peak transmission, especially under individual activity controls.
A comparison of the isolation measures showed that stricter isolation benefited from a higher testing frequency to quickly detect cases, whereas relaxed isolation with reduced testing minimized contact and lowered the risk of infection.
-
We summarize the impact of the testing frequency and isolation stringency in a comparative table (Table 7), focusing on collective testing. The data showed that stricter isolation significantly reduced the peak, final, and cumulative infections, proving its effectiveness in confined spaces while shortening the outbreak duration.
Test methods 3-Day Collective Testing 1-Day Collective Testing Only test Ind-control Dorm-control Only test Ind-control Dorm-control Day (Cases < 10%) 21 18 10 19 18 10 Day (Cases < 5%) 30 21 11 22 25 11 Daily Case Peak 67.2 64.7 59 68.6 63 58 Final Infections 200 186.7 98 200 160.7 91.3 Daily Cumulative Cases 1156.4 832.3 373.6 1044.4 718.3 363 Rt (Max) 1.05 0.9 1.48 0.95 0.75 1.55 Rt (Days 1–3) 0.57 0.56 0.62 0.56 0.56 0.63 Table 7. Comparison of key transmission data under different levels of isolation stringency
However, in constrained environments, strict isolation may increase the risk of transmission among individuals sharing spaces, as observed in the higher contact transmission rates. While it curbs the overall spread, localized risks increase, necessitating a balanced approach to isolation strategies.
-
This study analyzed the dynamics of virus transmission and effectiveness of various control measures in a dormitory setting by comparing different testing frequencies, scopes, and levels of isolation stringency. The results indicated that a dormitory-room isolation strategy was significantly more effective than individual activity restrictions because it reduced the scope of disease transmission and shortened the infection cycle. Although this strategy led to a peak in infections among dormitory roommates, it provided greater protection for those living in uninfected dormitory rooms. Additionally, under a daily testing regimen, class-based testing resulted in higher daily infections, cumulative cases, and peak contact transmission rates owing to increased interactions within the same class. In contrast, reducing the testing frequency (e.g., testing every three days) effectively lowered the infection risk, making dormitory-based testing a more effective approach for controlling outbreaks.
Further analysis revealed that stricter isolation measures reduced peak daily infections, final infection counts, and cumulative infections, while shortening the outbreak duration, thereby minimizing the impact of the virus on daily life. However, in spatially constrained environments where individual isolation is not feasible, stricter isolation measures may significantly increase the risk of infection among individuals sharing the same activity space, leading to a higher maximum contact transmission rate and higher three-day average contact transmission rate.
However, this study had several limitations that should be acknowledged to provide a balanced perspective. First, the scope of our case study was constrained to a single dormitory floor. While this high-resolution environment allowed for a detailed analysis of micro-level interactions, the spreading dynamics may vary when scaling up to entire buildings or multi-community campuses. Second, our model assumed uniform agent compliance with intervention strategies, which may not fully reflect real-world human behavioral heterogeneity during an outbreak. Finally, capturing the fine-grained spatiotemporal dynamics involved significant computational trade-offs, limiting the current scalability of the model for massive populations without high-performance optimization.
Overall, this study demonstrated that in closed environments, the testing frequency and isolation strategies must be balanced based on spatial constraints and contact patterns. When isolation measures are strict, increasing the testing frequency helps detect cases early and breaks transmission chains. Conversely, in less restrictive settings, moderately reducing the testing frequency can minimize unnecessary contact and lower the infection risk. In addition, this study examined the combined effects of different testing frequencies and isolation measures under collective testing conditions, highlighting the strengths and weaknesses of various prevention strategies. These findings provide valuable data for the development of more precise epidemic control policies.
HTML
Infectious Disease Transmission Modeling
Epidemic Prevention and Control Measures
Physical Scene
Student Agent
Individual Attribute Information
Behavior and Daily Activities
Disease Transmission and Rehabilitation
Nucleic Acid Detection
Management and Control Policy Modeling
Simulation Platform and Modeling Tools
Ontology Scenario and Disease Transmission
Secondary Transmission Triggered by Testing Scenarios
Implementation and Evaluation of Isolation Measures
Under Different Testing Scopes
Under Different Testing Frequencies
Comprehensive Comparison
Competing Interests The authors declare no competing interests.
Authors' Contributions Study conception was carried out by Xiangyu Zhang and Zhidong Cao. Simulation model development, experiment implementation, and data analysis were performed by Xiangyu Zhang. Expertise in the epidemics domain was provided by Jiaojiao Wang and Tianyi Luo. Data curation and transmission-context material provision were contributed by Hongbin Song and Ligui Wang. Manuscript drafting was completed by Xiangyu Zhang. Project supervision and manuscript revision were undertaken by Zhidong Cao. All authors approved the final manuscript.

 Quick Links
 DownLoad: