
-
A combination of atmospheric factors, such as air pollution and weather conditions, can influence the occurrence and progression of respiratory diseases. Compound air pollution (e.g., particulate matter and gaseous pollutants)[1,2] and non-optimal temperature and precipitation[3,4] can intensify the hospitalization risk for respiratory diseases—the most atmospheric environment-sensitive condition—through mechanisms such as oxidative stress, inflammation, and direct airway irritation. Owing to a complex atmospheric environment and dense population, city dwellers experience greater exposure to air pollution and an enhanced risk of respiratory diseases[5]. Therefore, a risk prediction framework for respiratory diseases is essential to support disease prevention and the implementation of emergency medical response[6,7].
Recent research on risk prediction models for respiratory diseases has been minimal in scope, and existing studies have not adequately supported early warning and emergency response activities for these diseases. First, many previous studies focused on developing indices to identify respiratory disease risks associated with air pollution (e.g., Canada’s Air Quality Health Index, AQHI)[8–21]. However, these indices mainly depend on exposure–response relationships between air pollution and mortality[8,9,14,17,22], which do not accurately capture the immediate impact of air pollution on respiratory health[13,18]. Furthermore, these indices are still in development and have not been applied to predict the morbidity risk of respiratory disease. Second, some studies have developed city-level disease prediction models based on single-city datasets, but the lack of external validation limits their generalizability.
Machine learning techniques hold great promise in predictive health analytics. Many studies have attempted to develop risk prediction models for cardiovascular diseases, achieving encouraging predictive results[23–25]. However, this machine learning-based predictive technology has seen limited application in preventing and controlling atmospheric environment-related disease risks, such as respiratory diseases. Previous studies have examined machine learning methods to predict the air quality index[26–28]. However, little attention has been accorded to health risk prediction using these indices or assessing their usefulness in forecasting medical needs[29]. Regarding the models, traditional statistical approaches such as Autoregressive Integrated Moving Average (ARIMA), Generalized Additive Model (GAM), and Generalized Linear Model (GLM) often struggle to capture temporal dependencies and non-linear trends. In contrast, Long Short-Term Memory (LSTM) networks—a form of recurrent neural network with memory components—provide a robust means of managing time-series data and have been effectively applied to forecast both infectious and non-communicable diseases[30].
Therefore, this study aimed to develop and validate a novel model framework to predict the acute risk of respiratory diseases associated with daily changes in the atmospheric environment. There are three unique aspects of this study: first, we focused on urban scale instead of broader spatial scales, given the urgency of addressing compound atmospheric impacts on dense population in cities; second, we established a model framework that includes creating a city-level health risk index as well as a machine learning model that incorporates the index to predict respiratory disease risk; third, we performed external validation to verify the robustness of our prediction model.
-
We developed a framework to predict city-specific outpatient visits for respiratory diseases, comprising three main steps (Supplementary Figure S1). First, to comprehensively capture air pollution’s impact on disease morbidity, we created a five-level index: the Warning for Health Risk of Atmospheric Environment (WHAair). It is based on exposure–response relationships between five air pollutants (PM2.5, PM10, SO2, NO2, and O3) and hospitalization data, which we verified based on its association with outpatient visits for respiratory diseases and their subtypes. Second, we established an LSTM model using the WHAair index, incorporating meteorological factors and historical trends in respiratory disease outpatient visits to predict the immediate risk of respiratory diseases, enabling proactive clinical preparation for air pollution-related patient surges[31]. Third, to evaluate robustness, we also replicated the entire process using data from other megacities. Specifically, we applied the same method to develop models for Tianjin and Chongqing, and the generalizability of the models was externally confirmed.
-
The WHAair index was developed based on the association between daily air pollution and hospital admission data. We obtained a dataset of daily total hospital admissions in Beijing from January 1, 2013, to December 31, 2018, from the Beijing Municipal Health Commission Information Center. This dataset included medical records from all Grade II and above hospitals in Beijing. Furthermore, we divided the population into children aged 15 years or younger and the elderly aged 65 years or older to create the WHAair, aiming to incorporate the health impact on subpopulations vulnerable to air pollution[6]. We gathered hourly concentrations of PM10, PM2.5, O3, SO2, and NO2 from the national air quality monitoring sites within Beijing during the same period. Next, we calculated 24-hour average concentrations for PM10, PM2.5, SO2, NO2, and the maximum eight-hour moving average for O3. Additionally, we incorporated meteorological data, including daily temperature and relative humidity, into the model. We applied a conditional Poisson regression model to evaluate the exposure–response relationships between each of the five air pollutants and daily hospital admissions, respectively (see Supplementary Method S1 for details).
By using estimates of exposure–response relationships between five air pollutants and hospital admissions for the general population, children, and the elderly groups, we calculated excess risk with the following equation:
$$ E{R}_{j}=\sum\limits_{i=1}^{5}\left({e}^{{{\beta }_{i}}{{x}_{ij}}}-1\right)×100\% $$ In this model, ERj was the total excess risk from all five air pollutants on day j; βi was the exposure–response relationship between non-accidental hospital admissions and air pollutant i—here we selected the maximum effect estimates for each pollutant within the optimal lag period to avoid underestimation of related risk; xij was the daily average concentration of air pollutant i. Using this, we estimated the excess risk for the general population (ERtotal), children (ERch), and the elderly (ERel) groups based on population-specific association estimates.
We aimed to establish a five-level index based on the ER values to indicate different levels of disease risk. To set the cutoff points, several key principles were considered: first, it accounts for both the general population and vulnerable subgroups; second, each index category logically correlates with rising disease risk, so higher index levels indicate greater risk. Accordingly, we customized the cut-off points based on local ERtotal, ERch, and ERel. Here, using these ER values, we applied an iterative method, in which different threshold values were applied, to establish a five-level WHAair index and automatically verified the association between the index at each level and the population’s hospital outpatient visits. Thresholds were determined when the outpatient visit risk associated with successive levels was distinguished and showed a stepwise increase (see Supplementary Method S2 for details).
Specifically, taking Beijing as an example, we collected data on 69,963,155 hospital outpatient visits in Beijing from the Beijing Municipal Health Commission Information Center. We selected air pollution-sensitive diseases classified by the 10th International Classification of Diseases (ICD-10) codes[32], including non-accidental total (A00–R99), respiratory disease (J00–J99), lower respiratory infections (J20-J22), COPD (J41–J44), and asthma (J45–J46). We built conditional Poisson regression models relating daily WHAair to daily counts of cause-specific outpatient visits; daily WHAair was treated as an ordinal variable. Applying the latter model, we identified the specific associations for each WHAair level (2–5) relative to level 1. We hypothesized that, if the index category is appropriate, higher index levels would be associated with a greater risk of disease. Next, we developed WHAair with five levels and showed its distribution from 2013 to 2018, along with AQI and AQHI.
-
LSTM models—a type of Recurrent Neural Network (RNN)—can handle both short- and long-term dependencies, which is crucial for improving prediction performance[33]. In this study, LSTM was employed as the prediction model[34]. The robustness of the model was evaluated by analyzing the daily city-level outpatient visits alongside WHAair features, with particular focus on spatiotemporal properties. In our primary model, the dependent variable was the number of outpatient visits on the current day. The independent variables comprised lagged terms for outpatient visits on the previous 1–3 days, as well as the atmospheric factors, including the WHAair index, and weather variables, such as average temperature and relative humidity over the same lag period. This configuration effectively captured the lagged effects of all key predictors within the 1–3 day window[33]. Specifically, the LSTM model comprised an LSTM layer with three time-steps, tanh activation, and sigmoid gating to capture temporal dependencies, followed by a 0.1 dropout layer for regularization and a fully connected layer for regression, trained using the Adam optimizer with MSE loss (Details in Supplementary Method S3).
-
The Beijing dataset from 2016 to 2019 showed that daily count of outpatient visits for respiratory diseases ranged from 46 to 7,244, with a mean of 837, indicating a right-skewed distribution. The dataset was split into three parts: training, validation, and test. Initially, 20% of the data were used for testing, while the remaining 80% were set aside for the combined training and validation sets. During model implementation, the training and validation sets were further split using 10-fold cross-validation. To ensure a thorough evaluation of the model’s predictive ability under various conditions, the data were randomly divided into training, validation, and test sets. The Chongqing and Tianjin datasets were processed using the same method.
The performance of a trained model was assessed by its predictability on a test set. For this purpose, the Root Mean Square Error (RMSE) was applied to quantify the prediction error of the model. It measured the square root of the average squared difference between observed and predicted values. The coefficient of determination (R2) was employed to gauge the level of model fitting and its explanatory power[35].
-
To assess the robustness of the model’s predictive performance, we performed a time-based split sensitivity analysis. The first 80% of chronological data were used for training and the remaining 20% for independent testing. Model performance was evaluated using the R2 and RMSE, and time-split results were compared with those from the original 10-fold cross-validation to verify prospective generalizability.
To validate the significance of WHAair in predicting respiratory disease risk, we compared the performance of models with different settings. We evaluated four LSTM models: 1) the main model with all features, including WHAair, ambient temperature, relative humidity, and the daily outpatient visits; 2) the main model without WHAair; 3) the main model excluding outpatient visits from the previous 1–3 days; 4) the main model without meteorological factors. The percentage change in RMSE and R2 served as our evaluation metrics.
To verify the superiority of the WHAair-LSTM framework, we conducted a standardized comparison with the Generalized Additive Model (GAM) and the Seasonal Autoregressive Integrated Moving Average Model (ARIMA). All models were trained and tested using the same 8:2 time series data split, and their predictive performance was evaluated using R2 and RMSE to confirm the advantages of our framework over traditional models.
To evaluate model performance during peak visit periods, we analyzed observations with daily visits above the 90th percentile and calculated the RMSE and mean absolute error (MAE).
-
To evaluate the capability of the WHAair-LSTM framework (Supplementary Figure S1) to predict outpatient visits for respiratory diseases, we validated the model by applying the same strategy and creating a city-specific WHAair based on local surveillance data, along with an LSTM model trained on independent datasets from Tianjin and Chongqing. Tianjin—located near Beijing and experiencing similar air pollution patterns—contrasts with Chongqing in South China, which has a different type of air pollution, primarily ozone-related[36,37].
-
The health outcome datasets utilized to develop and validate the WHAair-LSTM framework included three megacities: Beijing, Tianjin, and Chongqing (see Table 1). For Beijing, a dataset of 12,951,191 hospital admissions was applied to develop the WHAair index, while 69,963,155 outpatient visits contributed to model building and validation (see Table S1).
City Study period Health outcomes Diseases* Count Mean of daily count Max of daily count Beijing 2013–2018 Hospital admissions Total 12,951,191 369 3,533 2016–2018 Hospital outpatient Total 69,963,155 4,049 27,648 visits RSD 13,161,528 837 7,244 LRES 777,379 45 384 COPD 573,957 29 431 Asthma 420,563 23 199 Tianjin 2013–2019 Hospital admissions Total 2,495,476 119 596 Hospital outpatient Total 29,228,691 1,112 13,407 visits RSD 2,805,704 106 1,419 Chongqing 2013–2019 Hospital admissions Total 11,343,229 437 12,983 2018–2023 Hospital outpatient Total 124,546,360 1,690 12,373 visits RSD 18,616,021 252 3,268 Note. Total: non-accidental visits; RSD: respiratory system disease; LRES: lower respiratory system disease; COPD: chronic obstructive pulmonary disease. Table 1. Summary of health outcomes in this study
-
We developed the five-level index (WHAair), adjusted for local air pollution excess risk, and considering both general and vulnerable populations. It links to disease risk and aligns with the national AQI through sensitivity analysis to prevent misleading results (Supplementary Method S2). Supplementary Figure S2 illustrates the lag patterns of the acute health effects of five air pollutants. We selected the largest estimate for each pollutant (Table 2). Sensitivity analysis of the exposure–response relationships between the five air pollutants and total hospital admissions, using two different models, produced statistically significant results (Supplementary Table S2). Using these parameters, WHAair for each day can be classified on a scale from 1 (lowest level) to 5 (highest level) (Supplementary Table S3). Table S4 presented the descriptive statistics of daily WHAair and AQI in Beijing from 2016 to 2018. Specifically, 2.5%, 37.9%, 34.0%, 15.9%, and 8.7% of days fell into low (1), median (2), high (3), very high (4), and severe categories (5), respectively. The distribution of WHAair better aligned with that of AQI than AQHI. As Table S3 presents, there were 9.0% of days at AQI level 5, but none at AQHI level 5.
City Air pollutants All population Aged 65 and older Aged 15 and below Beijing NO2 0.00152 0.00168 0.00101 O3 0.00065 0.00083 0.00058 SO2 0.00046 0.00042 0.00072 PM10 0.00019 0.00023 0.00015 PM2.5 0.00030 0.00037 0.00022 Tianjin NO2 0.00071 0.00102 0.00050 O3 0.00020 0.00014 0.00016 SO2 0.00001 0.00004 0.00009 PM10 0.00019 0.00019 0.00005 PM2.5 0.00037 0.00040 0.00010 Chongqing NO2 0.00139 0.00187 0.00152 O3 0.00077 0.00039 0.00023 SO2 0.00221 0.00320 0.00280 PM10 0.00022 0.00025 0.00037 PM2.5 0.00014 0.00017 0.00034 Table 2. Exposure-response relationships for non-accidental hospital admissions in the whole population and the vulnerable groups associated with each 10μg/m3 increase in daily concentrations of the five air pollutants
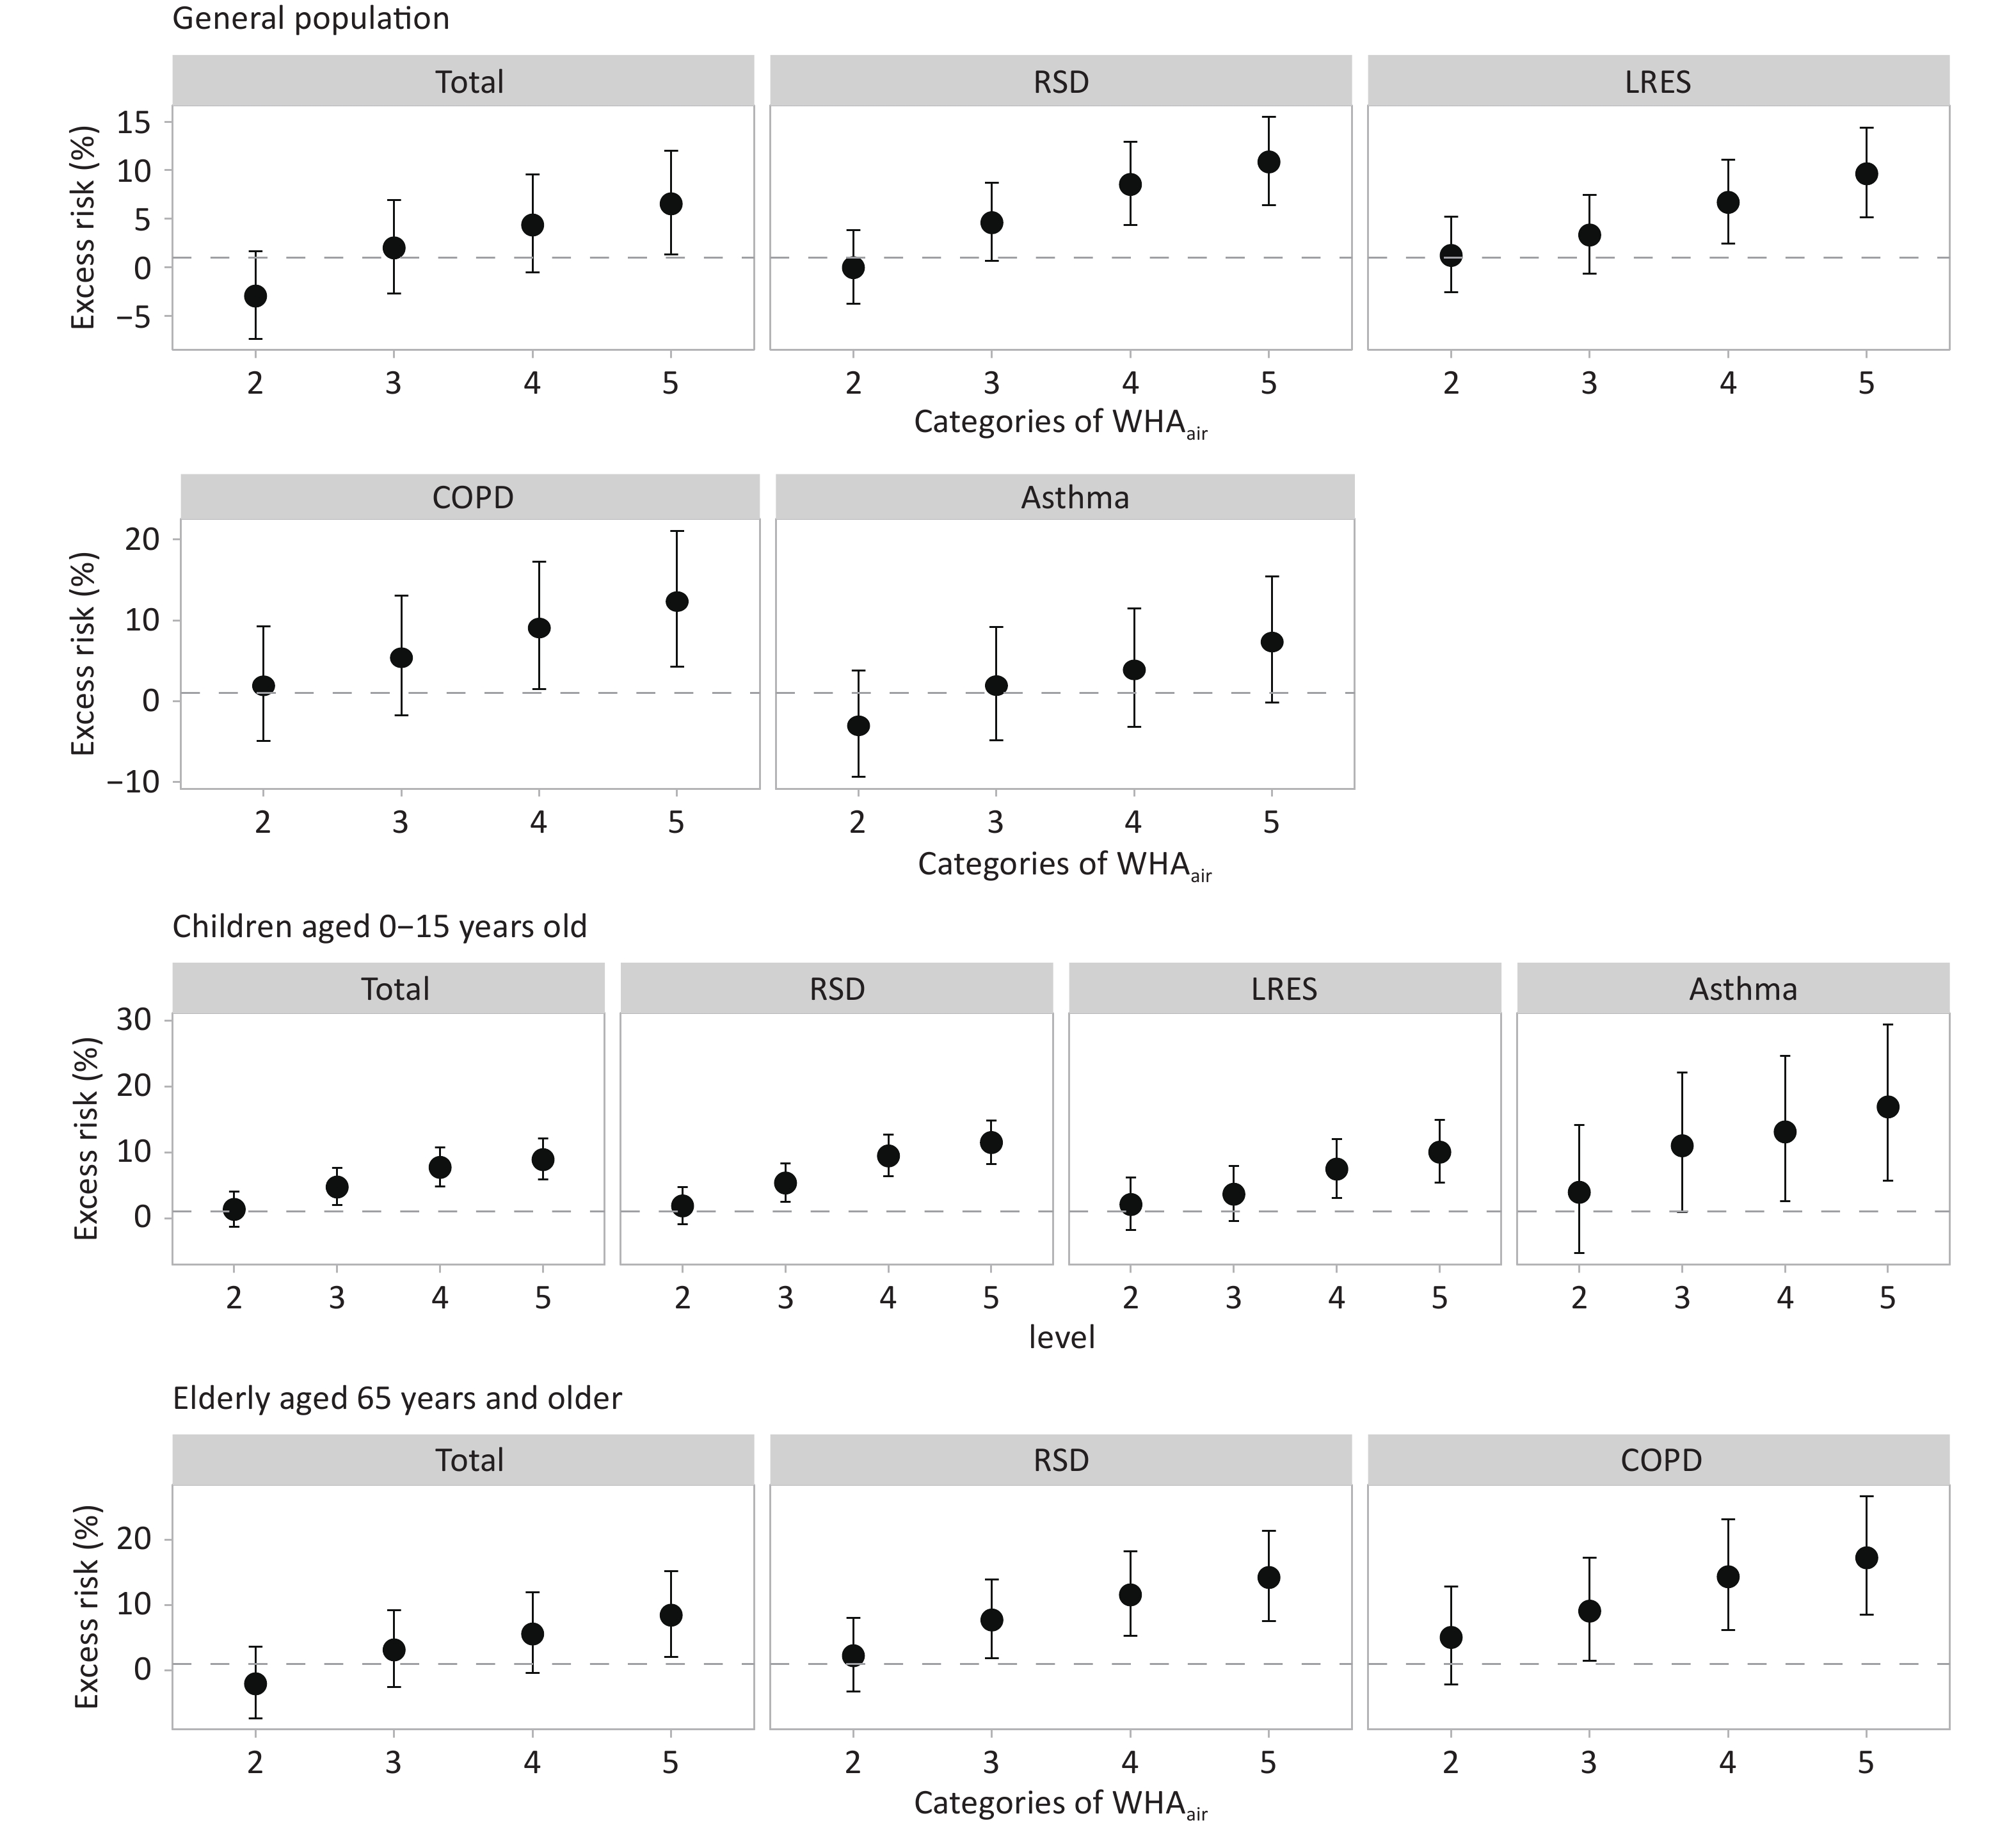
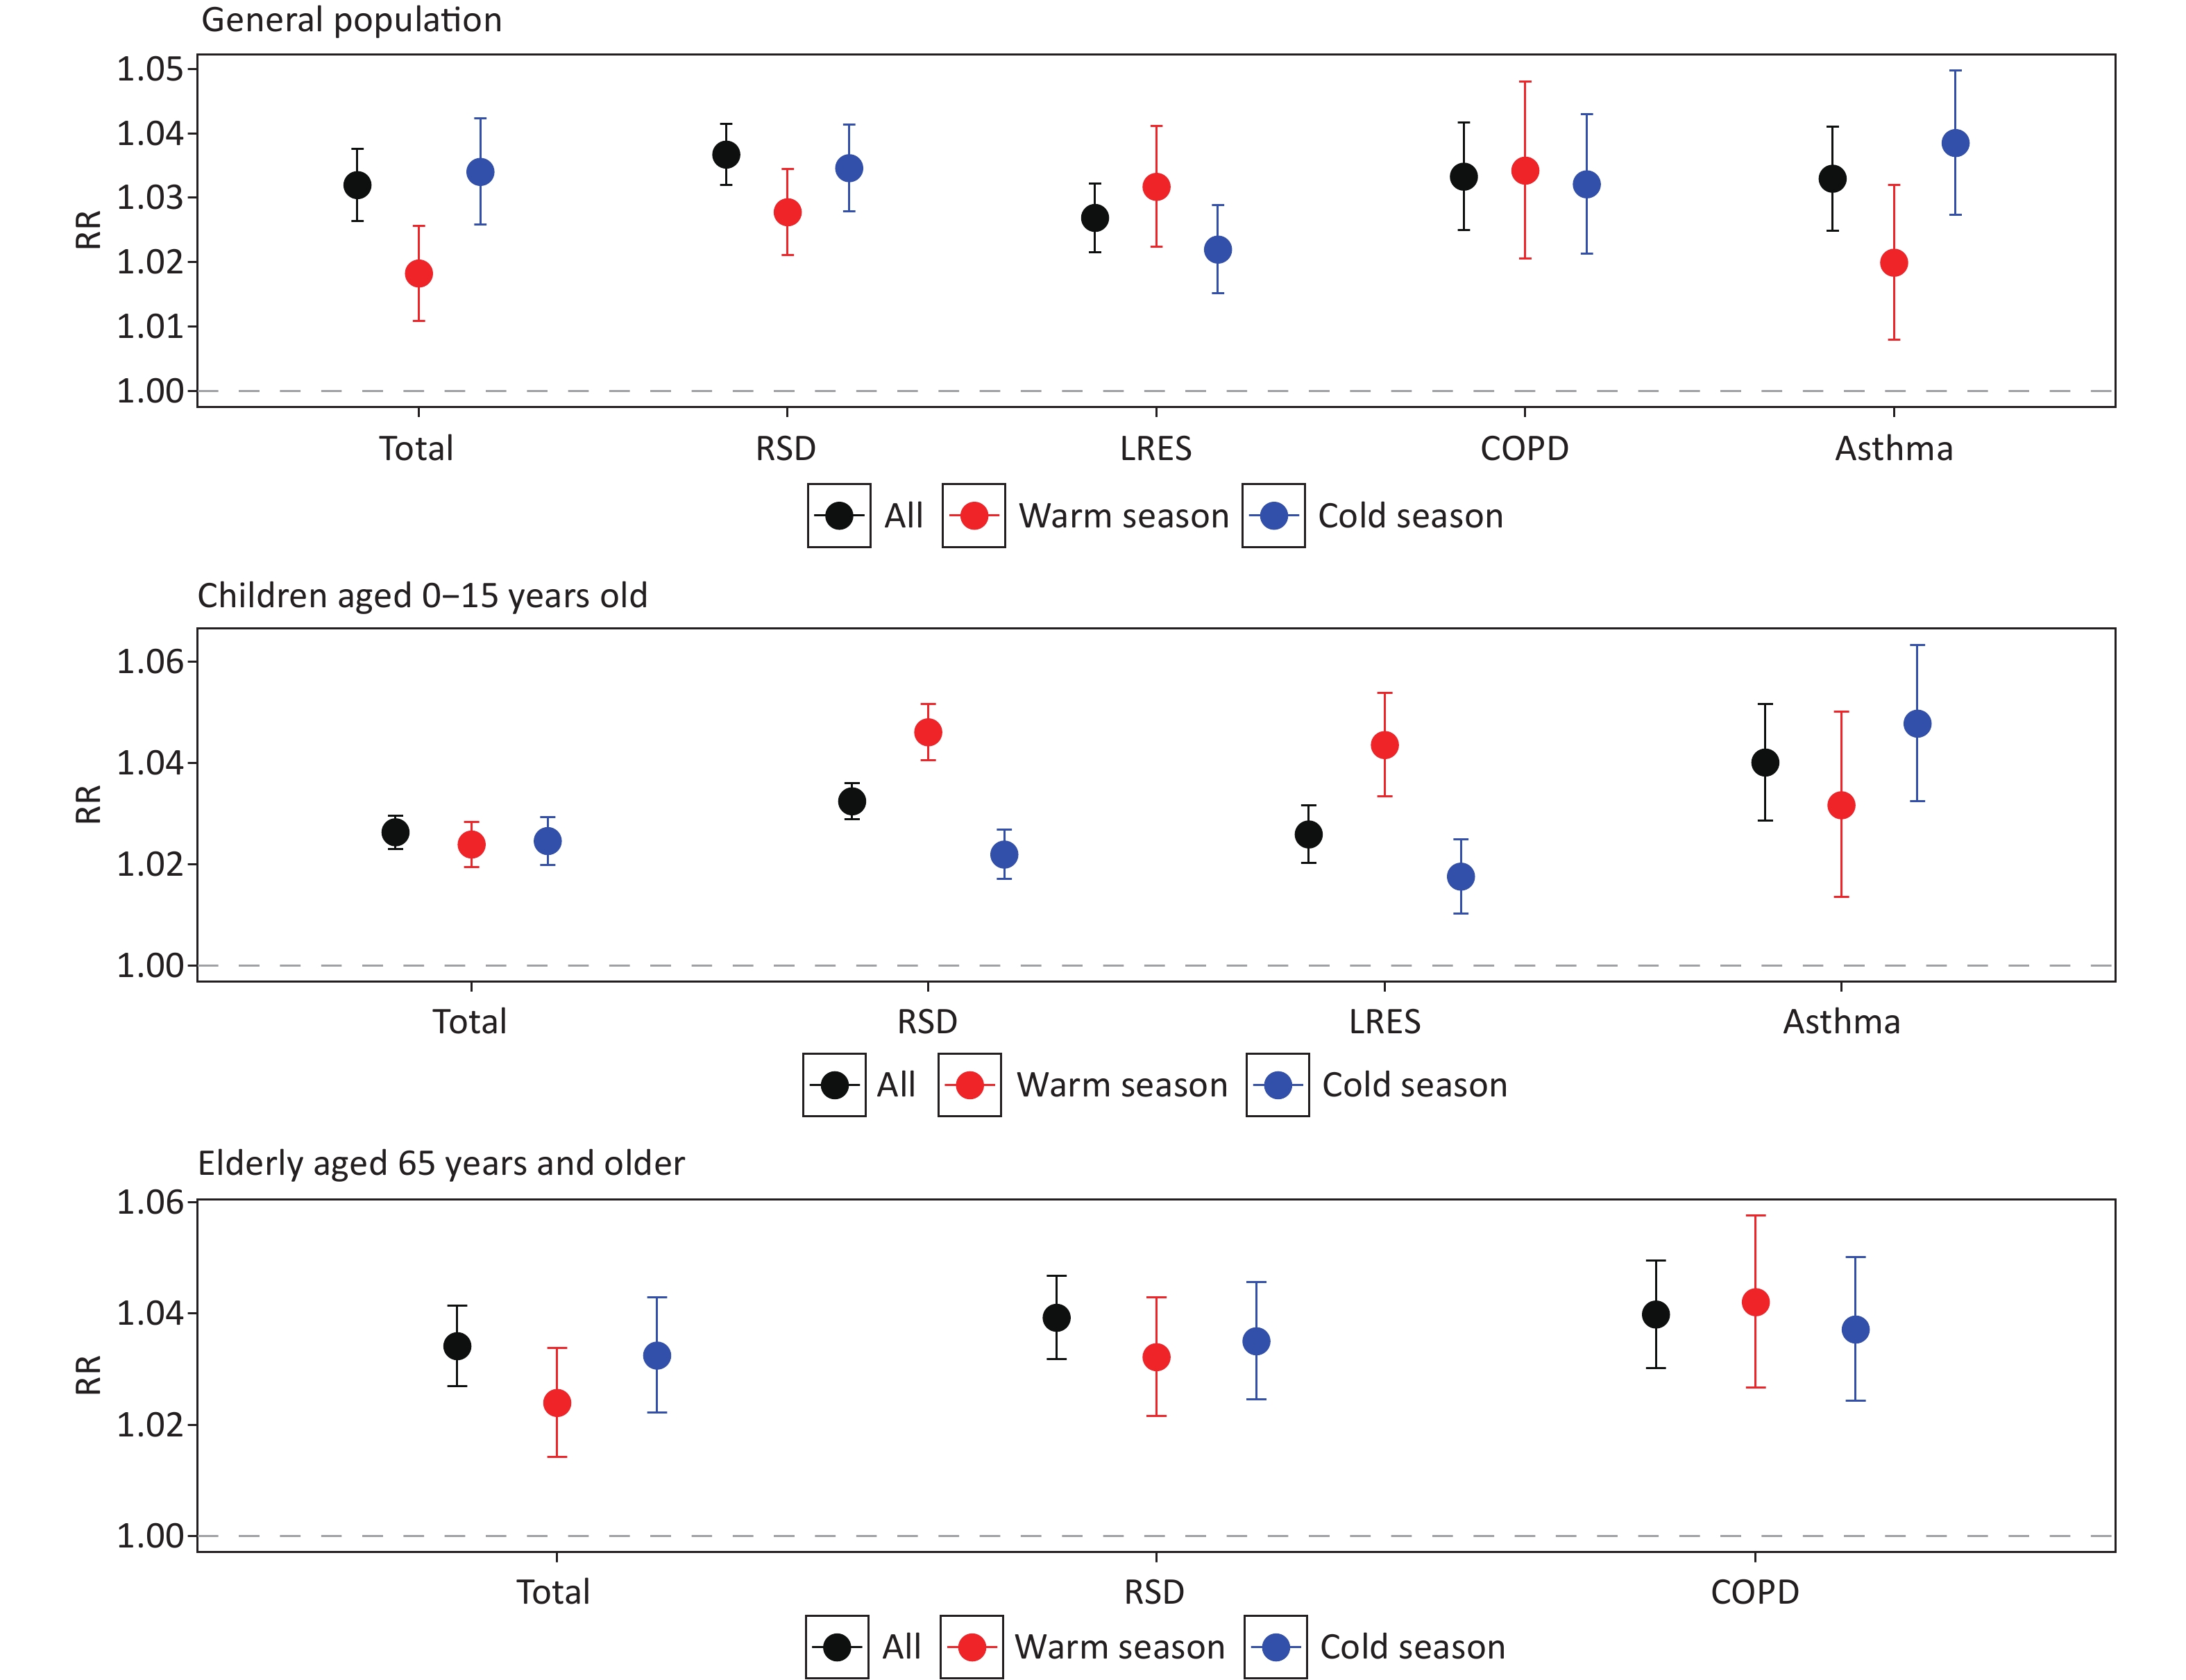
The validation results demonstrated the sensitivity of WHAair in indicating the risk of respiratory diseases associated with air pollution. First, WHAair as a whole was significantly associated with hospital admissions for non-accidental and respiratory diseases in the general population and vulnerable subpopulations, with stronger associations observed in the cold season than in the warm season across all groups (Figure 1). For children, WHAair showed a stronger association with respiratory outpatient visits during the warm season than the cold season. Second, there was a rising trend in the associations between cause-specific hospital outpatient visits and each category of WHAair (Figure 2). Compared to the reference (i.e., level 1), other WHAair categories (i.e., levels 2 to 5) were significantly associated with an increasing number of hospital outpatient visits, especially for respiratory diseases and their subtypes in vulnerable groups. For example, the relative risks for hospital outpatient visits related to respiratory diseases from WHAair levels 2 to 5 were -0.1% (95% CI: -3.8% to 3.8%), 4.6% (95% CI: 0.6% to 8.7%), 8.5% (95% CI: 4.3% to 12.9%), and 10.9% (95% CI: 6.4% to 15.5%), respectively. Comparative analysis showed WHAair outperformed traditional indices in health risk stratification for vulnerable populations (Supplementary Figure S3). For the non-accidental total morbidity risk, at the highest warning level, the relative risk (RR) of WHAair was 1.09 in the population aged 15 years or younger, and 1.09 in the population aged 65 years and older. In comparison, the corresponding RR values of AQI were 1.04 and 0.99, and those of AQHI were 1.08 and 1.00, respectively. Using the same approach, we developed the WHAair index for the cities of Tianjin and Chongqing (Supplementary Table S5) and validated each city’s index using local hospital outpatient data, including 29,228,691 visits in Tianjin and 124,546,360 visits in Chongqing. The external validation results shown in Supplementary Figures S4 and S5 also indicated that the WHAair index outperformed AQI in predicting city-level respiratory outpatient visits.
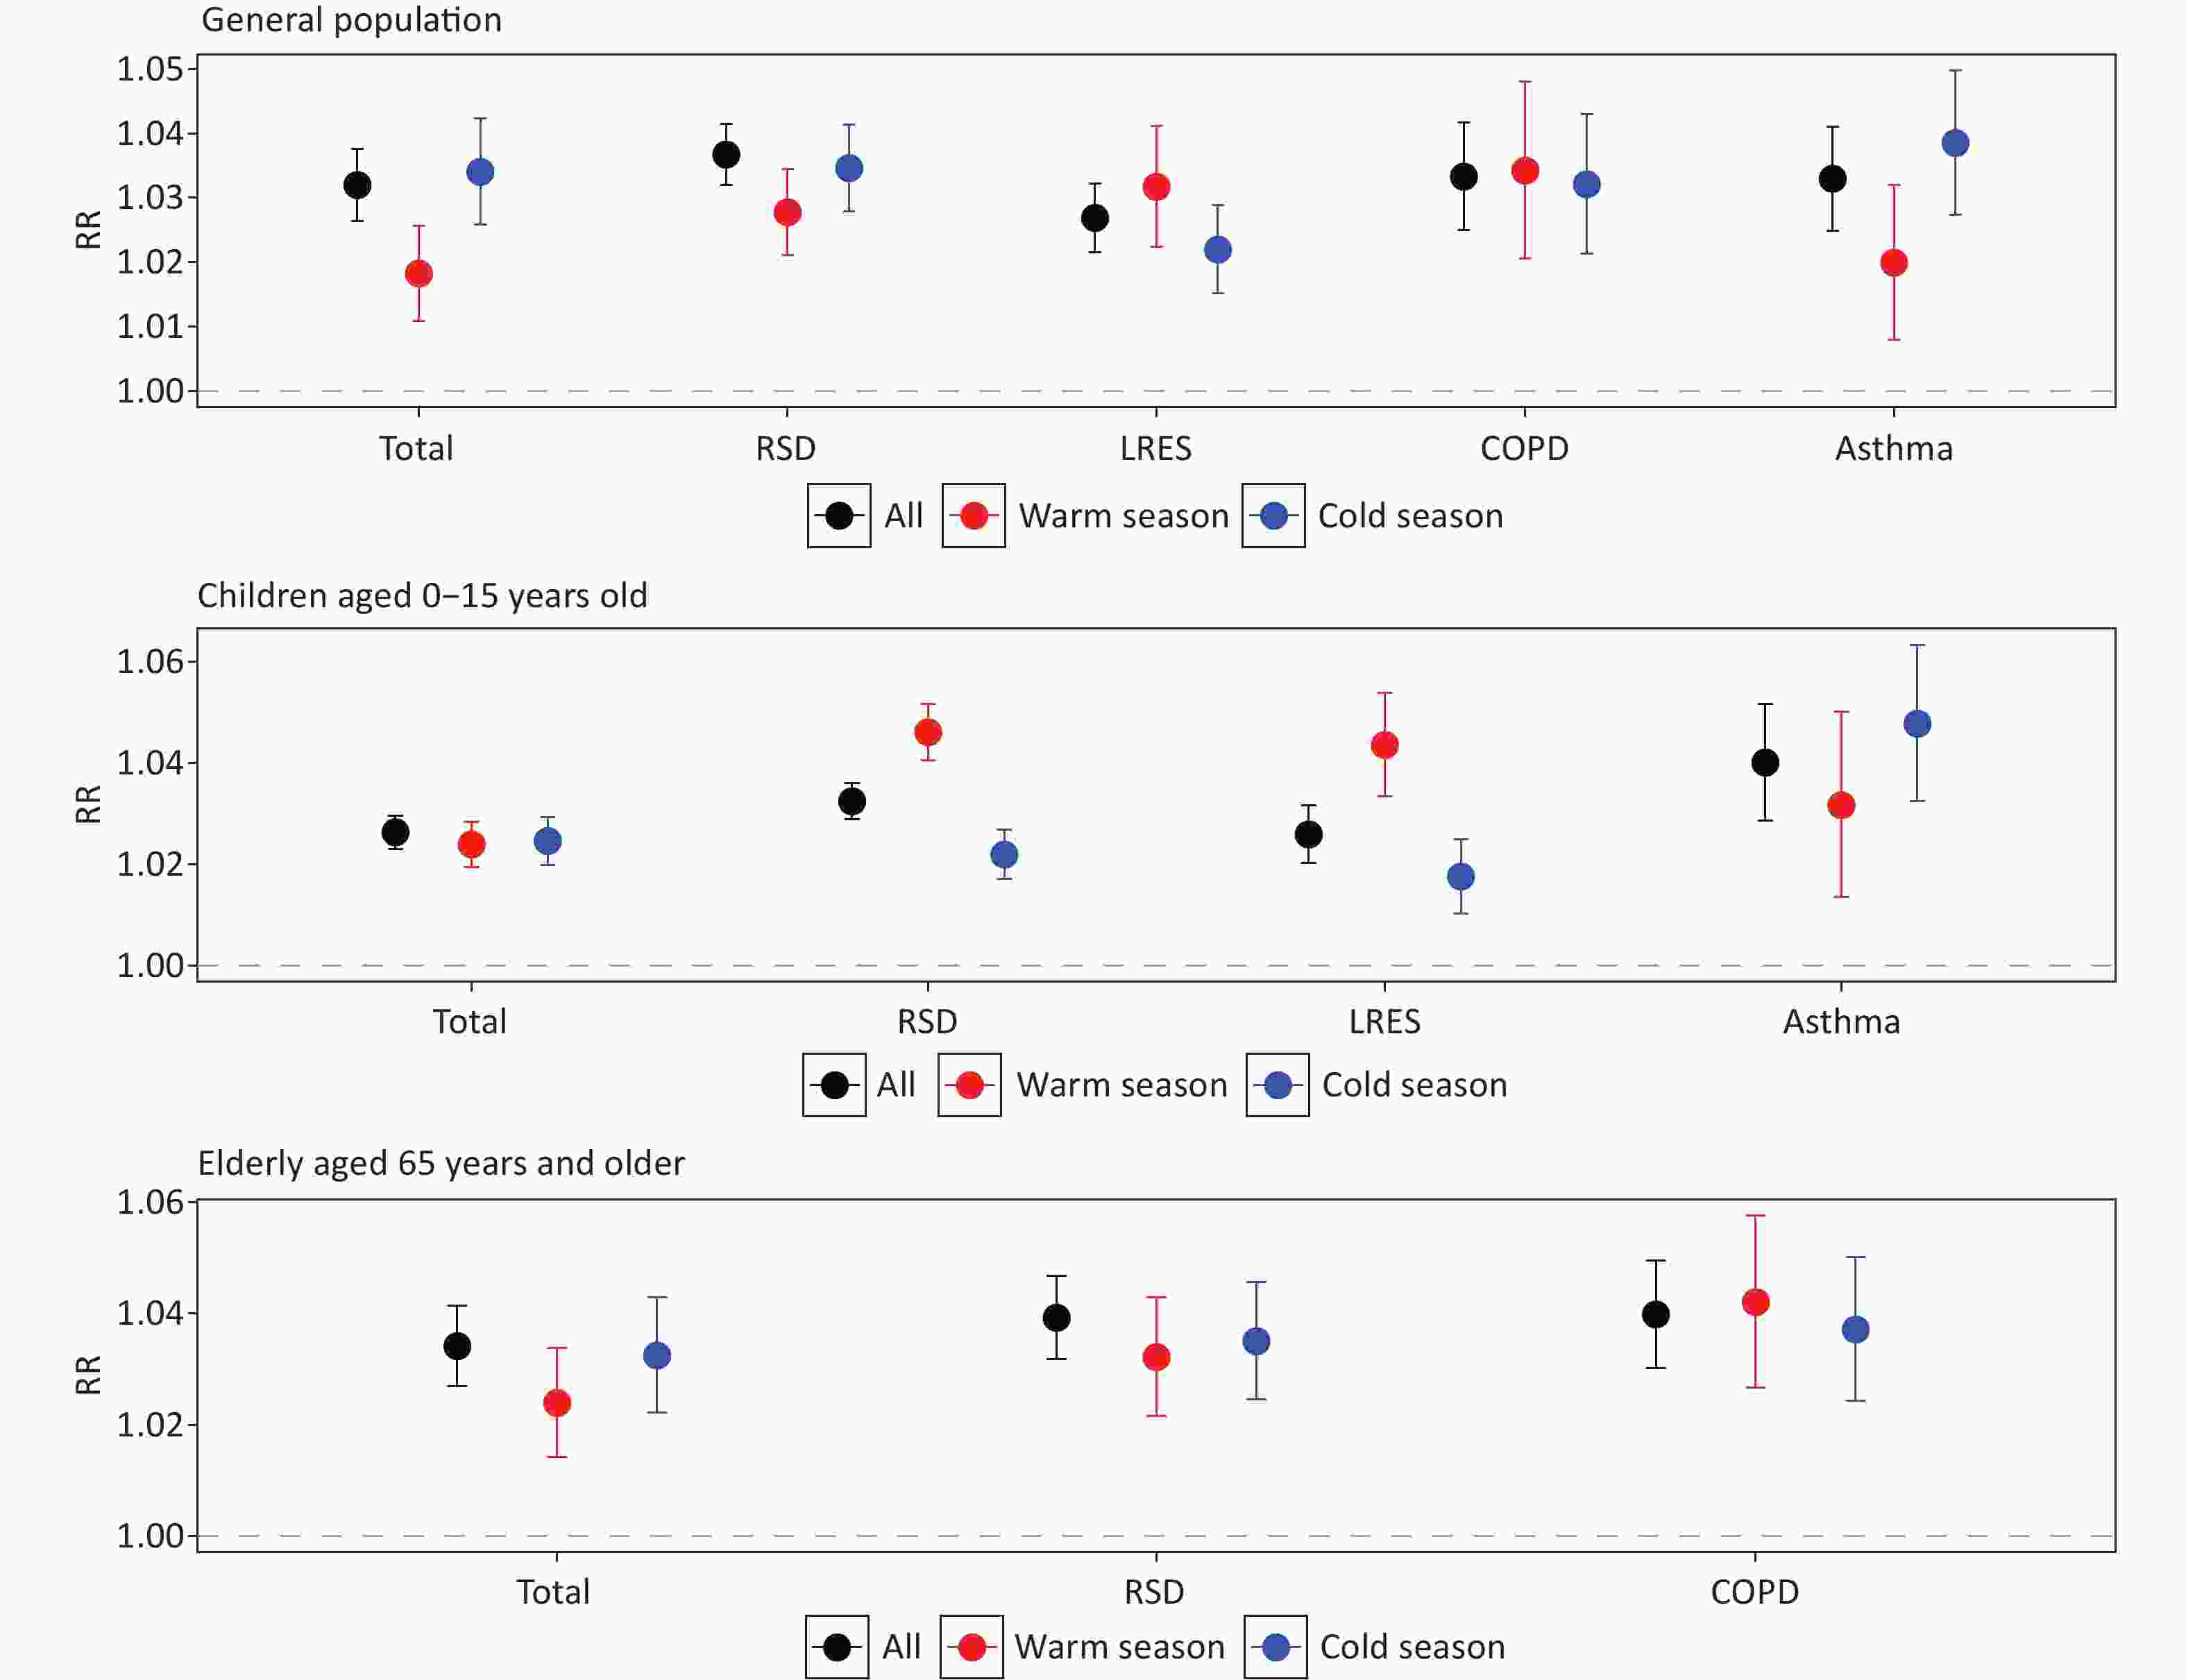
Figure 1. Associations between WHAair and outpatient visits for respiratory diseases across various population groups and seasons in Beijing, 2013–2018.Total: non-accidental hospital outpatient visits; RSD: respiratory system disease; LRES: lower respiratory system disease; COPD: chronic obstructive pulmonary disease.
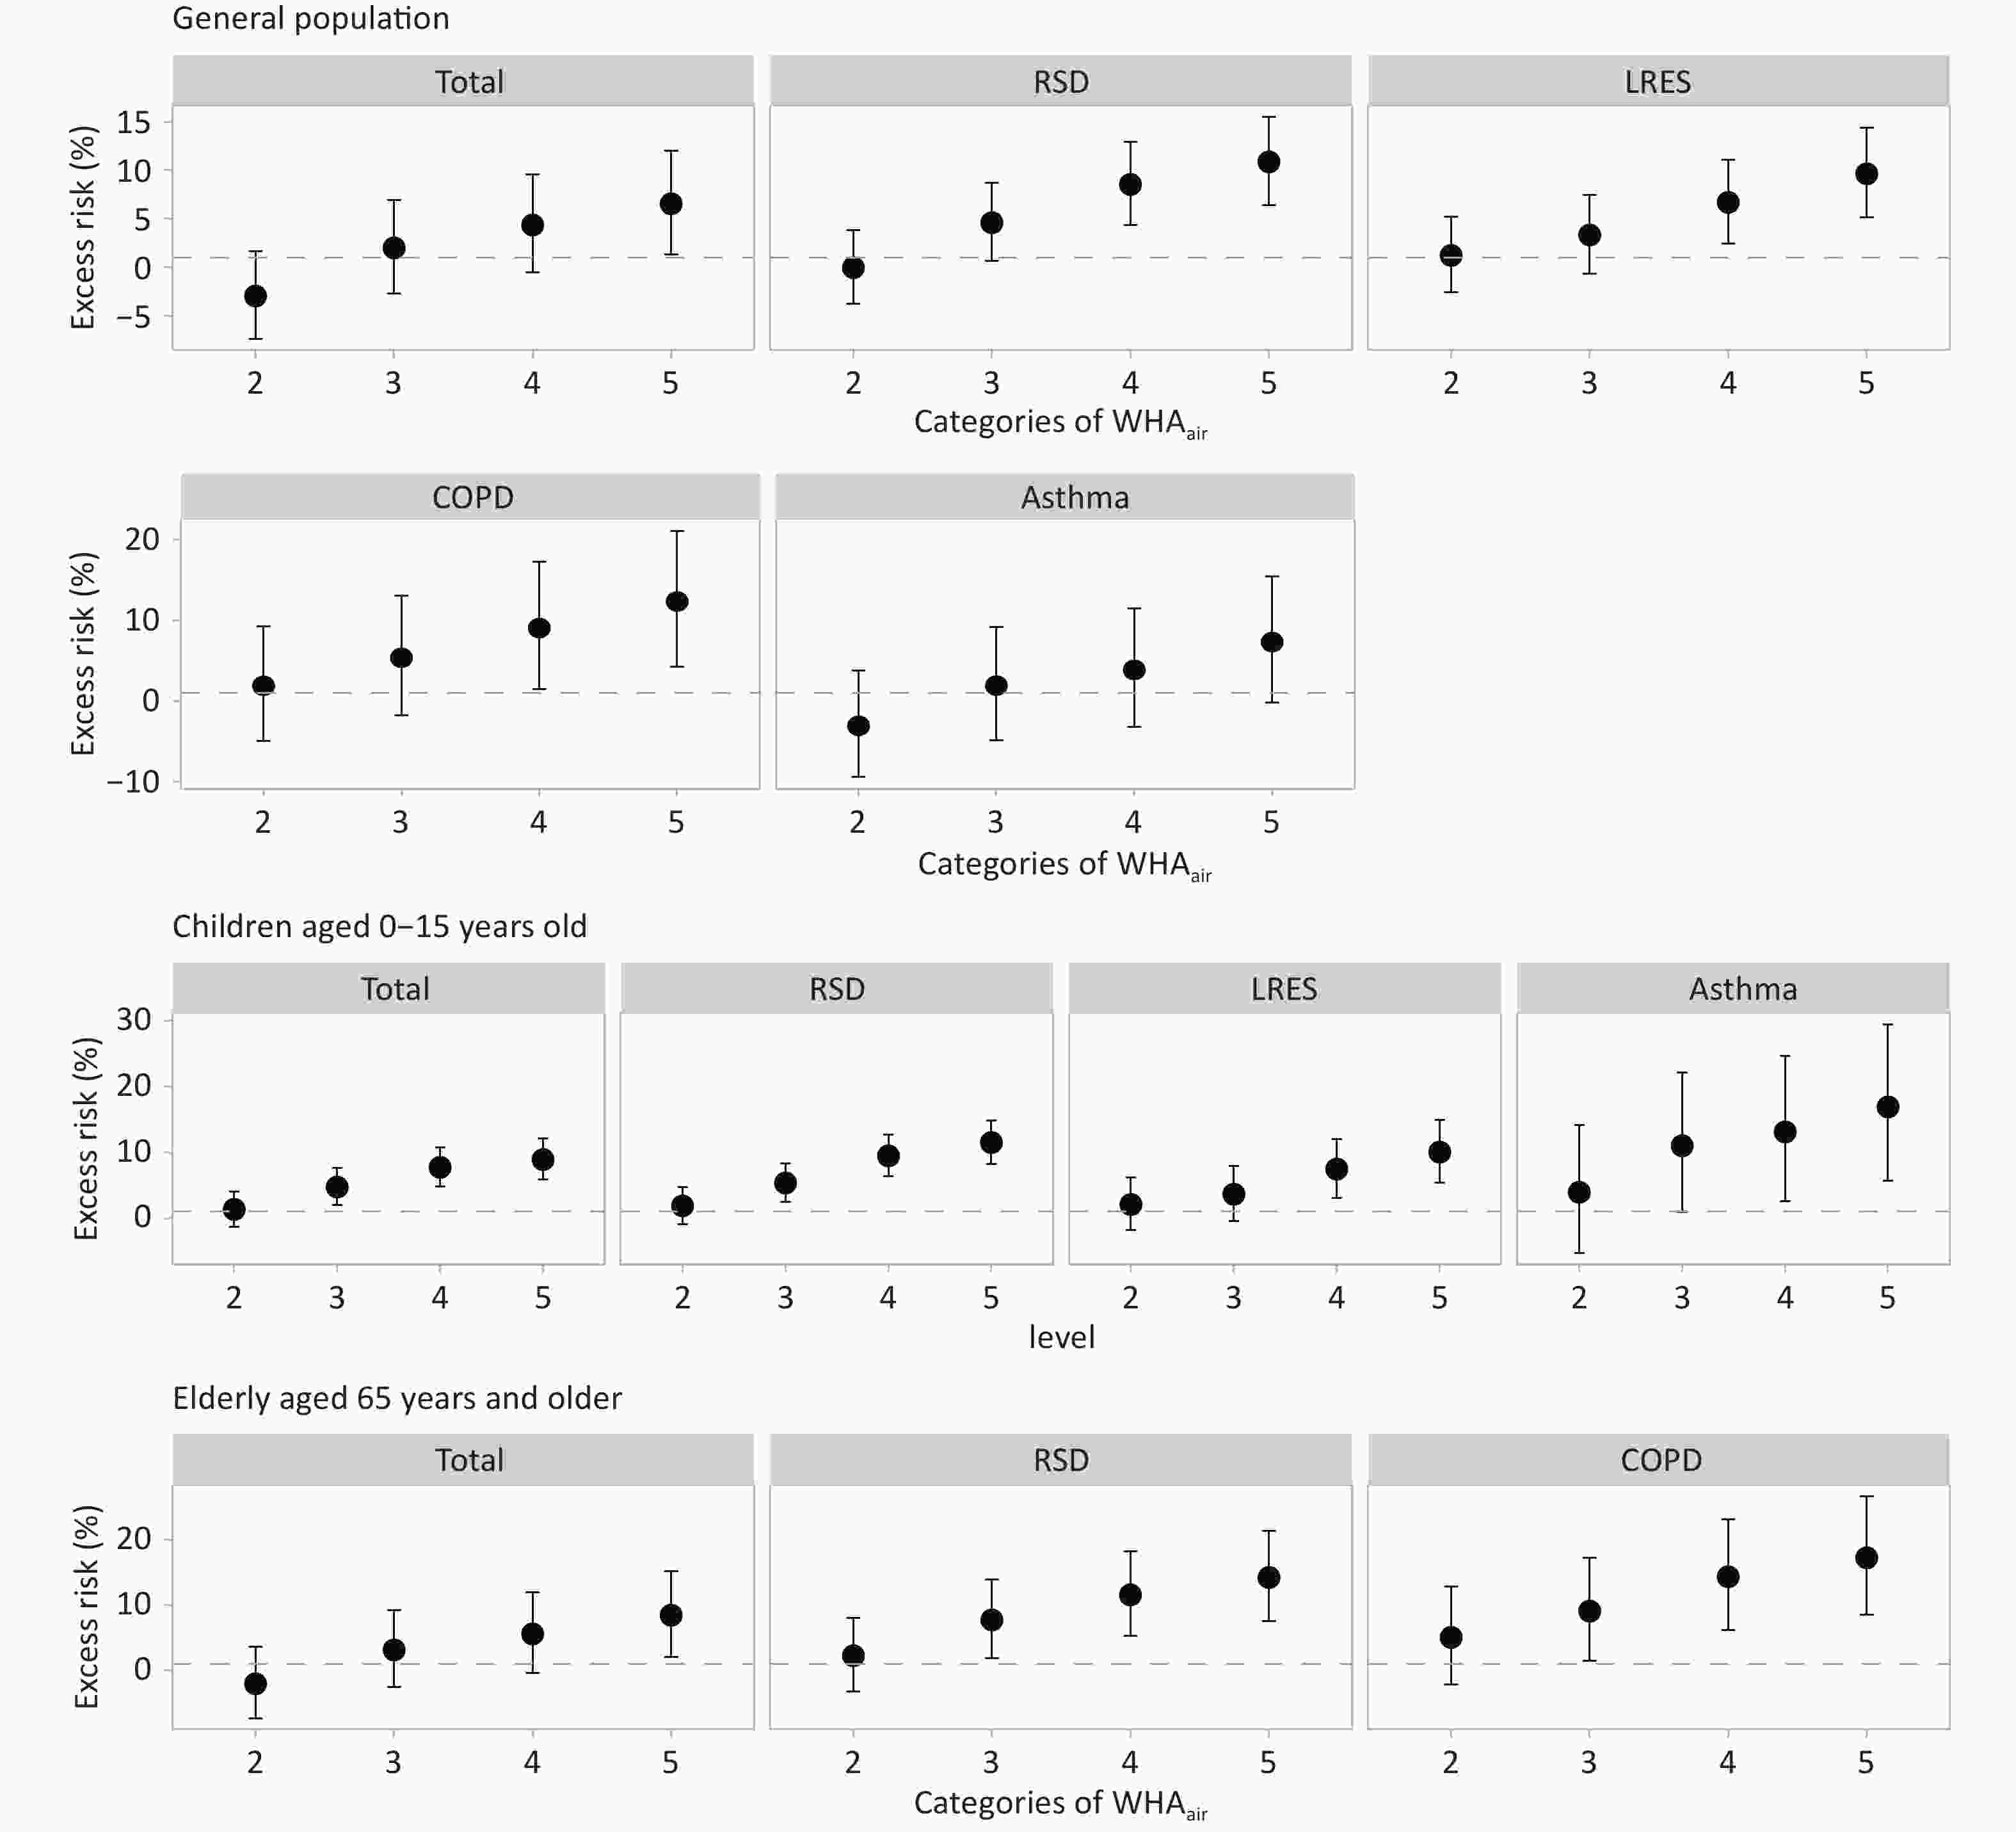
Figure 2. Associations between each category of WHAair and outpatient visits for respiratory disease in the entire population and vulnerable groups. Total: non-accidental hospital outpatient visits; RSD: respiratory system disease; LRES: lower respiratory system disease; COPD: chronic obstructive pulmonary disease.
-
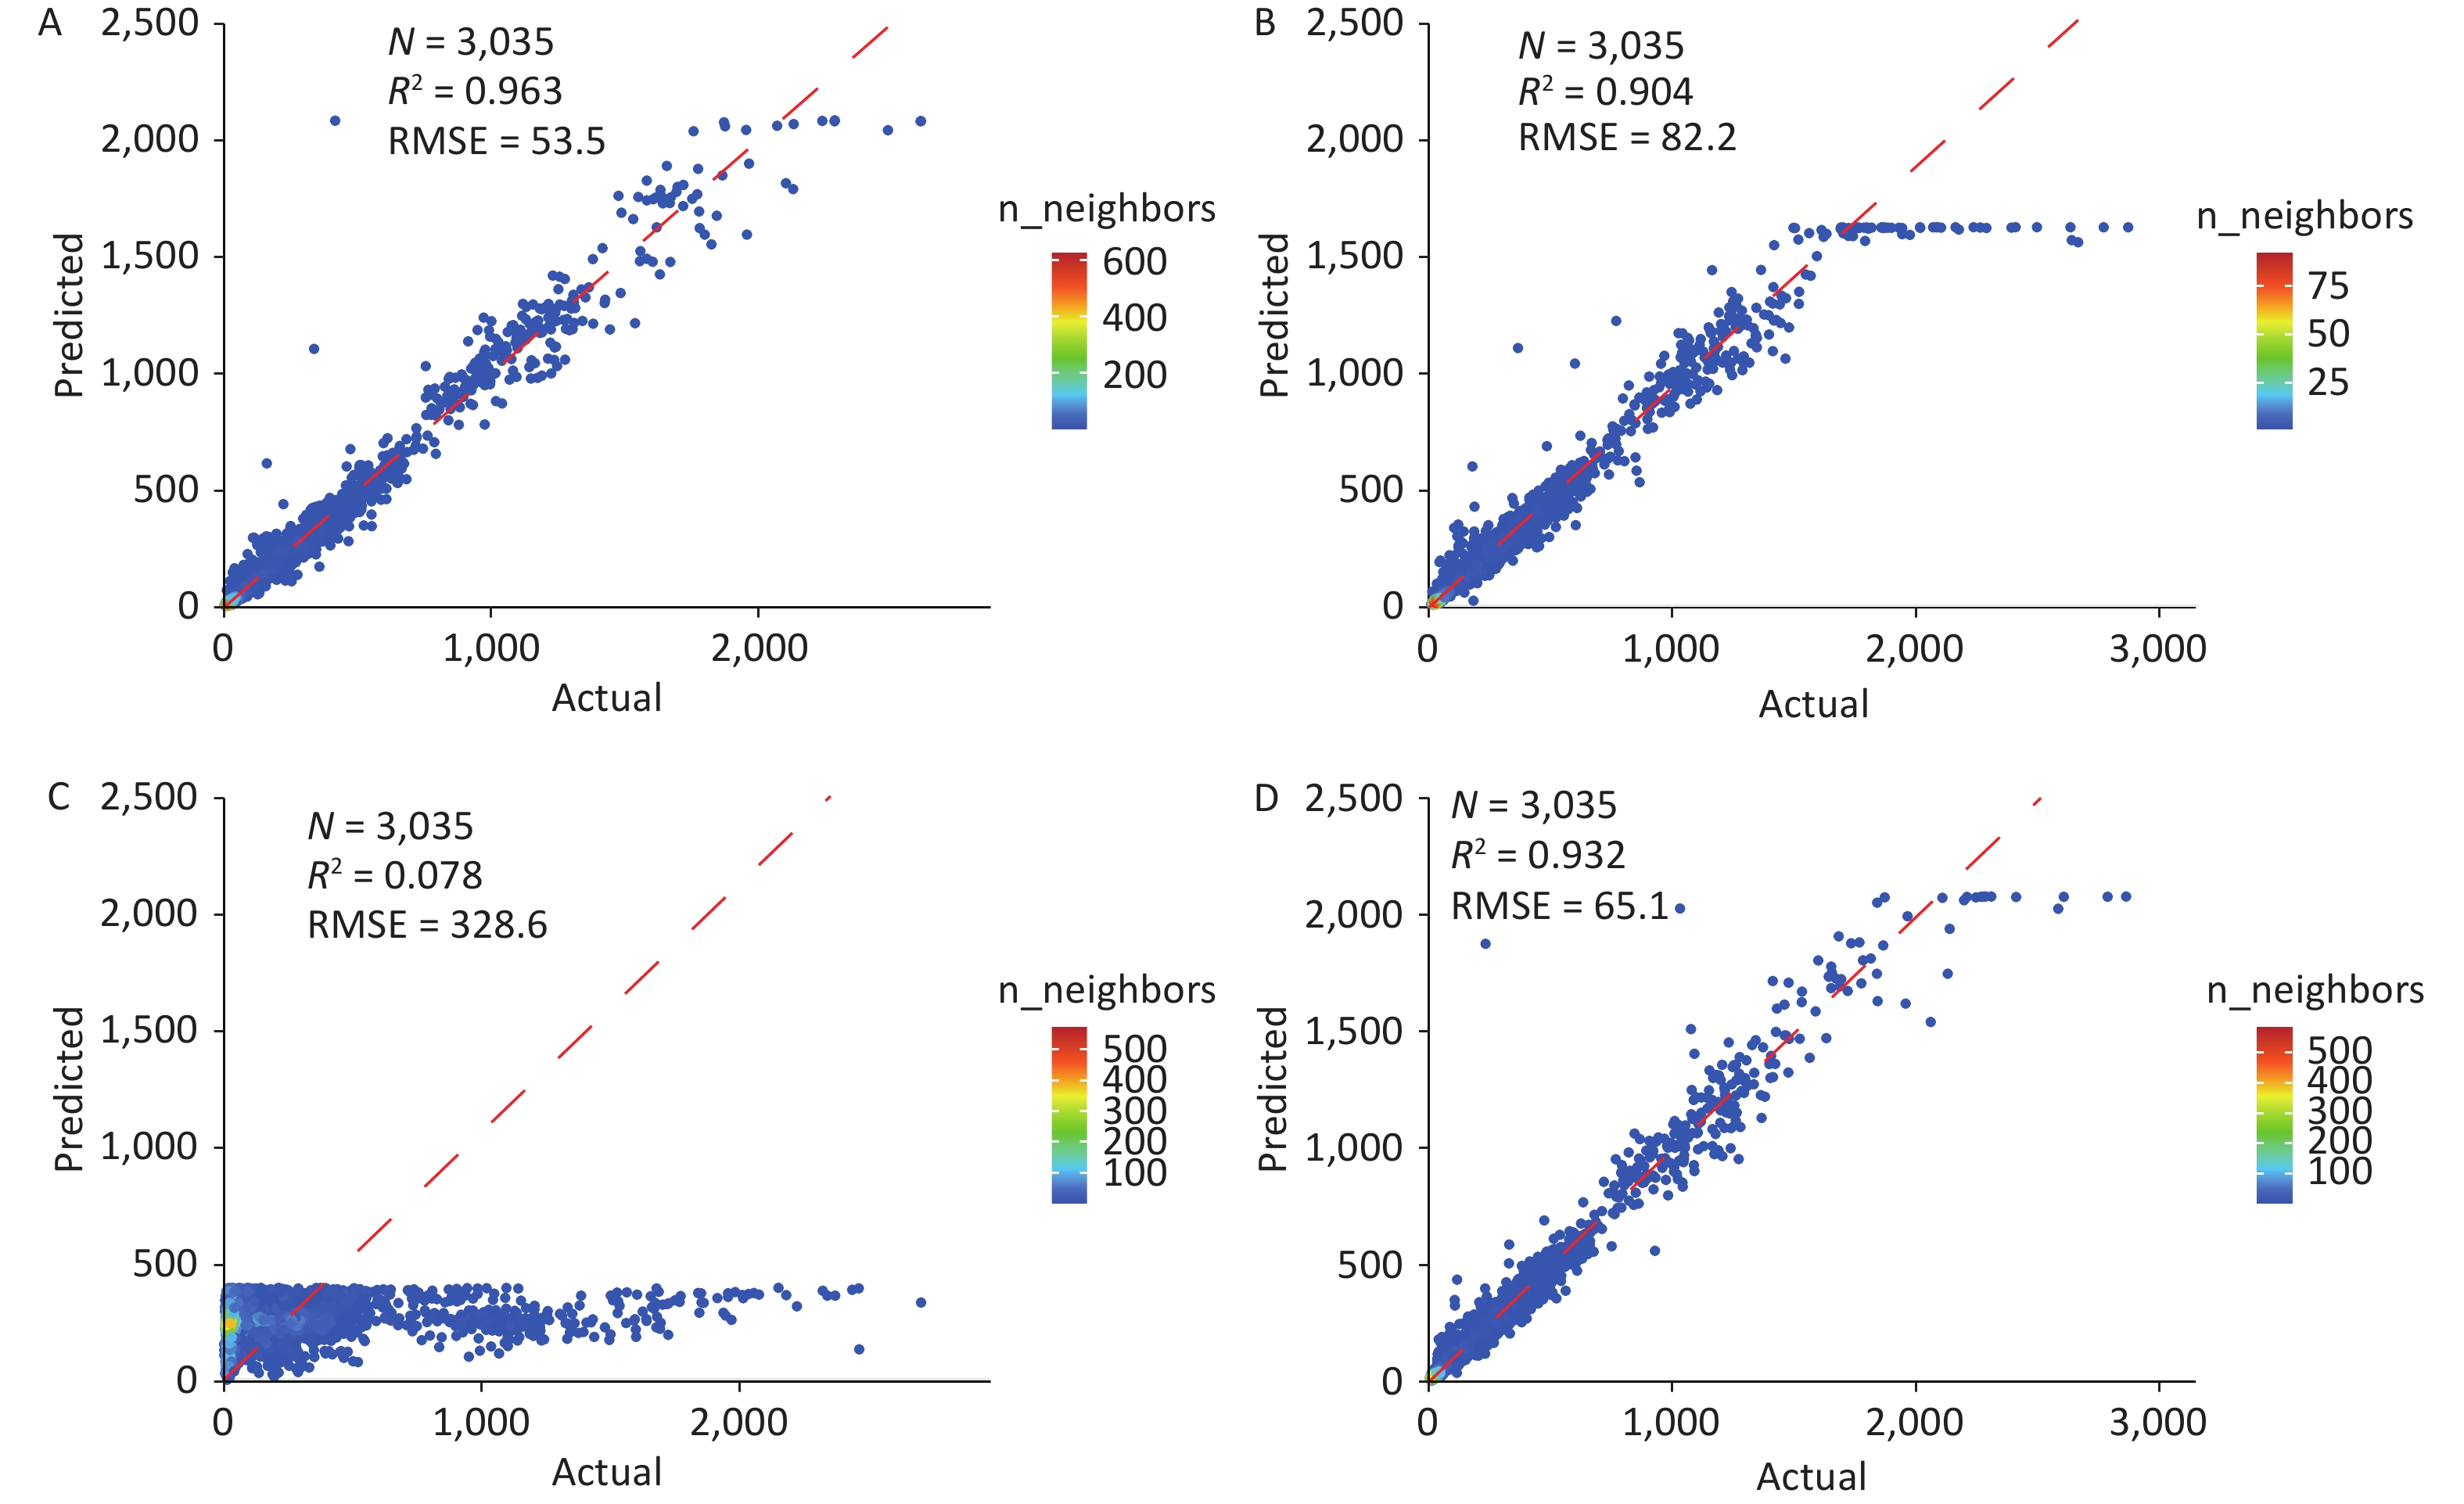
Our main model results showed that the R2 for the respiratory disease prediction model with WHAair is 0.963, RMSE is 53.5 visits, and it indicated significant robustness (Figure 3A). The optimal model structure was determined through extensive validation (Supplementary Figure S6). During peak periods (above the 90th percentile of visit volume, i.e., 1,322.4 visits), the main model achieved an RMSE of 540.46 visits and an MAE of 243.2 visits; among the 302 test samples above this threshold, it predicted 233 above it, yielding a detection rate of 77.15% (Supplementary Figure S7). We compared four predictive models to examine how different input variables and model complexity affect predictive accuracy (Figure 3). The R2 and RMSE values for these models are as follows: Model A (full model): 0.963 and 53.5; Model B (excluding WHAair): 0.904 and 82.2; Model C (excluding previous-day hospital visit): 0.078 and 328.6; and Model D (excluding temperature and relative humidity): 0.932 and 65.1. The comparisons indicate that relying solely on WHAair and meteorological factors (Models A and C) results in poorer prediction of respiratory risk. Excluding WHAair (Model B vs A) lowered accuracy and stability (ΔRMSE=+44.1%, ΔR2=-2.7%), while removing temperature/humidity had minimal impact. These findings underscore the significance of WHAair in capturing fluctuations in hospital outpatient visits compared to the general trend.
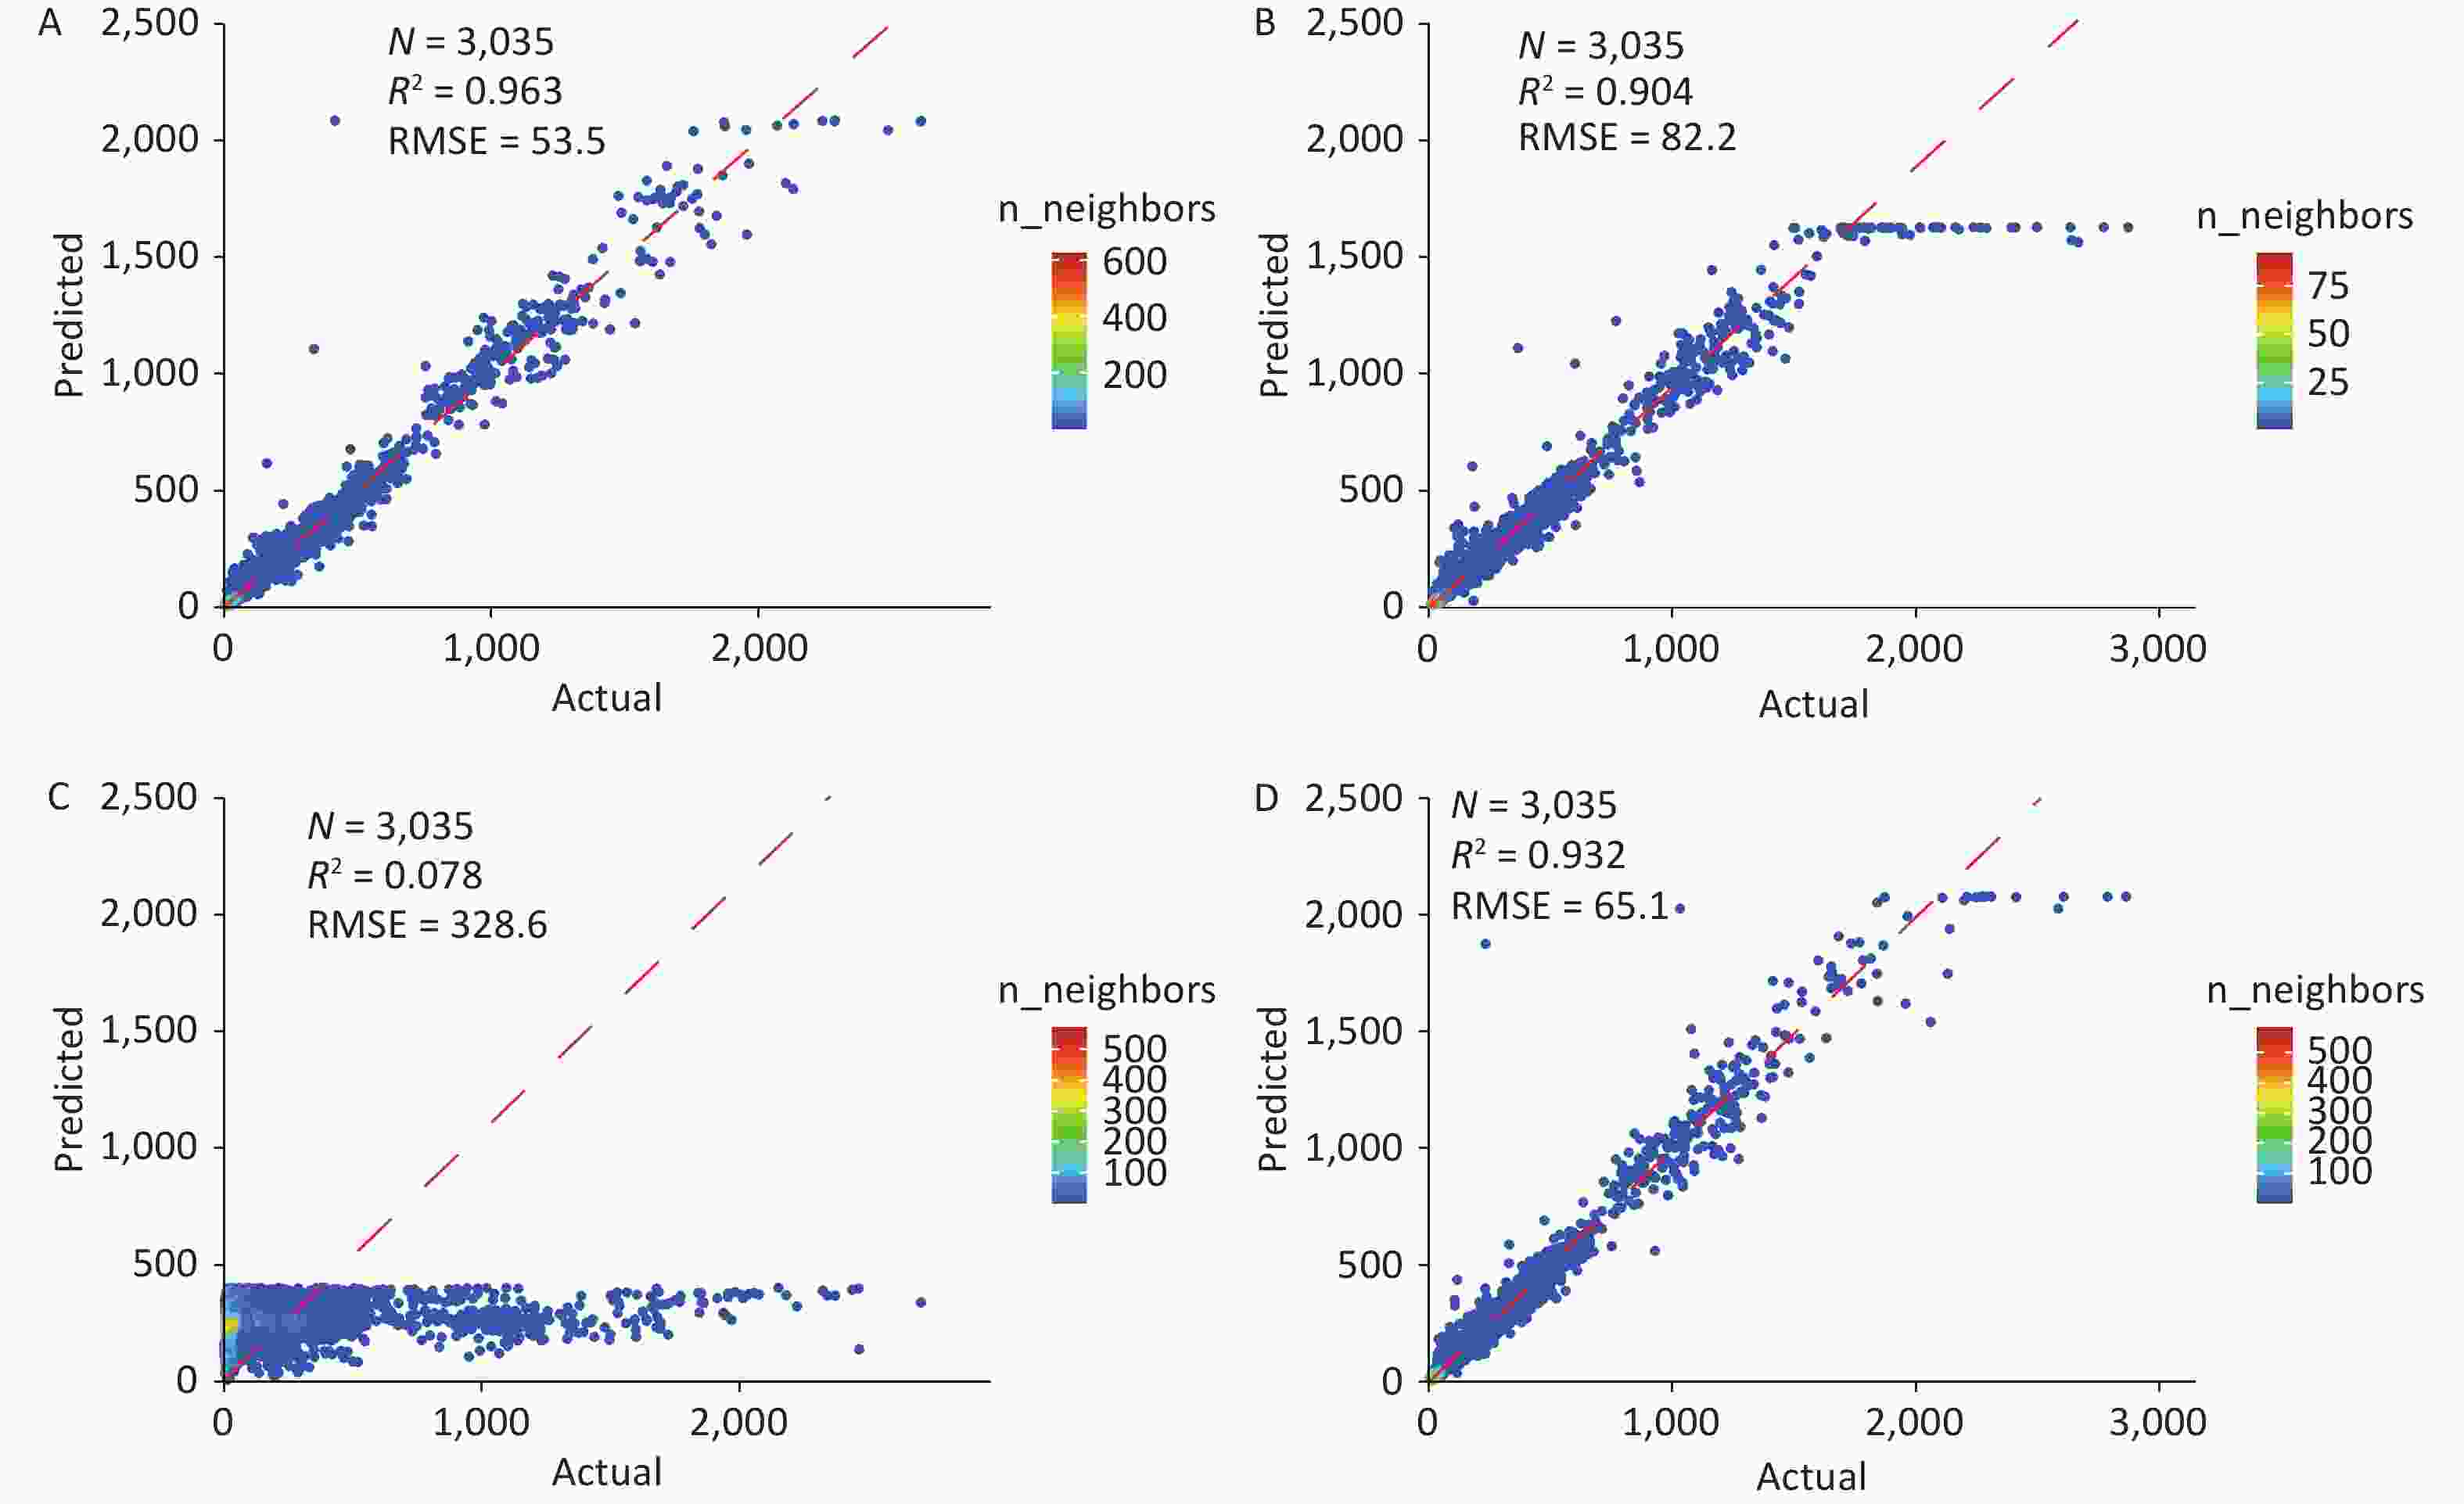
Figure 3. Scatterplot of actual versus predicted outpatient visits for model comparison. (A) Full model. (B) WHAair-excluded model. (C) Outpatient-visits-excluded model. (D) Temp-Humidity-excluded model.
Sensitivity analyses demonstrated the robustness of the model (Supplementary Figure S8). Under the time-based split, the independent test set performance was slightly lower than that under random splitting (for the Beijing dataset, R2 decreased from 0.963 to 0.891). Despite this performance drop, the model still captured the overall trend in daily outpatient visits during the independent test period (Supplementary Figure S7). Furthermore, compared with traditional statistical models, the WHAair-LSTM framework demonstrated superior predictive performance. On the same validation dataset, the LSTM model significantly outperforms the generalized additive model and the seasonal ARIMA model (Supplementary Table S6).
-
The framework’s universality was confirmed through external validation in two major cities, Tianjin and Chongqing, each with unique air pollution patterns and population traits (Supplementary Table S5). The performance of the models using data from these cities was similar to that of Beijing. The WHAair model exceeded the AQI in predicting respiratory outpatient risks, as illustrated in Supplementary Figures S4 and S5. The LSTM model with 128 units showed consistent, strong predictive results on the test data from both cities (Supplementary Figures S9 and S10). Specifically, the R2 for Tianjin's test set was 0.905 with an RMSE of 40 visits, while Chongqing’s R2 was 0.899 with an RMSE of 80 visits. The effectiveness of WHAair was further confirmed with additional data from Tianjin and Chongqing. The model validation for the two cities also employed a strict time-segmented design. Detailed prediction results are provided in Supplementary Figures S11 and S12.
-
Based on over 223.7 million hospital visits from three megacities, the city-specific WHAair-LSTM framework developed and validated in this study demonstrated its predictive ability for respiratory outpatient visits. Notably, our framework offered four major innovations over existing research: 1) we built the model focusing on individual cities rather than the entire country; 2) when selecting model features, we created the WHAair index to represent the overall impact of combined air pollution instead of individual pollutants; 3) we established an effective model by inputting four variables for prediction; 4) we performed strict external validation using datasets from Tianjin and Chongqing, which confirmed its universality. Therefore, the WHAair-LSTM framework may serve as an effective tool for integrating environmental monitoring, disease prevention, and healthcare, thereby contributing to city-level early warning systems for disease risk.
Our framework provides an effective method for predicting respiratory disease risk, with several key benefits. First, integrating the WHAair index with the LSTM model overcomes traditional limitations. Unlike models that rely on single pollutants, WHAair combines the effects of multiple pollutants, enabling the model to better identify non-linear relationships between air pollution and respiratory disease[38]. Second, including outpatient data from the past three days enhanced predictive stability and relevance. It captured short-term visit trends and emphasizes pollution-driven extra visits, aligning with the 1–3-day lag of respiratory diseases. Third, the framework balances accuracy and usability. It delivers actionable performance with only four readily available variables within a three-day exposure window. Notably, prediction errors of the WHAair-LSTM framework increase when hospital visits exceed the 90th percentile, primarily because of unpredictable extreme peaks from complex social behaviors[39,40]. Nevertheless, from a public-health perspective, its ability to capture the acute effect and upward slope of surges provided hospitals with sufficient lead time to initiate emergency plans. To evaluate prospective predictive performance, we performed a time-based sensitivity analysis in addition to random split evaluation. The model achieved satisfactory accuracy and captured surging trends in future outpatient visits (R2=0.891). As it does not rely on future information during training, the LSTM model showed favorable generalizability for real-world public health applications.
The WHAair-LSTM framework showed strong external validity and global potential. Many models that connect air pollution to health risks, built on traditional regression or simpler machine learning methods, often lack thorough external validation, limiting their usefulness. Although these models perform well in primary cities, they tend to have higher mean absolute error (MAE) in nearby regions[41]. Models trained across multiple centers often encounter performance gaps during extrapolation because of data heterogeneity[42]. In contrast, our framework has undergone thorough external validation in Tianjin and Chongqing: two cities with different pollution patterns[36]. Air pollution in Tianjin is mainly caused by industrial emissions, while Chongqing’s pollution is primarily affected by its mountainous terrain and basin-like geography[37]. These scenarios align with global paradigms such as the U.S. Rust Belt, Western European industrial cities mirroring Tianjin, and subtropical Brazilian and Indian cities resembling Chongqing. Such external validation enhances the model’s applicability in urban air health risk assessment. It is noteworthy that the WHAair index needs to be customized based on local historical data, so that the model can adapt to the unique urban pollution patterns.
Using the city-specific WHAair-LSTM framework to predict the risk of air pollution-related diseases provides a valuable tool for public health and medical services. On one hand, health professionals from the Centers for Disease Control and Prevention, hospitals, clinics, and community medical organizations can take different actions based on the level of WHAair and deliver timely, authoritative information to the public, including the general population and vulnerable groups. On the other hand, this approach can be integrated into the development of early warning systems—a cost-effective risk-reduction measure adopted worldwide[43]. Therefore, by being informed of potential outpatient visits in advance, medical services can prepare for the increased demand caused by heavy pollution, such as appropriately relocating medical resources. Doctors can also advise patients to monitor their health and avoid exposure to hazardous conditions and pollution.
However, three limitations must be acknowledged. First, data limitations restrict WHAair to city- or county-level analyses, precluding assessment of intra-urban variability, and the model showed limited predictive performance for non-respiratory diseases. Second, shifts in healthcare benchmarks and weekend or holiday effects may bias temporal coverage, and the model’s fixed parameters may fail to capture sudden surges in visits driven by these factors. Third, our simplified model does not account for potential confounders such as extreme weather events or seasonal co-epidemics of infectious diseases, which may contribute to prediction discrepancies during extreme peak periods[44]. Future research could explore disease-specific indices and their application in city-level prediction.
-
This study developed and validated a city-specific predictive framework (WHAair-LSTM) that effectively forecasts respiratory outpatient visits by integrating multi-source environmental and health data. This framework can be applied as a specific tool to facilitate early warning of respiratory disease risks.
HTML
Study Design
Establishment of City-specific WHAair
Prediction Model for Respiratory Disease Outpatient Visits Using WHAair
Long Short-Term Memory Model
Data Processing and Model Training
Sensitivity and Robustness Analysis
External Validation of the Methodology
Construction and Validation of the WHAair-LSTM Framework
The Establishment and Validation of WHAair
Predictive Performance and Robustness of the WHAair-LSTM Framework
Generalizability Across Megacities
Data Sharing Data on air pollution concentrations can be obtained from the National Monitoring Platform (https://air.cnemc.cn:18007). The total number of daily hospitalizations is sourced from the Municipal Health Commission Information Center. The data that support the findings of this study are available from the corresponding author upon reasonable request.
&These authors contributed equally to this work.

 Quick Links
 DownLoad: