
-
Metabolic dysfunction-associated steatotic liver disease (MASLD), as recently redefined in 2023[1], and chronic hepatitis B virus (HBV) infection are two of the most prevalent global liver diseases, with prevalence rates of 30%[2] and 4.1%[3], respectively. HBV remains the leading cause of liver disease-related mortality in China[4]. Concurrently, the burden of MASLD is escalating because of the rising prevalence of obesity and sedentary lifestyles[5]. Given the frequent coexistence of HBV infection and MASLD (14%–67% among Asian individuals)[6], understanding the implications of hepatic steatosis in patients with HBV infection is crucial for surveillance and risk stratification of adverse outcomes.
Both chronic HBV infection and MASLD are associated with an increased risk of cirrhosis, primary liver cancer (PLC)[7], extrahepatic cancers (EHCs), and mortality[8-11]. Cardiovascular disease (CVD) are the primary cause of death in MASLD participants[12], although the association between HBV infection and CVD remains inconsistent[13]. Importantly, a meta-analysis suggested that concurrent steatotic liver disease (SLD) increased the risk of cirrhosis and PLC in patients with chronic HBV-infection[14]. However, this conclusion is being challenged as other meta-analyses[15] have reported non-significant findings; the inconsistency may stem from bias introduced by heterogeneous diagnostic methods and outcome assessments[16].
Furthermore, disentangling the independent contributions of SLD to intra- and extra-hepatic outcomes from its association with cardiometabolic risk factors (CMRFs) represents a critical gap. This distinction is particularly relevant given that metabolic abnormalities in patients with chronic HBV infection increase the risk of PLC, EHCs, and CVD. Additionally, most previous studies have assessed MASLD at a single time point, leaving its temporal evolution and reversibility largely unexplored in relation to long-term outcomes.
The Kailuan cohort, a population-based prospective study located in Tangshan, Hebei Province, North China, exhibited a hepatitis B surface antigen (HBsAg) prevalence of 2.90%, which is consistent with a previously reported HBsAg prevalence of 3.26% in Hebei Province[17]. This study aimed to investigate the relationship between concurrent MASLD, changes in MASLD status, and intra- and extrahepatic outcomes in patients with chronic HBV infection. Moreover, the study aimed to explore the independent and joint associations among MASLD, cardiometabolic risk factors, and HBV infection.
-
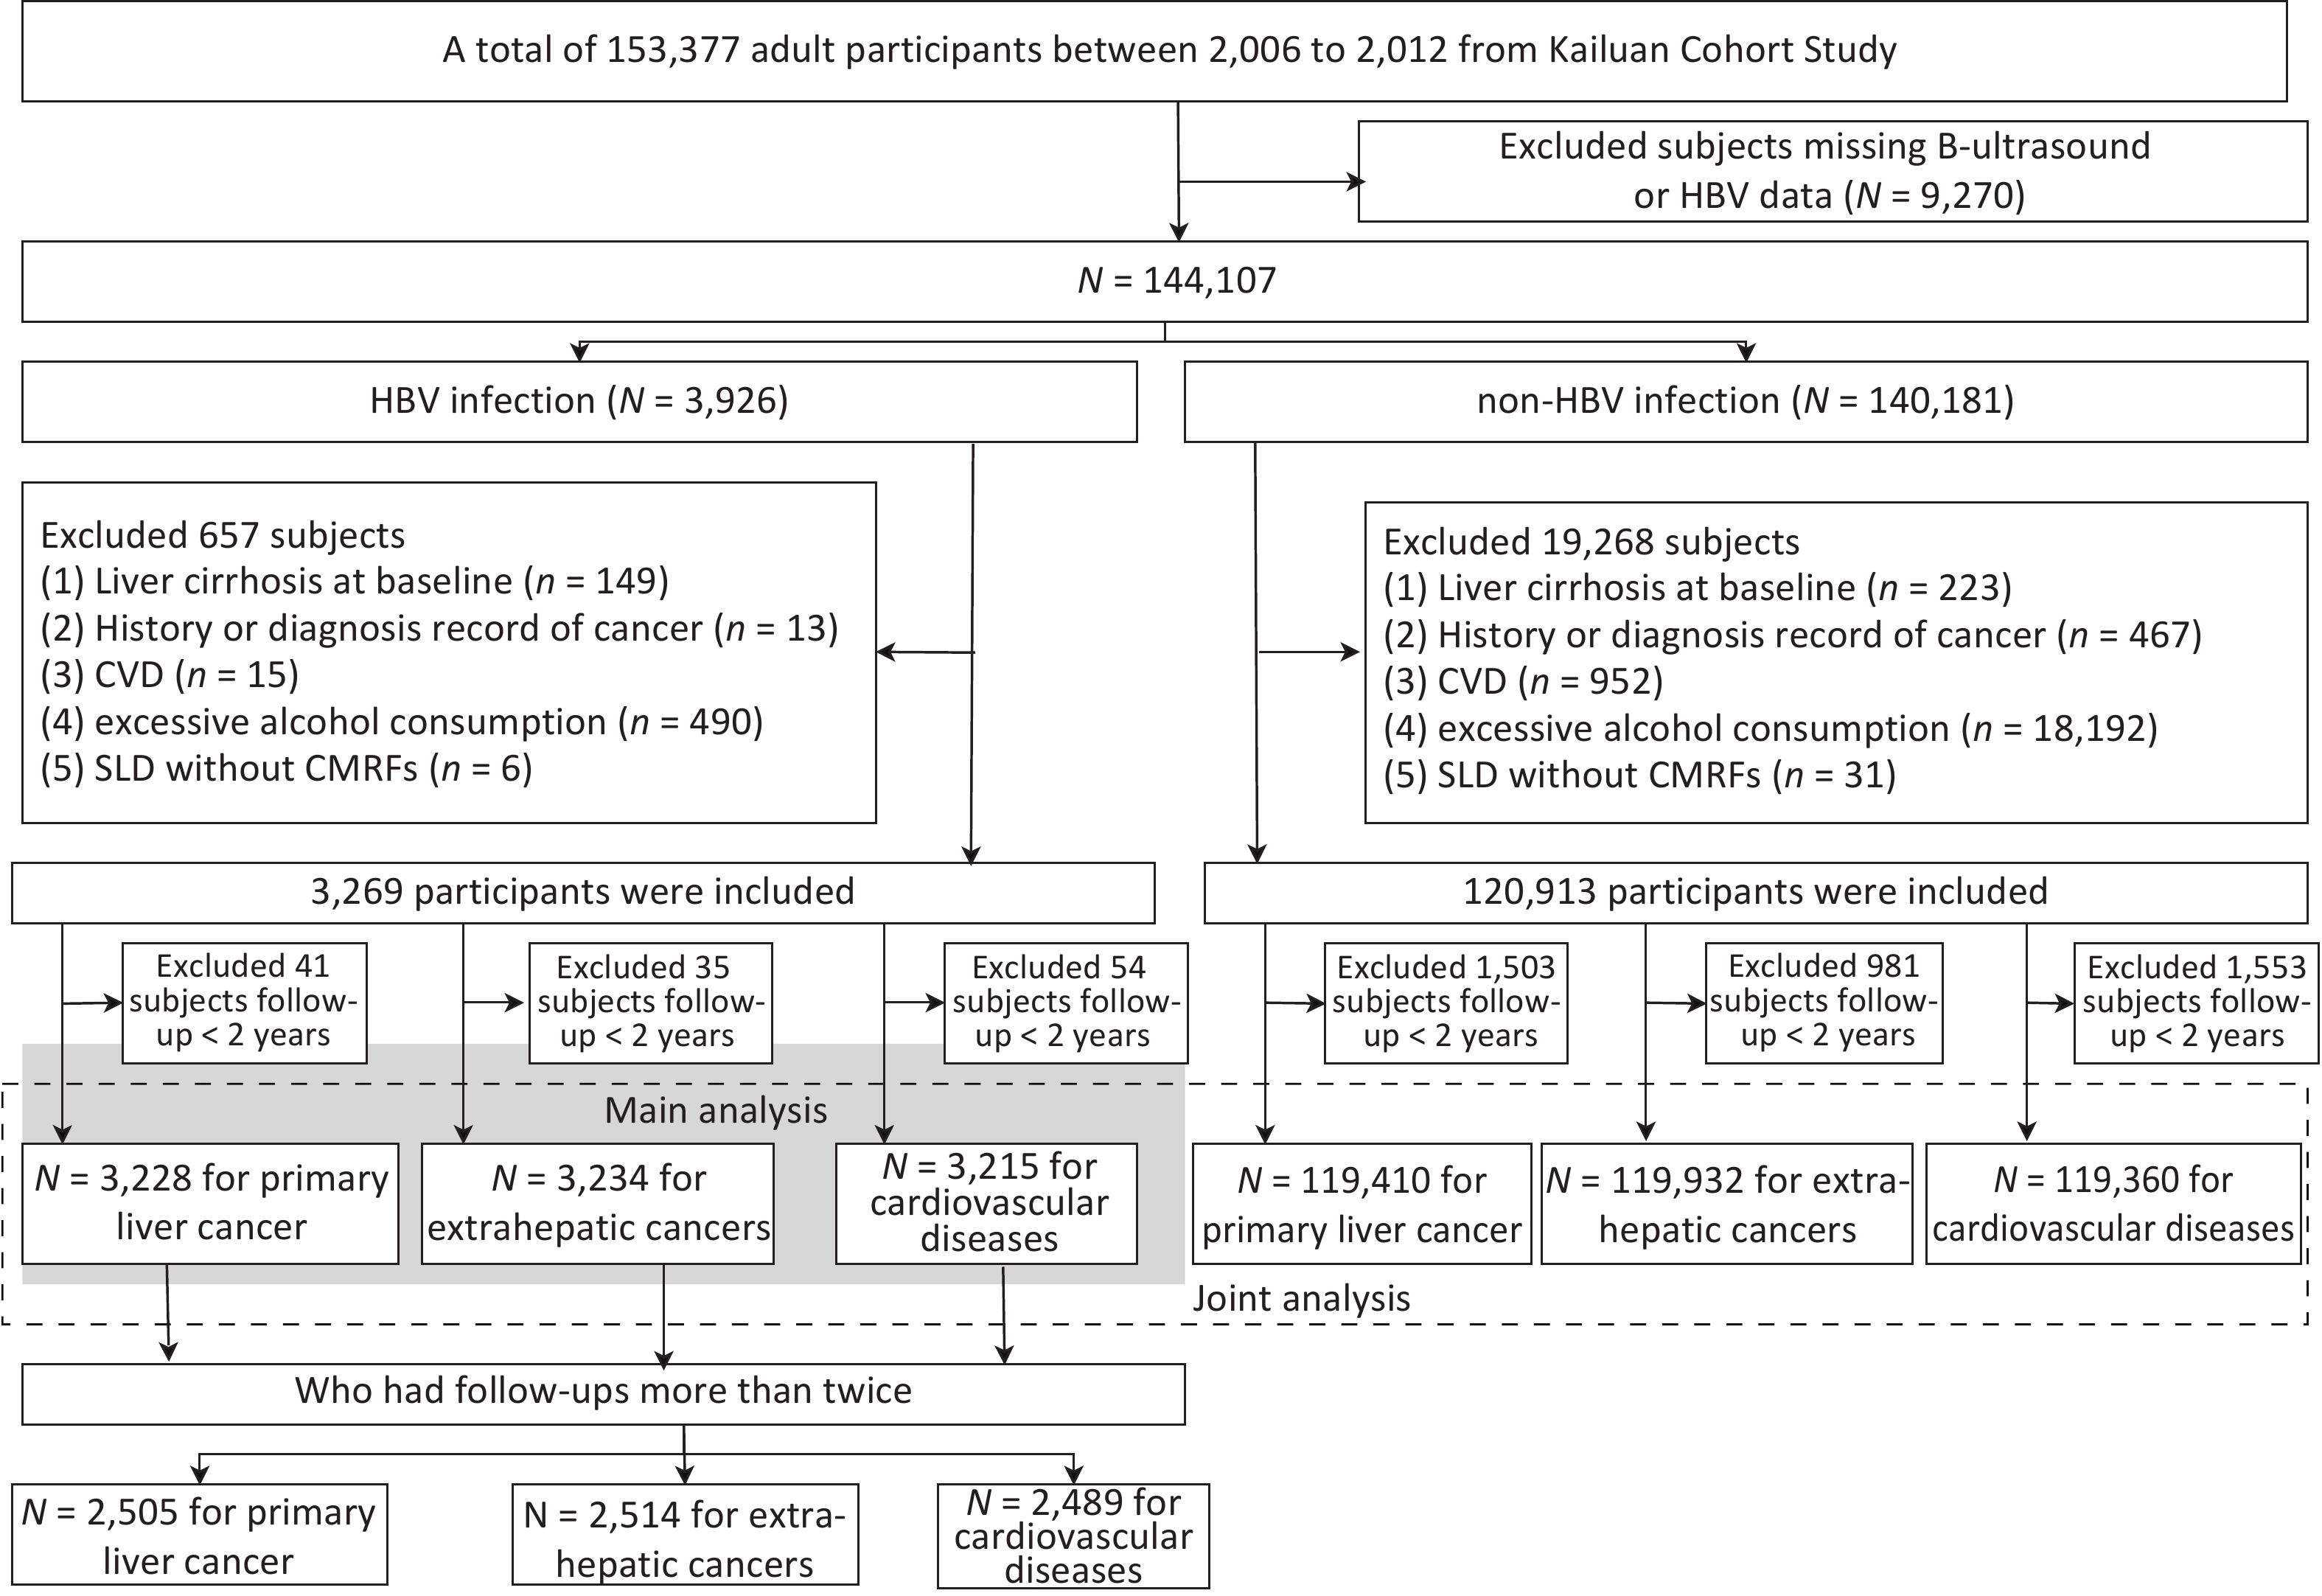
The study population was derived from a prospective population-based Kailuan Study initiated in 2006 in Tangshan City, northern China (trial identification: ChiCTR-TNRC-11001489)[18]. From 2006 to 2012, all participants in the cohort were tested for HBsAg levels. Figure 1 presents a flowchart of the participant enrollment.
Figure 1. Participant flow chart.
To explore the association between concurrent MASLD and the risk of outcomes, the primary aim of this study was to enroll 3,926 participants who were HBsAg-positive (defined as having HBV infection in this study) and aged ≥ 18 years, all of whom underwent abdominal ultrasonography between 2006 and 2012. Participants with a history of liver cirrhosis, cancer, CVD, or excessive alcohol consumption (≥ 30 g/day for men and ≥ 20 g/day for women) were excluded. To minimize reverse causality, we implemented a 2-year lag period, excluding cases that occurred shortly after baseline. This approach addresses potential bias from preclinical conditions, with evidence indicating that a 2-year exclusion period substantially reduces bias while maintaining the necessary statistical power[19]. Ultimately, 3,228 (2,374 non-MASLD vs. 854 MASLD), 3,234 (2,381 vs. 853), and 3,215 (2,372 vs. 843) participants with HBV infection were included in the study to test the association between MASLD and PLC, EHCs, and CVD, respectively.
Patients with HBV infection who underwent more than two follow-up visits were also included to investigate the association between changes in MASLD status and adverse outcomes. Individuals who experienced incident outcomes before the second follow-up were excluded. Consequently, a total of 2,505, 2,514, and 2,489 participants were enrolled in the PLC, EHCs, and CVD groups, respectively.
To analyze the independent and joint associations between SLD, CMRFs, and HBV infection, we included 140,181 participants without HBV infection from the same cohort during the same period (2006 and 2012). All the participants met the inclusion and exclusion criteria for the primary analysis. Finally, 119,410, 119,932, and 119,360 participants without HBV infection were enrolled in the PLC, EHCs, and CVD analyses, respectively.
-
SLD was determined using ultrasonography (PHILIPS HD-15), and MASLD was diagnosed according to expert consensus as the presence of SLD in addition to one of the CMRFs[1]. SLD was further categorized according to ultrasound-estimated steatosis (mild vs. moderate-to-severe) and baseline alanine aminotransferase (ALT) levels (<40 vs. ≥ 40 U/L).
Patients were also reclassified into four groups based on changes in MASLD status at baseline (–: absent; +: present) and at the first follow-up (median interval: 2.2 years; interquartile range: [1.8–2.6] years): persistent non-MASLD (–/–), incident MASLD (–/+), reversed MASLD (+/–), and persistent MASLD (+/+).
-
Participants were followed up every two years, from baseline to the date of cancer diagnosis, CVD onset, death, or December 31, 2020. CVD and cancer data were collected annually through questionnaires or linked to data from the local vital statistics center, Tangshan Medical Insurance System, and Kailuan Social Security Information System. CVD included myocardial infarction, ischemic stroke, and hemorrhagic stroke[20]. All the cases were validated by clinical experts and coded according to the International Classification of Diseases, Tenth Revision (Supplementary Table S1).
-
As described previously[21], questionnaire surveys were conducted to collect data on age, sex, education level, smoking status, alcohol intake, physical activity level, and medical history. Weight, height, and blood pressure were measured, and the body mass index (BMI) was calculated. Patients with liver cirrhosis were identified through medical records from the Tangshan Medical Insurance System or were diagnosed using abdominal ultrasonography. Blood samples were collected after overnight fasting, and HBsAg, serum total cholesterol (TC), triglyceride (TG), high-density lipoprotein cholesterol (HDL-c), low-density lipoprotein cholesterol (LDL-c), ALT, C-reactive protein (CRP), and fasting blood glucose (FBG) levels were measured in the central laboratory. Hypertension, type 2 diabetes mellitus, prediabetes, and abnormalities in TC, TG, HDL-c, and LDL-c levels were defined according to statements or guidelines[1,22-24]. Overweight was defined as a BMI ≥ 23.0 kg/m2 for Asian adults, according to the World Health Organization[25]. We used the TG-glucose (TyG) index, calculated using the following formula: TyG = Ln[fasting TG (mg/dL) × fasting glucose (mg/dL)/2], to indicate insulin resistance[26,27] because the homeostasis model assessment was unavailable.
-
Covariates between patients with and without MASLD were compared using t-tests, analysis of variance, Wilcoxon signed-rank test for continuous variables, and chi-square test for categorical variables.
To account for the competing risk of death, we estimated the cumulative incidence of cancer and CVD using the Aalen-Johansen estimator, which integrates the cause-specific cumulative hazard (derived using the Nelson-Aalen estimator) with the overall Kaplan–Meier survival curves[28]. Cumulative incidence curves were compared using Gray’s test. The Fine–Gray competing risk models were used to estimate the corresponding hazard ratios (HRs) and 95% confidence intervals (CIs)[28]. The regression models were unadjusted, sex- and age-adjusted, multivariate model 1 (further adjusted for education level, smoking, drinking, physical activity, and cirrhosis), and multivariate model 2 (further adjusted for CMRFs, ALT, and CRP levels). A generalized estimating equation model able to handle the longitudinal data of participants with common characteristics[29] was used to compare the differences between the change statuses of the MASLD.
For joint analysis, all participants (both HBV-infected and non-HBV-infected) were categorized into six mutually exclusive groups based on their exposure status to SLD, CMRFs, and HBV infection. Moreover, the multiplicative interactions between SLD, CMRFs, and HBV infection were evaluated by including product terms in the Fine–Gray models. The significance of these interaction effects was assessed using Wald’s test.
We conducted several sensitivity analyses to verify the robustness of our findings. First, E-values were calculated for both point estimates and lower limits of the 95% CIs[30] to assess the potential impact of unmeasured confounding. Second, we excluded participants who developed cirrhosis during the follow-up period to evaluate the impact of incident cirrhosis as a dynamic factor.
Statistical analyses were performed using SAS statistical software (v.9.4; SAS Institute). A two-sided P < 0.05 was considered statistically significant.
-
To minimize potential reverse causality, participants with a follow-up period of < 2 years were excluded from the analysis of the specific outcome. Consequently, the baseline population for each outcome analysis (PLC, CVD, and EHCs) differed slightly (Figure 1 and Table 1). The baseline characteristics of the cohort for the PLC analysis are presented in Table 1, among which 26.5% of patients had MASLD. Patients with MASLD were older (48.5 ± 12.1 vs. 47.1 ± 13.4 years) and exhibited a higher likelihood of being overweight (93.6% vs. 66.9%), having hypertension (50.4% vs. 30.8%), and prediabetes/type 2 diabetes mellitus (27.9% vs. 21.3%) than those without MASLD. The distributions of sex, alcohol and tobacco use, education level, and physical activity level were comparable between the groups. The baseline characteristics of the EHCs- and CVD-specific cohorts were similar to those in the PLC analysis.
Non-HBV infection
(n = 119,410)HBV infection P value Non-MASLD
(n = 2,374)MASLD
(n = 854)Age, years 49.4 ± 14.3 47.1 ± 13.4 48.5 ± 12.1 0.004 Male 93,282 (78.1) 1,998 (84.2) 718 (84.1) 0.855 Education level 0.288 Junior high school or below 89,339 (74.8) 1,775 (74.8) 659(77.2) 0.288 Senior high school or higher 30,071 (25.2) 599 (25.2) 195(22.8) Current/past smoker 40,286 (33.7) 889 (37.4) 310(36.3) 0.533 Current/past drinker 26,259 (22.0) 538 (22.7) 182(21.3) 0.654 Physical activity 0.085 Inactive 15,088 (12.6) 335 (14.1) 115(13.5) Moderately active 87,497 (73.3) 1740 (73.3) 620(72.6) Active 16,825 (14.1) 299 (12.6) 119(13.9) BMI, kg/m2 26.2 ± 5.0 25.2 ± 4.6 29.0±5.3 < 0.001 WC, cm 86.5 ± 10.2 86.5 ± 10.2 86.5±10.2 < 0.001 SBP, mmHg 129.1 ± 20.7 125.7 ± 19.4 133.9±19.0 < 0.001 DBP, mmHg 82.9 ± 11.6 81.1 ± 11.1 86.7±11.2 < 0.001 FBG, mmol/L 5.5 ± 1.6 5.3 ± 1.4 5.8±2.0 < 0.001 TG, mmol/L 1.2 (0.9–1.9) 1.0 (0.7–1.4) 1.4 (1.1–2.1) < 0.001 TC, mmol/L 4.9 ± 1.1 4.6 ± 1.0 4.9 ± 1.3 < 0.001 LDL-c, mmol/L 2.4 ± 0.9 2.3 ± 0.9 2.5 ± 0.9 < 0.001 HDL-c, mmol/L 1.5 ± 0.4 1.5 ± 0.3 1.5 ± 0.4 0.023 CRP, mg/dL 1.0 (0.4–2.4) 0.8 (0.3–1.7) 1.2 (0.6–2.9) < 0.001 TyG Index 8.6 ± 0.7 8.4 ± 0.6 8.8 ± 0.7 < 0.001 ALT, U/L 18.0 (13.0–25.0) 22.0 (16.0–31.0) 26.0 (18.0–39.0) < 0.001 Overweight 88,320 (74.0) 1,589 (66.9) 799 (93.6) < 0.001 Hypertension 45,410 (38.0) 731 (30.8) 430 (50.4) < 0.001 Prediabetes/T2DM 34,621 (29.0) 506 (21.3) 238 (27.9) < 0.001 TG abnormal 35,614 (29.8) 376 (15.8) 328 (38.4) < 0.001 HDL-c abnormal 14,916 (12.5) 236 (9.9) 120 (14.1) < 0.001 TC abnormal 41,763 (34.7) 519 (21.9) 321 (37.4) < 0.001 CRP abnormal 34,359 (28.8) 519 (21.9) 297 (34.8) < 0.001 ALT≥40 U/L 8,490 (7.1) 394 (16.6) 208 (24.4) < 0.001 HBeAg (+) -* 259 (10.9) 73 (8.5) 0.051 HBeAb (+) - 1,261 (53.1) 475 (55.6) 0.208 Note. To minimize reverse causality, participants with follow-up of less than 2 years were excluded from the analysis for the specific outcome. Therefore, the analytical cohorts varied slightly across the different endpoints. This table presents the cohort used for the primary liver cancer analysis. The baseline characteristics of the analytical cohorts for extrahepatic cancers (number of non-HBV infection, non-MASLD, and MASLD were 119932, 2381, and 853, respectively) and cardiovascular diseases (number of non-MASLD, MASLD with mild steatosis, and MASLD with moderate to severe steatosis were 119360, 2372, and 843, respectively) were similar to those presented here (data not shown). Data are presented as the mean ± standard deviation, median (interquartile range), or n (%). *Not applicable. ALT, alanine aminotransferase; BMI, body mass index; CRP, C-reactive protein; DBP, diastolic blood pressure; FBG, fasting blood glucose; HBeAb, Hepatitis b e Antibody; HBeAg, Hepatitis B e antigen; HDL-c, high-density lipoprotein cholesterol; LDL-c, low-density lipoprotein cholesterol; MASLD, metabolic dysfunction-associated steatosis liver disease; SBP, systolic blood pressure; TC, total cholesterol; TG, triglycerides; TyG Index, triglyceride glucose index; T2DM, Type 2 Diabetes Mellitus; WC, waist circumstance Table 1. Baseline characteristics of the cohort for the primary liver cancer analysis
-
Participants with HBV infection were included in the study to explore the relationship between MASLD and outcomes.
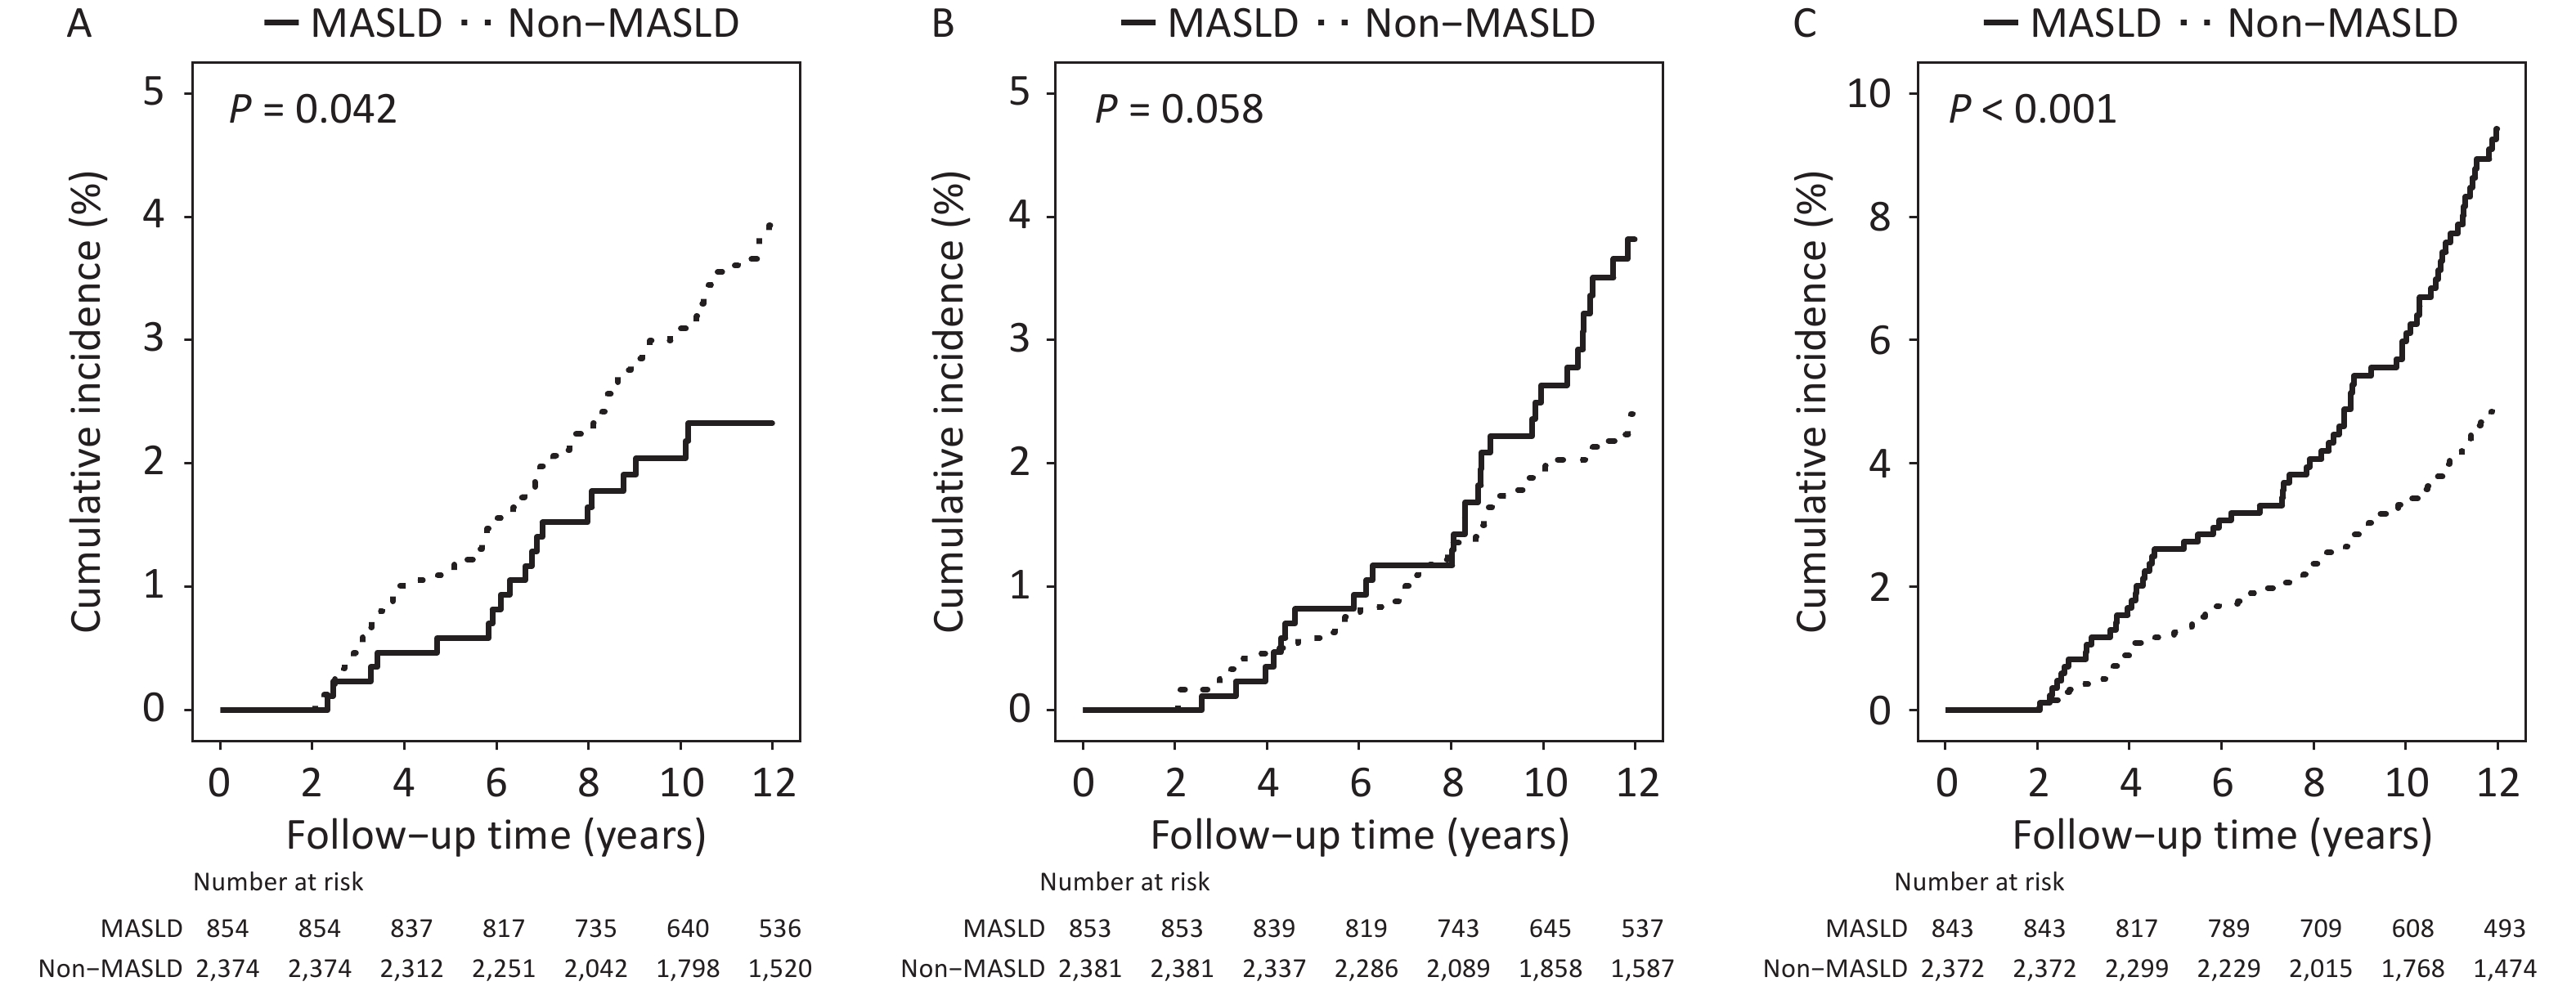
Following a median follow-up period of 13.7 (10.5–14.1) years, 22 cases of PLC were identified among 854 individuals with MASLD, compared with 98 cases among 2,374 individuals without MASLD. The 12-year cumulative incidence rates were 2.3% and 3.9%, respectively (P = 0.042; Figure 2A). However, no significant association was observed between MASLD and PLC after adjusting for lifestyle and metabolism-related variables (Table 2).
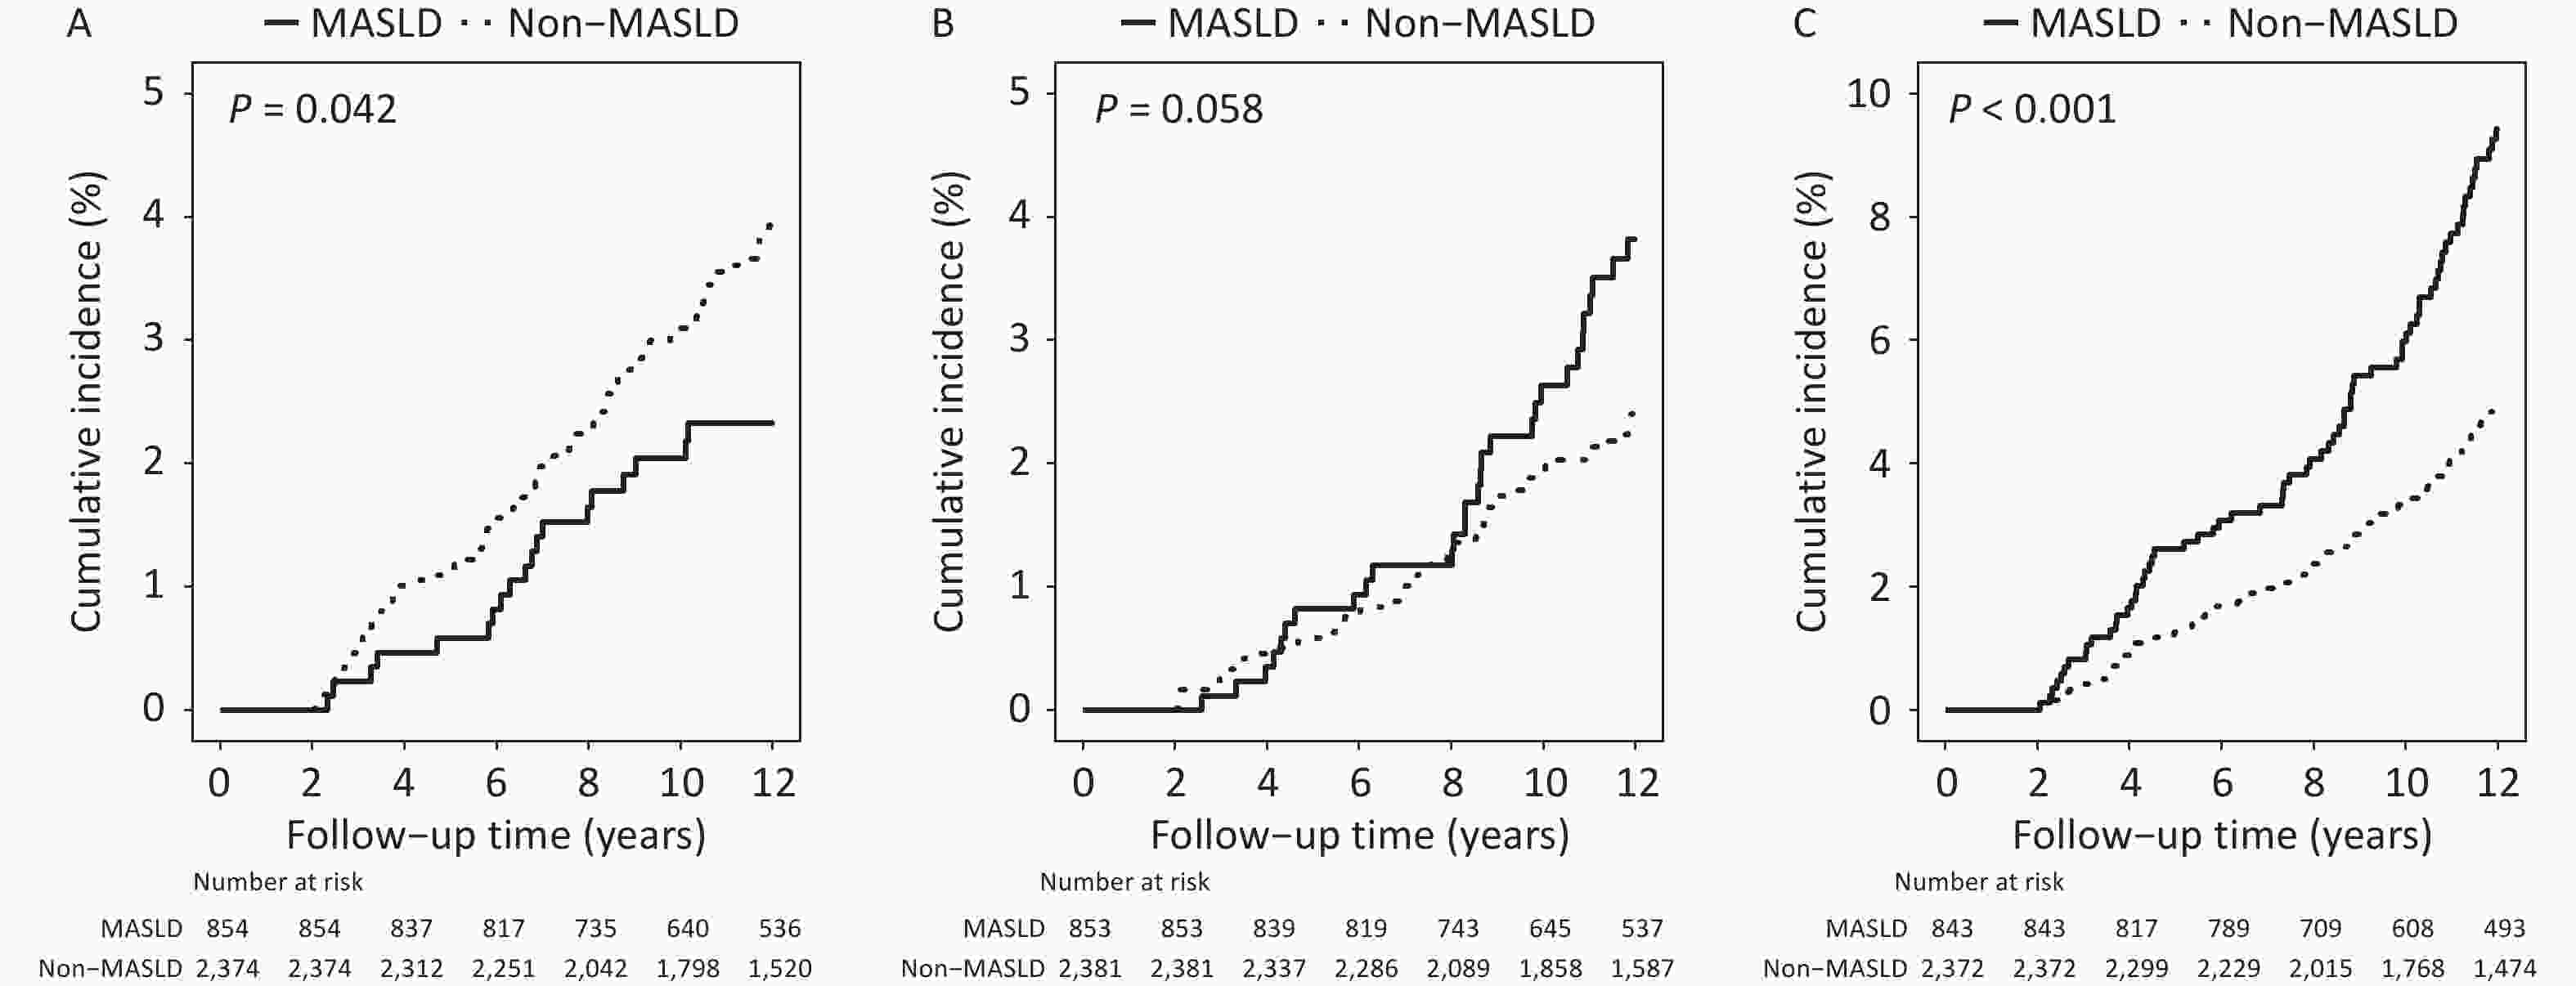
Figure 2. Cumulative incidence of adverse outcomes among patients with chronic hepatitis virus infection by MASLD status. (A) Primary liver cancer (B) Extrahepatic cancers (C) Cardiovascular disease. MASLD, Metabolic dysfunction-associated steatotic liver disease.
Events/n Incidence density /103 PYs HR (95% CI) Unadjusted Age and sex-adjusted Multivariable model 1$ Multivariable model 2& Primary liver cancer Non-MASLD 98/2,374 3.5 1 1 1 1 MASLD 22/854 2.2 0.62 (0.39–0.99) 0.62 (0.39–0.98) 0.67 (0.42–1.08) 0.63 (0.39–1.02) Extrahepatic cancers Non-MASLD 69/2,381 2.4 1 1 1 1 MASLD 36/853 3.5 1.47 (0.99–2.21) 1.43 (0.95–2.14) 1.44 (0.96–2.15) 1.50 (1.01–2.25) CVDs Non-MASLD 121/2,372 4.3 1 1 1 1 MASLD 84/843 8.6 2.02 (1.53–2.67) 2.01 (1.52–2.66) 2.01 (1.52–2.66) 1.98 (1.49–2.63) Note. $Adjusted for age (continuous), sex (male vs. female), education level (junior high school or below, senior high school or higher), smoking (no smoking vs. past or current smoker), drinking (current drinking or not), physical activity (inactive, moderately active, and active), and cirrhosis (with or without) during follow-up. &Further adjusted for cardiometabolic risk factors, ALT (normal or abnormal), and CRP (normal or abnormal). Abbreviations: ALT, alanine aminotransferase; CI, confidence interval; CVDs, cardiovascular diseases; HR, hazard ratio; CRP, high-sensitivity C-reactive protein; MASLD, metabolic dysfunction-associated steatosis liver disease; PYs, person-years. Table 2. Association between MASLD and adverse outcomes among patients with HBV infection
Thirty-six EHCs were identified in patients with MASLD and 69 in those without MASLD. The survival curves diverged significantly after 8 years of follow-up, showing a higher incidence of EHCs in the MASLD group than in the non-MASLD group, with a trend toward statistical significance (P = 0.058; Figure 2B). The full model showed a significantly increased risk of EHCs in the MASLD group (HR = 1.50, 95% CI, 1.01–2.25, Table 2).
Participants infected with HBV and diagnosed with MASLD exhibited a higher hazard of CVD than those without MASLD after a median follow-up of 13.7 (10.4–14.1) years. The 12-year cumulative incidence of CVD in patients with MASLD was significantly higher than that observed in patients without MASLD (9.4% vs. 4.9%, P < 0.001; Figure 2C). The HRs remained stable across all models (Table 2).
Sensitivity analyses showed that the E-values for the associations of concurrent MASLD with CVD and EHCs were 3.37 (lower limit of 95% CI: 2.34) and 2.37 (lower limit of 95% CI: 1.11), respectively. The results remained consistent after excluding participants who developed cirrhosis during the follow-up period (Supplementary Table S2).
-
Metabolic indicators, including BMI, WC, FBG, TG, LDL-c, TyG Index, CRP, and ALT were elevated in the moderate-to-severe SLD group compared with those in the mild MASLD group (Supplementary Table S3). The participants with MASLD and abnormal ALT levels demonstrated the highest prevalence of metabolic indicators among the three groups (Supplementary Table S4).
Table 3 shows the association between the MASLD severity and long-term outcomes. The MASLD group with mild steatosis (HR = 1.56, 95% CI, 1.04–2.33) or normal ALT (HR = 1.56, 95% CI, 1.02–2.40) levels presented a higher risk of EHCs than those without steatosis. Similar phenomena were observed for patients with CVD, with HR (95% CI) of 2.04 (1.53–2.71) and 2.11 (1.57–2.84), respectively. However, no significant association was observed with PLC.
Events/n Incidence density/ 103 PYs HR (95% CI) Unadjusted Age and sex-adjusted Multivariable model 1$ Multivariable model 2& Degree of steatosis Primary liver cancer Non-MASLD 98/2,374 3.5 1 1 1 1 MASLD with mild steatosis 20/755 2.2 0.62 (0.38–1.00) 0.61(0.38–0.99) 0.66 (0.40–1.07) 0.62 (0.38–1.02) MASLD with moderate to severe steatosis 2/99 2.2 0.65 (0.16–2.65) 0.71 (0.17–2.90) 0.91 (0.23–3.58) 0.80 (0.20–3.12) Extrahepatic cancers Non-MASLD 69/2,381 2.4 1 1 1 1 MASLD with mild steatosis 35/754 3.8 1.55 (1.03–2.32) 1.49 (0.99–2.24) 1.49 (1.00–2.24) 1.56 (1.04–2.33) MASLD with moderate to severe steatosis 1/99 1.1 0.56 (0.08–4.06) 0.58 (0.08–4.27) 0.61 (0.08–4.51) 0.68 (0.09–4.97) CVDs Non-MASLD 121/2,372 4.3 1 1 1 1 MASLD with mild steatosis 80/747 9.0 2.09 (1.57–2.77) 2.07(1.56–2.75) 2.07 (1.56–2.76) 2.04 (1.53–2.71) MASLD with moderate to severe steatosis 4/96 4.5 1.24 (0.46–3.38) 1.28 (0.45–3.66) 1.24 (0.44–3.50) 1.25 (0.44–3.55) ALT levels Primary liver cancer Non-MASLD 98/2,374 3.5 1 MASLD with normal ALT 14/646 1.8 0.52 (0.29–0.90) 0.51 (0.29–0.89) 0.58 (0.33–1.02) 0.56 (0.32–0.99) MASLD with abnormal ALT 8/208 3.4 0.97 (0.47–1.99) 1.00 (0.48–2.08) 0.96 (0.46–2.00) 0.94 (0.45–1.97) Extrahepatic cancers Non–MASLD 69/2,381 2.4 1 1 1 1 MASLD with normal ALT 30/646 3.8 1.60 (1.04–2.46) 1.50 (0.98–2.31) 1.51 (0.98–2.33) 1.56 (1.02–2.40) MASLD with abnormal ALT 6/207 2.5 1.05 (0.46–2.41) 1.15 (0.50–2.64) 1.14 (0.49–2.64) 1.21 (0.52–2.83) CVDs Non-MASLD 121/2,372 4.3 1 1 1 1 MASLD with normal ALT 73/639 9.7 2.30 (1.72–3.07) 2.22 (1.66–2.97) 2.16 (1.61–2.90) 2.11 (1.57–2.84) MASLD with abnormal ALT 11/204 4.8 1.12 (0.61–2.09) 1.25 (0.66–2.35) 1.30 (0.69–2.45) 1.26 (0.67–2.38) Note. $Adjusted for age (continuous), sex (male vs. female), smoking (no smoking vs. past or current smoker), drinking (current drinking or not), physical activity (inactive, moderately active, and active), educational level (junior high school or below, senior high school or higher), and cirrhosis (with or without) during follow-up. &Adjusted variables above and cardiometabolic risk factors, and CRP (normal or abnormal), and ALT (normal or abnormal). ALT was not adjusted for in analyses where ALT levels were the main exposure. ALT, alanine aminotransferase; CI, confidence interval; CVDs, cardiovascular diseases; HR, hazard ratio; CRP, high-sensitivity C-reactive protein; MASLD, metabolic dysfunction-associated steatosis liver disease; PYs, person-years. Table 3. Degree of steatosis and severity of MASLD and outcomes among patients with HBV infection
-
Table 4 shows the changing status of MASLD and its relationship with long-term outcomes. Compared with persistent non-MASLD, the risk of EHCs was significantly increased only in the persistent MASLD group (full-adjusted HR = 1.98, 95% CI, 1.14–3.45). For CVD, patients with reversed MASLD and those with persistent MASLD had similar adjusted HRs (95% CIs) of 2.01 (1.19–3.39) and 2.17 (1.41–3.35), respectively, compared with persistently non-MASLD individuals.
Cases/n ID/103 PYs P value HR (95% CI) Unadjusted Age and sex-adjusted Multivariable model 1$ Multivariable model 2& Primary liver cancer Persistent non-MASLD 47/1511 3.1 – 1 1 1 1 Reversed MASLD 4/215 1.9 0.361 0.60 (0.22–1.66) 0.51 (0.18–1.42) 0.51 (0.18–1.42) 0.51 (0.18–1.43) Incident MASLD 8/347 2.3 0.430 0.74 (0.35–1.57) 0.70 (0.33–1.48) 0.81 (0.38–1.74) 0.77 (0.36–1.64) Persistent MASLD 5/432 1.1 0.032 0.37 (0.15–0.94) 0.37 (0.15–0.94) 0.47 (0.19–1.20) 0.48 (0.19–1.21) Extrahepatic cancers Persistent non-MASLD 36/1514 2.3 – 1 1 1 1 Reversed MASLD 6/218 2.8 0.673 1.16 (0.49–2.75) 0.97 (0.41–2.32) 0.99 (0.41–2.36) 1.00 (0.42–2.39) Incident MASLD 12/350 3.4 0.277 1.44 (0.75–2.77) 1.38 (0.72–2.65) 1.42 (0.74–2.74) 1.41 (0.73–2.72) Persistent MASLD 20/432 4.5 0.021 1.95 (1.13–3.36) 1.89 (1.09–3.26) 1.93 (1.11–3.34) 1.98 (1.14–3.45) CVDs Persistent non-MASLD 58/1507 3.8 – 1 1 1 1 Reversed MASLD 19/214 9.2 0.001 2.31 (1.37–3.87) 1.88 (1.11–3.18) 1.88 (1.11–3.17) 2.01 (1.19–3.39) Incident MASLD 14/345 4.0 0.869 1.05 (0.59–1.89) 0.99 (0.55–1.77) 1.00 (0.56–1.81) 1.02 (0.57–1.84) Persistent MASLD 33/423 7.5 0.002 2.03 (1.32–3.11) 2.04 (1.33–3.13) 2.06 (1.34–3.16) 2.17 (1.41–3.35) Note. $Adjusted for age (continuous), sex (male vs. female), smoking (no smoking vs. past or current smoker), drinking (current drinking or not), physical activity (inactive, moderately active, and active), and educational level (junior high school or below, senior high school or higher), and cirrhosis (with or without) during the follow-up. &Adjusted variables above and cardiometabolic risk factors, CRP (normal or abnormal), and ALT (normal or abnormal). ALT, alanine aminotransferase; CI, confidence interval; CVDs, cardiovascular diseases; HR, hazard ratio; CRP, high-sensitivity C-reactive protein; MASLD, metabolic dysfunction-associated steatosis liver disease; PYs, person-years. Table 4. Changing status of MASLD and long-term outcomes among patients with HBV infection
-
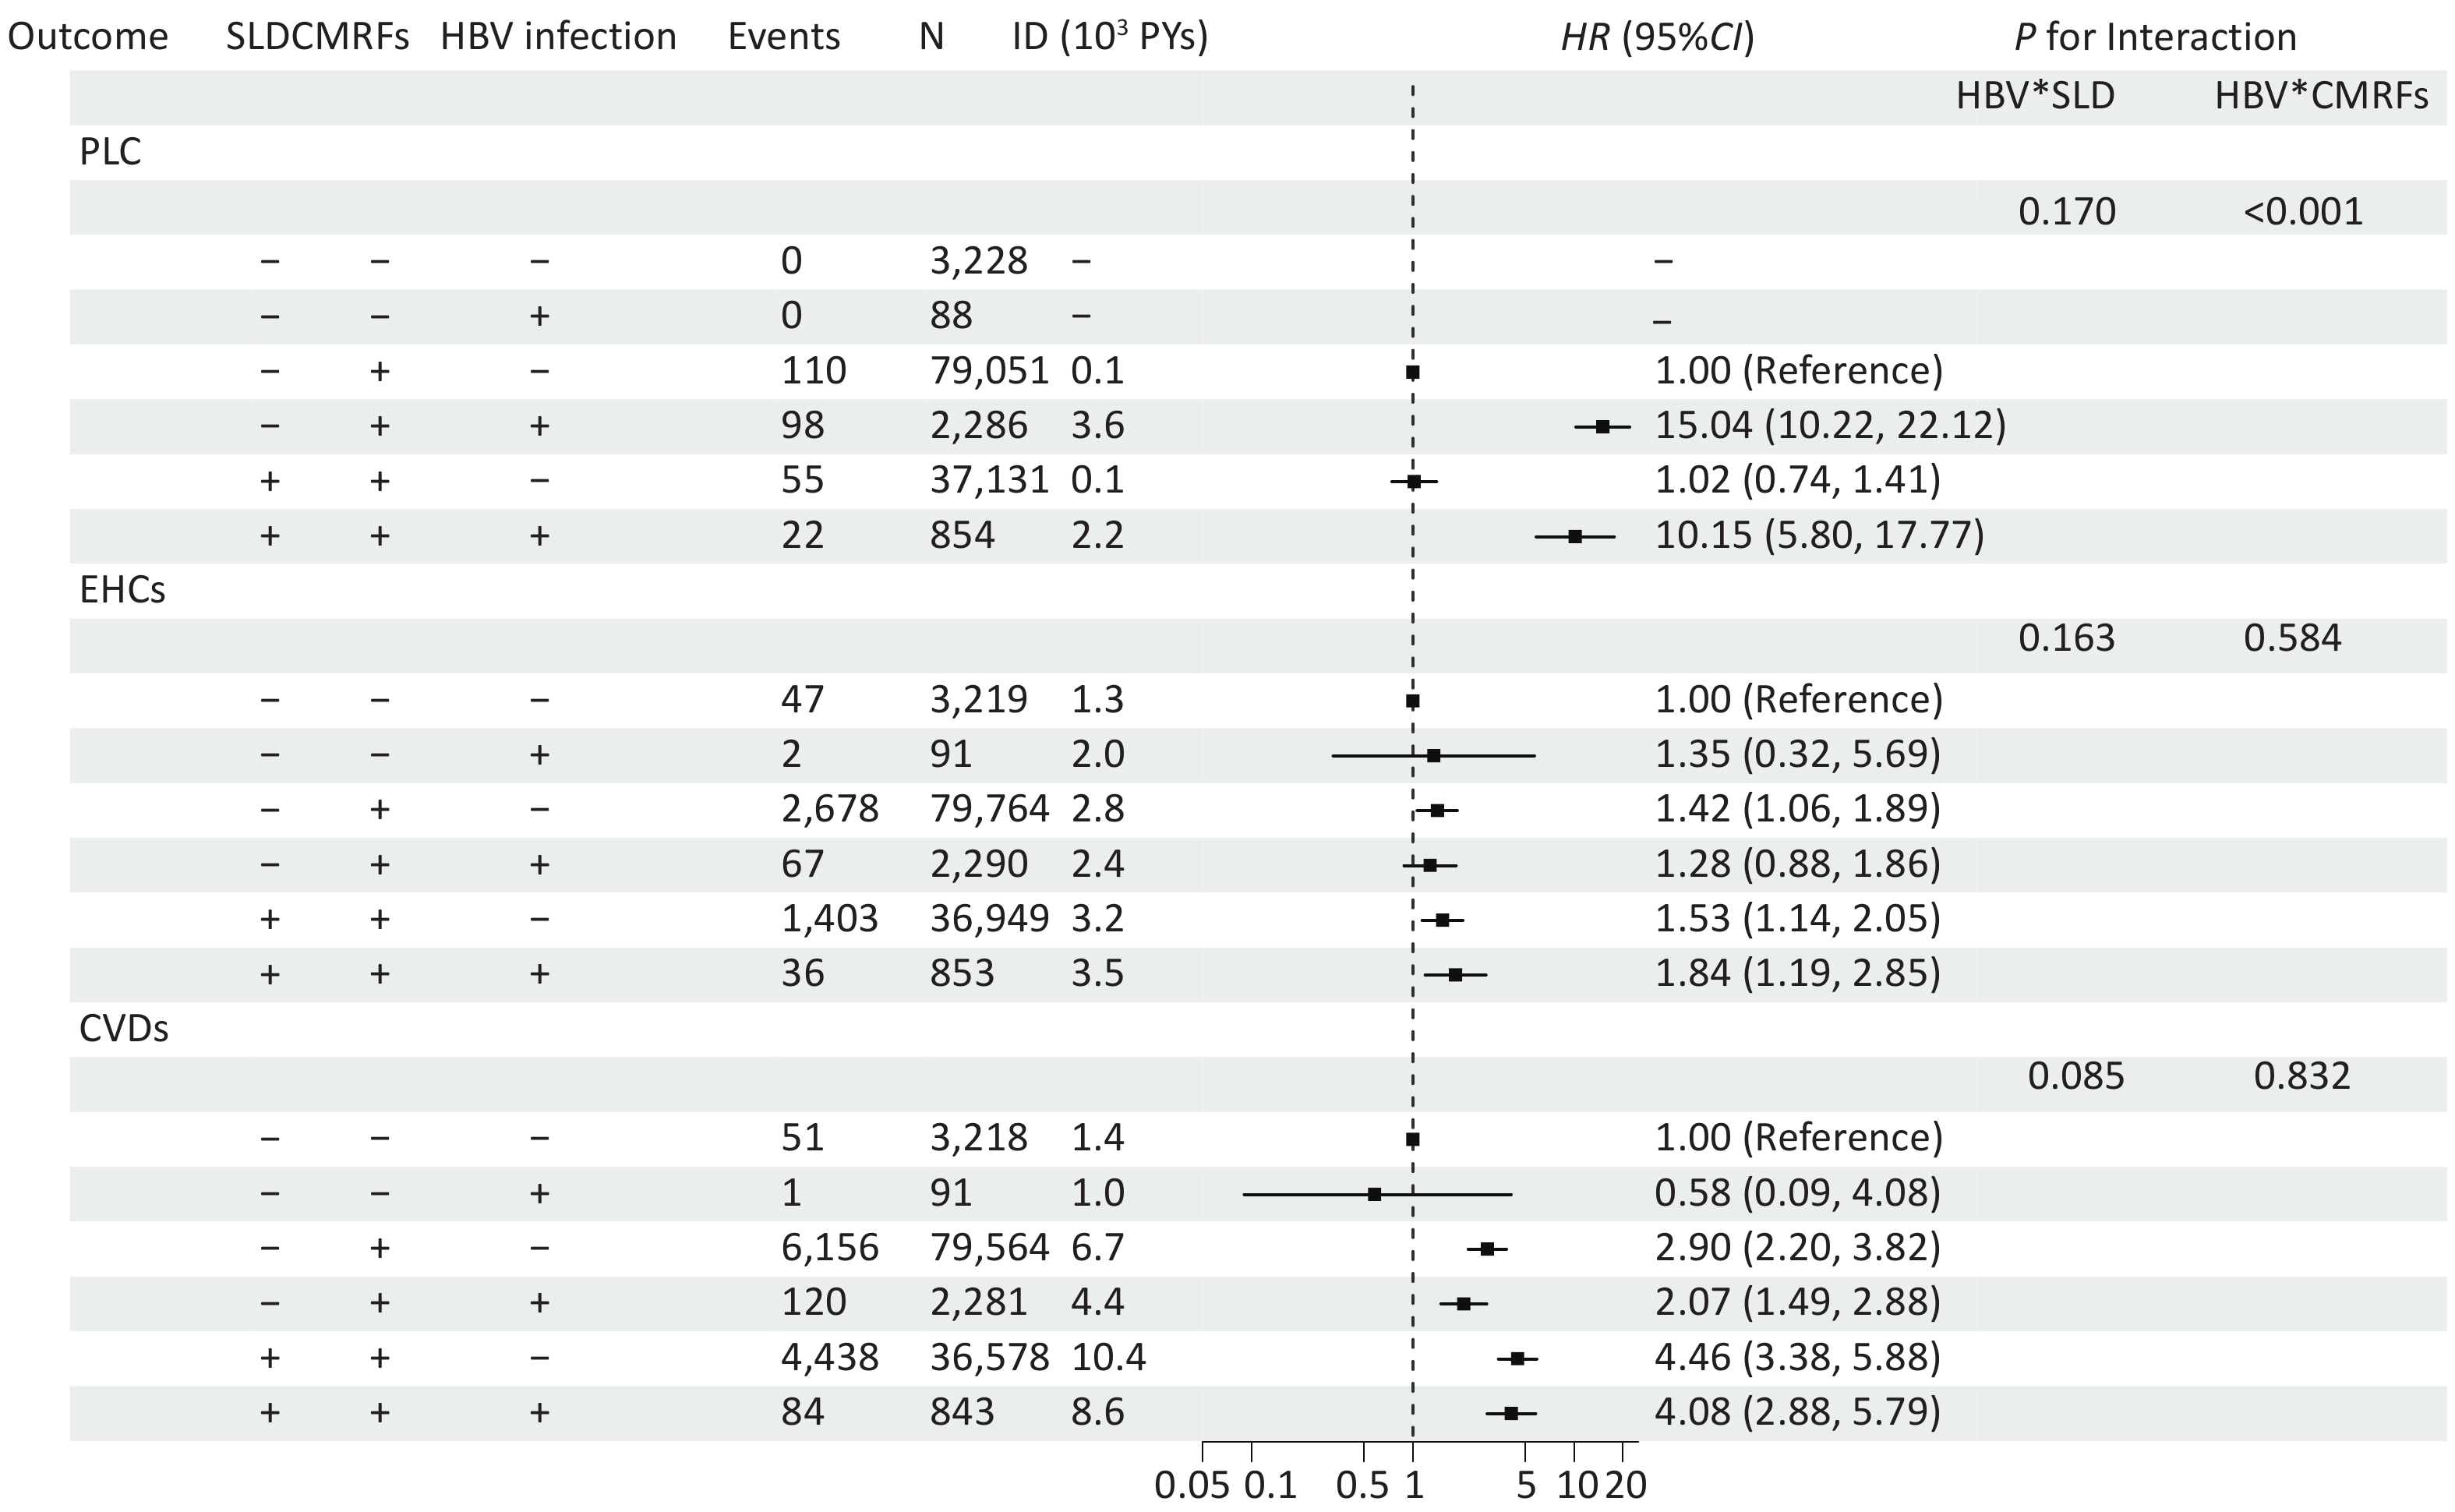
To delineate the independent and combined effects of SLD, CMRFs, and HBV infection, we included participants without HBV infection (see characteristics presented in Table 1) and conducted independent association (Supplementary Table S5) and joint analyses (Figure 3).
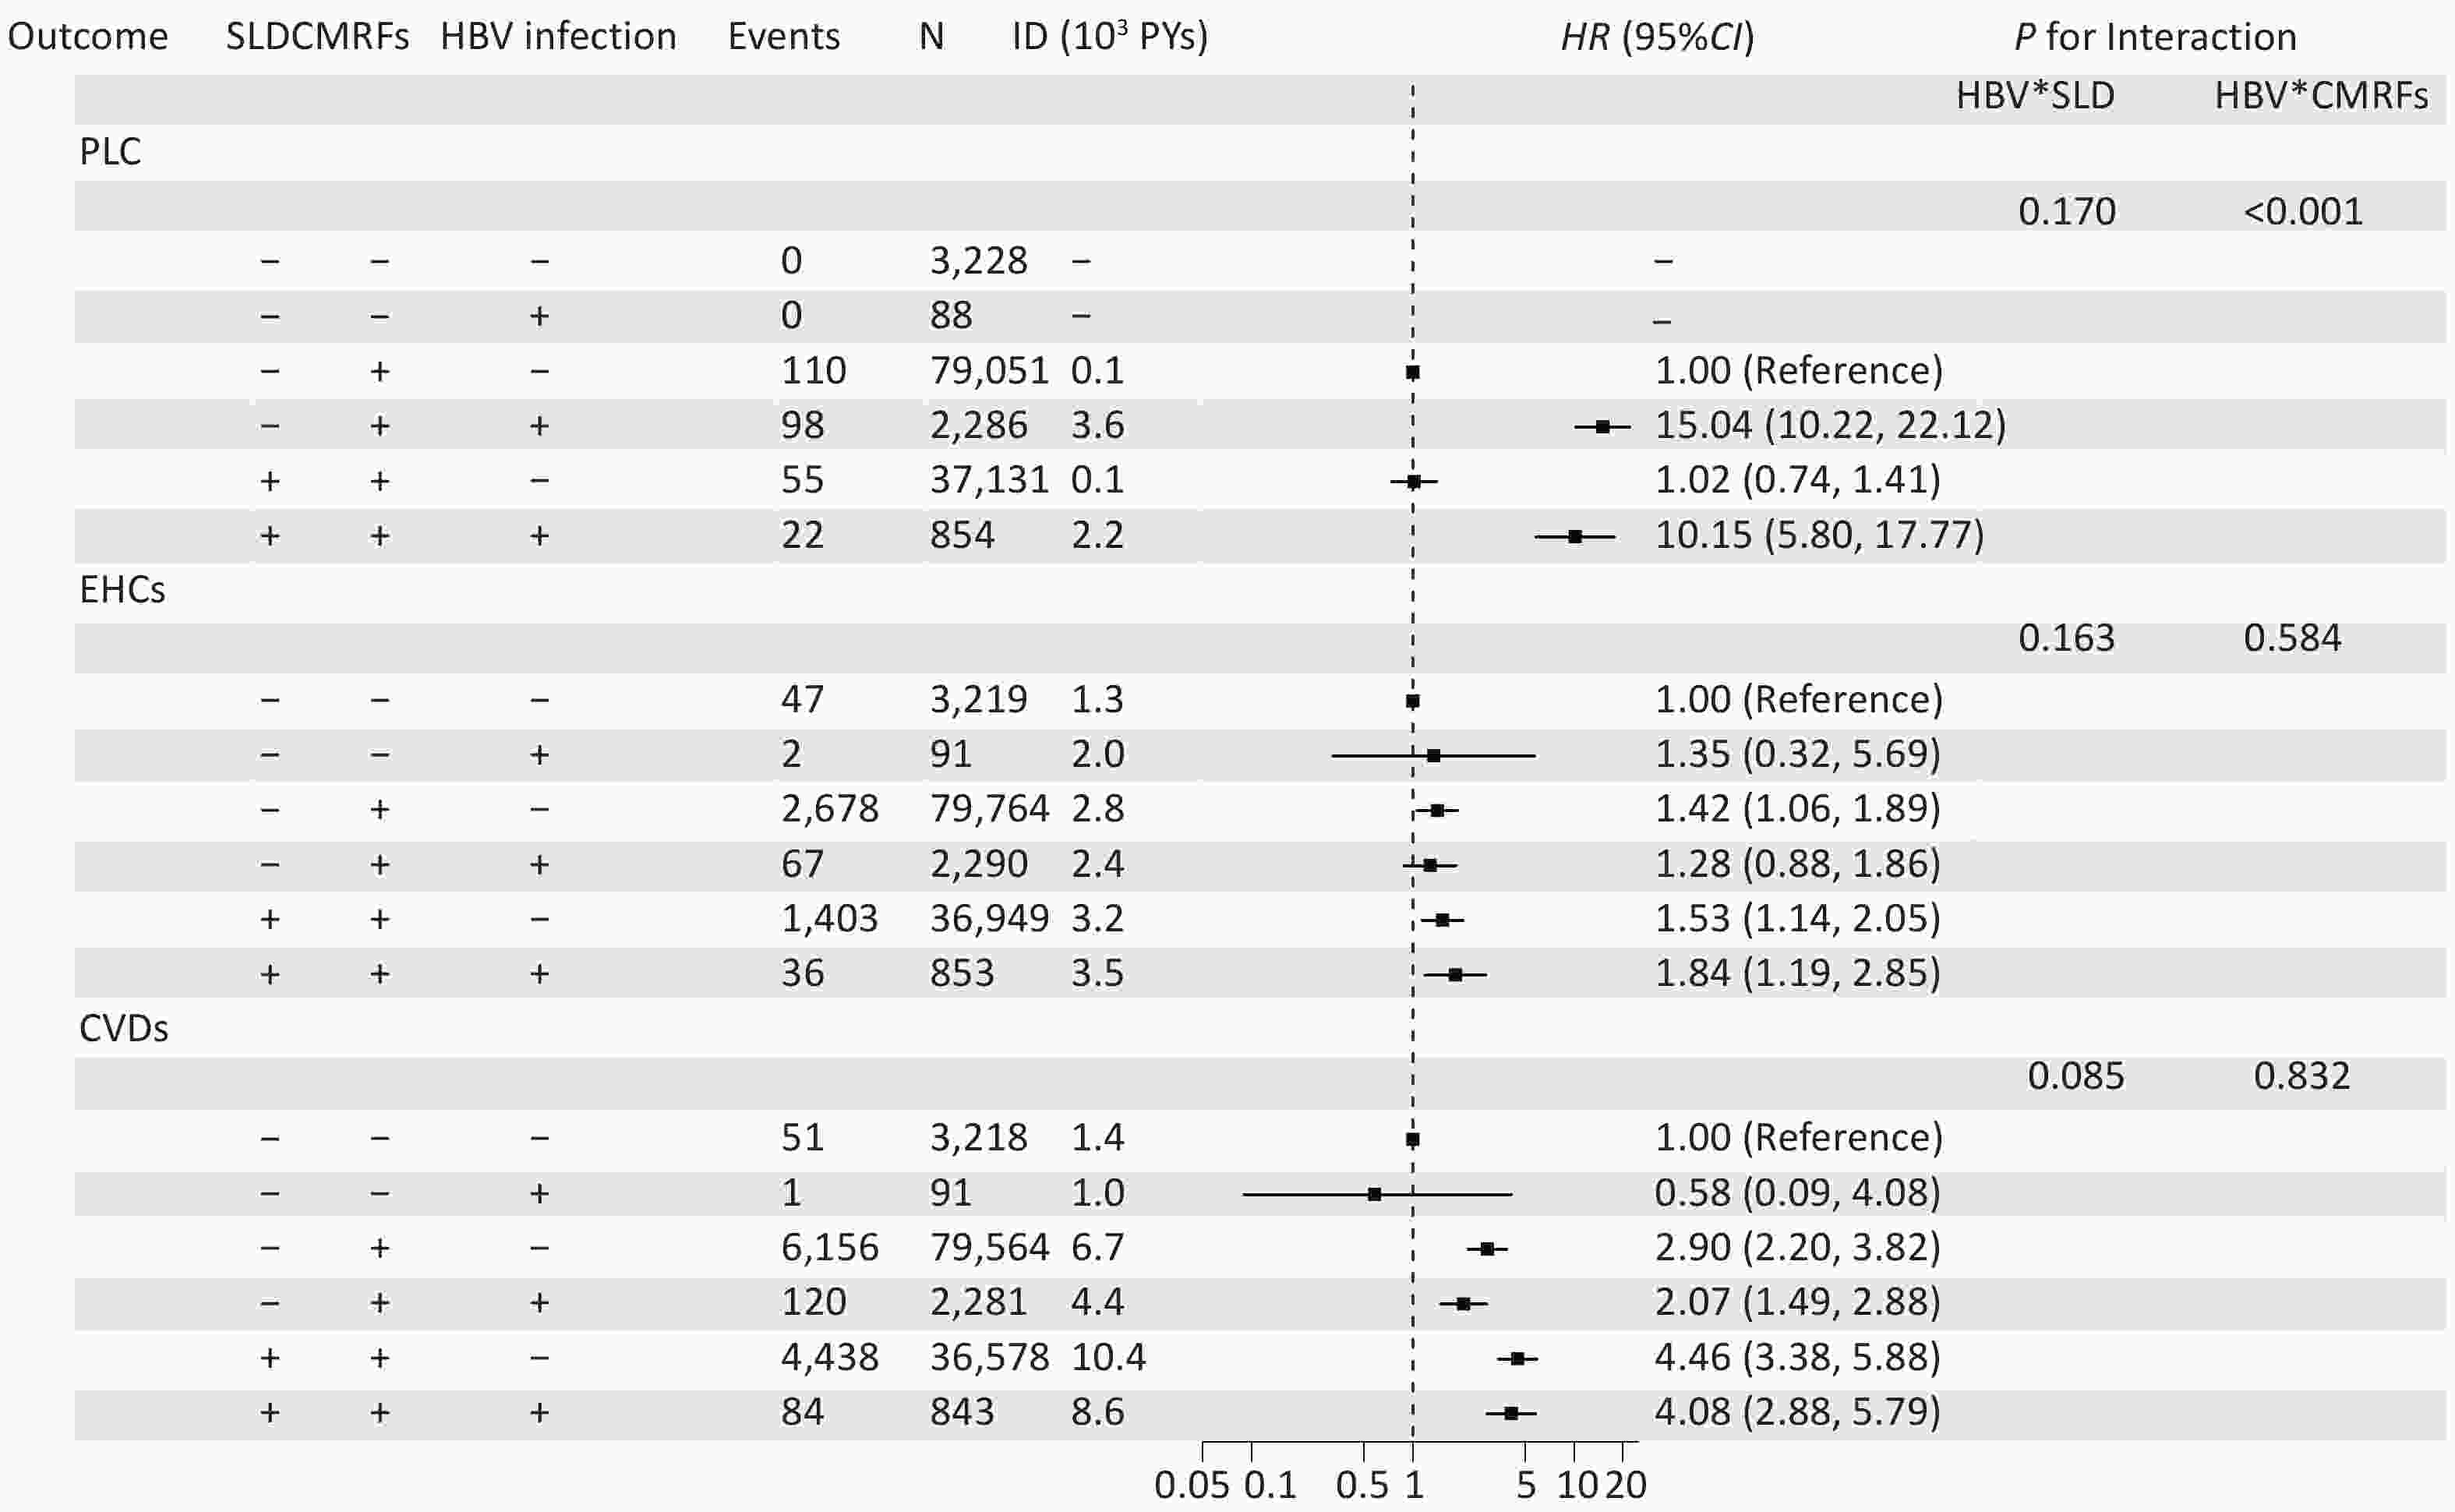
Figure 3. Forest plot showing the joint associations between SLD, HBV infection, and CMRFs with long-term outcomes. Multivariable-adjusted HR and 95% CI are shown for various combinations of risk factors. The adjusted factors included age (continuous), sex (male vs. female), education level (junior high school or below, senior high school or higher), smoking (no smoking vs. past or current smoker), drinking (current drinking or not), physical activity (inactive, moderately active, and active), and cirrhosis (with or without) on follow-up. P for interaction represents the P-values for multiplicative interaction. No interaction between CMRFs and SLD was observed in the model owing to their strong correlation. For CVD and EHCs, the reference group was considered unexposed to all three factors (SLD-/CMRFs-/HBV-); For PLC, due to zero cases in the unexposed to all three factors and HBV-only groups, the reference group was defined as the CMRFs-only group (SLD–/CMRFs+/HBV–). CI, confidence interval; CMRFs, cardiometabolic risk factors; CVD, cardiovascular disease; EHCs, extrahepatic cancer; HBV, hepatitis B virus; HR, hazard ratio; PLC, primary liver cancer; SLD, steatotic liver disease.
For both EHCs and CVD, the CMRFs and SLD were independently associated with increased morbidity, whereas HBV infection was negatively associated with CVD (Supplementary Table S5). Specifically, for EHCs, the highest risk was observed in individuals co-exposed to all three factors (Figure 3, HR = 1.84, 95% CI, 1.19–2.85). For CVD, co-exposure to CMRFs and SLD markedly increased risk (HR = 4.46, 95% CI, 3.38–5.88), and this association was similar when all three factors were present (HR = 4.08, 95% CI, 2.88–5.79). No significant multiplicative interactions were observed (Figure 3).
Because no PLC cases occurred in the unexposed reference group, individuals exposed to CMRFs alone were used as the reference group for PLC analysis. Co-exposure to CMRFs and HBV was associated with a substantial increase in the risk of PLC (HR = 15.04; 95% CI, 10.22–22.12). However, when CMRFs, HBV, and SLD coexisted, the HR decreased to 10.15 (95% CI, 5.80–17.77). A synergistic interaction between HBV infection and CMRFs was observed (Figure 3, P<0.001), and only HBV infection was independently associated with PLC development (Supplementary Table S5).
-
Using a large patient cohort from northern China, this study found a non-significant association between concurrent MASLD and PLC but a positive association between concurrent MASLD, CVD, and EHCs among individuals with chronic HBV infection, particularly those with mild steatosis, normal ALT levels, or persistent MASLD. Joint analysis demonstrated that SLD itself had no significant independent effect on PLC risk; however, a synergistic interaction between CMRFs and HBV infection was found.
Our observation of a non-significant association between MASLD and PLC in HBV-infected individuals aligns with findings from a recent meta-analyses[15,31] but contrasts with other studies reporting a positive association[14]. These inconsistencies likely stem from the heterogeneity in the study populations, sample sizes, follow-up durations, presence or absence of antiviral therapy, and proportions of patients with cirrhosis. Furthermore, the possibility of competing risks was considered. As CVD remain the leading cause of mortality in MASLD populations[12], the nearly two-fold increased risk of CVD observed in our MASLD group may have acted as a competing event, preventing some participants from surviving long enough to eventually develop PLC. Additionally, the duration of follow-up time should be considered. Although 13.7 years was allowed for the observation of robust systemic risks, it remains possible that the independent effect of MASLD on PLC requires a longer latency period.
Emerging evidence suggests that simple SLD is negatively associated with liver inflammation, fibrosis[32], cirrhosis[33], and PLC[34], whereas metabolic dysfunction is associated with a higher risk[35,36] in HBV-infected participants. Our joint analysis supports this hypothesis. Although we found a significant synergistic interaction between HBV and CMRFs, a negative interaction between HBV and SLD was also observed, albeit this was not statistically significant (P = 0.170), likely because of the relatively small sample size of participants with SLD. Consistent with experimental models showing that SLD suppresses HBV replication and activity[37,38], these findings may reflect the biological tendency of steatosis to attenuate HBV-related carcinogenesis. Notably, participants co-exposed to CMRFs and HBV infection without SLD exhibited the highest risk of PLC. This “Non-SLD metabolic” state may represent a catabolic “burnt-out” phase of patients with advanced MASLD, where hepatic fat is lost as fibrosis progresses. As recently described in a large international cohort, this “burnt-out” phase may be associated with a significantly higher risk of liver-related events[39]. This suggests that in the presence of persistent metabolic risk factors, a reduction in liver fat should not be solely interpreted as a clinical improvement, but rather as a potential indicator of advancing fibrosis. Thus, a combined assessment, particularly involving fibrosis-related markers, is essential to provide a comprehensive clinical prognosis.
Beyond the liver, MASLD is associated with an increased risk of extrahepatic morbidities, including CVD and EHCs, particularly in HBV-infected individuals with mild steatosis, normal ALT levels, and persistent MASLD. This observation is consistent with that of a previous study that reported higher CMRF burden was associated with a dose-dependent increase in CVD-related mortality[36]. Its pathophysiology involves a complex interplay of systemic inflammation, insulin resistance, dyslipidemia, and endothelial dysfunction, which contributes to the progression of MASLD, hypertension, coronary artery disease, cardiomyopathy, and arrhythmia[40], thereby increasing risk of CVD[41]. Given that ALT levels are associated with the degree of hepatic fibrosis[42] and recent evidence from a biopsy-based chronic hepatitis B cohort indicates an inverse association between persistent steatosis and fibrosis regression[43], the lack of significant risk of CVD in moderate-to-severe steatosis groups or abnormal ALT groups may reflect a “survival bias” or “competing risks,” where severe liver disease develops into severe liver-related events before CVD events occur.
Moreover, the risk of CVD remained elevated even in patients with reversed MASLD, comparable to those with persistent MASLD and consistent with another large cohort[44]. This observation supports the “metabolic memory” phenomenon[45], in which the body retains a “memory” of damage from a prior abnormal environment even after normalization. This persistence is primarily mediated by stable epigenetic modifications (including DNA methylation and histone acetylation), chronic oxidative stress, and accumulation of advanced glycation end products, which leave a lasting pathological imprint on the vasculature[45]. Consequently, the resolution of hepatic steatosis does not immediately erase the established systemic metabolic risk, suggesting that even transient exposure to SLD and metabolic dysfunction can confer residual vascular damage. Our joint analysis confirmed that SLD and CMRFs were positively associated with CVD, whereas HBV infection was negatively associated with CVD, reinforcing the primacy of metabolic pathways rather than hepatotropic viral infections in the development of CVD; however, the overall association between chronic HBV infection and CVD risk remains inconsistent[13]. Clinically, these findings highlight that patients with a history of MASLD require ongoing cardiovascular monitoring and metabolic management regardless of their current hepatic steatosis status.
Numerous studies have reported a positive association between MASLD and EHCs[46-48]. Our study found that MASLD, especially persistent MASLD, was associated with a higher risk of EHCs. Joint analysis confirmed that CMRFs and SLD were independent risk factors for EHCs, with the highest risk occurring in individuals co-exposed to HBV, SLD, and CMRFs. This finding suggests that the cumulative duration and burden of metabolic factors and SLD may have driven this association. Mechanistically, this association is likely mediated by chronic systemic low-grade inflammation, insulin resistance, and lipotoxicity, which promote oxidative stress, DNA damage, and tumorigenic signaling beyond the liver[49].
This study benefitted from a large prospective cohort with extensive follow-up, enabling the investigation of various long-term outcomes and dynamic changes in the MASLD status. Excluding participants with less than two years of follow-up minimized cause-and-effect bias. The inclusion of a non-HBV group enabled a comprehensive joint analysis of SLD, CMRFs, and HBV.
However, this study has several limitations. First, although HBeAg status was collected, data on other longitudinal virological markers, including HBV DNA levels, HBsAg seroclearance, and antiviral therapy (AVT), were unavailable. Nevertheless, several lines of evidence support the robustness of our findings. The proportion of patients who underwent AVT was low in our cohort, reflecting the natural history of HBV infection in community settings. During the primary study period (2006–2015), restrictive national guidelines in China limited AVT to patients with active hepatitis (elevated ALT and detectable DNA levels) or cirrhosis[50]. In our study population, only 18.6% of participants exhibited elevated ALT levels. Given that contemporary national data suggest that only approximately 20% of eligible adults (ALT > 40 U/L) receive treatment[50], we estimated that 3.7% (18.6% × 20%) of our population received AVT. This aligns with the low baseline uptake (~5%) reported in China during this era[51]. Furthermore, we excluded participants with cirrhosis at baseline, who were high-priority candidates for AVT, further decreasing the likelihood of treatment influence.
Crucially, several unmeasured viral factors in our cohort may have led to underestimation of the association between MASLD and clinical outcomes. Regarding all outcomes (PLC, CVD, and EHCs), participants with MASLD were clinically more likely to receive AVT because of their higher prevalence of elevated ALT levels, which is consistent with the results of a previous study[52]. Additionally, participants with MASLD were more likely to develop HBsAg seroclearance[52]. Since both AVT and HBsAg seroclearance are negatively associated with PLC, CVD, and EHCs[53-55], their omission from our models further reinforces that our findings represent conservative estimates of the true risk.
Furthermore, MASLD is paradoxically associated with lower HBV DNA levels in CHB participants[52]. Given the negative association between low HBV DNA levels and PLC[14], their omission from our models constituted negative confounding factors. While the evidence linking HBV DNA levels to CVD and EHCs remains less definitive[13], the cumulative impact of treatment and seroclearance suggests that our observed HRs represent a conservative estimate of the true risk, thereby strengthening the robustness of our conclusions.
Second, although we identified cirrhosis (F4 for fibrosis) at baseline and during follow-up, data on the early to moderate stages of fibrosis (F1-F3) were not available. To address this, we implemented the following robust strategies: we excluded participants with baseline cirrhosis, adjusted for incident cirrhosis during follow-up, and performed a sensitivity analysis by excluding participants who developed cirrhosis during follow-up. All the above strategies produced consistent results. Furthermore, our sensitivity analysis utilizing E-values provides quantitative evidence of robustness. The E-value for MASLD-CVD (3.37) exceeded the reported HR for advanced fibrosis and CVD (HR = 2.69)[12], and the the E-value for EHCs (2.37) was well above the reported association between fibrosis and EHCs (HR = 1.09)[56]. These results suggest that the observed associations are unlikely to be fully attributable to unmeasured confounding factors of early to moderate fibrosis.
Third, our study relied solely on ultrasound to diagnose hepatic steatosis, a method with low sensitivity for detecting mild steatosis, particularly when the hepatic fat content is < 20%, which may have led to the misclassification of mild steatosis. However, ultrasound remains the most widely used first-line imaging modality for hepatic steatosis because of its low cost, noninvasiveness, and rapid execution, and it is considered an appropriate initial screening tool in both clinical practice and large population studies[57,58]. Our finding that even mild steatosis was associated with PLC and CVD strengthens the argument that ultrasonography could be a valuable risk-stratification tool, despite its limitations.
Finally, while the study population was derived from the Kailuan Study in Northern China, this cohort should be recognized as a functional microcosm in Chinese society. The prevalence of major chronic conditions (e.g., hypertension, 44%; MASLD, 26.4%) and the incidence rates of key outcomes (e.g., CVD: 1,027/100,000 PYs; cancer: 366/100,000 PYs) aligned closely with national statistics for the general Chinese population[59-63], supporting the validity of our findings regarding the HBV-CVD-cancer interplay in Northern China. Although these alignments are reassuring, their generalization to populations with significantly different ethnic backgrounds or lifestyles warrants further validation.
-
In this HBV-infected cohort, MASLD was independently associated with unfavorable extrahepatic outcomes. Metabolic dysfunction, rather than SLD, synergistically interacts with HBV infection during hepatic carcinogenesis, whereas both SLD and metabolic dysfunction independently increase the risk of CVD and EHCs. These extrahepatic risks were most pronounced among participants with normal ALT levels and persistent MASLD. Furthermore, the risk of CVD remained elevated even in participants with reversed MASLD. These findings indicate that multidisciplinary and comprehensive metabolic management are essential strategies to prevent systemic morbidity in patients with HBV infection regardless of their current hepatic steatosis and ALT status.
HTML
Study Population
Definition of MASLD
Follow-up and Outcomes
Covariates
Demographic Characteristics
Concurrent MASLD and Outcomes
Degree of Steatosis and Severity of MASLD at Baseline and Outcomes
Changing Status of MASLD and Different Outcomes
Joint Analysis
Competing Interests All authors declare no conflicts of interest.
Ethics This study was approved by the Ethics Committee of Kailuan General Hospital [2006 Approval No.5]. All the participants provided informed consent.
Authors’ Contributions Concept and design: XM Wang, L Wang, SL Wu; Acquisition, analysis, or interpretation of data: All authors; Drafting of the manuscript: XM Wang, ST Wu; Critical revision of the manuscript for important intellectual content: All authors; Statistical analysis: XM Wang, ST Wu; Obtained funding: L Wang. Administrative, technical, and material support: Feng, Chen, Zhou, Yang, Wu, and Zhao; Supervision: L Wang; SL Wu.
Data Sharing The data are available from the corresponding author upon reasonable request and with permission from the Kailuan Study Management Committee. The Supplementary Materials will be available in www.besjournal.com.
&These authors contributed equally to this work.

 Quick Links
 DownLoad: