
-
Lung cancer is the most commonly diagnosed malignancy and leading cause of cancer-related mortality worldwide, imposing a substantial public health burden[1]. In 2022, approximately 2.5 million new cases and 1.8 million deaths from lung cancer were reported globally, accounting for 12.4% of all newly diagnosed cancers and 18.7% of total cancer deaths, respectively[1]. Although tobacco smoking remains the primary risk factor for lung cancer, approximately 25% of patients are never-smokers, highlighting the contribution of additional etiological factors[2]. Given the high incidence and mortality of lung cancer, expanding the understanding of its risk factors is essential.
Metabolic syndrome (MetS), also known as syndrome X, insulin resistance syndrome, or the “deadly quartet,” is characterized by central obesity, hyperglycemia, hypertension, and dyslipidemia[3]. With an aging global population, the prevalence of MetS has increased substantially, affecting approximately 10-30% of adults in both developed and developing countries[4]. Growing evidence suggests that MetS is associated with cancer development and mortality[5-8], which may be mediated by shared pathophysiological mechanisms such as chronic low-grade inflammation and insulin resistance[9-11]. However, these associations appear to be cancer site-specific, and the definitive relationship between MetS and lung cancer remains controversial. While some studies have suggested that MetS may increase lung cancer risk[12,13], previous meta-analyses have reported no significant association[14,15], possibly due to limitations such as small sample sizes in the included studies and inconsistent definitions of MetS. Furthermore, epidemiological evidence regarding the association between MetS and lung cancer mortality is limited, and no clear association with increased mortality risk has been established[6,8,16]. Therefore, it is necessary to reevaluate the effect of MetS on lung cancer in a large, independent, prospective study.
Genetic factors have a significant effect on lung cancer development[17,18]. Previous genome-wide association studies (GWASs) have identified multiple genetic variants associated with lung cancer risk[19,20]. Polygenic risk scores (PRSs), which aggregate and weigh multiple genetic variants with modest individual effects, have been shown to enhance the prediction of genetic predisposition to diseases[21,22]. Investigating gene-environment interactions offers valuable insights into more accurate risk prediction and targeted interventions for human cancers[23,24]. However, most previous studies have examined only the independent effects of MetS or genetic variants on lung cancer risk, without fully considering the combined or interactive effects.
Therefore, in this study, we utilized lung cancer data from the UK Biobank (UKB) cohort and constructed PRSs by weighting and integrating GWAS-identified variants associated with lung cancer in individuals of European ancestry from the International Lung Cancer Consortium[20]. We aimed to investigate the effects of MetS, genetic factors, and their interactions on lung cancer incidence and mortality.
-
The UKB is a large, prospective, population-based cohort study that recruited more than 500,000 participants aged 40–69 years from 22 assessment centers across the United Kingdom between 2006 and 2010. Participants provided extensive individual-level data via touchscreen questionnaires, face-to-face interviews, physical examinations, and biological sample collection[25]. For the present analyses, 355,344 participants were included after excluding individuals who: (1) had a diagnosis of malignant neoplasms at baseline (excluding non-melanoma skin cancer [C44]); (2) had missing data for any of the five MetS components; or (3) self-reported as non-White ethnicity. Furthermore, individuals with missing genetic information or discordance between genetic and self-reported sex were excluded, yielding 352,535 participants for the genetic analyses (Supplementary Figure S1).
-
The primary outcomes were lung cancer incidence and mortality. Lung cancer was defined using the 10th Revision of the International Classification of Diseases (ICD-10), with codes C33–C34. Incidence data for lung cancer were obtained from national cancer registries. Follow-up periods varied by registry: data from the Scotland, England, and Wales registries were updated until November 30, 2021, December 31, 2020, and December 31, 2016, respectively. Mortality data for lung cancer were obtained from death certificates held by the National Health Service (NHS) Information Centre in England and Wales and the NHS Central Register in Scotland, with updates extending to November 30, 2022. Participants were followed from the date of recruitment until the diagnosis of lung cancer (for incidence analyses), death, loss to follow-up, or end of follow-up, whichever occurred first.
-
MetS was defined according to the modified National Cholesterol Education Program Adult Treatment Panel III (NCEP ATP III) criteria[26], requiring at least three of the following five components: (1) reduced high-density lipoprotein cholesterol (HDL-C; < 1.0 mmol/L in males and < 1.3 mmol/L in females) or use of dyslipidemia medication; (2) elevated triglycerides (TG; ≥ 1.7 mmol/L) or use of dyslipidemia medication; (3) elevated blood pressure (BP; systolic BP ≥ 130 mmHg or diastolic BP ≥ 85 mmHg) or use of antihypertensive medication; (4) elevated fasting blood glucose (≥ 100 mg/dL) or use of antidiabetic medication; and (5) increased waist circumference (WC; ≥ 102 cm in males and ≥ 88 cm in females). Serum HDL-C and TG levels were measured using enzyme immunoinhibition and glycerol-3-phosphate-peroxidase methods, respectively. BP was measured by trained nurses using an Omron 705 IT electronic blood pressure monitor (or manually, if unavailable), with the average of available readings used for analysis. Because fasting blood glucose was not measured in the cohort, glycated hemoglobin (HbA1c) was used as a surrogate marker, with a cutoff of ≥ 42 mmol/mol[27,28].
-
Genotyping and imputation methods used in the UKB have been described previously[29]. For PRS construction, 18 single-nucleotide polymorphisms (SNPs) were selected from the largest GWAS of lung cancer among individuals of European ancestry, conducted by the International Lung Cancer Consortium[20] (Supplementary Table S1). The odds ratio (ORj) for each SNP was extracted from the literature, and the corresponding risk weight (βj) was calculated as the natural logarithm of the OR. Each SNP (SNPj) was coded as 0, 1, or 2 according to the number of risk alleles present. The PRS for each participant was calculated using the following equation[24]: $ PRS=\sum\limits_{j=1}^{M}{\beta }_{j}×{SNP}_{j} $. Participants were subsequently divided into three genetic risk categories according to PRS tertiles: low risk (lowest tertile), intermediate risk (middle tertile), and high risk (highest tertile).
-
Covariate information was obtained through touchscreen questionnaires and physical measurements, including age at recruitment, sex (male or female), Townsend deprivation index, education level (college or university degree vs. other), smoking status (never, former, or current), alcohol intake frequency (never, special occasions only, 1–3 times per month, 1–2 times per week, 3–4 times per week, or daily/almost daily), healthy diet (yes or no), family history of cancer (yes or no), family history of cardiovascular disease (CVD; yes or no), and self-reported personal history of emphysema/bronchitis (yes or no). Passive smoking was defined as exposure to secondhand smoke at home or outside the home for more than 0 hours and less than 168 hours per week (i.e., the total number of hours per week)[30]. Physical activity was classified as high, moderate, or low based on the International Physical Activity Questionnaire (IPAQ)[31]. Body mass index (BMI) was calculated as weight in kilograms divided by height in meters squared (kg/m2) and further categorized as underweight (< 18.5 kg/m2), normal weight (18.5–25.0 kg/m2), overweight (25.0–30.0 kg/m2), or obese (≥ 30.0 kg/m2)[32].
-
Baseline characteristics were summarized according to MetS status. Continuous variables were presented as medians with interquartile ranges (25th and 75th percentiles) and compared using the Wilcoxon rank-sum test. Categorical variables were presented as counts with percentages and compared using the chi-squared test.
The cumulative risk of lung cancer incidence and mortality for MetS-related variables (MetS, its components, and the number of metabolic abnormalities) and genetic factors was estimated using the R packages “survival” and “survminer,” with risk curves plotted via “ggplot2.” Multivariable-adjusted Cox proportional hazards regression models were used to estimate hazard ratios (HRs) and 95% confidence intervals (CIs) for lung cancer incidence and mortality associated with MetS-related variables. The proportional hazards assumption was assessed using a global test based on Schoenfeld residuals. Model 1 was adjusted for age, sex, Townsend deprivation index, BMI, education level, smoking status, family history of cancer, and personal history of emphysema/bronchitis. Model 2, used for the sensitivity analysis, was additionally adjusted for alcohol intake, passive smoking, family history of CVD, healthy diet, and IPAQ groups. Model 3 further included all five MetS components to evaluate their independent associations with lung cancer risk. Subgroup analyses were performed by sex and smoking status to assess whether the association between MetS-related variables and lung cancer risk differed across these strata. Statistical heterogeneity between subgroups was evaluated using the Q statistic, with statistical significance defined as P ≤ 0.10.
For joint analyses of MetS-related variables and genetic factors, additional adjustments were made to the top 40 principal genetic components and genotyping batches. Participants were categorized into six groups based on combinations of MetS (yes/no), increased WC (yes/no), elevated BP (yes/no), reduced HDL-C (yes/no), elevated TG (yes/no), and elevated HbA1c (yes/no) with PRS tertiles (low/intermediate/high). Additive interactions between MetS-related variables and PRSs were evaluated using the relative excess risk due to interaction (RERI) and attributable proportion (AP)[33]. An additive interaction was considered absent if the CIs for RERI and AP included zero.
All P values were two-sided, and P < 0.05 was considered statistical significance. All analyses were performed using R software (version 4.3.3; R Project for Statistical Computing, Vienna, Austria).
-
Table 1 presents the baseline characteristics of participants stratified by MetS status. The study included 355,344 participants with a median age of 58 years (interquartile range: 50–63 years), with 53% were female. MetS was present in 118,826 participants at enrollment, representing a prevalence of 33.4%. Participants with MetS were more likely to be male, older, smoke more often, have a higher prevalence of passive smoking exposure, and have a higher BMI than those without MetS. Additionally, they had lower educational attainment and socioeconomic status (measured by the Townsend Deprivation Index), a more frequent family history of cancer and CVD, increased personal history of emphysema/bronchitis, reduced physical activity (according to the IPAQ classification), less adherence to healthy dietary patterns, and lower alcohol consumption.
Characteristics Total
(n = 355,344)MetS
(n = 118,826)Non-MetS
(n = 236,518)P-value Age, y, median [IQR] 58.00 [50.00, 63.00] 61.00 [54.00, 65.00] 56.00 [49.00, 62.00] < 0.001 Age, n (%) < 0.001 < 60 y 202,135 (56.9) 51,687 (43.5) 150,448 (63.6) ≥ 60 y 153,209 (43.1) 67,139 (56.5) 86,070 (36.4) Sex, n (%) < 0.001 Female 188,290 (53.0) 54,073 (45.5) 134,217 (56.7) Male 167,054 (47.0) 64,753 (54.5) 102,301 (43.3) BMI, kg/m2, median [IQR] 26.73 [24.14, 29.86] 29.93 [27.22, 33.08] 25.46 [23.29, 27.84] < 0.001 BMI, n (%) < 0.001 Underweight (< 18.5 kg/m2) 1,766 (0.5) 80 (0.1) 1,686 (0.7) Normal (18.5–25 kg/m2) 115,466 (32.5) 11,884 (10.0) 103,582 (43.8) Overweight (25–30 kg/m2) 151,729 (42.7) 48,069 (40.5) 103,660 (43.8) Obesity (≥ 30 kg/m2) 85,792 (24.1) 58,504 (49.2) 27,288 (11.5) Missing 591 (0.2) 289 (0.2) 302 (0.1) Smoking status, n (%) < 0.001 Never 191,943 (54.0) 56,372 (47.4) 135,571 (57.3) Former 124,845 (35.1) 48,398 (40.7) 76,447 (32.3) Current 37,331 (10.5) 13,519 (11.4) 23,812 (10.1) Missing 1,225 (0.3) 537 (0.5) 688 (0.3) Passive smoking, n (%) < 0.001 No 235,831 (66.4) 73,467 (61.8) 162,364 (68.6) Yes 66,459 (18.7) 24,982 (21.0) 41,477 (17.5) Missing 53,054 (14.9) 20,377 (17.1) 32,677 (13.8) Alcohol intake, n (%) < 0.001 Daily or almost daily 74,995 (21.1) 22,406 (18.9) 52,589 (22.2) 3–4 times/week 85,542 (24.1) 24,485 (20.6) 61,057 (25.8) 1–2 times/week 93,821 (26.4) 30,753 (25.9) 63,068 (26.7) 1–3 times/month 39,677 (11.2) 14,563 (12.3) 25,114 (10.6) Special occasions only 37,647 (10.6) 16,241 (13.7) 21,406 (9.1) Never 23,401 (6.6) 10,282 (8.7) 13,119 (5.5) Missing 261 (0.1) 96 (0.1) 165 (0.1) Townsend index, median [IQR] −2.27 [−3.70, 0.24] −2.03 [−3.56, 0.72] −2.37 [−3.76, 0.01] < 0.001 Education level, n (%) < 0.001 College or University degree 114,084 (32.1) 28,915 (24.3) 85,169 (36.0) Other levels 238,129 (67.0) 88,546 (74.5) 149,583 (63.2) Missing 3,131 (0.9) 1,365 (1.1) 1,766 (0.7) Family history of cancer, n (%) < 0.001 No 208,448 (58.7) 66,899 (56.3) 141,549 (59.8) Yes 125,836 (35.4) 42,986 (36.2) 82,850 (35.0) Missing 21,060 (5.9) 8,941 (7.5) 12,119 (5.1) Family history of CVD, n (%) < 0.001 No 137,084 (38.6) 37,149 (31.3) 99,935 (42.3) Yes 202,063 (56.9) 75,234 (63.3) 126,829 (53.6) Missing 16,197 (4.6) 6,443 (5.4) 9,754 (4.1) Healthy diet, n (%) < 0.001 No 72,016 (20.3) 26,771 (22.5) 45,245 (19.1) Yes 226,919 (63.9) 73,267 (61.7) 153,652 (65.0) Missing 56,409 (15.9) 18,788 (15.8) 37,621 (15.9) IPAQ group, n (%) < 0.001 Low 53,646 (15.1) 22,059 (18.6) 31,587 (13.4) Moderate 117,654 (33.1) 38,877 (32.7) 78,777 (33.3) High 117,576 (33.1) 32,878 (27.7) 84,698 (35.8) Missing 66,468 (18.7) 25,012 (21.0) 41,456 (17.5) Personal history of emphysema/bronchitis, n (%) < 0.001 No 349,120 (98.2) 115,832 (97.5) 233,288 (98.6) Yes 5,750 (1.6) 2,793 (2.4) 2,957 (1.3) Missing 474 (0.1) 201 (0.2) 273 (0.1) WC, cm, median [IQR] 90.00 [80.00, 99.00] 100.00 [91.00, 107.00] 85.00 [77.00, 93.50] < 0.001 BP, mm Hg, median [IQR] Diastolic 82.00 [75.50, 89.00] 85.00 [78.50, 91.50] 80.50 [74.00, 87.50] < 0.001 Systolic 136.50 [125.00, 149.50] 142.50 [133.00, 154.00] 132.50 [121.50, 146.00] < 0.001 TG, mmol/L, median [IQR] 1.49 [1.05, 2.15] 2.10 [1.57, 2.82] 1.27 [0.94, 1.70] < 0.001 HDL-C, mmol/L, median [IQR] 1.40 [1.17, 1.68] 1.20 [1.02, 1.41] 1.51 [1.29, 1.77] < 0.001 HbA1c, mmol/mol, median [IQR] 35.10 [32.70, 37.70] 37.00 [34.20, 40.50] 34.40 [32.20, 36.60] < 0.001 Note. MetS, metabolic syndrome; BMI, body mass index; IQR, interquartile range; CVD, cardiovascular disease; IPAQ, international physical activity questionnaire; WC, waist circumference; BP, blood pressure; TG, triglyceride; HDL-C, high-density lipoprotein cholesterol; HbA1c, glycated hemoglobin. aContinuous variables are presented as median with interquartile ranges (25th, 75th percentiles), and categorical variables as counts with percentages. Table 1. Baseline characteristics of participants included in the studya
-
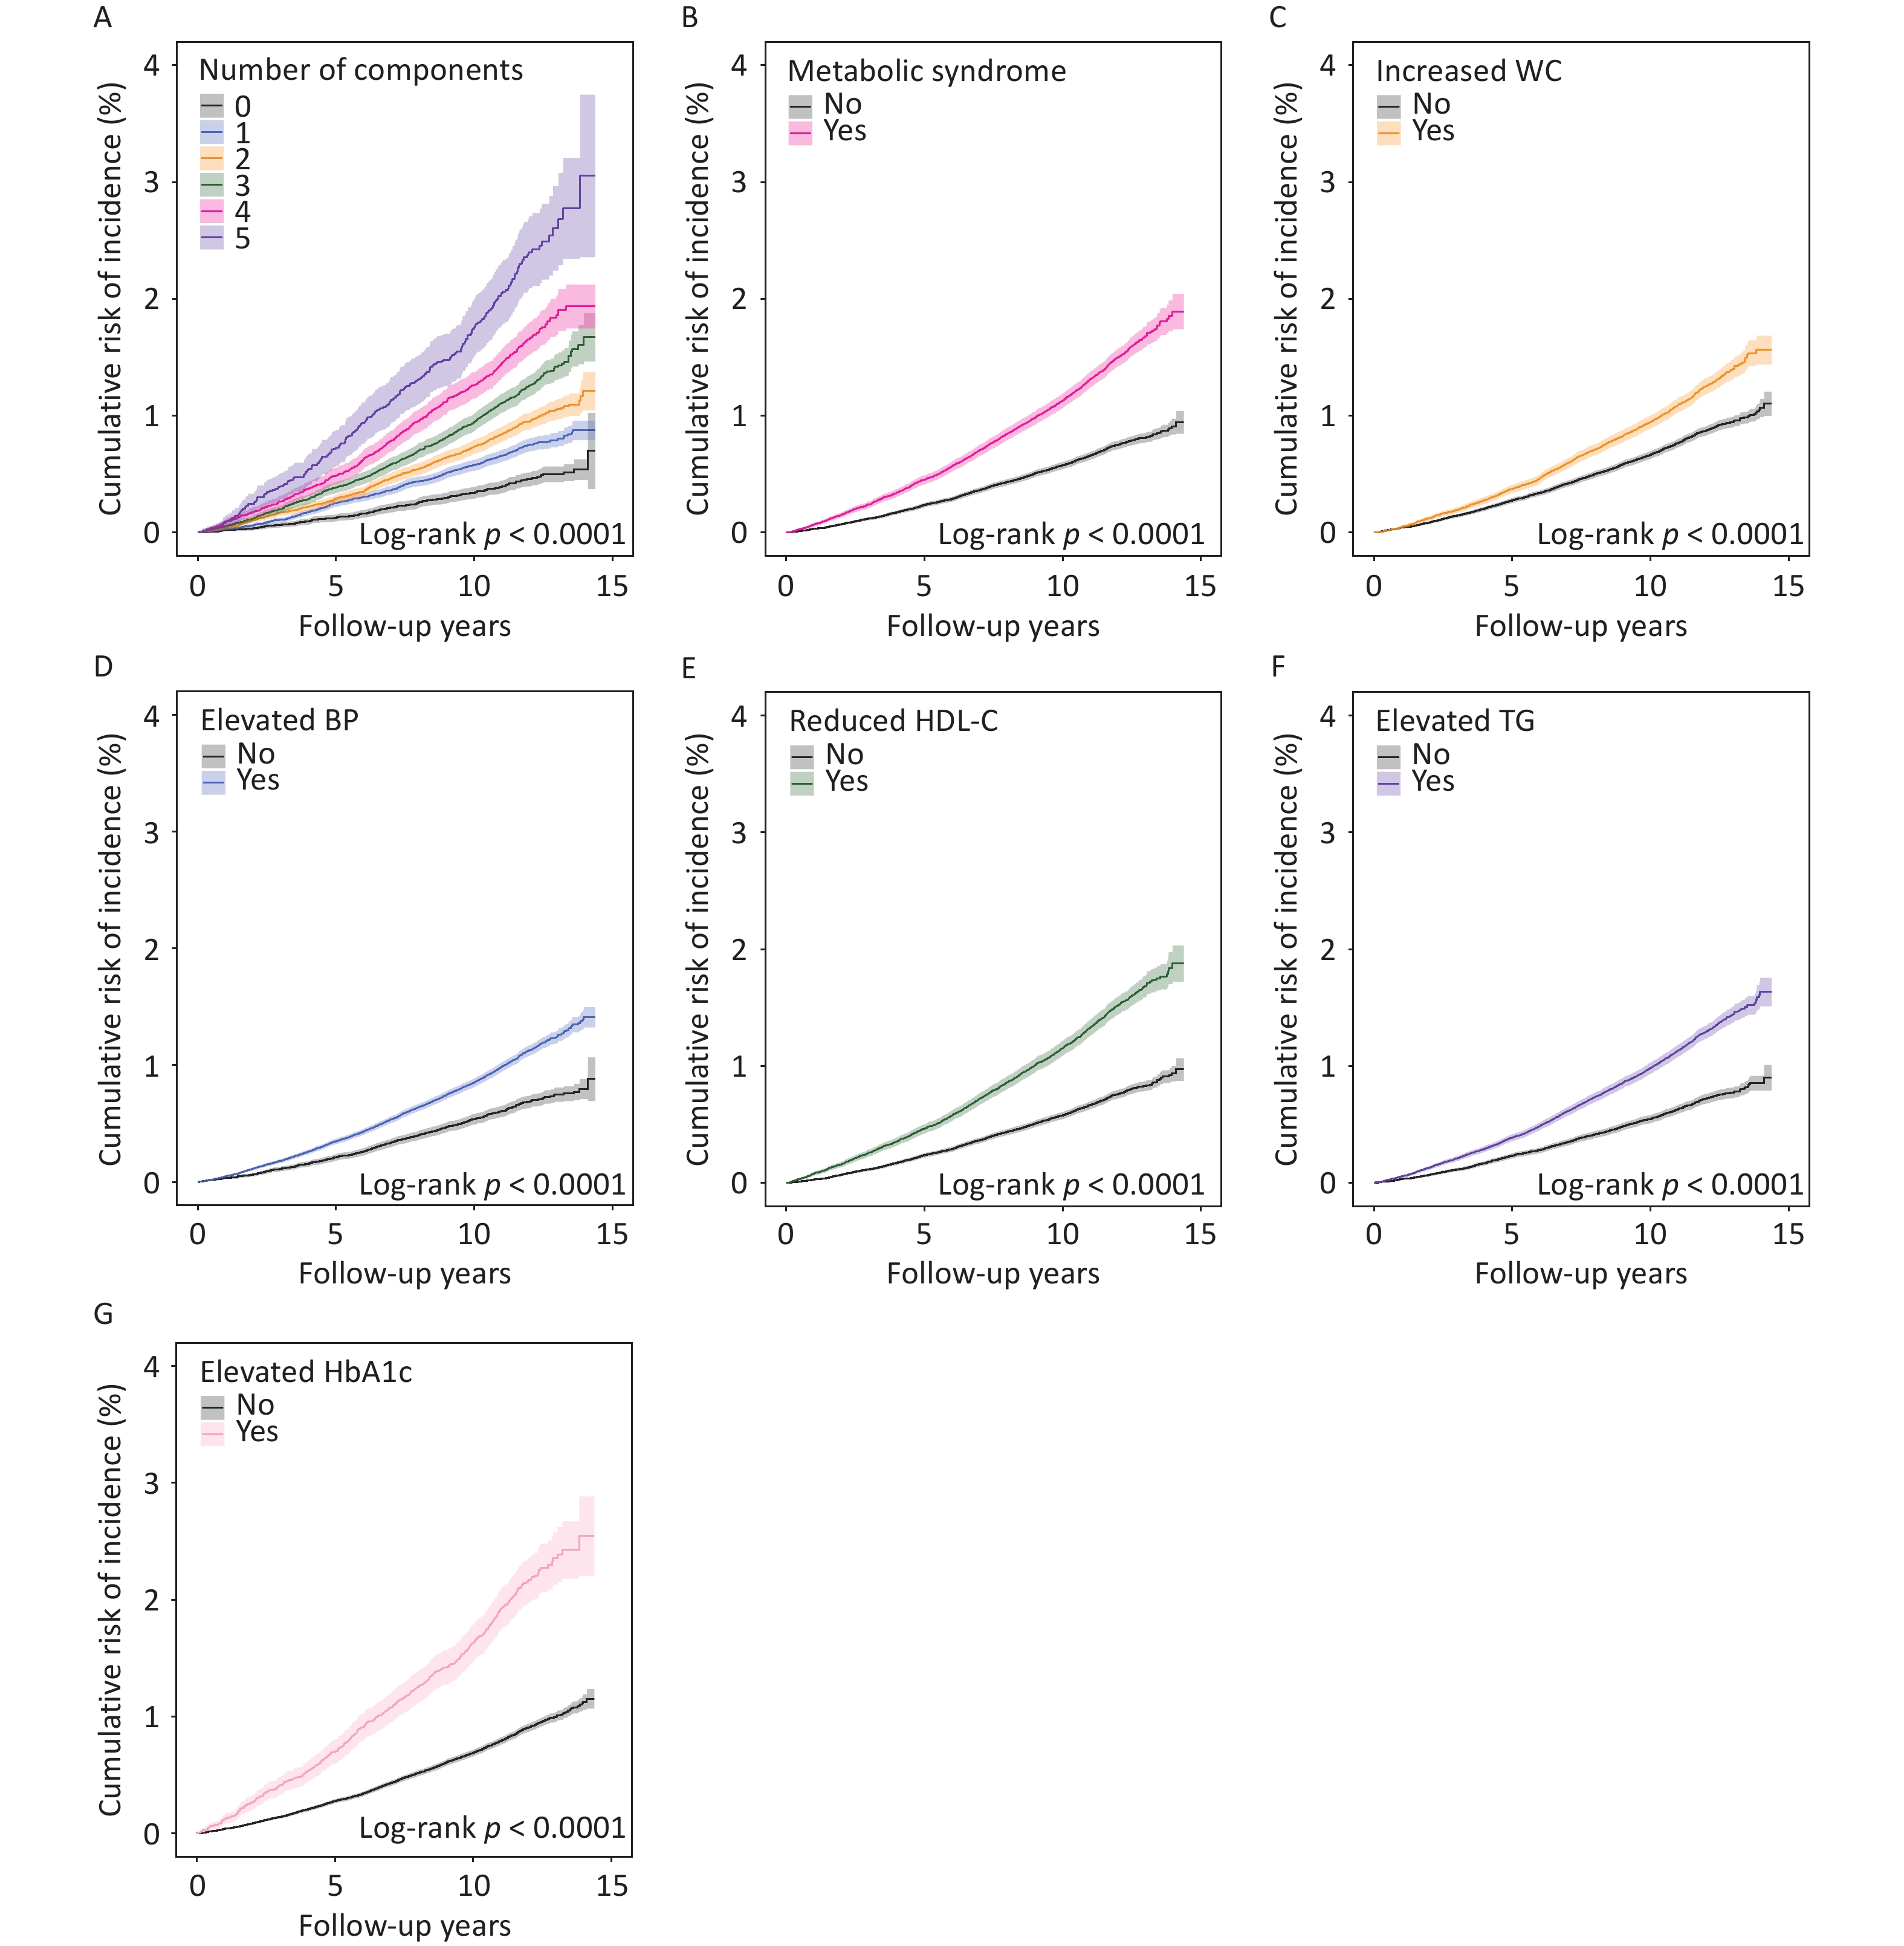
During a median follow-up of 13.8 years, 3,357 incident lung cancer cases and 2,476 lung cancer-related deaths were recorded. Participants with MetS or its individual components (increased WC, elevated BP, reduced HDL-C, elevated TG, or elevated HbA1c) demonstrated higher cumulative risks of lung cancer incidence and mortality than those without these conditions (Figure 1 B–G and Supplementary Figure S2 B–G). A distinct stratification of risk curves was observed across populations with varying numbers of metabolic abnormalities (ranging from 0 to 5), with the cumulative risk of lung cancer incidence and mortality progressively increasing with the number of abnormalities present (Figure 1 A and Supplementary Figure S2 A). Multivariable analyses revealed that participants with MetS exhibited significantly elevated risks of lung cancer incidence (HR: 1.31, 95% CI: 1.22–1.42; P < 0.001) and mortality (HR: 1.35, 95% CI: 1.24–1.48; P < 0.001) compared to those without MetS (Table 2; Model 1). A dose-response relationship was evident, with HRs for lung cancer incidence increasing from 1.15 to 2.24 (Ptrend < 0.001) and HRs for lung cancer mortality rising from 1.19 to 2.32 (Ptrend < 0.001) as the number of metabolic abnormalities increased from 1 to 5 (Table 2; Model 1). Among individual MetS components, increased WC, reduced HDL-C, elevated TG, and elevated HbA1c were associated with increased risks of both lung cancer incidence and mortality, whereas elevated BP was associated only with increased lung cancer mortality (Table 2; Model 1). After further adjustments for alcohol intake, passive smoking, family history of CVD, healthy diet, and IPAQ groups, these associations remained robust (Supplementary Table S2; Model 2). However, after mutual adjustment for MetS components, only increased WC, reduced HDL-C, and elevated HbA1c remained independently associated with an increased risk of lung cancer incidence and mortality, whereas elevated BP remained significantly associated with lung cancer mortality (Supplementary Table S3; Model 3).
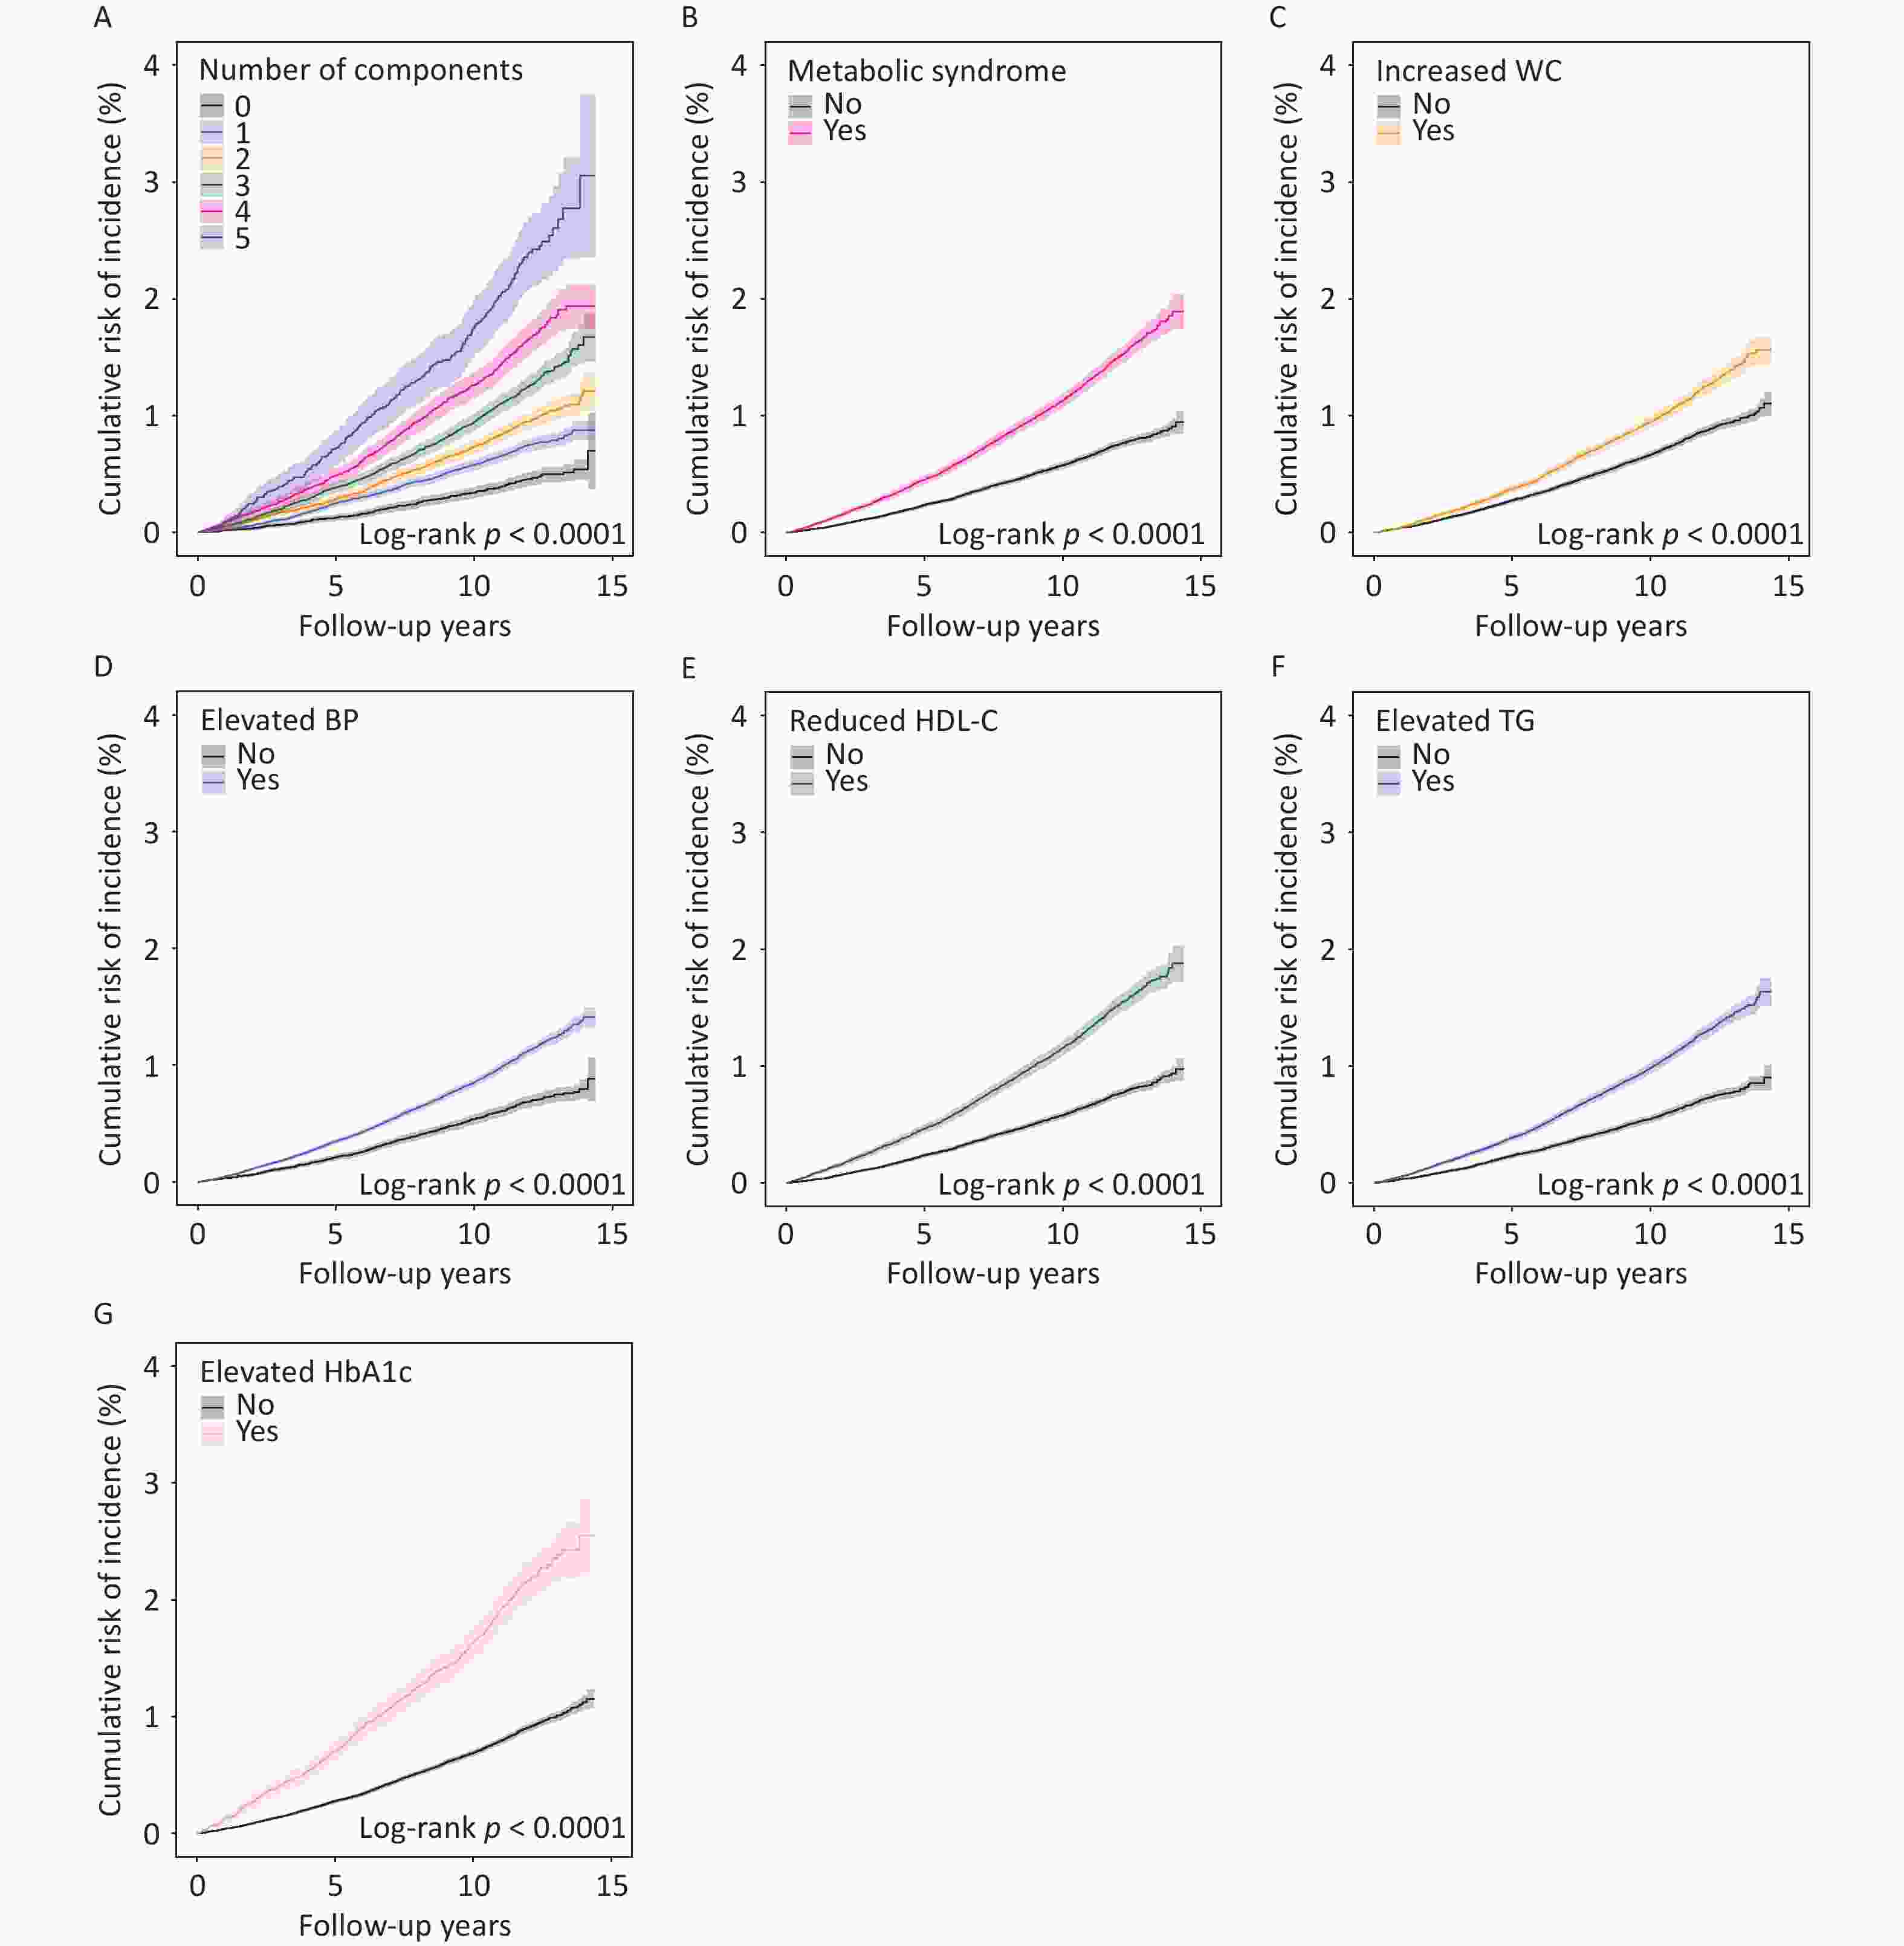
Figure 1. The cumulative risk of lung cancer incidence according to the number of metabolic abnormalities (A), metabolic syndrome (B) and its components (C–G). Shaded regions represent the 95% confidence intervals. WC, waist circumference; BP, blood pressure; HDL-C, high-density lipoprotein cholesterol; TG, triglyceride; HbA1c, glycated hemoglobin.
MetS-Related Variables Lung Cancer Incidence Lung Cancer Mortality Cases/Person-Years HR (95%CI)a ; P Cases/Person-Years HR (95%CI)a ; P Metabolic syndrome No 1,694/2,750,797 1.00 (ref.) 1,218/3,204,474 1.00 (ref.) Yes 1,663/1,352,379 1.31 (1.22–1.42) ; < 0.001 1,258/1,572,183 1.35 (1.24–1.48) ; < 0.001 Number of components 0 241/640,254 1.00 (ref.) 164/745,999 1.00 (ref.) 1 724/1,184,445 1.15 (0.99–1.33) ; 0.069 523/1,378,870 1.19 (1.00–1.42) ; 0.056 2 729/926,099 1.35 (1.16–1.57) ; < 0.001 531/1,079,605 1.38 (1.15–1.65) ; < 0.001 3 807/775,497 1.47 (1.27–1.72) ; < 0.001 621/902,389 1.59 (1.32–1.91) ; < 0.001 4 603/445,004 1.78 (1.51–2.10) ; < 0.001 448/517,677 1.83 (1.50–2.24) ; < 0.001 5 253/131,878 2.24 (1.83–2.74) ; < 0.001 189/152,117 2.32 (1.83–2.94) ; < 0.001 P value for trend − < 0.001 − < 0.001 Increased WC No 1,972/2,753,365 1.00 (ref.) 1,458/3,204,075 1.00 (ref.) Yes 1,385/1,349,811 1.38 (1.26–1.52) ; < 0.001 1,018/1,572,582 1.32 (1.18–1.47) ; < 0.001 Elevated BP No 685/1,214,774 1.00 (ref.) 475/1,416,251 1.00 (ref.) Yes 2,672/2,888,402 1.07 (0.98–1.17) ; 0.118 2,001/3,360,406 1.14 (1.03–1.27) ; 0.012 Reduced HDL-C No 1,764/2,820,791 1.00 (ref.) 1,273/3,285,780 1.00 (ref.) Yes 1,593/1,282,385 1.33 (1.24–1.43) ; < 0.001 1,203/1,490,877 1.37 (1.26–1.49) ; < 0.001 Elevated TG No 1,248/2,117,814 1.00 (ref.) 905/2,466,733 1.00 (ref.) Yes 2,109/1,985,362 1.16 (1.08–1.25) ; < 0.001 1,571/2,309,923 1.15 (1.06–1.26) ; 0.001 Elevated HbA1c No 2,836/3,806,597 1.00 (ref.) 2,084/4,433,905 1.00 (ref.) Yes 521/296,579 1.35 (1.23–1.49) ; < 0.001 392/342,751 1.35 (1.21–1.51) ; < 0.001 Note. MetS, metabolic syndrome; HR, hazard ratio; CI, confidence interval; ref, reference; WC, waist circumference; BP, blood pressure; HDL-C, high-density lipoprotein cholesterol; TG, triglyceride; HbA1c, glycated hemoglobin. aModel 1: The Cox proportional hazard models were adjusted by age, sex, townsend index, BMI, education level, smoking status, family history of cancer, and personal history of emphysema/bronchitis. Table 2. Association of MetS-related variables with risk of lung cancer incidence and mortality
-
Stratified analyses revealed that the association between MetS and lung cancer risk varied by sex, with more pronounced effects observed in female participants. Females with MetS exhibited a significantly higher risk of lung cancer incidence (HR: 1.42, 95% CI: 1.27–1.59) compared to males (HR: 1.23, 95% CI: 1.11–1.37; Pheterogeneity = 0.067). Similarly, MetS was associated with higher lung cancer mortality in females (HR: 1.50, 95% CI: 1.31–1.72) than in males (HR: 1.25, 95% CI: 1.11–1.41; Pheterogeneity = 0.049). Regardless of sex, the risk of lung cancer incidence and mortality increased progressively with the number of metabolic abnormalities, demonstrating a statistically significant dose-response relationship. All five components of MetS were associated with increased lung cancer incidence and mortality risk in females, whereas in males, only increased WC, reduced HDL-C, and elevated HbA1c levels significantly increased the risk. Notably, significant sex-based heterogeneity was observed in the association of elevated TG (Pheterogeneity = 0.026) and reduced HDL-C (Pheterogeneity = 0.063) with lung cancer incidence (Supplementary Figures S3 and S4; Supplementary Tables S4 and S5). The association between MetS and lung cancer risk was also modified by smoking status, with a substantially higher risk among smokers than among never-smokers. Among smokers, MetS was associated with significantly increased lung cancer incidence (HR: 1.44, 95% CI: 1.32–1.56), whereas no significant association was observed among never-smokers (HR: 0.98, 95% CI: 0.78–1.22; Pheterogeneity = 0.002). Similarly, MetS was associated with elevated lung cancer mortality among smokers (HR: 1.52, 95% CI: 1.38–1.68) but not among never-smokers (HR: 0.76, 95% CI: 0.57–1.01; Pheterogeneity < 0.001). A significant dose-response relationship across the number of metabolic abnormalities was observed exclusively among smokers. In smokers, almost all MetS components (with the exception of elevated BP) were associated increased lung cancer incidence and mortality, whereas in never-smokers, only increased WC correlated with lung cancer incidence, and elevated TG demonstrated a protective effect against lung cancer mortality (HR: 0.74, 95% CI: 0.57–0.95; P = 0.019) (Supplementary Figures S5 and S6; Supplementary Tables S6 and S7).
-
The construction of the PRS was based on 18 SNPs (Supplementary Table S1). Notably, participants with elevated PRSs demonstrated significantly higher cumulative risks of both lung cancer incidence and mortality (P < 0.001). Specifically, individuals classified in the high genetic risk category (top tertile of PRS distribution) exhibited a 59% increased risk of lung cancer incidence (HR: 1.59, 95% CI: 1.46–1.73) and a 64% elevated risk of lung cancer mortality (HR: 1.64, 95% CI: 1.49–1.81) compared to those in the low genetic risk category (Supplementary Figure S7; Supplementary Table S8).
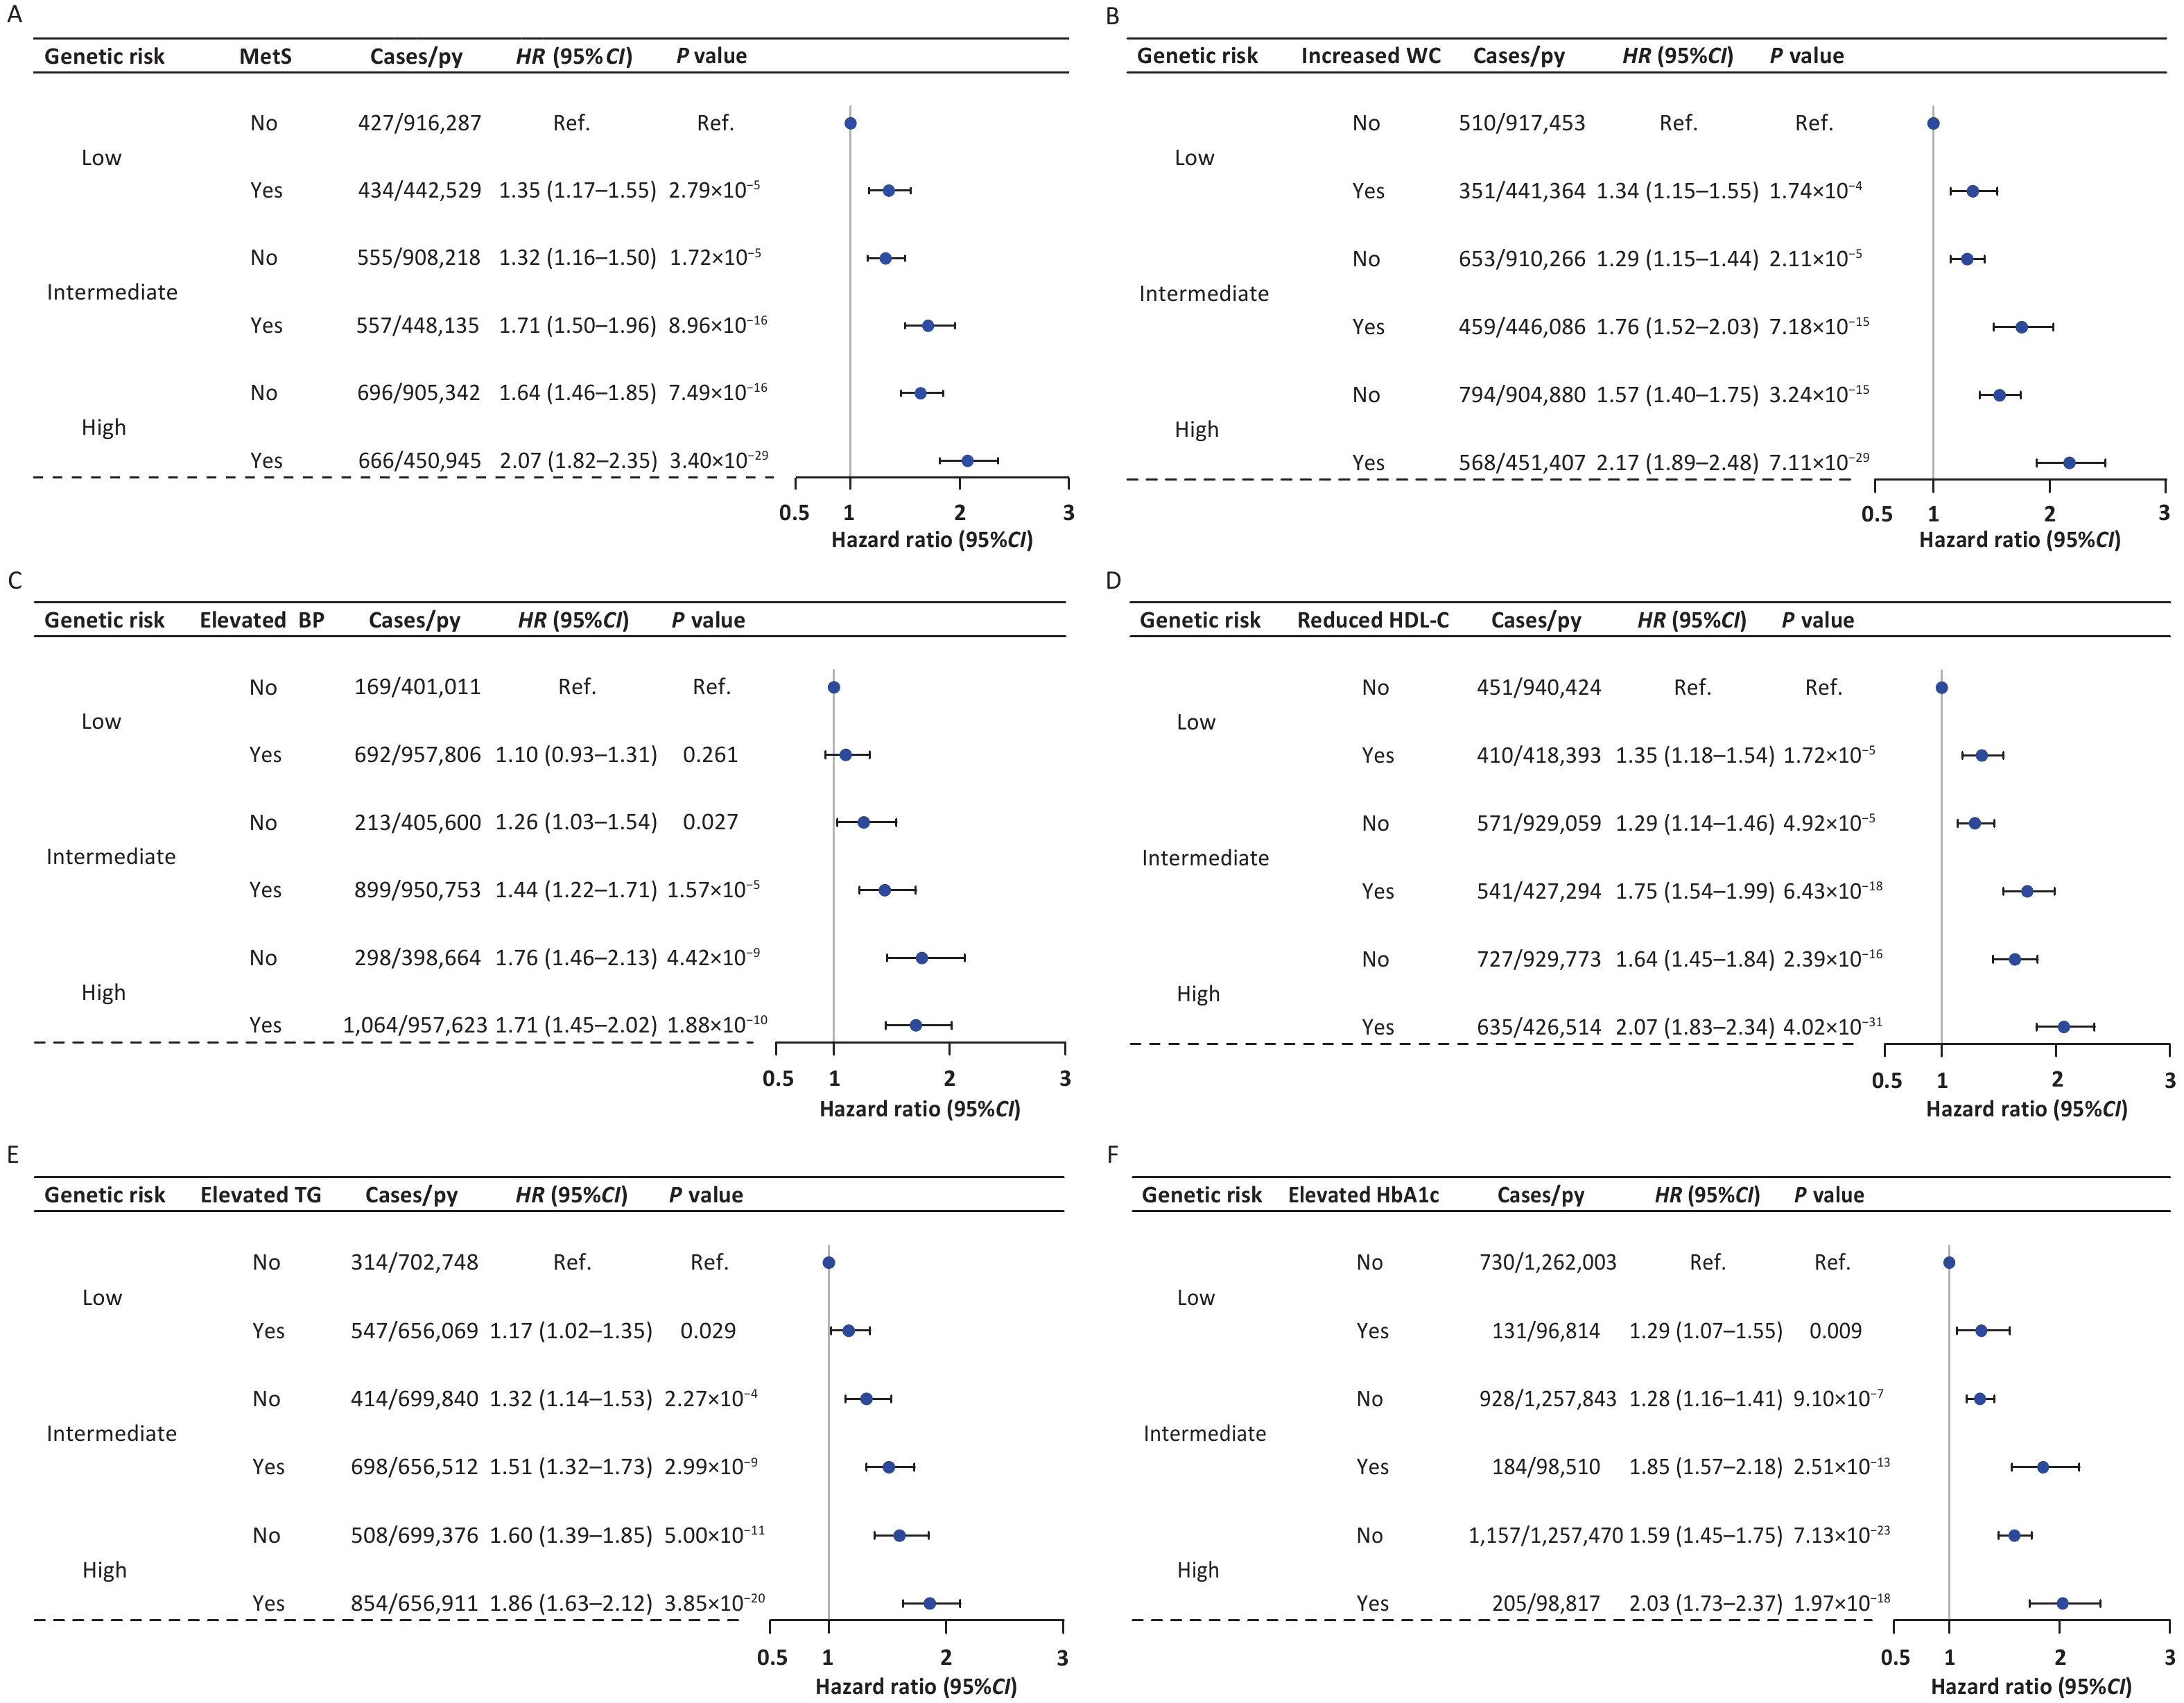
Our analyses revealed pronounced joint effects between genetic factors and MetS on both lung cancer incidence and mortality, characterized by a clear dose–response relationship. The overall risk of lung cancer progressively increased with higher genetic risk and the presence of MetS. Notably, compared with participants categorized as low genetic risk without MetS, participants at high genetic risk and concurrent MetS exhibited the most substantial risk elevation for both lung cancer incidence (HR: 2.07, 95% CI: 1.82–2.35) and mortality (HR: 2.12, 95% CI: 1.83–2.45). Similar dose-response patterns were consistently observed across individual metabolic parameters, including WC, HDL-C, TG, and HbA1c (Figure 2 and Supplementary Figure S8). RERI and AP values greater than zero, with 95% CIs that did not include zero, indicated significant positive additive interactions between increased WC and PRSs for both lung cancer incidence and mortality. Specifically, for lung cancer incidence, the RERI for increased WC and PRSs was 0.28 (95% CI: 0.02–0.55), and the AP was 0.13 (95% CI: 0.01–0.24); for lung cancer mortality, the RERI was 0.31 (95% CI: 0.02–0.61), and the AP was 0.15 (95% CI: 0.01–0.28) (Table 3). Compared with other MetS components, increased WC may play a more important role in lung cancer risk.
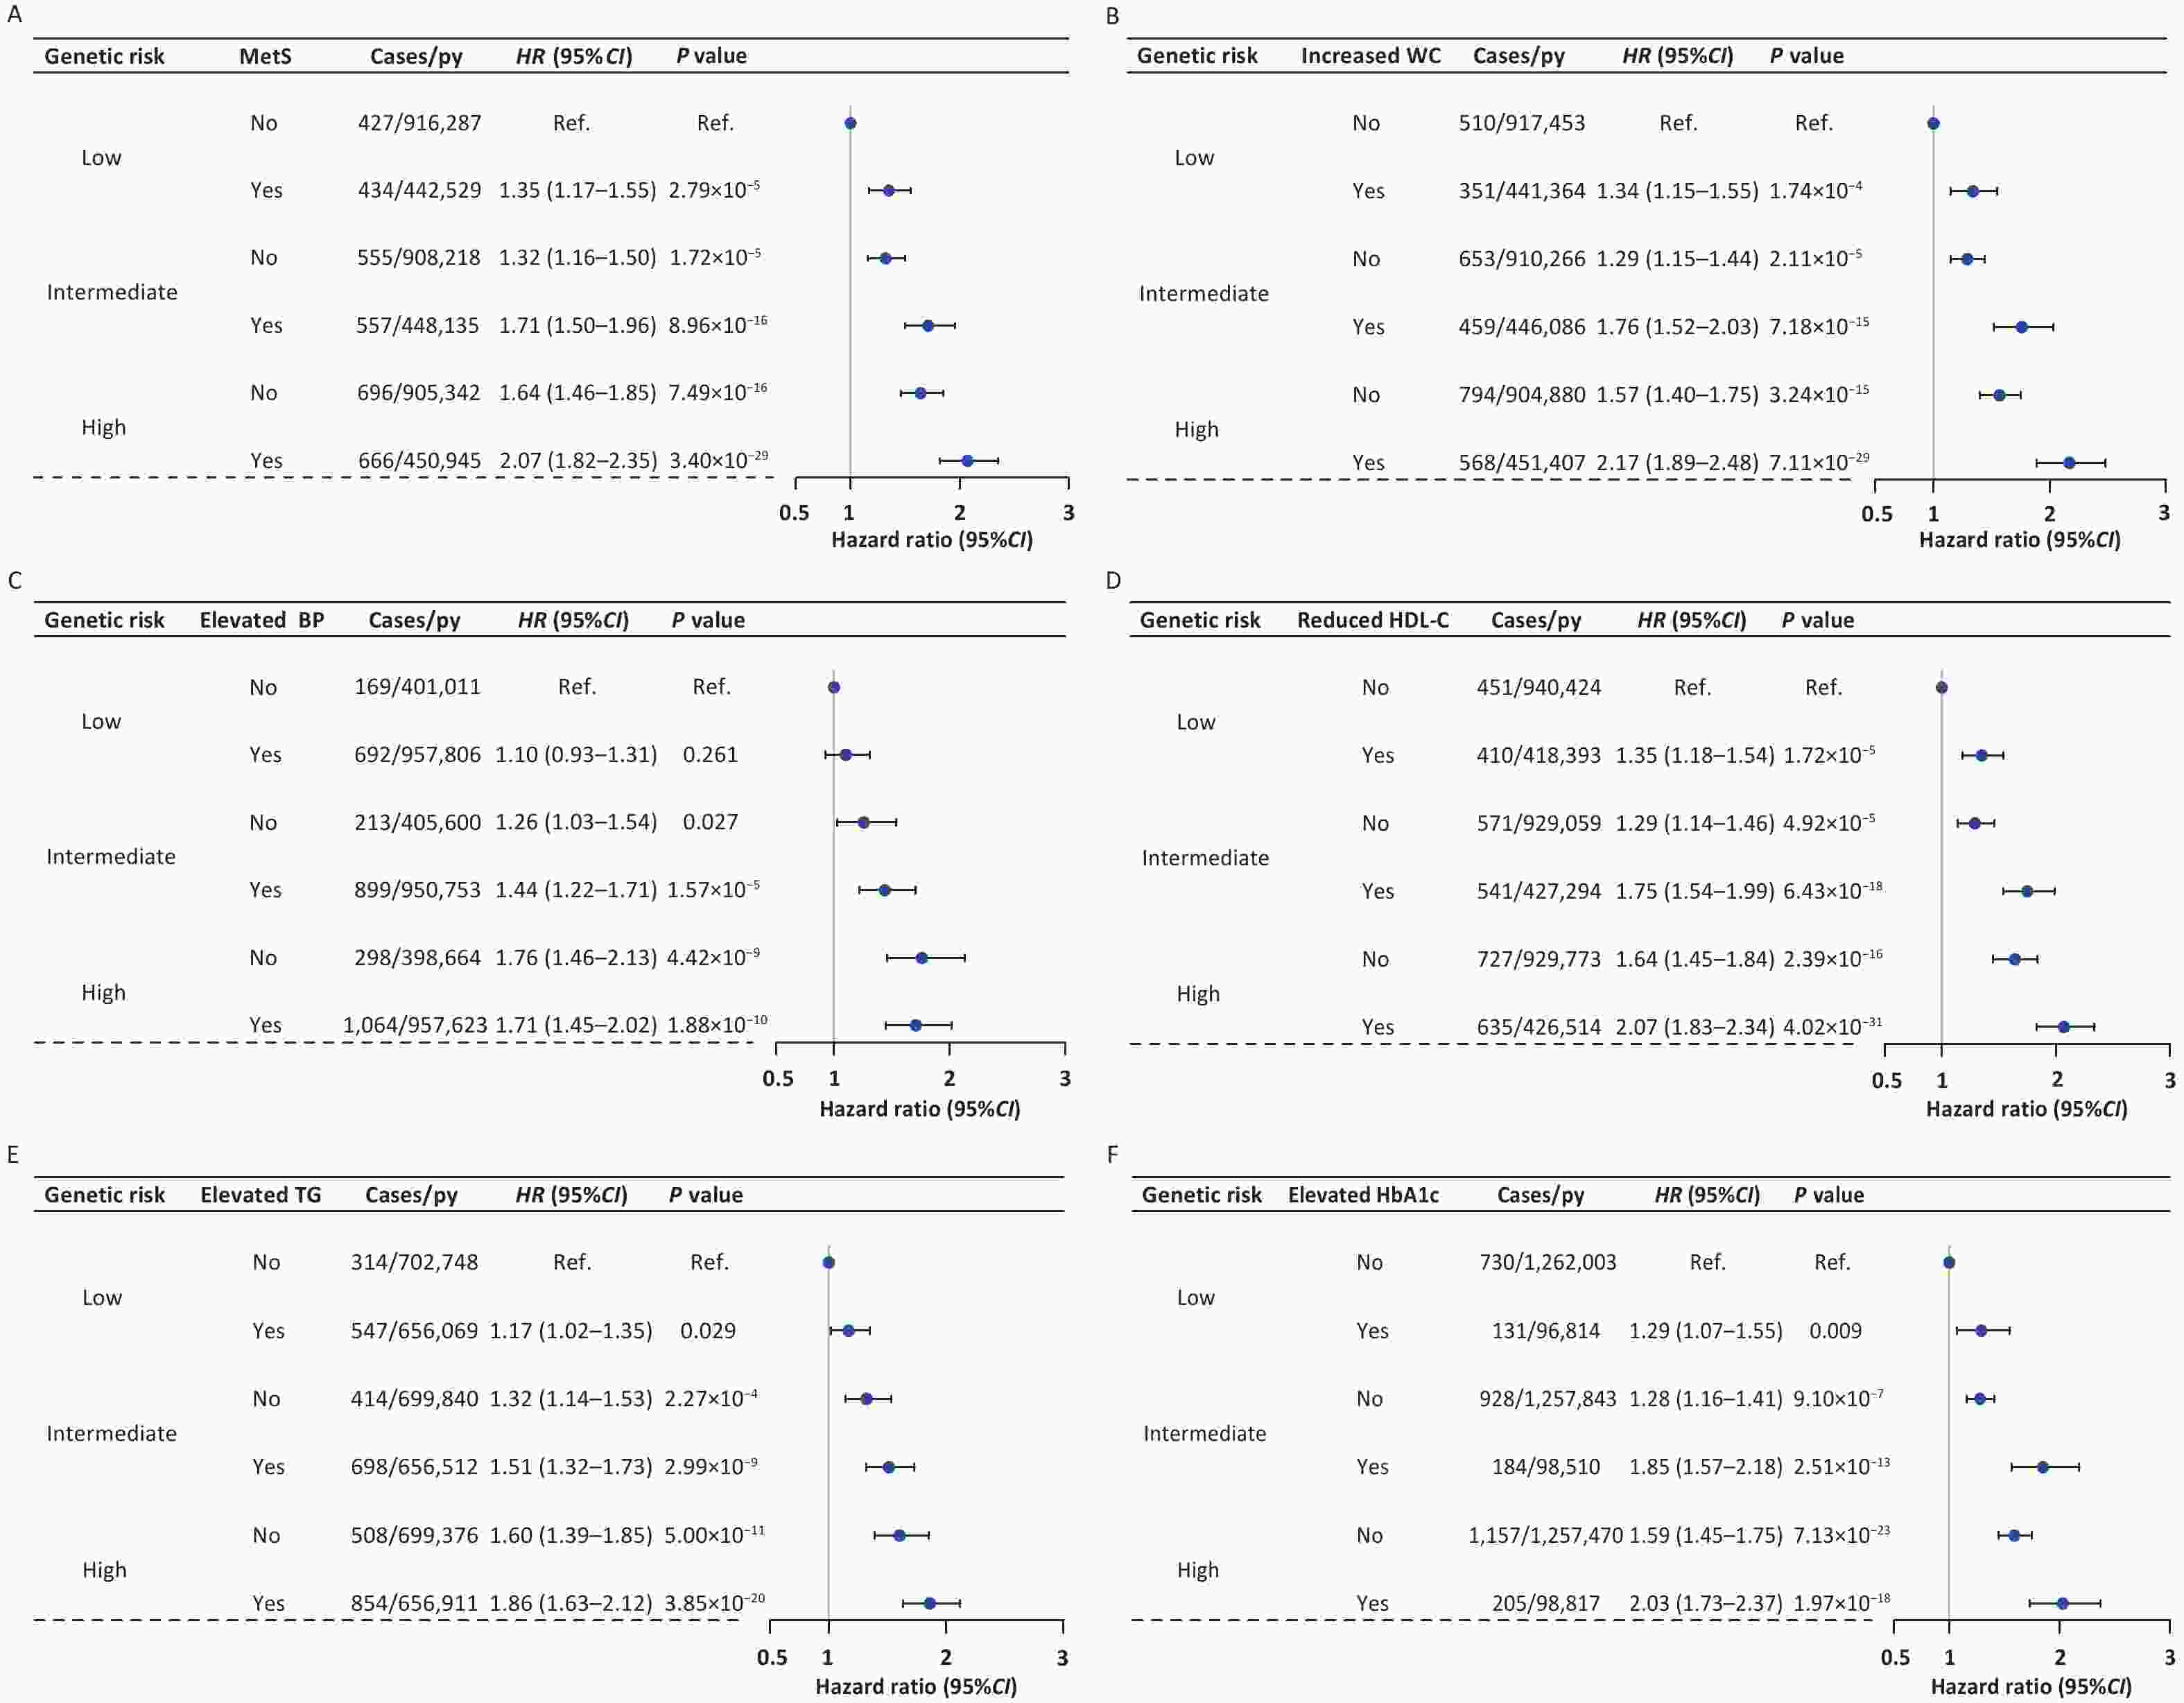
Figure 2. The joint effects of metabolic syndrome or its components and genetic risk on lung cancer incidence. The hazard ratios for lung cancer incidence according to MetS (A), increased WC (B), elevated BP (C), reduced HDL-C (D), elevated TG (E), elevated HbA1c (F), and genetic risk categories were estimated by using Cox proportional hazard models with adjustment for age, sex, townsend index, BMI, education level, smoking status, family history of cancer, personal history of emphysema/bronchitis, the top 40 genetic principal components and genotyping batches. HR, hazard ratio; CI, confidence interval; Ref, reference; py, person-years; MetS, metabolic syndrome; WC, waist circumference; BP, blood pressure; HDL-C, high-density lipoprotein cholesterol; TG, triglyceride; HbA1c, glycated hemoglobin.
MetS-Related
VariablesLung cancer incidence Lung cancer mortality Intermediate PRSsa High PRSsa Intermediate PRSs High PRSs RERI (95%CI)b AP (95%CI)b RERI (95%CI) AP (95%CI) RERI (95%CI) AP (95%CI) RERI (95%CI) AP (95%CI) MetS Yes 0.06 (−0.19 to 0.30) 0.03 (−0.11 to 0.17) 0.09 (−0.17 to 0.34) 0.04 (−0.08 to 0.16) 0.23 (−0.04 to 0.49) 0.13 (−0.02 to 0.28) 0.25 (−0.04 to 0.54) 0.12 (−0.01 to 0.25) Increased WC Yes 0.13 (−0.11 to 0.38) 0.08 (−0.06 to 0.21) 0.28 (0.02 to 0.55) 0.13 (0.01 to 0.24) 0.32 (0.05 to 0.59) 0.19 (0.04 to 0.34) 0.31 (0.02 to 0.61) 0.15 (0.01 to 0.28) Elevated BP Yes 0.09 (−0.16 to 0.34) 0.06 (−0.11 to 0.24) −0.15 (−0.45 to 0.14) −0.09 (−0.26 to 0.08) 0.22 (−0.07 to 0.50) 0.14 (−0.06 to 0.33) −0.11 (−0.46 to 0.25) −0.06 (−0.24 to 0.13) Reduced HDL-C Yes 0.12 (−0.13 to 0.36) 0.06 (−0.07 to 0.20) 0.10 (−0.16 to 0.36) 0.05 (−0.07 to 0.17) 0.23 (−0.04 to 0.51) 0.13 (−0.02 to 0.28) 0.22 (−0.08 to 0.51) 0.10 (−0.03 to 0.23) Elevated TG Yes 0.01 (−0.21 to 0.24) 0.01 (−0.14 to 0.16) 0.07 (−0.17 to 0.31) 0.04 (−0.09 to 0.16) −0.03 (−0.30 to 0.25) −0.02 (−0.19 to 0.16) −0.01 (−0.31 to 0.28) −0.01 (−0.16 to 0.14) Elevated HbA1c Yes 0.29 ( −0.07 to 0.66) 0.16 (−0.02 to 0.34) 0.17 (−0.21 to 0.55) 0.08 (−0.10 to 0.26) 0.22 ( −0.20 to 0.64) 0.12 (−0.10 to 0.34) 0.29 (−0.16 to 0.74) 0.13 (−0.06 to 0.32) Note. MetS, metabolic syndrome; RERI, relative excess risk due to the interaction; AP, attributable proportion due to the interaction; CI, confidence interval; PRSs, polygenic risk scores; WC, waist circumference; BP, blood pressure; HDL-C, high-density lipoprotein cholesterol; TG, triglyceride; HbA1c, glycated hemoglobin. Models were adjusted for age, sex, townsend index, BMI, education level, smoking status, family history of cancer, and personal history of emphysema/bronchitis. aGenetic risk levels were defined by polygenic risk scores: low (lowest tertile), intermediate (second tertile) and high (highest tertile). bTo estimate the RERI and AP, absence of metabolic syndrome or its components and low PRSs groups were the reference categories. Table 3. RERI and AP for additive interaction between MetS-related variables and genetic categories
-
In this study, we identified statistically significant associations between MetS and both lung cancer incidence and mortality. Notably, these associations demonstrated a clear dose-response relationship, increasing with the number of metabolic abnormalities. Among individual components of MetS, increased WC, reduced HDL-C, and elevated HbA1c were independently associated with increased risks of both lung cancer incidence and mortality, whereas elevated BP was associated only with lung cancer mortality. Joint analyses revealed that the risk of lung cancer incidence and mortality increased in a dose-dependent manner with increased genetic risk and the presence of MetS. Furthermore, a significant additive interaction was observed between WC and genetic factors, suggesting a potential synergistic effect.
This study systematically evaluated the effect of MetS on lung cancer incidence and mortality in a large cohort. Our findings demonstrated that participants with MetS exhibited significantly elevated risks of both lung cancer incidence and mortality. Although the underlying mechanisms explaining the relationship between MetS and lung cancer have not yet been fully elucidated, several key characteristics of MetS, such as a low-grade chronic inflammatory state, insulin resistance, and increased estrogen secretion from adipose tissue, may play an important role in this association[9-11,34]. In 2020, a Korean study found a positive association between MetS and lung cancer incidence for the first time using large-scale individual-level data (over 9 million people)[12], which is consistent with our findings. However, other studies have reported no significant association between MetS and lung cancer incidence[14,15,35,36]. Compared with these studies, our study has several methodological strengths, including its prospective design, large sample size, and standardized definition of MetS, which enhance the robustness of our findings. In addition, epidemiological evidence of the association between MetS and lung cancer mortality remains scarce. A recent study conducted in Japan showed that MetS was not associated with the risk of lung cancer mortality (HR: 1.46, 95% CI: 0.63-3.40)[8]. Only 27 lung cancer deaths were included in this study, which may have affected the reliability and authenticity of the findings[8]. In terms of MetS components, we found that increased WC[37-39], reduced HDL-C[40-42], and elevated HbA1c[43,44] were independently associated with increased risks of both lung cancer incidence and mortality, which is consistent with the results of several studies. However, the relationship between TG and lung cancer remains unclear. Some studies have shown a positive correlation between TG and lung cancer[45,46], whereas others have not[41,47]. In our study, elevated TG increased the risk of lung cancer incidence and mortality; however, the association was no longer statistically significant after further adjustment for other MetS components. Further studies are needed to clarify the relationship between TG and lung cancer. We also found that elevated BP was only associated with the risk of lung cancer mortality, particularly in female participants, which is broadly consistent with previous studies[48,49]. Research on the relationship between BP and lung cancer remains limited, and the underlying biological mechanisms have not yet been fully elucidated. However, hypertension is often accompanied by endothelial dysfunction, chronic inflammation, vascular remodeling, and a greater burden of comorbidities, all of which may influence tumor progression and survival[50,51]. These findings provide valuable insights into the specific components of MetS that may contribute to the development of lung cancer, and suggest that the association between MetS and lung cancer is highly plausible.
We reevaluated the impact of MetS on lung cancer incidence and mortality by stratifying participants according to sex and smoking status. We found that female participants with MetS had a higher risk of lung cancer incidence and mortality than male participants. Compared with men, women are more likely to exhibit metabolic abnormalities such as greater MetS severity, more pronounced central obesity, and elevated TG[52]; estrogen and estrogen receptor signaling have also been implicated in the initiation and progression of lung cancer[53], which may partly explain the observed sex differences. Meanwhile, in the lung microenvironment associated with lung carcinogenesis, women may also display stronger immunosuppressive features, such as a higher ratio of effector regulatory T cells to effector CD8+ T cells, which may weaken antitumor immune surveillance and thereby further amplify the adverse effects of metabolic dysregulation on lung cancer development and progression[54]. Our results showed that patients with MetS and smoke exposure had a high risk of lung cancer incidence and mortality, which supports the idea that smoking plays a decisive role in the development of lung cancer among patients with MetS, and screening for lung cancer may be recommended for MetS smokers to maximize screening benefits. Furthermore, it is noteworthy that among never-smokers, an inverse association was observed between elevated TG and lung cancer mortality. This finding should be interpreted with caution, as it may reflect prognostically relevant differences in metabolic or nutritional status rather than a protective effect at the etiological level. Better baseline nutritional and energy reserves may help patients tolerate anticancer treatments more effectively, thereby improving prognosis[55]. Previous studies have also suggested that pretreatment lipid levels are associated with prognosis in lung cancer, and that lower TG levels may be linked to poorer survival[46], which, to some extent, supports our findings.
Lung cancer etiology and progression stem from complex and sustained interactions between genetic predisposition and environmental exposures[56]. Although previous investigations have examined the combined influence of multiple environmental exposures and genetic susceptibility on lung cancer[24,57], the potential interactions and joint effects between MetS and PRSs remain unexplored. Our investigation revealed that concomitant high genetic risk and MetS significantly increased both lung cancer incidence and mortality. Notably, a significant additive interaction was observed between increased WC and high genetic risk. As a key indicator of central obesity, WC primarily reflects the distribution and accumulation of visceral fat, and may more directly capture the underlying nature of metabolic dysregulation. Visceral fat is metabolically active and closely associated with chronic inflammation, insulin resistance, adipokine dysregulation, and altered insulin/insulin-like growth factor (IGF)-related growth signaling, all of which may contribute to lung carcinogenesis[58,59]. Previous studies have shown that genetic susceptibility to lung cancer involves variants in the growth hormone (GH)-IGF axis[60]. Polymorphisms in adipokine-related genes, such as LEPR[61] and ADIPOQ[62], as well as genes involved in inflammatory pathways[63], have also been linked to lung cancer susceptibility. Therefore, the metabolic and inflammatory abnormalities driven by central obesity may overlap with the genetic susceptibility to lung cancer in certain biological pathways, thereby partly explaining the observed synergistic effect between the two. Nevertheless, this interpretation is still largely based on biological plausibility and requires further mechanistic validation.
Our study has several limitations. First, the MetS-related variables and some covariates were assessed only once at baseline, which may have failed to capture their dynamic changes during follow-up. This may have resulted in exposure misclassification, and consequently, biased estimates. Second, despite a comprehensive adjustment for multiple confounding factors, our results remain susceptible to unmeasured or unknown confounders. Nevertheless, our sensitivity analyses demonstrated robust findings when we made additional adjustments for alcohol intake, passive smoking, family history of CVD, healthy diet, and IPAQ groups. Third, UKB participants are generally healthier than the overall UK population, indicating the presence of a healthy volunteer bias, and our study included only White individuals, which limits the generalizability of the findings to other ethnic groups and populations with poorer health status. Further validation using a more diverse cohort is required. Finally, the 18 SNPs used to construct the PRS were derived from a GWAS conducted in European populations, which limits their transferability to other populations. In addition, the PRS mainly reflects the cumulative effects of common genetic variants and does not capture the genetic information of rare or structural variants.
In conclusion, our large prospective cohort study provides compelling evidence that MetS is significantly correlated with increased lung cancer incidence and mortality, with particularly pronounced associations among female participants and smokers. MetS and genetic susceptibility may jointly increase the risk of lung cancer incidence and mortality. These findings have several important clinical implications. In the future, MetS assessment, particularly key metabolic indicators such as WC, may be incorporated into screening and preventive counseling for individuals at high risk of lung cancer and combined with PRS for more refined risk stratification, thereby providing a basis for the development of targeted lung cancer prevention strategies.
HTML
Study Population
Outcome Ascertainment
MetS Assessment
PRS Construction
Covariates
Statistical Analysis
Characteristics of the Study Population
MetS-Related Variables and Lung Cancer
Stratified Analyses
Interaction and Joint Analyses of MetS-Related Variables and PRSs with Lung Cancer
Competing interests The authors declare that the research was conducted in the absence of any commercial or financial relationships that could be construed as a potential conflict of interest.
Ethics The UKB study was approved by the Northwest Multi-Center Research Ethics Committee (MREC). Full details can be found at https://www.ukbiobank.ac.uk/learn-more-about-uk-biobank/about-us/ethics. The generation and use of the data presented in this article were approved by the UKB access committee under UKB application number 79151. All participants provided written informed consent.
Authors’ contributions Supervision of the project, study design, and acquisition of funding: Juncheng Dai, Zhening Pu. Statistical analysis and first draft writing: Qingyin Bu. Critical revision of the manuscript for important intellectual content: Qian Wang, Gang Zhang. Statistical support during the study: Yifan Wang, Honggang Yi. Manuscript polishing and checking for grammatical and spelling errors: Longhu Sun, Shuang Liang. Application for data use permission and data management: Fan Yang, Zhazheng He. All authors reviewed and approved the final manuscript.
&These authors contributed equally to this work.

 Quick Links
 DownLoad: