
-
Fetal growth restriction (FGR) is primarily attributable to placental insufficiency, which causes chronic intrauterine hypoxia and ischemic stress[1] and leads to progressive failure of growth potential and a significantly elevated risk of perinatal mortality[2]. Previous studies have indicated that FGR exerts sustained adverse effects on long-term neurodevelopment, predisposing affected individuals to adverse neurodevelopmental outcomes[3]. In comparison with FGR in singleton pregnancies, twin pregnancies with selective FGR (sFGR) offer a unique internal comparison model, since the shared maternal environment and genetic background in co-twins minimizes the confounding effects of these factors and allows a more direct assessment of the effects of growth restriction on fetal metabolism and neurodevelopment. In neonates with sFGR, an increased risk of long-term neurodevelopmental disorders has been reported by the ages of 5–6 years and even at 12 years[4,5]. Therefore, accurately delineating the pathophysiological processes underlying sFGR holds substantial promise for prognostic assessments and guiding potential interventions aimed at mitigating adverse neurodevelopmental outcomes.
With the increasing application of metabolomics, a growing number of studies have focused on the metabolic profiling of umbilical cord blood, amniotic fluid, and placental tissue to elucidate the pathophysiology of sFGR. Our previous study demonstrated that specific combinations of maternal plasma metabolites during pregnancy exhibit high predictive accuracy for neonatal brain injury associated with sFGR in monochorionic diamniotic (MCDA) twin pregnancies[6]. However, maternal plasma may not fully represent the intrauterine metabolic environment of the fetus. Similarly, metabolomic analyses of cord blood and amniotic fluid only reflect transient metabolic states at delivery and fail to capture the long-term metabolic adaptations and reprogramming that occur in the fetus in utero under FGR conditions. In contrast, neonatal hair serves as a cumulative biological matrix. Given the growth characteristics of neonatal hair, previous studies have suggested that it incorporates circulating metabolites during late gestation[7,8], thereby providing a broader temporal window than point-in-time biospecimens for characterizing the metabolic consequences of chronic intrauterine stress. Our group previously characterized neonatal hair metabolic alterations associated with sFGR in MCDA twins, suggesting that neonatal hair metabolomics may provide a novel biomarker system for early risk assessment and intervention[9-11].
The dichorionic-diamniotic (DCDA) twin model is particularly suited for studying sFGR-related metabolic programming, since the paired co-twin design controls for shared maternal and genetic factors while the independent placental circulation avoids the confounding vascular anastomoses present in monochorionic pregnancies. Recent studies have demonstrated that sFGR in DCDA twins is associated with a high risk of perinatal morbidity and mortality, particularly in the smaller twin[12,13]. However, the long-term neurodevelopmental outcomes of DCDA-S remain poorly documented and mechanistically undefined. To address this critical knowledge gap, this study employed metabolomics of neonatal hair, a biospecimen reflecting late gestational metabolic status, to objectively characterize the intrauterine metabolic alterations in sFGR among DCDA twins. By correlating these metabolic signatures during late pregnancy with early neurobehavioral outcomes, we aimed to elucidate the pathophysiological link between chronic intrauterine stress and neurodevelopmental vulnerability, thereby advancing predictive biomarkers and providing mechanistic insights beyond conventional point-in-time metabolic assessments.
-
This nested case-control study was conducted with a twin cohort recruited at Peking University Third Hospital (ClinicalTrials.gov Identifier: NCT03220750) between September 2017 and December 2018. The inclusion criteria were as follows: (1) twin pregnancies confirmed as DCDA by first-trimester ultrasound before 14 weeks of gestation and (2) gestational age between 14 and 28 weeks at recruitment. Written informed consent was obtained from all participants before the study-related procedures. The maternal and fetal exclusion criteria were as follows: chronic diseases, obstetric and delivery complications, major congenital anomalies, major fetal structural anomalies, aneuploidy, other adverse twin pregnancy outcomes, and loss to follow-up (Supplementary Figure S1). For DCDA twin neonates, birth weight (BW) discordance was calculated using a standard formula[14]. Discordant twins were defined as those having a BW discordance exceeding 25%, with the BW of the smaller twin below the 10th percentile based on the consensus diagnostic criteria[14].
$$ \begin{split} & {\text{Twin \; BW} \;{\text{discordance}}} = \\ & \frac{ {\text{Larger\;twin{'}s\;BW}} -{\text{Smaller\;twin{'}s\;BW}}} {{\text{Larger\; BW}}} \times 100 \end{split} $$ (1) The DCDA twins in this study were classified into two groups: DCDA-C and sFGR-DCDA. The DCDA-C group included twins with BW concordance, while the sFGR-DCDA group included twins with BW discordance, with the larger and smaller twins designated as DCDA-L and DCDA-S, respectively. Gross examination of the placenta was performed by obstetricians immediately after delivery, including assessment of the intertwined membranes to confirm chorionicity (determined by antenatal ultrasound), placental territory, and cord insertions attributable to each twin. Maternal and fetal clinical characteristics were measured within 24 h of delivery. The DCDA-C controls were selected using a 1:2 matching ratio for maternal age and pre-gestational body mass index (BMI).
-
An untargeted metabolic profiling strategy was employed using gas chromatography (GC)-mass spectrometry (MS) to comprehensively capture a broad range of GC-amenable metabolites, without using a predefined analyte list. Neonatal hair samples were collected immediately after delivery by cutting close to the scalp, as recommended by the Society of Hair Testing[10,15]. Hair shaft samples were processed using standard metabolomics procedures. Briefly, accurately weighed hair samples (3.5 ± 0.5 mg) were washed sequentially with distilled water and methanol, and then hydrolyzed with 1 mL of 1 mol/L potassium hydroxide at 54 °C for 18 h after adding three internal standards (20 μL each of D4-alanine, D5-phenylalanine, and D2-tyrosine). The resulting extracts were neutralized with 67 μL of 3 mol/L sulfuric acid, and proteins/salts were precipitated with 1 mL of methanol. After vortexing and centrifugation, 350 μL of the supernatant was concentrated to dryness under vacuum and stored at −20 °C until derivatization. Quality control (QC) samples were prepared by pooling 30-μL aliquots of all hair extracts and processed identically to individual samples.
Derivatization was performed according to previously published methods[16]. Dried extracts were reconstituted in 200 μL of 1 mol/L sodium hydroxide and derivatized using methyl chloroformate. All samples were analyzed in a single batch on an Agilent GC7890 system (Agilent Technologies, Santa Clara, USA) coupled to an MSD5975 mass spectrometer (Agilent Technologies, Santa Clara, USA) equipped with a ZB-1701 capillary column (30 m × 250 μm × 0.15 μm, plus a 5-m guard column; Phenomenex Inc., Torrance, USA). The GC temperature program and MS parameters were set as described in the referenced protocol[16]. Automated Mass Spectral Deconvolution and Identification System software (National Institute of Standards and Technology, Gaithersburg, USA) was used for metabolite deconvolution. Metabolites were identified by matching the mass spectral library (> 90%) built from chemical standards and their respective GC retention times within a 20-s bin. The remaining putative metabolites were identified using the commercial National Institute of Standards and Technology (NIST) mass spectral library (Agilent, Santa Clara, USA). A MassOmics XCMS R-based script was used to extract the relative concentration of each metabolite on the basis of the chromatographic peak height of the most abundant ion mass-to-charge ratio.
To enhance quantitative robustness and minimize instrumental variability, the relative concentration of each identified metabolite was normalized to one of the three deuterated internal standards (D4-alanine, D2-tyrosine, or D5-phenylalanine). For each metabolite, the internal standard that yielded the highest Pearson correlation coefficient across all QC injections was selected for normalization, thereby optimizing the correction of technical drift on a per-metabolite basis. Median centering was then performed to remove batch variation using QC samples (three per batch, with one QC sample inserted at the beginning, middle, and end of each analytical batch; 15 biological samples were injected between consecutive QC samples). Normalized intensities were adjusted to the dried neonatal hair weight of each sample. Blank samples were inserted at the beginning of each batch to evaluate background contamination and carryover effects.
-
Sequential follow-up assessments were conducted at 2–3 and 5–6 years of age. Physical evaluations, including measurements of height and weight, were performed by qualified physicians. The measurements were standardized as z-scores of height-for-age and weight-for-age according to the WHO Anthro program (V.3.2.2)[17,18]. Neurobehavioral development was assessed through phone interviews using the Ages and Stages Questionnaire, Third Edition (ASQ-3), which encompasses five developmental domains: communication, gross motor, fine motor, problem-solving, and personal-social, with a maximum score of 60 for each domain.
-
Raw metabolomic data were preprocessed before downstream analyses. Metabolites with more than 20% missing values across all samples were excluded, and the remaining missing values were imputed using the k-nearest neighbor (KNN) algorithm. Metabolite intensities were then log2-transformed, and z-scores were normalized. Pairwise comparisons were performed using Student's t-test for independent comparisons (DCDA-S vs. DCDA-C; DCDA-L vs. DCDA-C) and a paired t-test for within-pair comparisons (DCDA-L vs. DCDA-S). Metabolites with P < 0.05 were considered differential.
To characterize pathway-level metabolic alterations, we calculated the predicted metabolic pathway activity on the basis of identified metabolites mapped to the Kyoto Encyclopedia of Genes and Genomes (KEGG) pathways. In this study, “predicted” refers to a computationally inferred, pathway-level relative activity estimate derived from metabolite abundance patterns and pathway annotation, rather than a direct experimental measurement of metabolic flux or enzymatic activity[19]. For each sample, pathway activity scores were generated using the MassOmics analysis pipeline based on the relative abundance of the identified metabolites assigned to each KEGG pathway. To visualize group differences, pathway activity changes were expressed as log2 fold changes, calculated between the comparison and reference groups for each pairwise comparison (DCDA-L vs. DCDA-C, DCDA-S vs. DCDA-C, and DCDA-S vs. DCDA-L). Negative values indicated lower predicted pathway activity in the comparison group than in the reference group, whereas positive values indicated higher predicted pathway activity. Binary logistic regression analyses were performed separately for each pairwise comparison to assess the association between the pathway activity and group status. In each model, group status was used as the dependent variable; the activity score of a single pathway was entered as the independent variable; and maternal age and pre-gestational BMI were included as covariates. The Benjamini–Hochberg method was used to control the false discovery rate.
To further visualize biochemical relationships among differential metabolites, metabolic network analysis was performed using Metscape (version 3.1.3), a Cytoscape plug-in that integrates metabolomic data from the KEGG, Human Metabolome Database (HMDB), and Edinburgh Human Metabolic Network (EHMN) databases[20]. Differential metabolites were used as inputs. Metscape maps these metabolites onto compound–reaction–enzyme networks, linking each metabolite to its biochemical neighbors and associated enzymatic reactions within curated metabolic pathways. Metabolites not detected in the current study, but present in the same enzymatic reactions, were retained in the network to provide a pathway context. The networks were visualized using Cytoscape (version 3.9.1).
-
Machine learning models, including artificial neural networks (ANNs), decision trees (DTs), KNN, logistic regression (LR), Naïve Bayes (NB), random forests (RFs), and support vector machines (SVMs), were used to identify metabolic pathways that could classify DCDA-S infants into two groups based on an ASQ score of 30: those with higher personal-social and problem-solving scores (ASQ ≥ 30) and those with lower scores (ASQ < 30). The classification threshold of 30 was empirically derived and cohort-specific[21] as the midpoint of the maximum domain score of 60 because the standard ASQ-3 referral cutoffs vary across age-specific intervals, and directly applying age-varying thresholds would preclude a unified classification model across assessment time points.
After scaling the metabolite and metabolic pathway data using log2 transformation and z-score normalization, the dataset was randomly divided into training and test sets. Recursive feature elimination (RFE) was applied to the combined dataset to identify the most predictive features. For the sensitivity analysis, this multidimensional integration allowed us to evaluate the independent predictive power of metabolic signatures while rigorously accounting for strong clinical confounders, including gestational age at delivery, exact age at evaluation, and growth rate. These selected features were subsequently used to train seven supervised machine learning models within the care framework by using the underlying R packages, including nnet, randomForest, kernlab, stats, naivebayes, kknn, and C50 (Supplementary Table S1)[22-26]. To prevent overfitting and ensure robust performance, given the limited sample size, we used a repeated 3-fold cross-validation strategy (10 repeats) integrated with random oversampling examples (ROSE). In addition, a permutation test with 1,000 iterations was performed to compute the empirical P-value for the top-performing models. Model performance was assessed using the area under the receiver operating characteristic (AUC) curve supplemented by the numbers of true positives (TP), true negatives (TN), false positives (FP), and false negatives (FN). The parameters were defined as follows:
$${\text{{Accuracy\;=\;(TP+TN)/(TP+FP+TN+FN);}}} $$ $$ {\text{{Sensitivity\;=\;TP/(TP+FN);}}} $$ $$ {\text{{Specificity\;=\;TN/(TN+FP);}}} $$ The F1 score was also calculated as described previously[27].
-
For clinical characteristics and neonatal outcomes, data distribution was assessed using the Shapiro–Wilk test. For within-pair comparisons between DCDA-S and DCDA-L neonates, paired Student’s t-tests were used for normally distributed continuous variables, and Wilcoxon signed-rank tests were used for non-normally distributed variables. For comparisons between the DCDA-C group and either the DCDA-S or DCDA-L groups, Welch’s t-tests were used for normally distributed continuous variables and Wilcoxon rank-sum tests for non-normally distributed variables. Categorical variables were compared using the chi-squared test or Fisher’s exact test, as appropriate.
The distributions of the ASQ-3 score intervals across the groups were summarized descriptively. Pearson correlation coefficients were calculated between the pathway activity scores and ASQ-3 domain scores to evaluate the relationship between early-life metabolic pathway alterations and later neurodevelopment. Unless otherwise specified, all tests were two-sided, and a P-value < 0.05 was considered statistically significant. All statistical analyses were performed using R software (version 4.2.0).
-
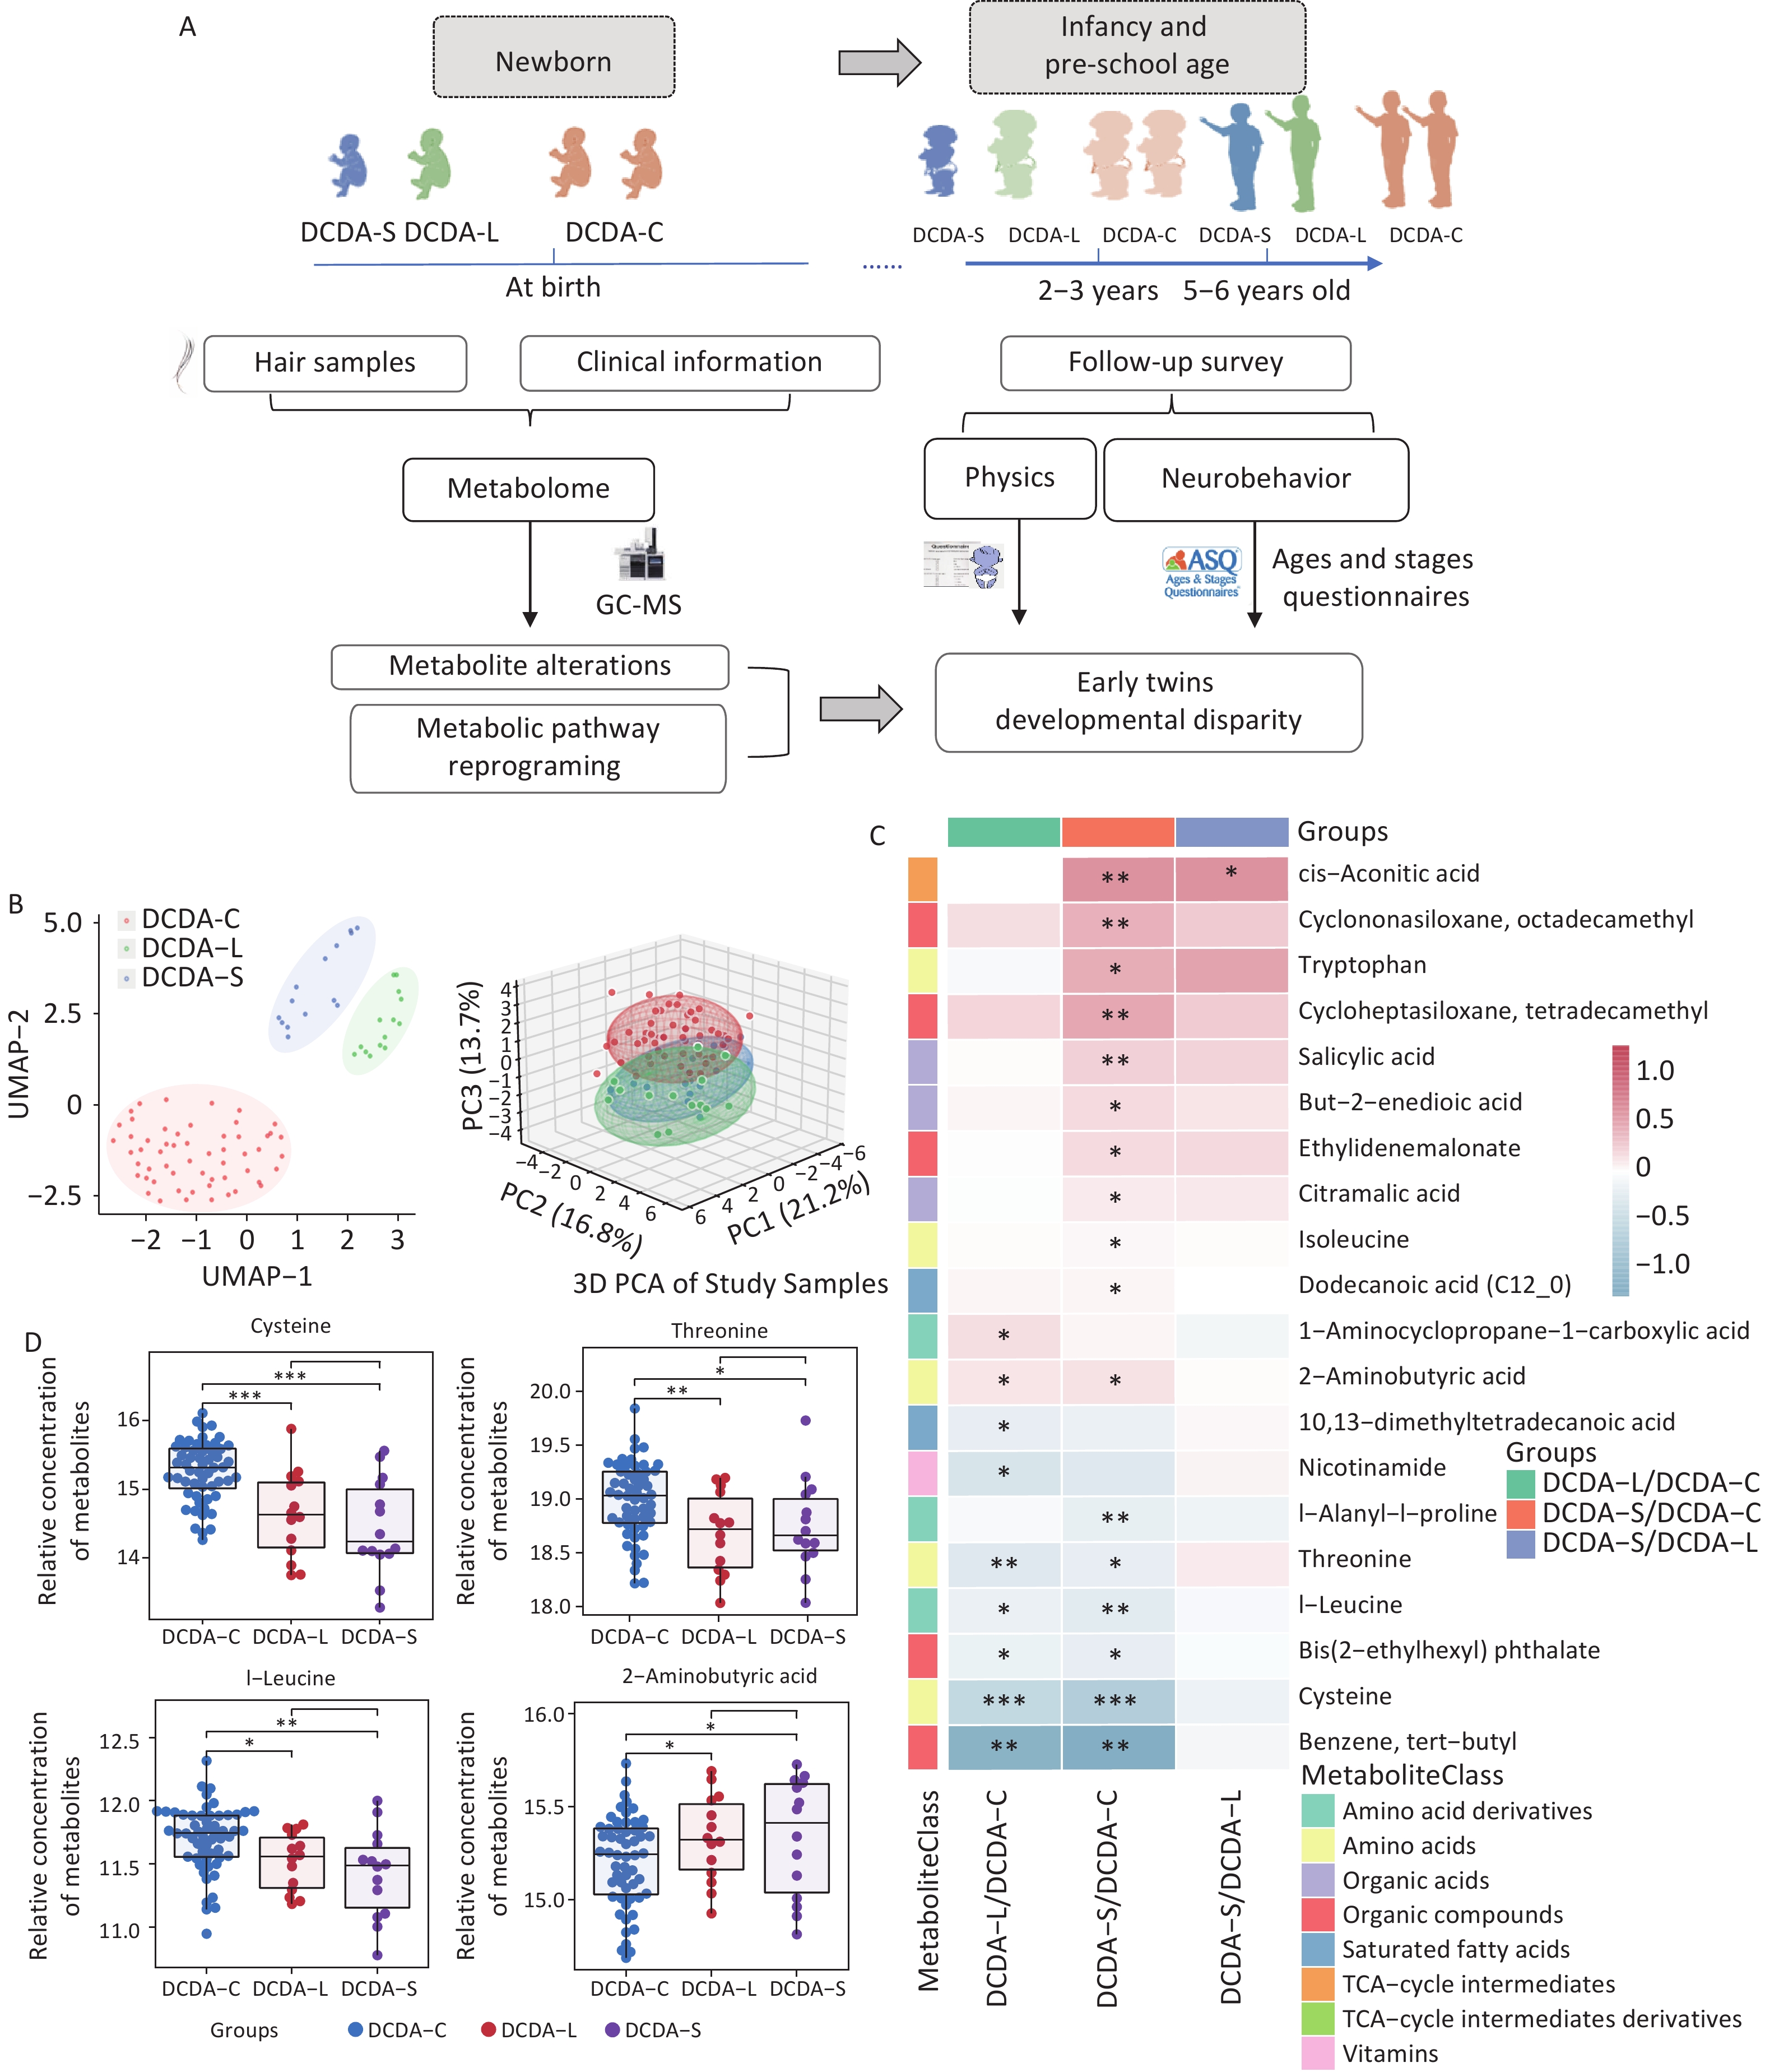
A total of 201 DCDA twin pregnancies at 14–28 weeks of gestation were recruited. After applying the exclusion criteria, we enrolled 14 sFGR-DCDA pairs and selected 28 DCDA-C pairs from the 60 eligible pairs by using a 1:2 matching ratio, matched for maternal age and pre-gestational BMI. To evaluate the metabolic perturbations in sFGR-DCDA twins, we performed the following three comparisons: DCDA-L and DCDA-S neonates versus control twins (DCDA-C), and DCDA-S vs. DCDA-L within-pair analysis. GC-MS metabolomic analysis of neonatal hair and clinical data from sFGR-DCDA and DCDA-C twins were integrated with neurodevelopmental follow-up assessments at 2–3 and 5–6 years of age, linking metabolic pathway alterations to early neurobehavioral outcomes (Figure 1A).
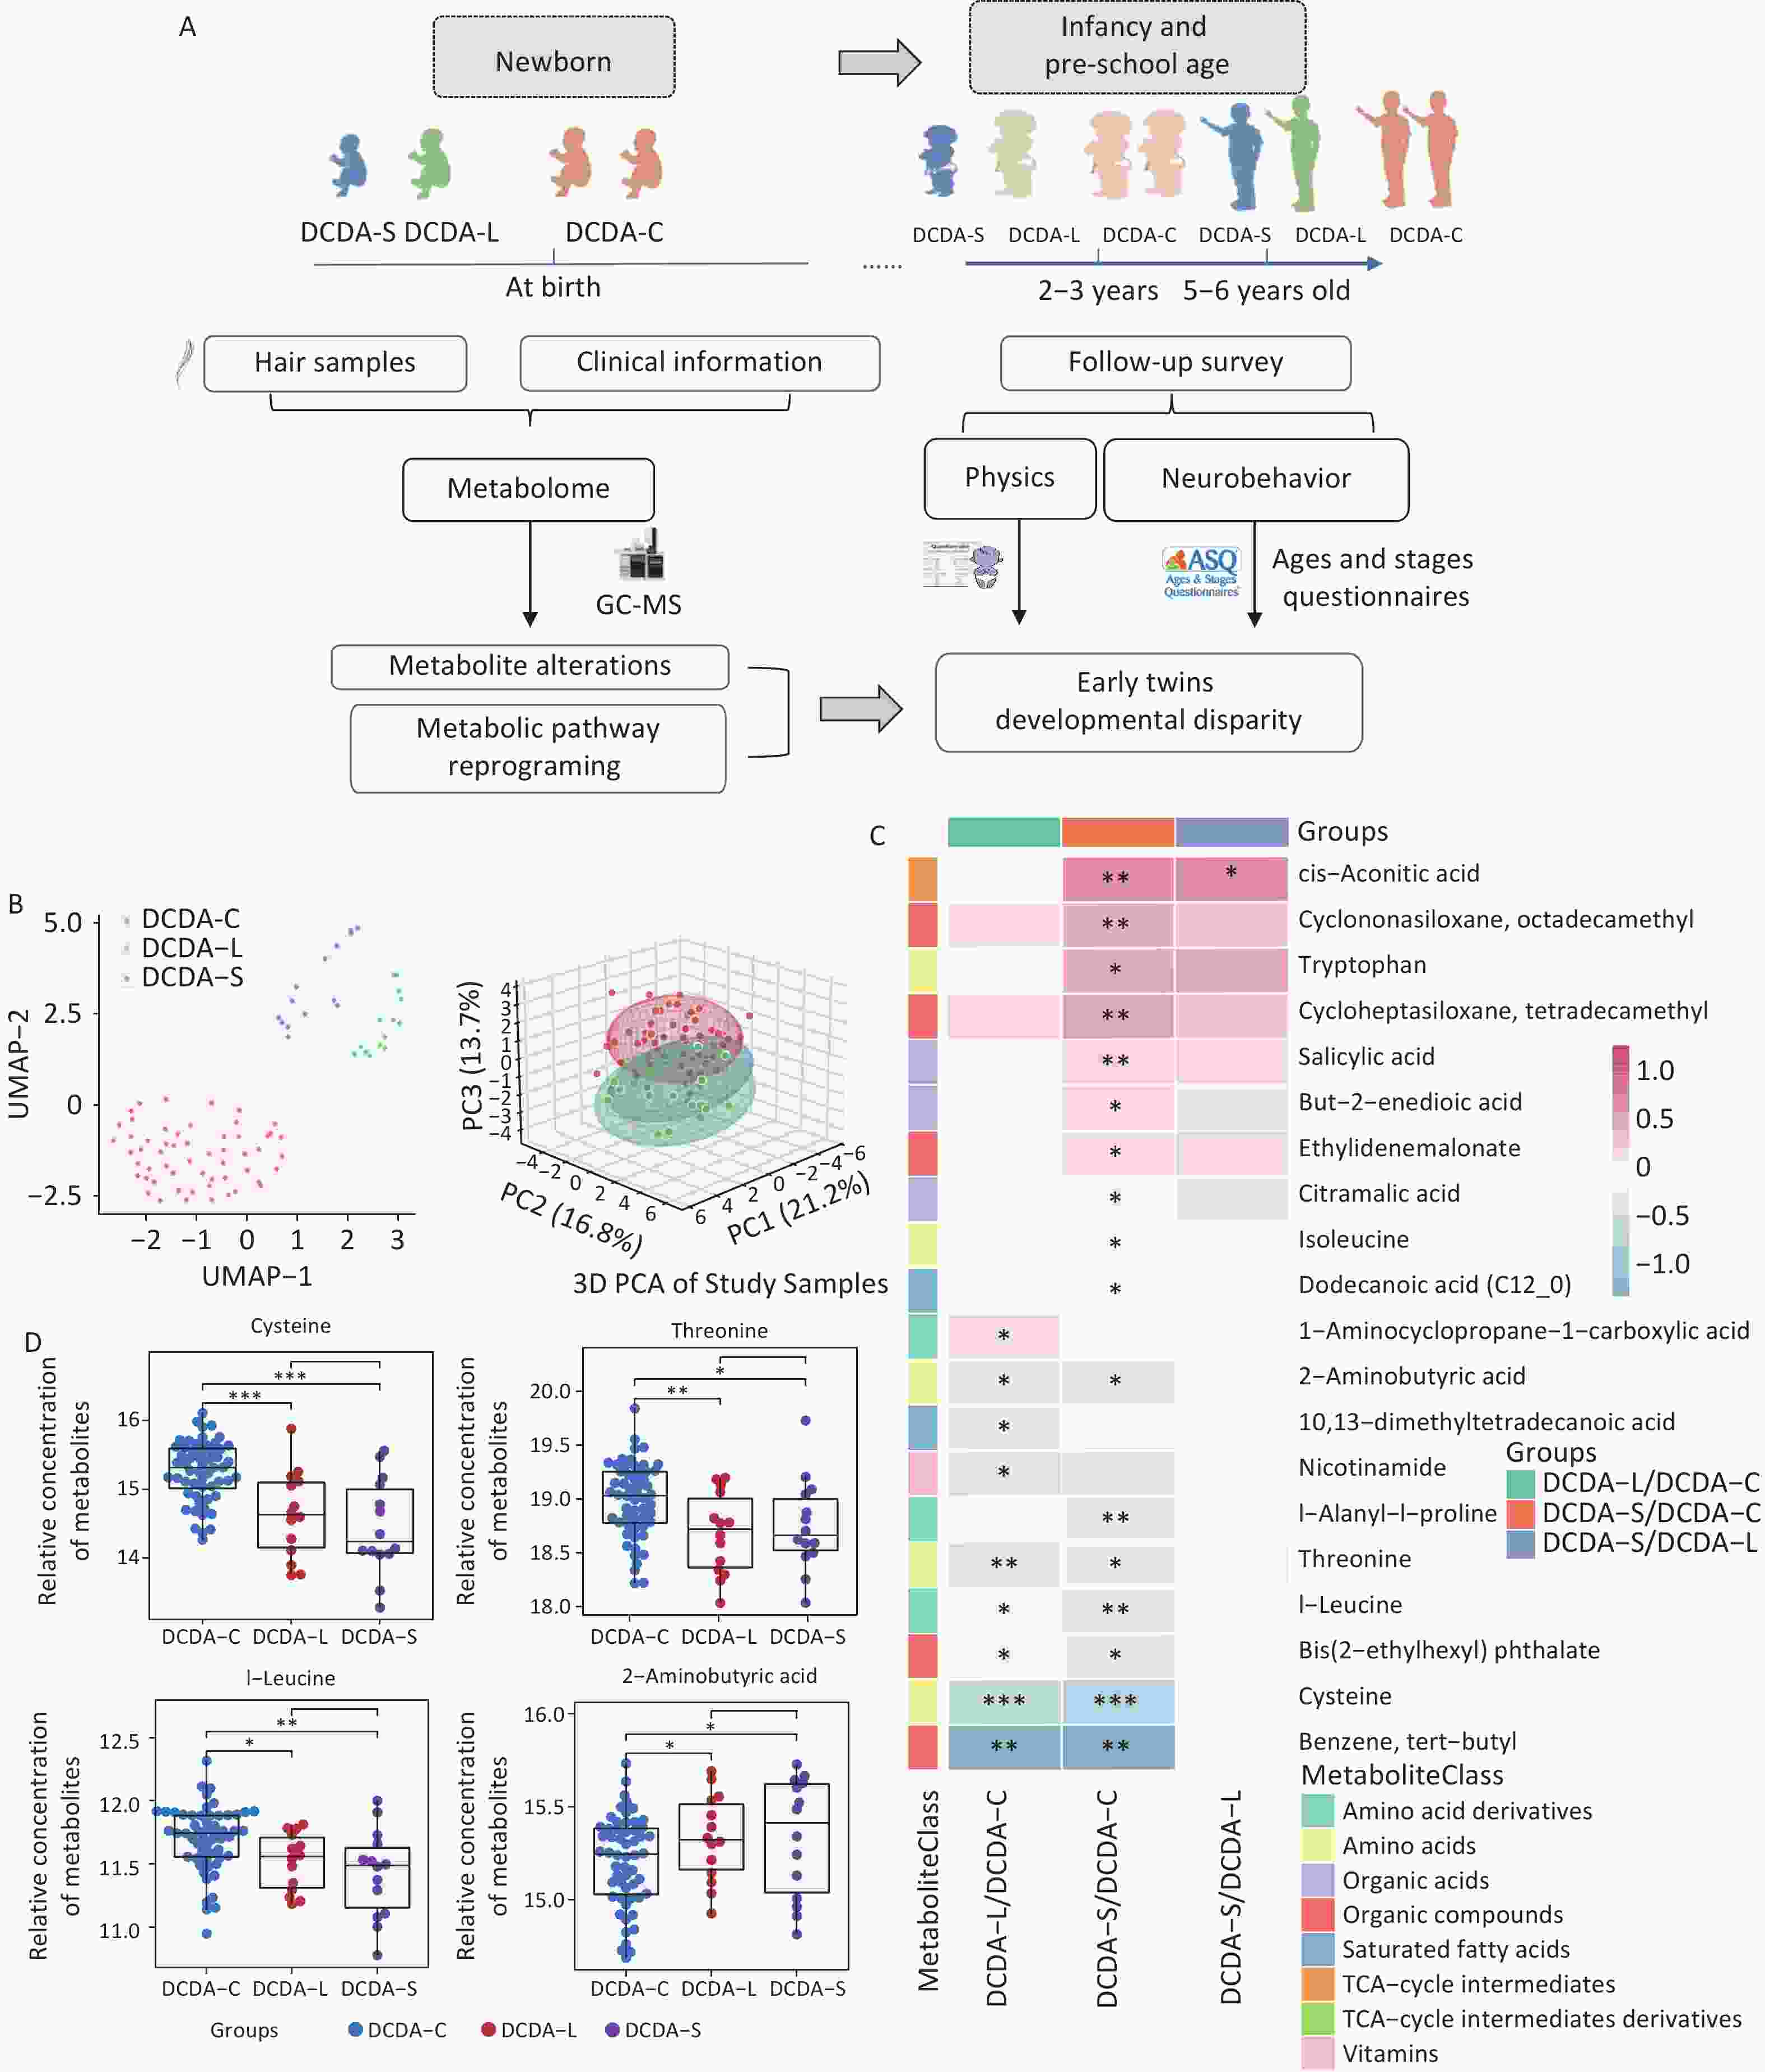
Figure 1. Study flowchart and distinct hair metabolomes of birthweight discordant twins. A) Longitudinal study flowchart from birth to early childhood. B) Uniform manifold approximation and projection (UMAP, left) and three-dimensional principal component analysis (3D PCA, right) of hair samples using 136 measured metabolites shows three distinct clusters of DCDA twins. C) Heatmap summary showing significant differences in sFGR-DCDA twins relative to DCDA-C twins. The relative concentrations of hair metabolites are shown using log2 values (foldchange). Red represents higher metabolite levels in dividend groups than in the divisor groups, whereas blue represents lower levels. Only metabolites with P-values less than 0.05 (Student's t-test for DCDA-S vs. DCDA-C and DCDA-L vs. DCDA-C; paired t-test for DCDA-L vs. DCDA-S) are marked. D) Predicted metabolic pathway activity. DCDA, dichorionic-diamniotic; C, control; L, larger twin; S, smaller twin; sFGR, selective fetal growth restriction.
Demographic details of the study population are presented in Table 1. Overall, the two groups showed no significant differences in terms of maternal age, pre-gestational maternal BMI, weight gain during pregnancy, primigravida status, or method of conception. The gestational age at delivery in sFGR-DCDA pregnancies was approximately one week earlier than that in DCDA-C pregnancies. The postnatal outcomes of the DCDA-C and sFGR-DCDA twins are summarized in Table 2. Among the sFGR-DCDA co-twin pairs, the DCDA-S neonates had significantly lower BW, abdominal circumference, head circumference, and body length (height) than the corresponding DCDA-L neonates, whereas the Apgar scores and umbilical cord blood pH did not differ. In comparison with the DCDA-C twins, the DCDA-S neonates likewise showed markedly reduced BW and anthropometric indices (abdominal circumference, head circumference, and height), while the DCDA-L neonates were generally comparable to the DCDA-C twins in BW and abdominal circumference but showed significantly higher head circumference and height.
Maternal characteristics DCDA-C group (n = 28) sFGR-DCDA group (n = 14) P-value Maternal age (years) 33 ± 4.14 35 ± 3.93 0.11a Pre-gestational body mass index (kg/m2) 21.1 (19.8, 22.6) 22.5 (20.7, 25.4) 0.08b Weight gain during pregnancy (kg) 17.8 ± 4.77 14.5 ± 5.36 0.063a Primigravida 0.33c Yes 21 (75%) 13 (92.86%) No 7 (25%) 1 (7.14%) Gestational age at delivery (weeks) 37 (37, 37) 36 (35.25, 36) 0.003b** IVF-ET/Natural conception 0.43d IVF-ET 24 (85.71%) 14 (100%) Natural conception 4 (14.29%) 0 (0%) Note. Data are presented as mean ± standard deviation or median [interquartile range, IQR] for continuous variables, or as number (percentage) for categorical variables. aStudent’s t-test. bMann-Whitney U test. CChi-square test. dFisher’s exact test. **P < 0.01. IVF-ET, in vitro fertilization and embryo transfer; DCDA, dichorionic diamniotic; sFGR, selective fetal growth restriction; C, control. Table 1. Comparison of the clinical characteristics of DCDA-C and sFGR-DCDA groups
Neonatal outcomes DCDA-C
(n = 28) aDCDA-L
(n = 14) bDCDA-S
(n = 14) cP-value
a vs. bP-value
a vs. cP-value
b vs. cBirth Weight (g) 2701.96 ± 259.88 2785.71 ± 325.17 1982.14 ± 362.47 0.3831 < 0.0001*** < 0.0001*** Apgar score at 1 min 9.96 ± 0.19 9.57 ± 0.76 9.93 ± 0.27 0.0751 0.6433 0.0548 Apgar score at 5 min 10.00 ± 0.00 9.86 ± 0.36 10.00 ± 0.00 0.1648 > 0.99999 0.1648 AC (cm) 31.93 ± 1.19 32.21 ± 1.58 28.93 ± 2.62 0.5345 0.0009*** 0.0001*** HC (cm) 33.41 ± 1.14 34.14 ± 0.86 31.07 ± 1.73 0.0138* 0.0002*** < 0.0001*** Height (cm) 46.75 ± 1.62 48.14 ± 1.56 44.07 ± 3.79 0.0076** 0.0214* 0.0007*** pH in cord blood 7.35 ± 0.03 7.35 ± 0.05 7.34 ± 0.03 0.9518 0.1739 0.2988 Note. Data are presented as mean ± standard deviation. Welch's independent t-test: a vs. b and a vs. c; paired t-test: b vs. c. *P < 0.05, **P < 0.01, ***P < 0.001. AC, abdominal circumference; HC, head circumference; DCDA, dichorionic diamniotic; sFGR, selective fetal growth restriction; C, control; L, larger one; S, smaller one. Table 2. Comparison of postnatal outcomes in the DCDA-C and sFGR-DCDA twins
-
After metabolite identification and preprocessing, 136 measured metabolites were included in the downstream metabolomic analysis. Uniform manifold approximation and projection (UMAP) of the neonates’ hair samples demonstrated distinct global metabolomic separation among the DCDA-C, DCDA-S, and DCDA-L neonates (Figure 1B). The DCDA-S and DCDA-L co-twins clustered more closely, whereas the DCDA-C twins formed a distinct cluster.
In comparison with the DCDA-C twins, the DCDA-S neonates had 17 differential hair metabolites (Student's t-test, P < 0.05), whereas the DCDA-L neonates had nine differential metabolites (P < 0.05) (Figure 1C). A single metabolite, cis-aconitic acid, was present at higher levels in the DCDA-L neonates than in the DCDA-S neonates (Figure 1C). To identify the shared metabolic changes in the sFGR-DCDA co-twins and DCDA-C twins, six common differential metabolites were identified. After excluding two exogenous compounds (benzene tert-butyl and bis (2-ethylhexyl) phthalate), which are environmental contaminants rather than endogenous metabolites, four common differential metabolites were identified: cysteine, l-leucine, 2-aminobutyric acid, and threonine (Figure 1D). Four metabolites (cysteine, l-leucine, threonine, and 2-aminobutyric acid) were consistently altered in both DCDA-S and DCDA-L neonates than in the DCDA-C twins, with cysteine, threonine, and leucine showing lower concentrations and 2-aminobutyric acid showing higher concentrations in the sFGR-DCDA groups.
-
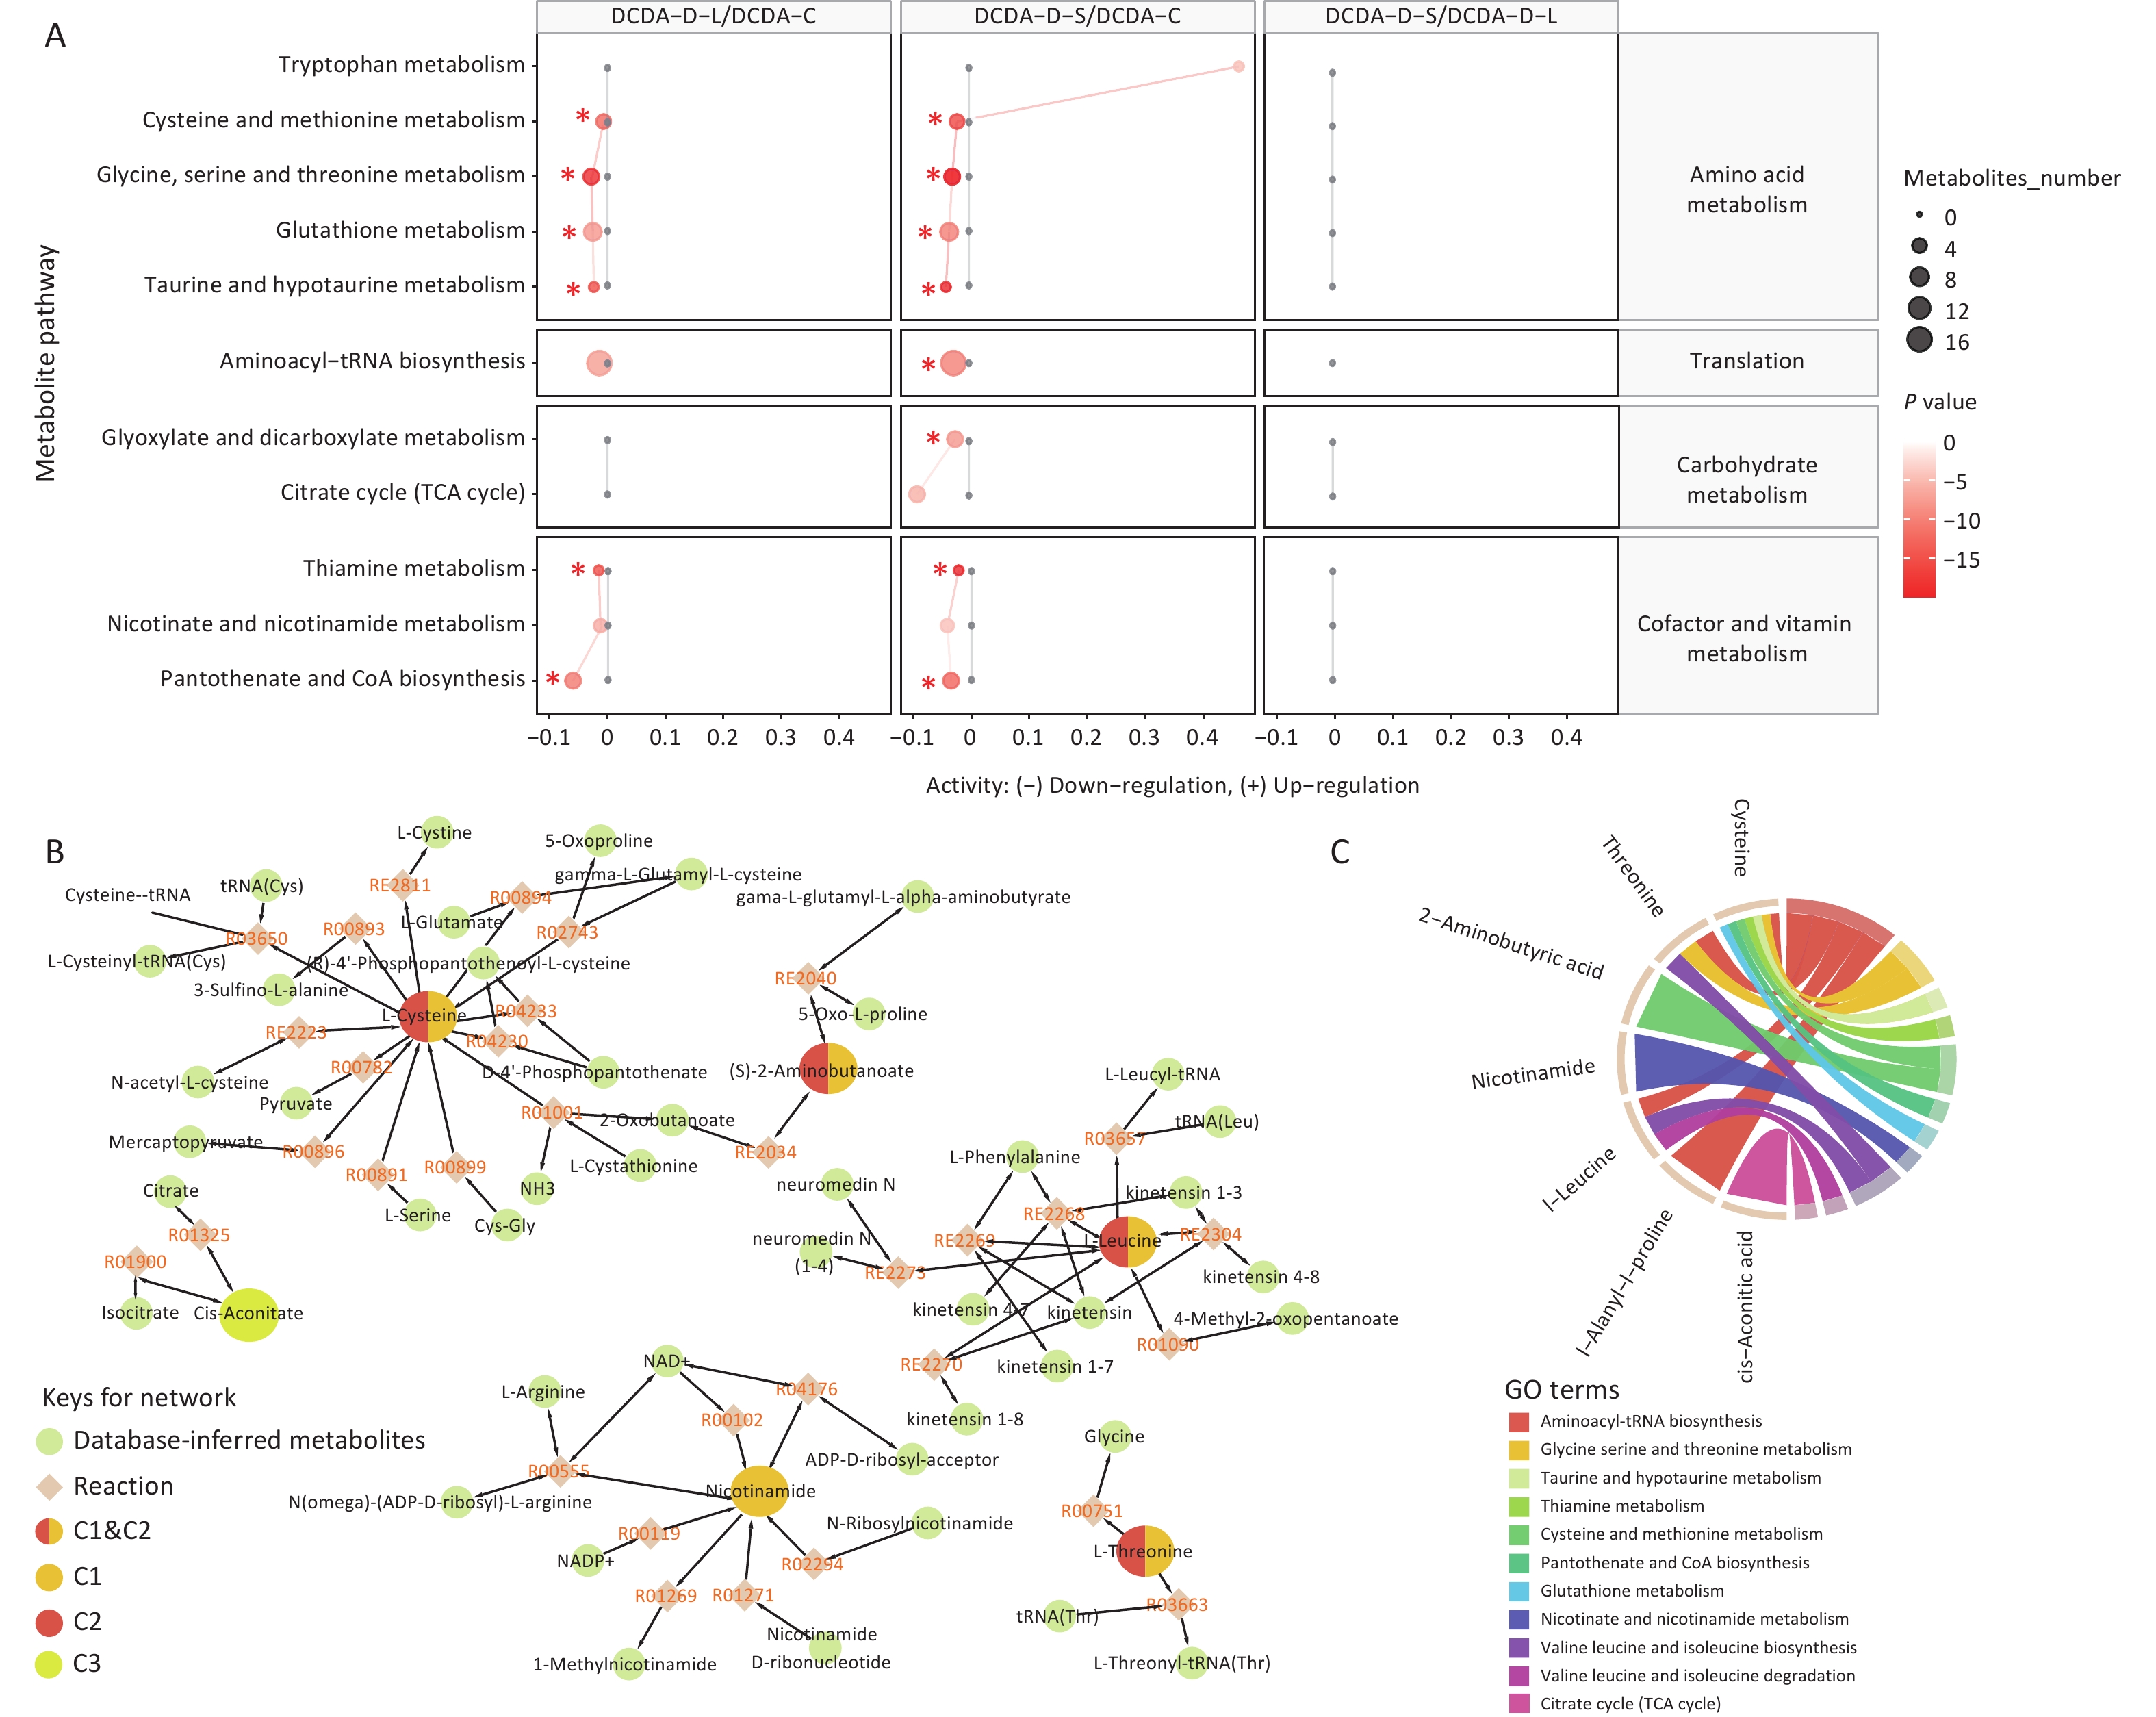
To interpret these differential metabolites, we performed a pathway enrichment analysis. The majority of metabolic pathways in amino acid, translation, and cofactor/vitamin metabolism showed lower predicted pathway activity in the DCDA-L and DCDA-S neonates than in the DCDA-C twins (Figure 2A). These included cysteine and methionine metabolism; glutathione metabolism; glycine, serine, and threonine metabolism; taurine and hypotaurine metabolism; one translation pathway (aminoacyl-tRNA biosynthesis); and three cofactor/vitamin metabolism pathways (nicotinate and nicotinamide metabolism, pantothenate and CoA biosynthesis, and thiamine metabolism). Notably, two pathways associated with carbohydrate metabolism were specifically downregulated in the DCDA-S neonates than in the DCDA-C twins (Figure 2A). However, no significant metabolic pathway differences were detected between the DCDA-S and DCDA-L neonates. Shared differential metabolites (cysteine, leucine, threonine, and 2-aminobutyric acid) mapped to these altered pathways were used to reconstruct an in silico metabolic network (Figure 2B). The network revealed that cysteine, leucine, and threonine were directly linked to their corresponding aminoacyl-tRNA intermediates. Cysteine was the most interconnected metabolite and participated in seven significant pathways, including glutathione metabolism, cofactor and vitamin metabolism, and four amino acid metabolism pathways (Figure 2C).
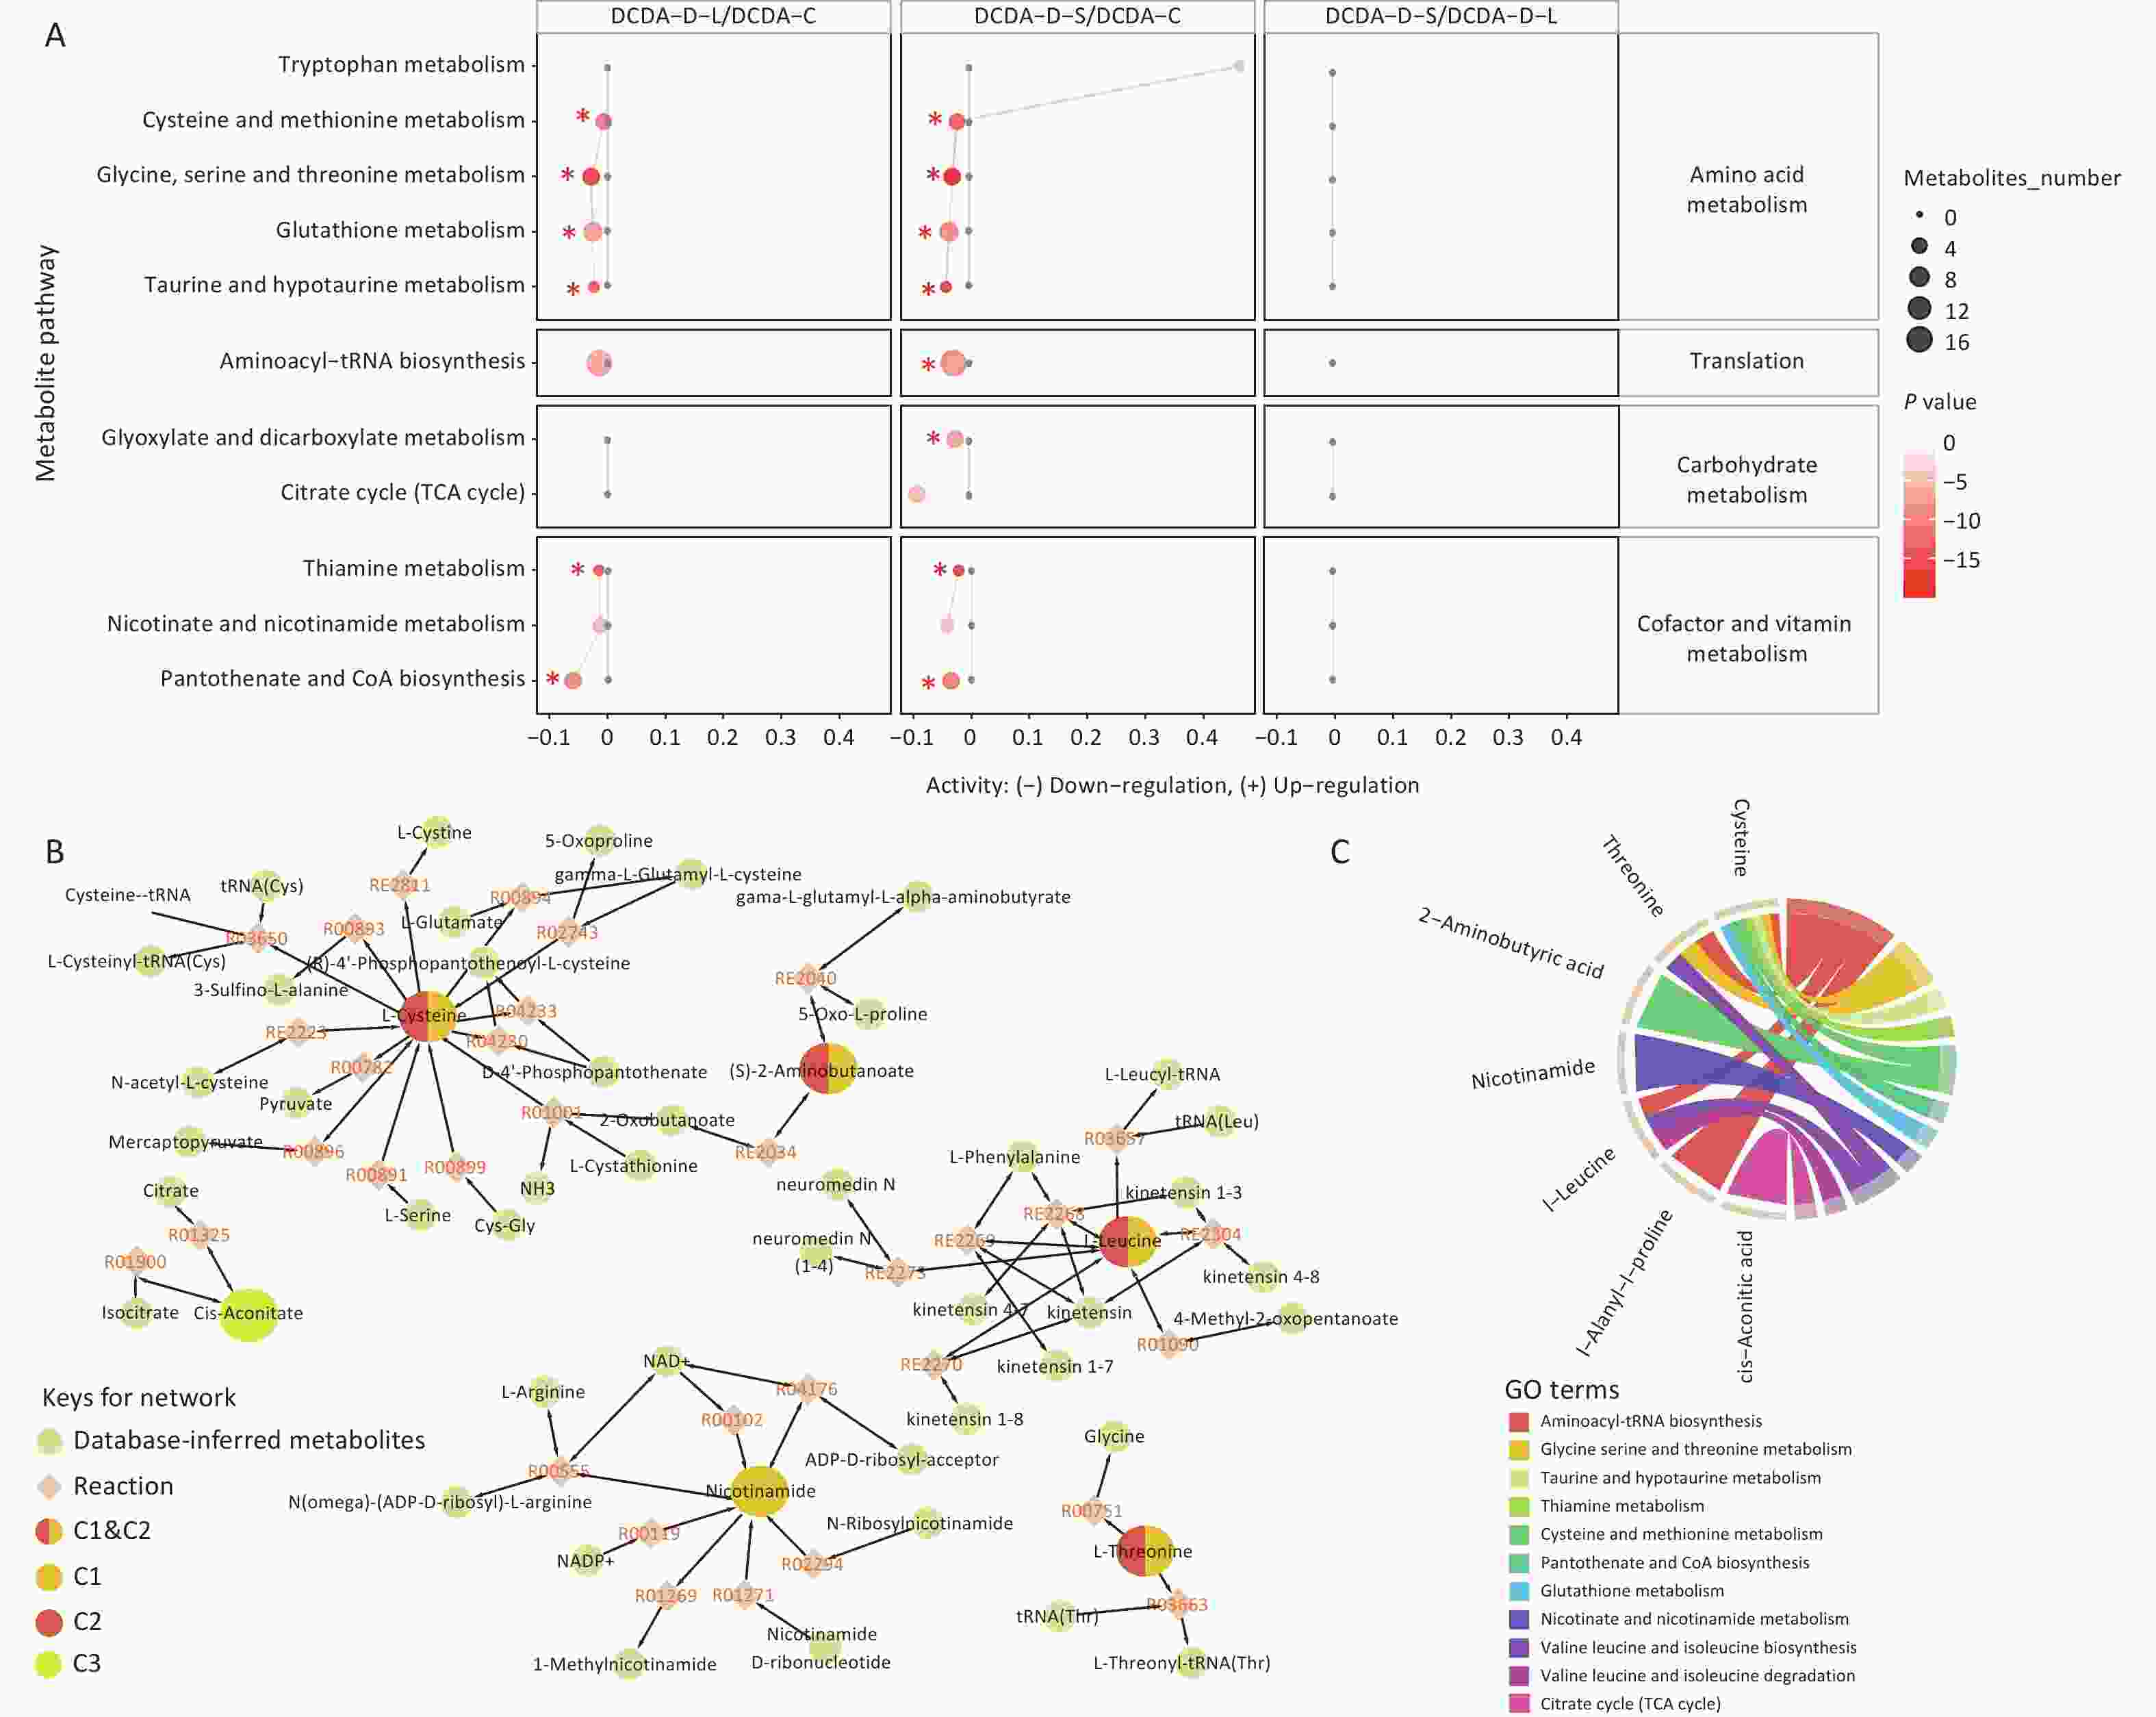
Figure 2. Metabolic pathway enrichment and network analysis of neonatal hair in sFGR-DCDA twins. A) The predicted metabolic pathway activity in the hair associated with sFGR-DCDA twins and DCDA-C twins was illustrated using log2 (fold change) values. Each column represents a pairwise comparison: DCDA-L vs. DCDA-C, DCDA-S vs. DCDA-C, and DCDA-S vs. DCDA-L. The red dot sizes represent the enrichment ratios of the pathways computed by metabolite hits. Only metabolic pathways with significant P-values less than 0.05 (Logistic regression) were plotted. The pathways with significant P-values less than 0.05 and q-values less than 0.05 (false discovery rate) were marked with red asterisks. B) The two-dimensional network was constructed using the metabolic pathways that differed significantly between the sFGR-DCDA and DCDA-C twins. The orange circles indicate significantly different metabolites between the DCDA-L neonates and DCDA-C twins, which were abbreviated as C1. The red circles are metabolites that were significantly different between the DCDA-S neonates and DCDA-C twins, and are abbreviated as C2. The yellow circles are metabolites that were significantly different between the DCDA-S and DCDA-L twins, and are abbreviated as C3. All green circles are metabolites not detected in the current study but mapped to the same metabolic reactions in the KEGG/HMDB databases. The arrowheads indicate the direction of the metabolic reactions. C) A chord plot shows the participation of metabolites with P < 0.05 in the metabolic pathways showing significant differences. C, control; DCDA, dichorionic-diamniotic; HMDB, Human Metabolome Database; KEGG, Kyoto Encyclopedia of Genes and Genomes; L, Larger twin; S, smaller twin; sFGR, selective fetal growth restriction.
-
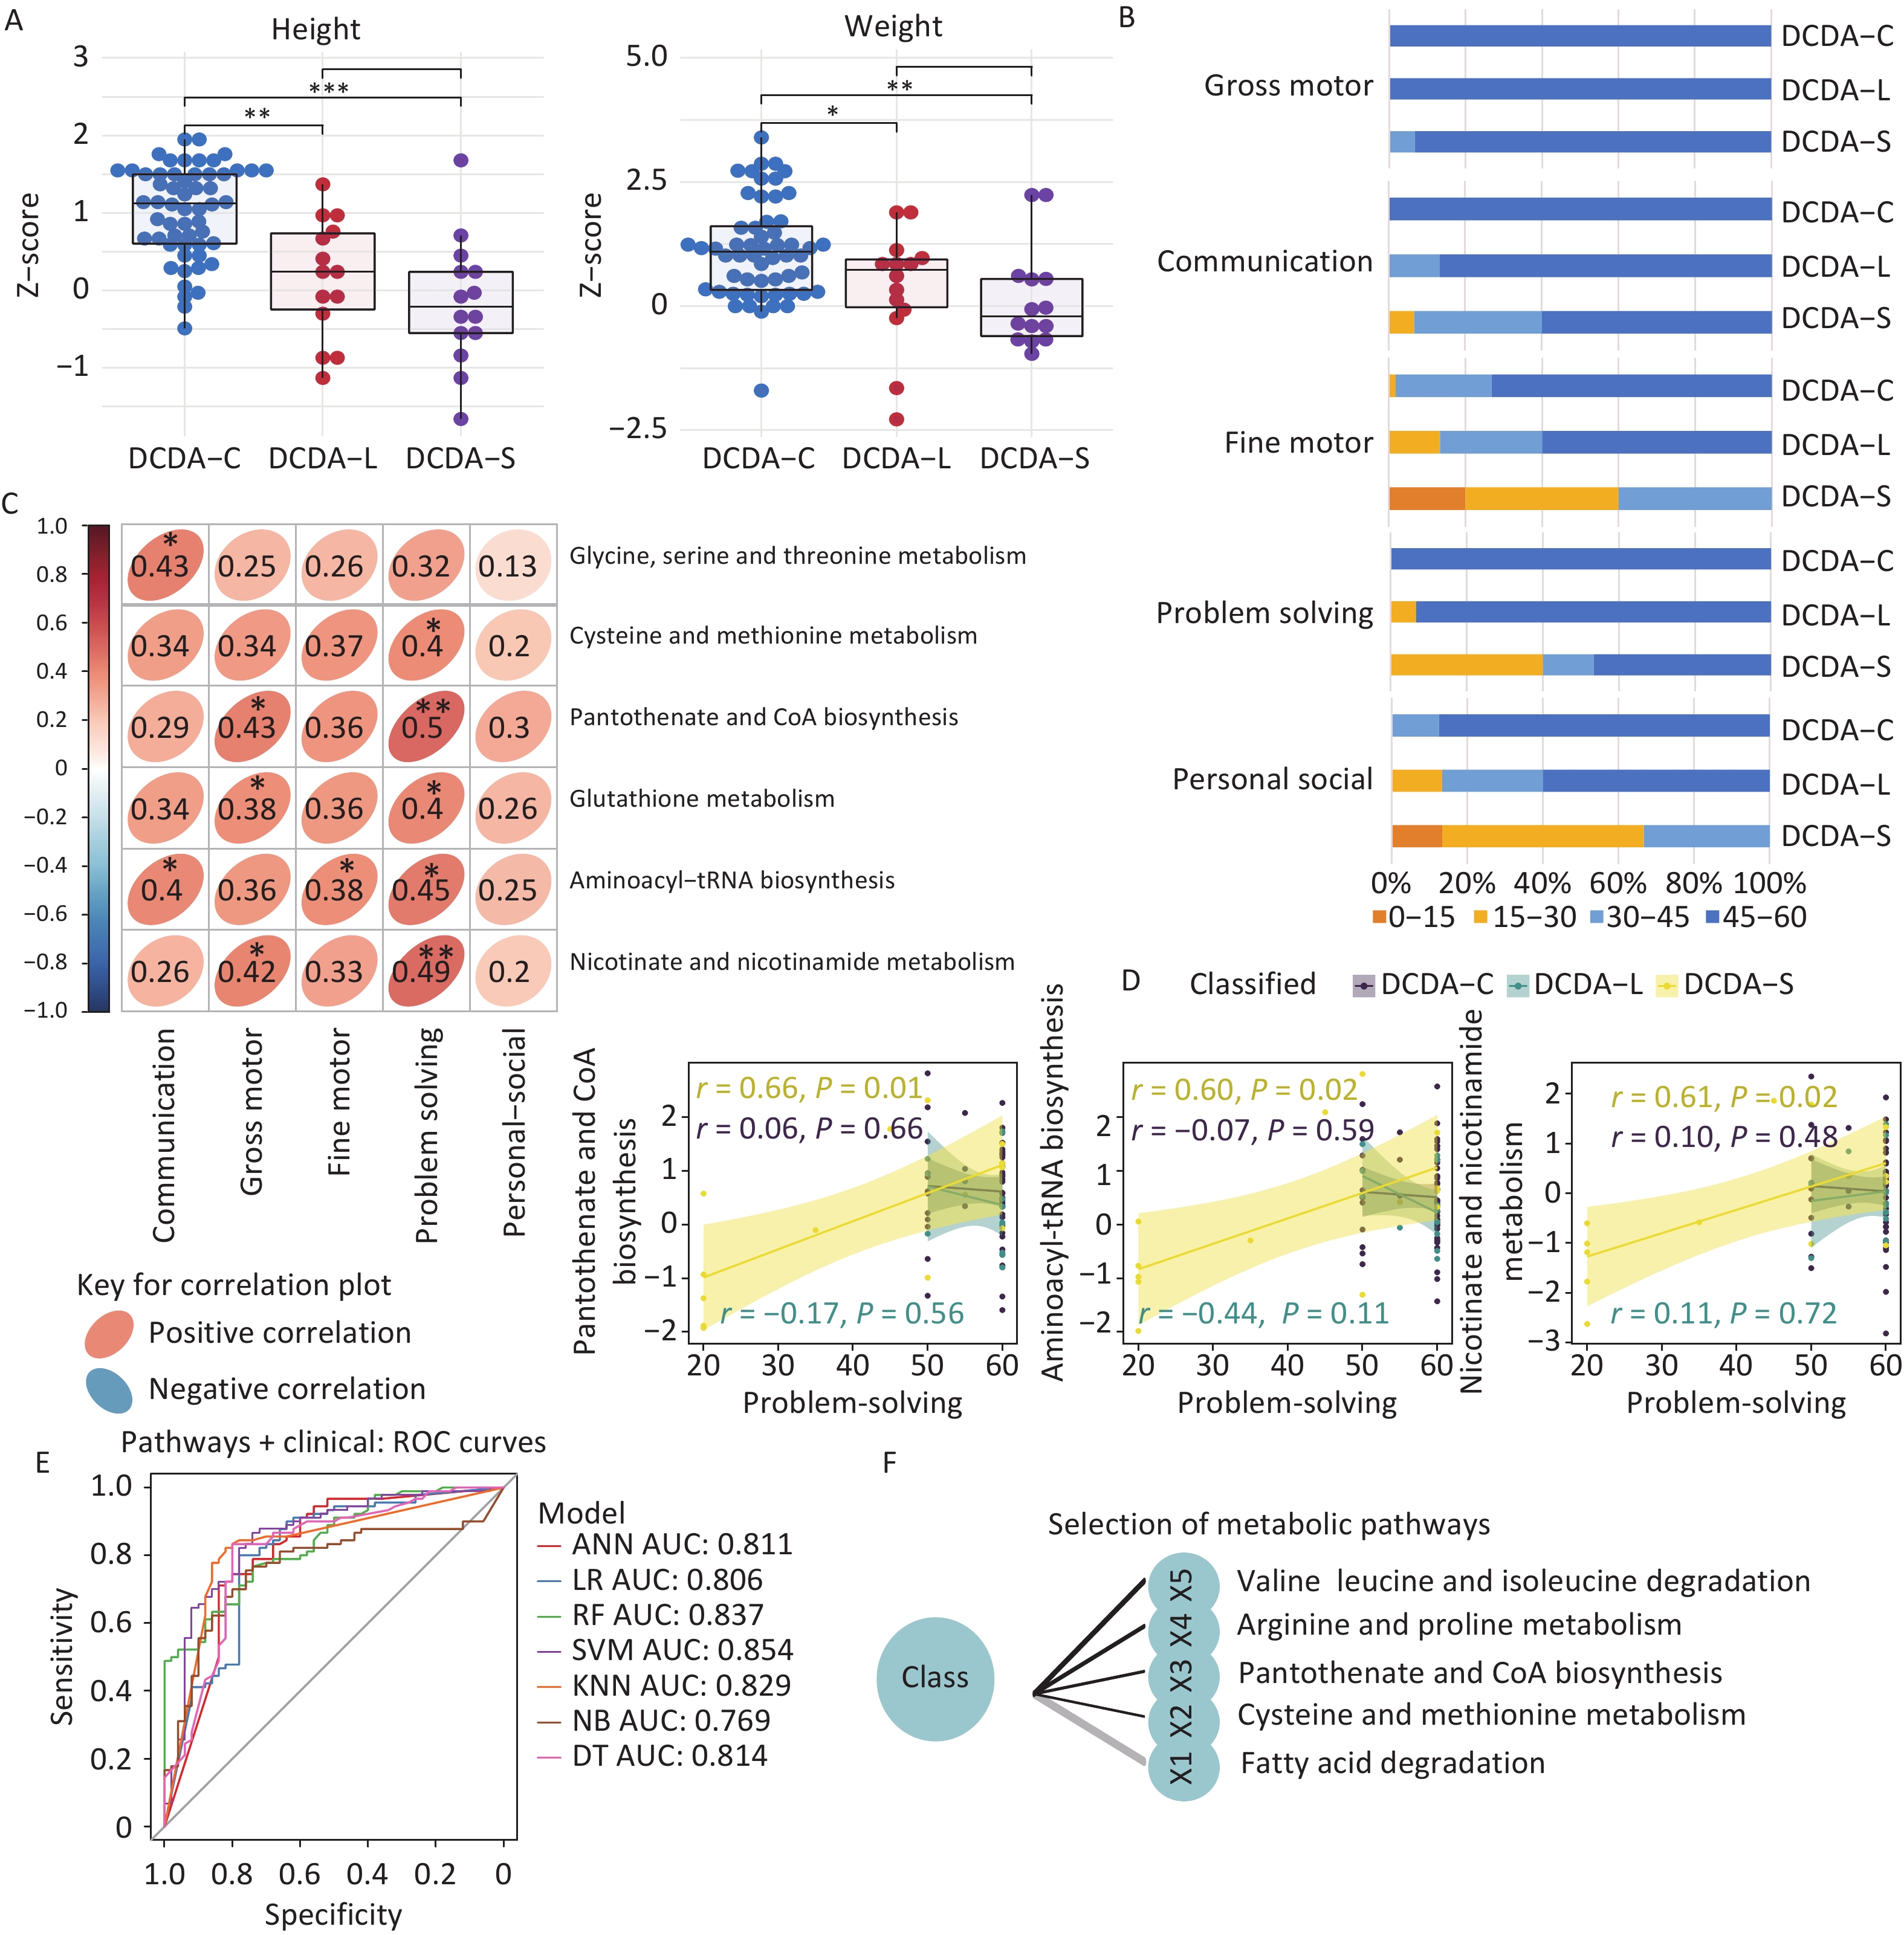
Both the height and weight of children in the DCDA-L and DCDA-S groups were significantly lower than those in the DCDA-C group (Figure 3A). The ASQ-3 subscale encompasses five developmental domains: communication, fine motor, gross motor, problem-solving, and personal-social, with a maximum score of 60 for each domain. We subdivided the maximum score of 60 for each domain of the ASQ-3 into four equal intervals and assessed neurocognitive development by comparing the frequency of low scores (< 30) in each domain between the groups (Figure 3B). Both the DCDA-L and DCDA-S groups showed higher frequencies of low scores (< 30) in the fine motor, problem-solving, and personal-social domains than the DCDA-C group. Notably, the DCDA-S group showed much higher frequencies of lower scores (< 15) in the fine motor and personal-social domains than the DCDA-L and DCDA-C groups (Figure 3B). To further examine whether altered early-life metabolic activity was associated with later neurocognitive development, we performed correlation analyses between the pathway activity score of neonatal hair samples and the ASQ-3 domain scores at 2–3 years of age in sFGR-DCDA twins. Positive correlations were observed between the problem-solving domain and five metabolic pathways, including cysteine and methionine metabolism, aminoacyl-tRNA biosynthesis, glutathione metabolism, nicotinate and nicotinamide metabolism, and pantothenate and coenzyme A (CoA) biosynthesis, in sFGR-DCDA twins (P < 0.05) (Figure 3C). In the DCDA-S group, problem-solving skills were associated with pantothenate and CoA biosynthesis, aminoacyl-tRNA biosynthesis, and the nicotinate and nicotinamide metabolic pathways at ages 2–3, with r ≥ 0.6 (P < 0.05) (Figure 3D).
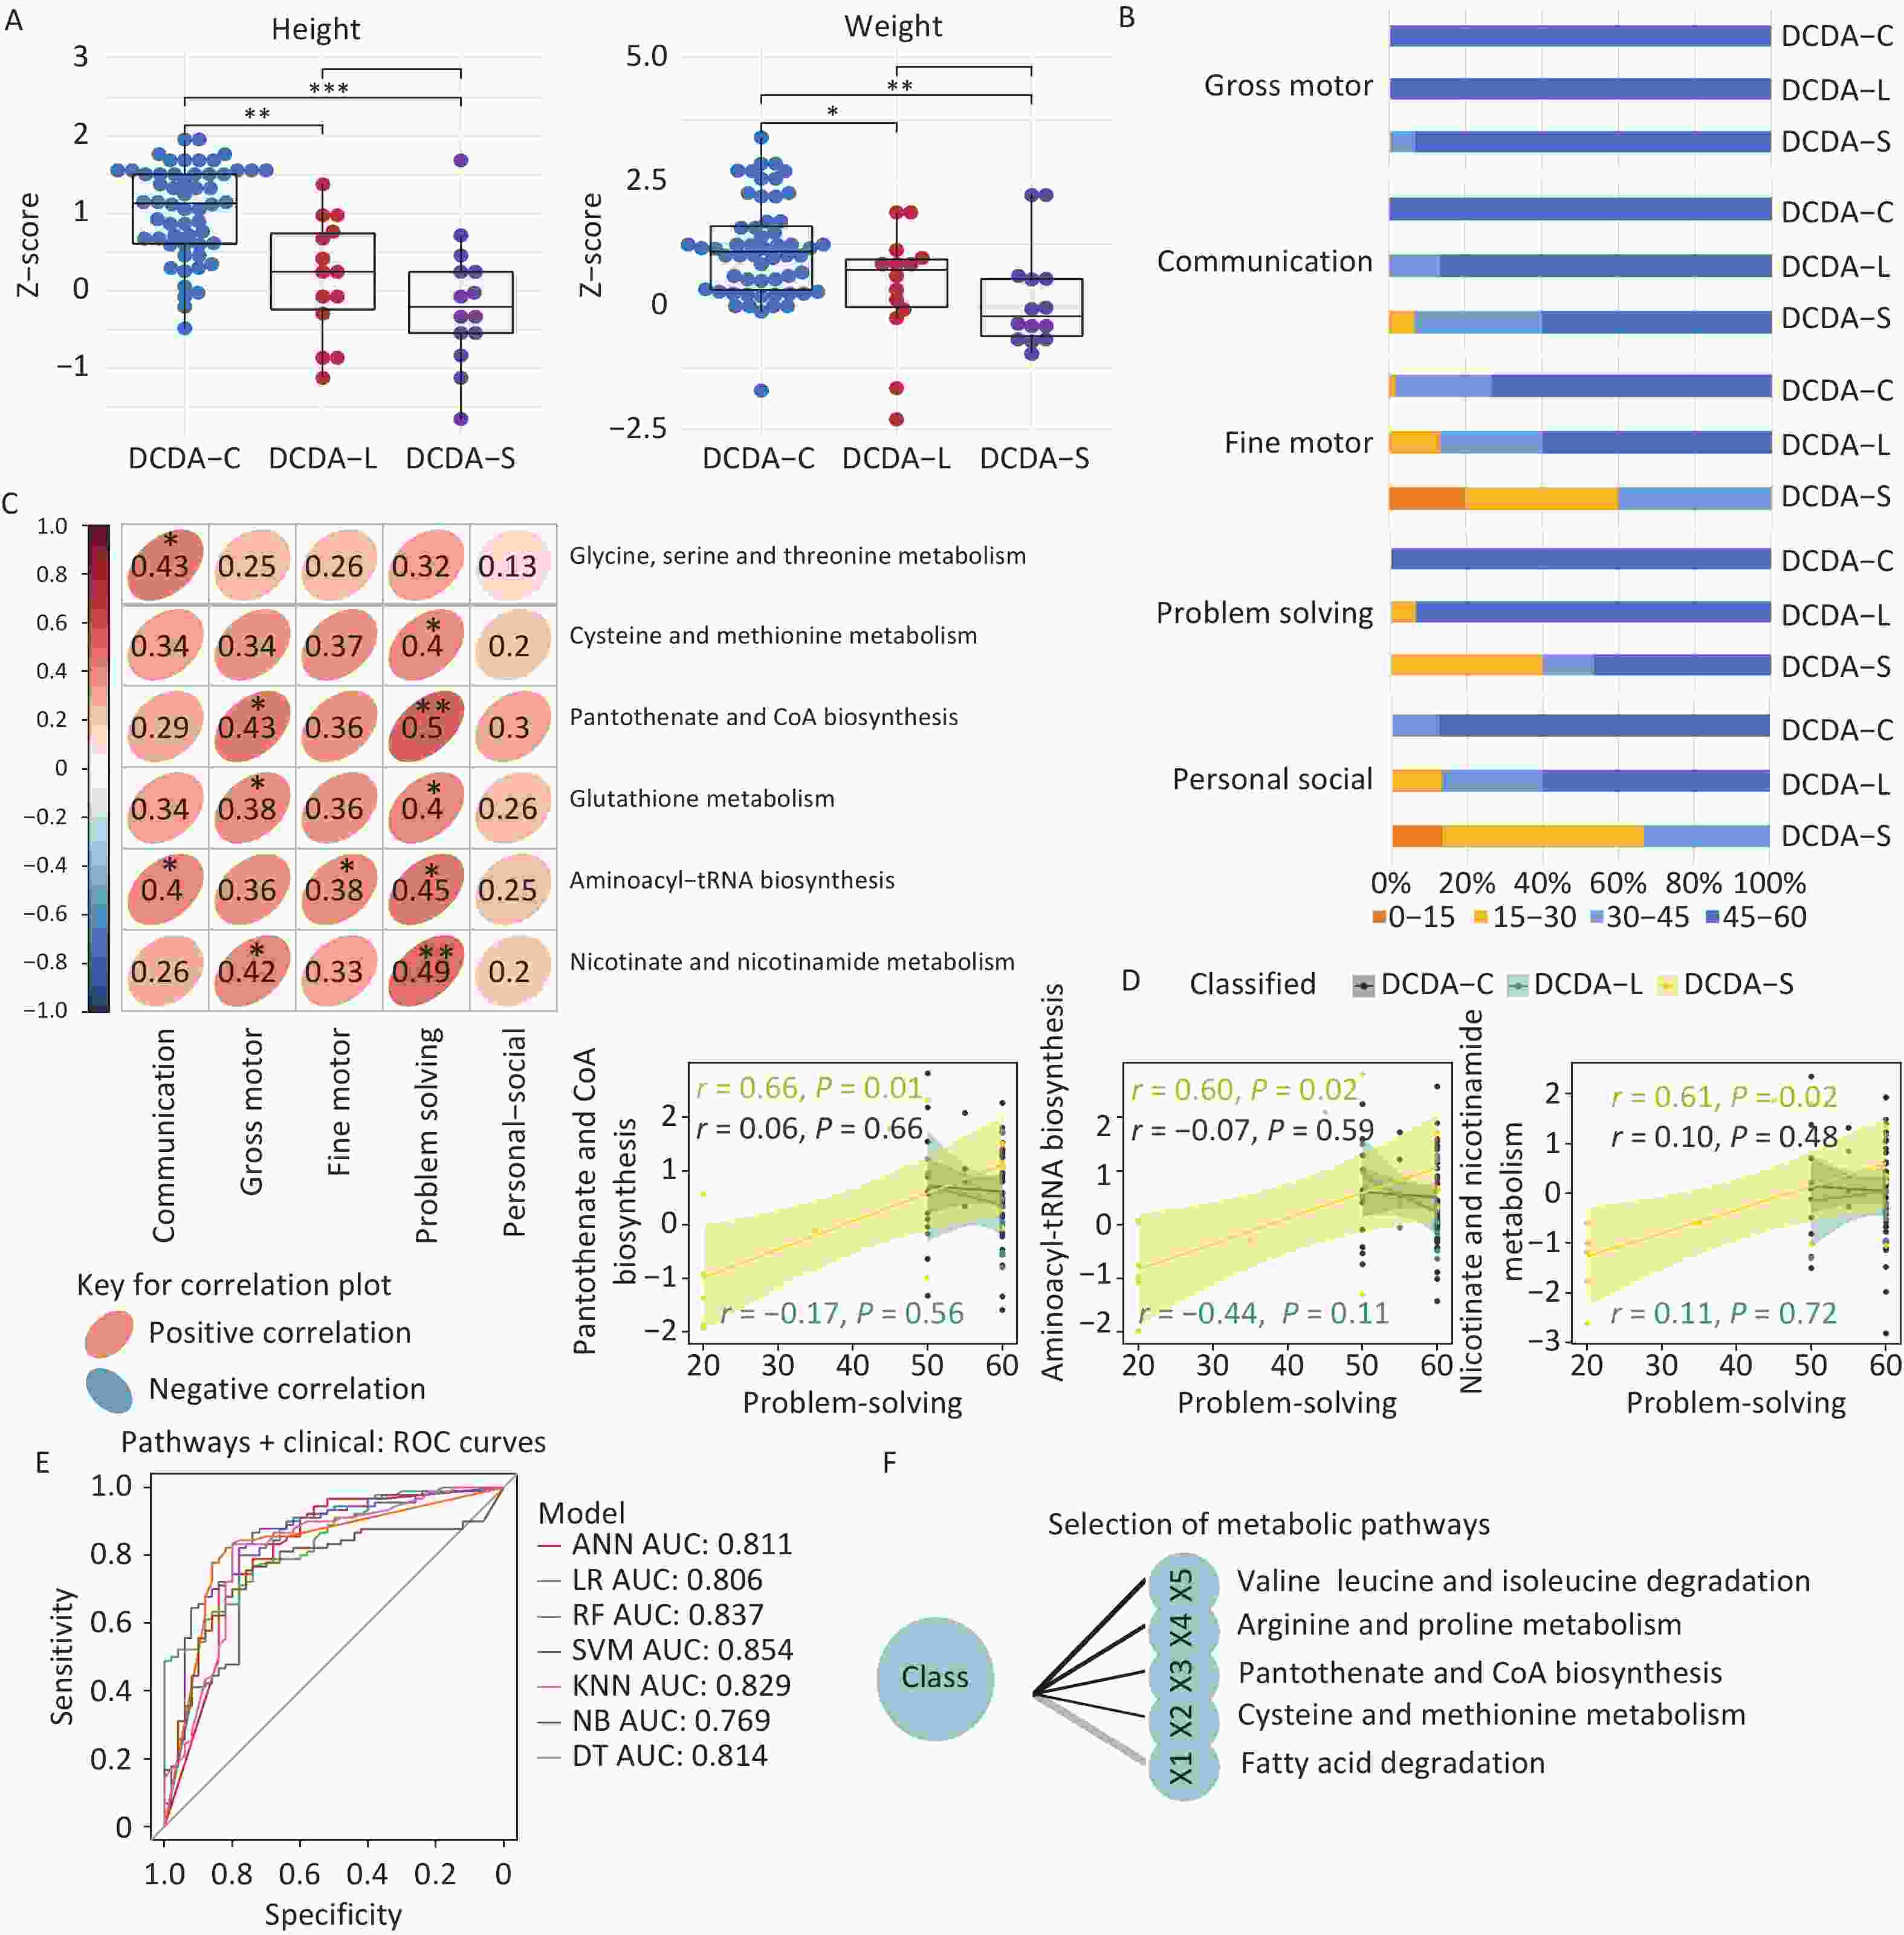
Figure 3. Association of neonatal hair metabolic signatures with physical and neurocognitive outcomes at 2–3 years of age. A) Comparison of height-for-age and weight-for-age among the DCDA-C, DCDA-L, and DCDA-S groups at 2–3 years of age. Statistical significance was determined by Wilcoxon’s rank-sum test. B) Comparison of the percentage of score areas in the three groups for each developmental domain of the ASQ-3 subscale at 2–3 years of age, with score distributions in four equal intervals (0–15, 15–30, 30–45, 45–60) for descriptive purposes. C) Correlations between the hair metabolic pathways and evaluation indices of physical and neurocognitive development in the sFGR-DCDA group. Only the correlations with P-values less than 0.05 were illustrated. The red ellipses represent positive correlations whereas the blue ellipses represent negative correlations. D) The hair metabolic pathways correlated to the evaluation indices of physical and neurocognitive development with a Pearson’s r greater than 0.45 are illustrated. The shadow around the linear regression trendline shows the 95% CI (*P < 0.05, **P < 0.01, ***P < 0.001). E) ROC curve analysis and corresponding AUC values (median with 95% confidence interval) of each model. F) Selection of metabolic pathways using recursive feature elimination (RFE). ANN, artificial neural network; AUC, the area under the receiver operating characteristic curve; C, control; CI, confidence interval; DCDA, dichorionic-diamniotic; DT, decision tree; KNN, k-nearest neighbor; L, larger twin; LR, logistic regression; NB, Naïve Bayes; RF, random forest; ROC, receiver operating characteristic; S, smaller twin; sFGR, selective fetal growth restriction; SVM, support vector machine.
-
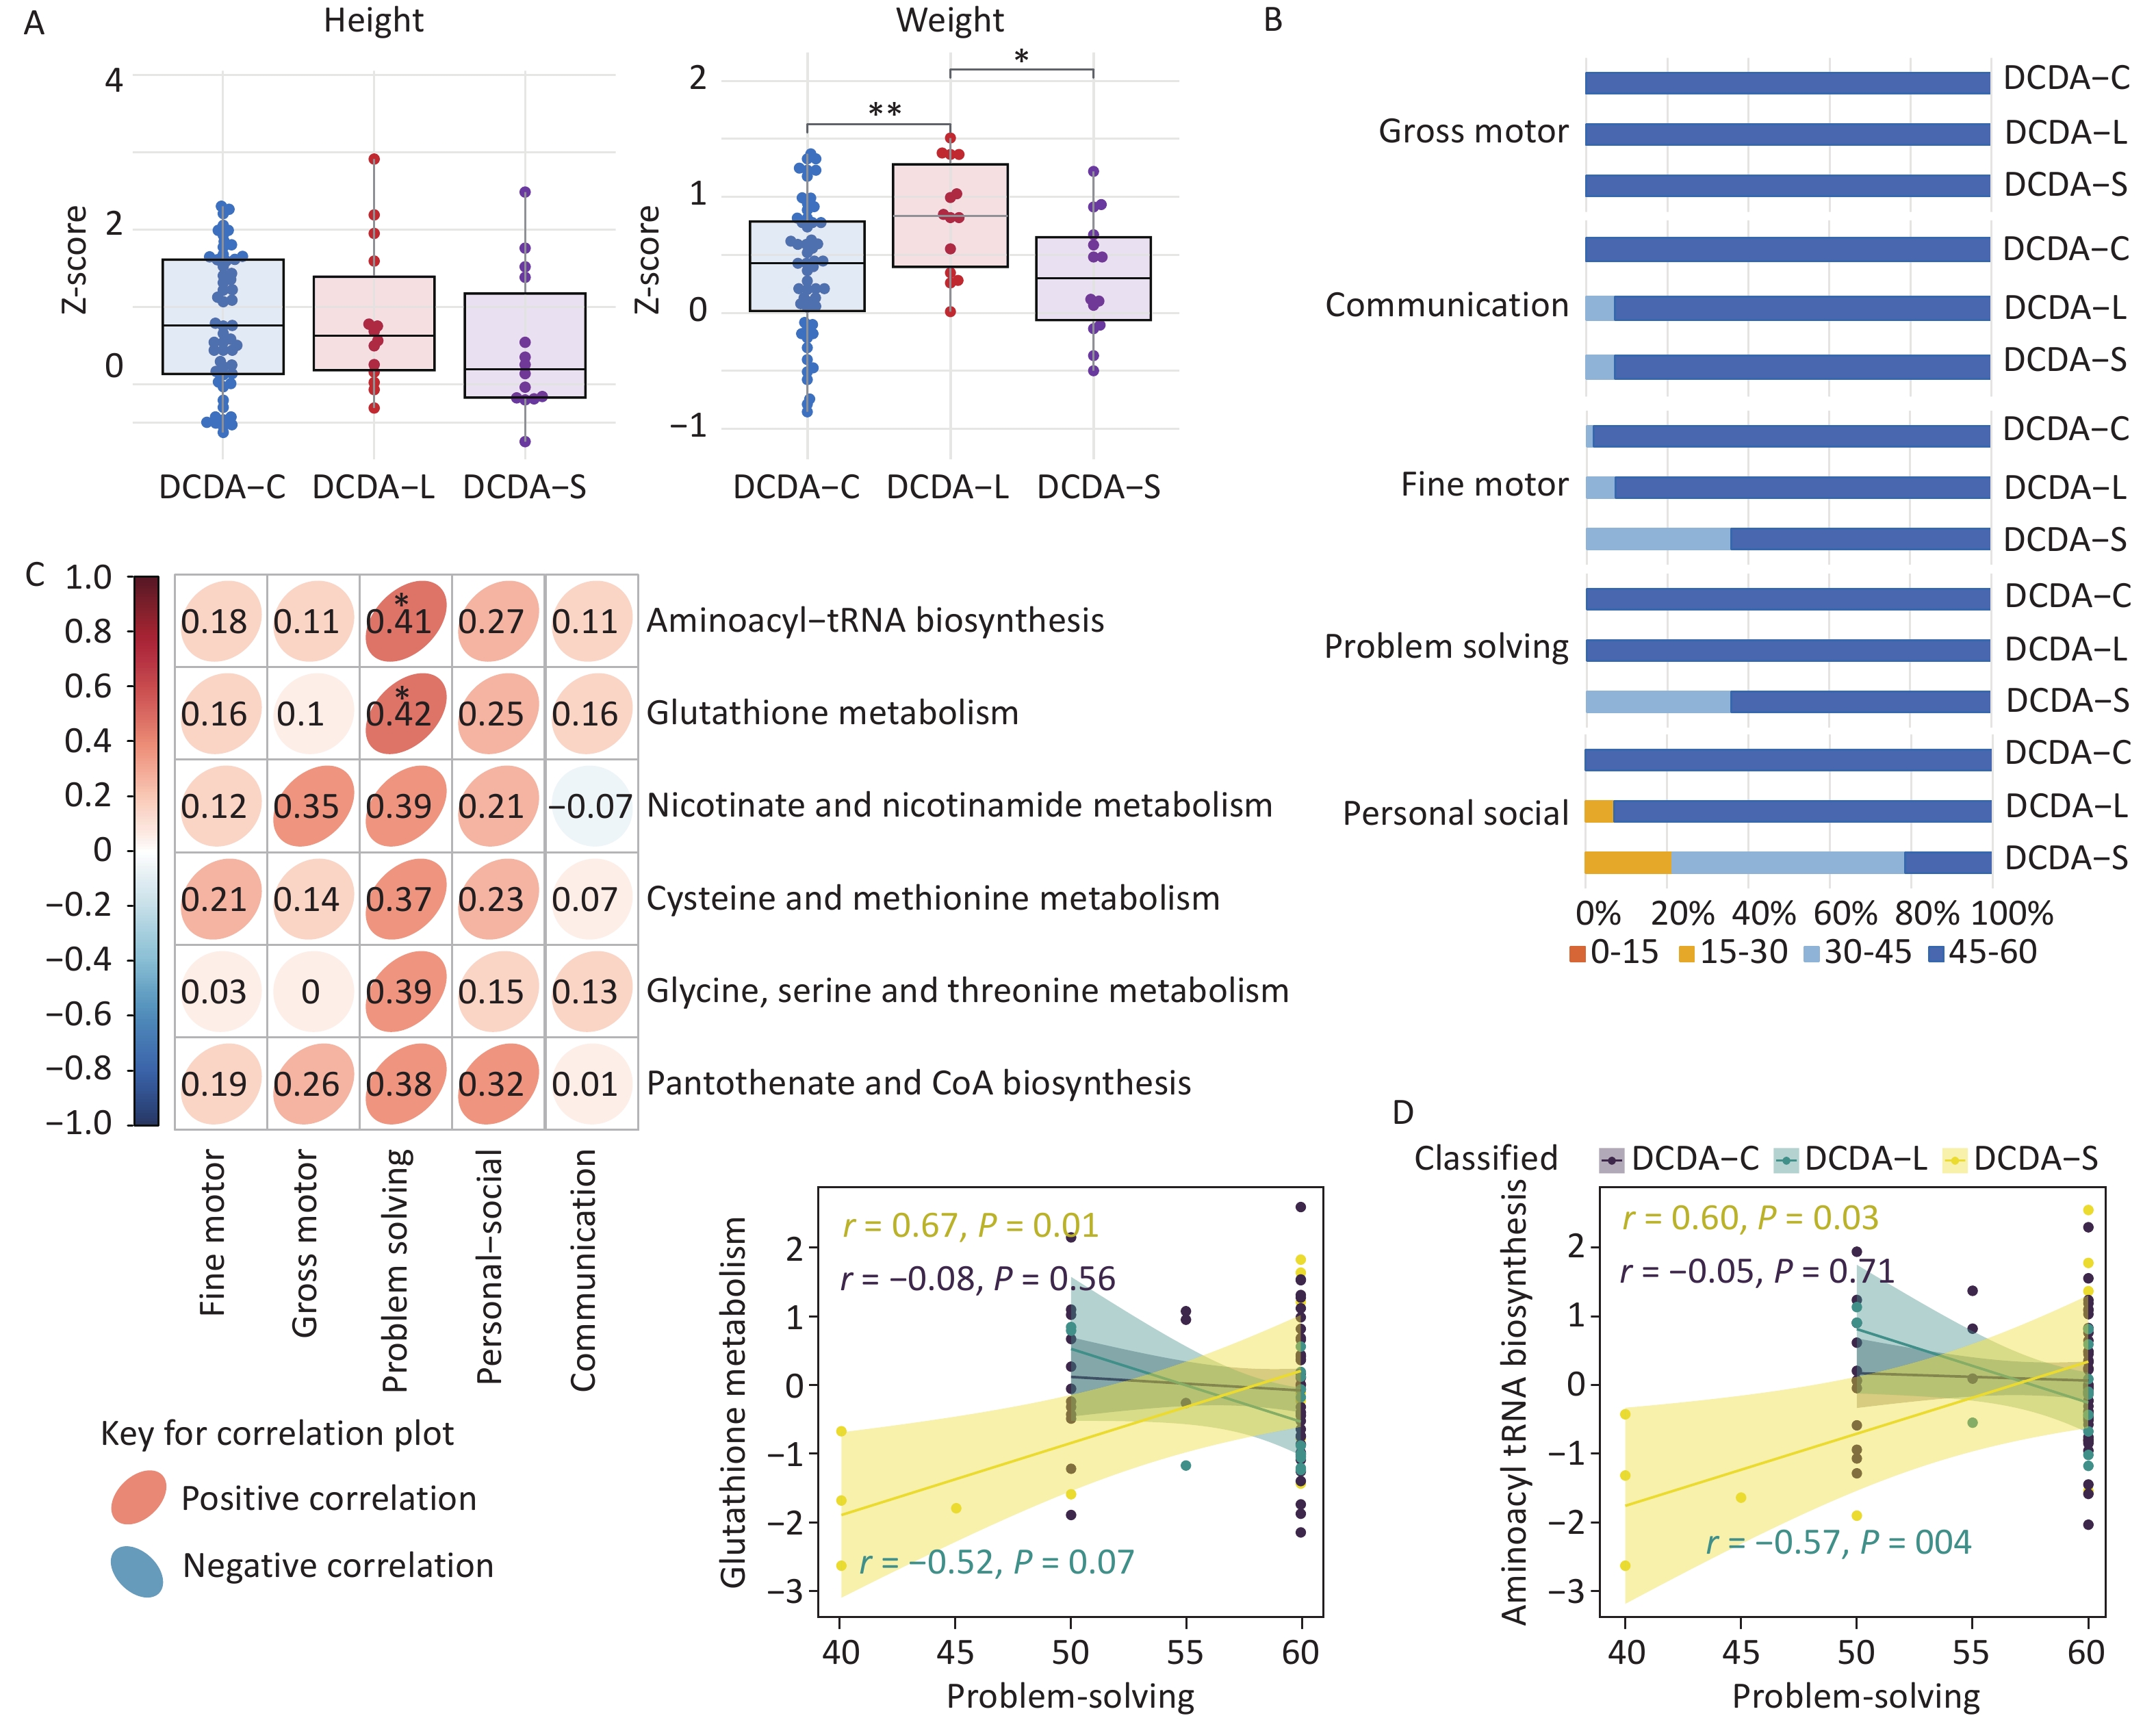
At 5–6 years of age, children in the DCDA-S group exhibited significantly lower weights than those in the DCDA-L group (P < 0.05). However, no significant differences in weight were observed between the DCDA-S and DCDA-C groups, or in height among the three groups (Figure 4A). In the ASQ-3 subscale scores for 5–6 years of age, the DCDA-S group’s scores across the five developmental domains, especially in fine motor skills, problem-solving, and personal-social development, showed improvements in comparison with the corresponding scores at 2–3 years of age (Figure 3B & 4B). Additionally, low scores (< 30 points) in the fine motor and problem-solving domains were no longer observed at 5–6 years of age, whereas the frequency of low scores in the personal-social domain for the DCDA-S group decreased from 70% to 20%. On further investigating the association between early-life metabolic activity and neurocognitive development in sFGR-DCDA, we found a significant positive correlation (P < 0.05) between the problem-solving domain and two metabolic pathways, aminoacyl-tRNA biosynthesis and glutathione metabolism, in sFGR-DCDA twins at 5–6 years of age (Figure 4C). No significant correlations were observed between the other four domains or metabolic pathways (Figure 4C). Only in the DCDA-S group were problem-solving skills associated with glutathione metabolic pathways and aminoacyl-tRNA biosynthesis at 5–6 years of age, with r ≥ 0.6 (P < 0.05) (Figure 4D). This finding is consistent with the correlation observed at 2–3 years of age in the problem-solving domain.
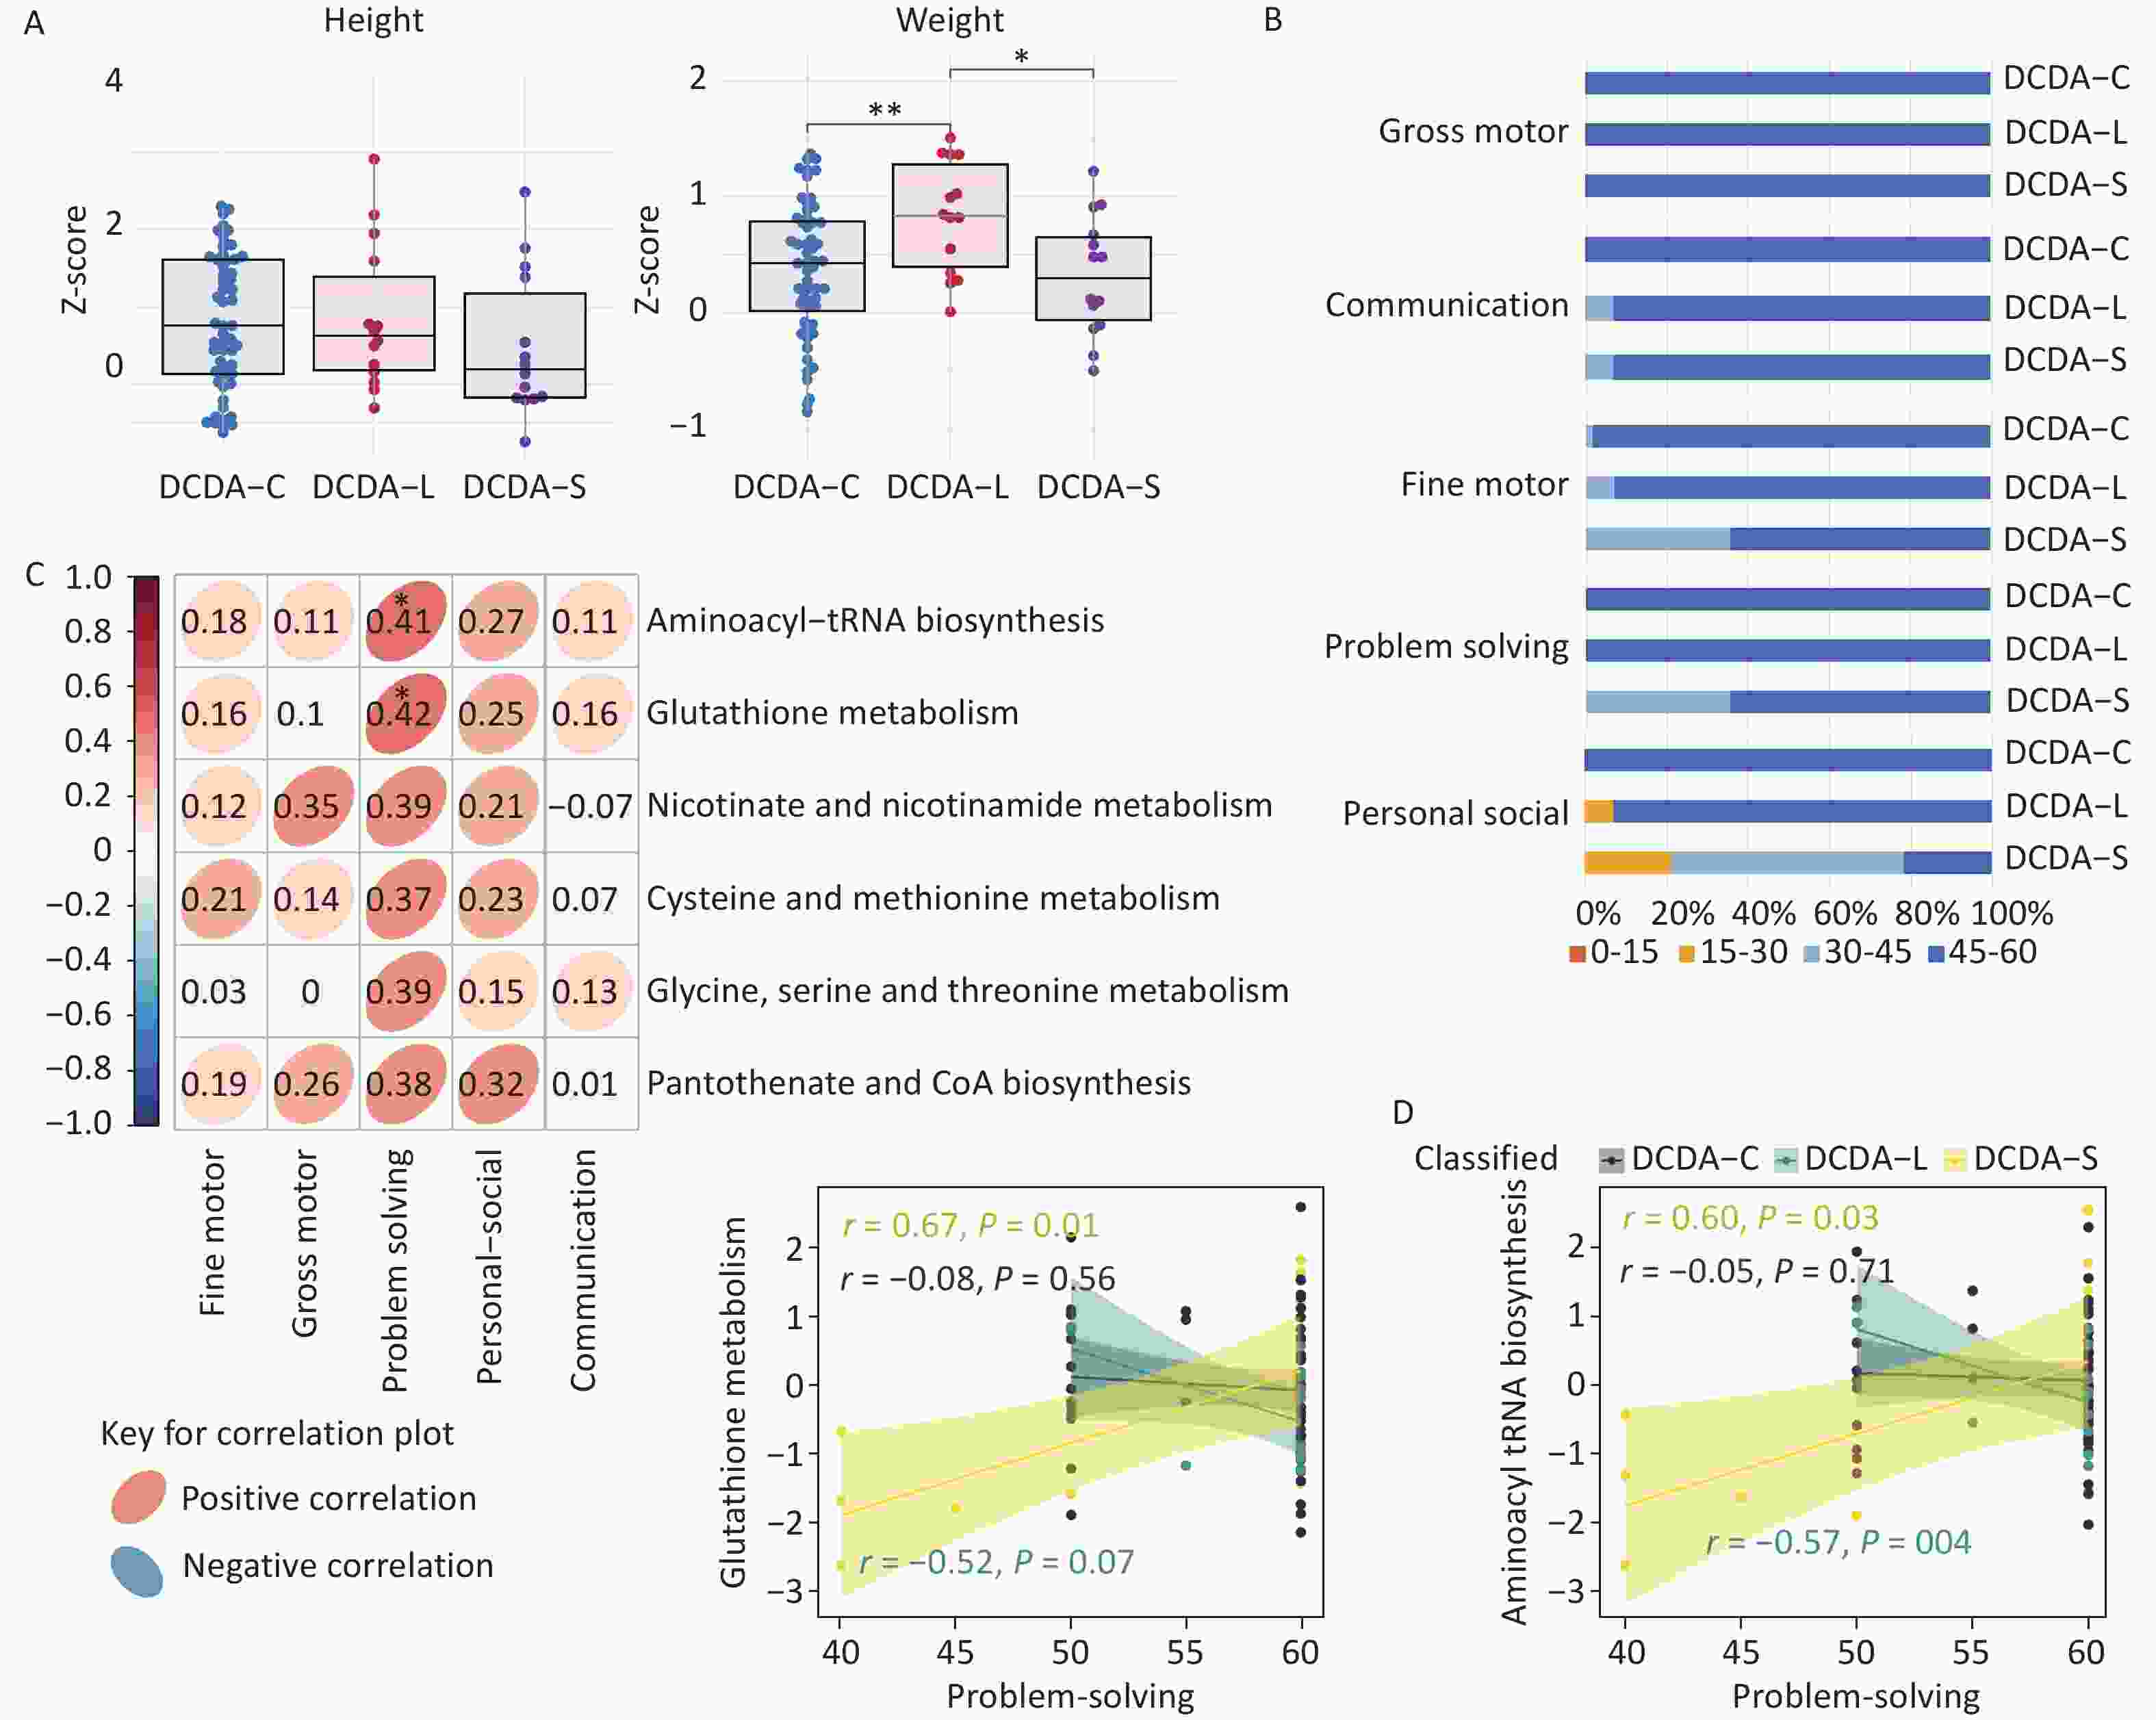
Figure 4. Association of neonatal hair metabolic signatures with physical and neurocognitive outcomes at 5–6 years of age. A) Comparison of height-for-age and weight-for-age among the DCDA-C, DCDA-L, and DCDA-S groups at 5–6 years of age. Statistical significance was determined by Wilcoxon’s rank-sum test. B) Comparison of the percentage of score areas in the three groups for each developmental domain of the ASQ-3 subscale at 2–3 years of age. C) Correlations between the hair metabolic pathways and evaluation indices of physical and neurocognitive development in the sFGR-DCDA group. Only the correlations with a P-value less than 0.05 were illustrated. The red ellipses represent positive correlations between the hair metabolites and evaluation indices of physical and neurocognitive development, whereas the blue ellipses represent negative correlations between the hair metabolites and evaluation indices of physical and neurocognitive development. D) The hair metabolic pathways correlated to the evaluation indices of physical and neurocognitive development with a Pearson’s r greater than 0.45 was illustrated. The shadow around the linear regression trendline shows the 95% CI (*P < 0.05, **P < 0.01, ***P < 0.001). ANN, artificial neural network; AUC, the area under the receiver operating characteristic curve; C, control; CI, confidence interval; DCDA, dichorionic-diamniotic; DT, decision tree; KNN, k-nearest neighbor; L, larger twin; LR, logistic regression; NB, Naïve Bayes; RF, random forest; ROC, receiver operating characteristic; S, smaller twin; sFGR, selective fetal growth restriction; SVM, support vector machine.
-
Given the identification of underdeveloped problem-solving and personal-social skills in the DCDA-S group using the ASQ-3 assessment, machine learning techniques were employed to examine neonatal hair metabolic pathways that could classify ASQ scores above or below 30 for these two neurobehavioral outcomes at 2–3 and 5–6 years of age. For the personal-social domain scores of 2–3-year-olds, integrated pathway-based classification models incorporating key clinical confounders (e.g., gestational age) demonstrated preliminary discriminatory capacity. The SVM and RF models achieved robust performance, with AUC values of 0.854 and 0.837, respectively, followed by KNN (AUC = 0.829), DT (AUC = 0.814), ANN (AUC = 0.811), LR (AUC = 0.806), and NB (AUC = 0.769) (Figure 3E). Permutation testing (1,000 iterations) yielded an empirical P-value of 0.001, confirming that the high predictive accuracy was not attributable to overfitting (Supplementary Figure S2). Pathways contributing to model discrimination were identified by feature importance analysis and included valine, leucine, and isoleucine degradation; arginine and proline metabolism; pantothenate and CoA biosynthesis; cysteine and methionine metabolism; and fatty acid degradation (Figure 3F). However, both metabolomic profiles and pathway-based models showed limited classification performance for problem-solving scores at 2–3 years. Likewise, models based on metabolites or pathways showed limited discrimination for personal-social outcomes at 5–6 years of age, suggesting that neonatal hair metabolic pathway signatures analyzed through machine learning approaches (particularly SVM) are associated with early personal-social development in DCDA-S twins but do not extend to preschool age.
-
Attempts to characterize the metabolic basis of long-term adverse neurobehavioral outcomes in sFGR have been hampered by the lack of fetal-specific biomarkers that capture chronic intrauterine metabolic disturbances. This study provides new insights by leveraging neonatal hair metabolomics to provide direct biochemical evidence of such disturbances in DCDA twins. We identified distinct downregulation of key neuroprotective pathways, including glutathione and aminoacyl-tRNA biosynthesis, in the DCDA-S neonates, which was more severe than that in their co-twins and controls. Significantly, the degree of downregulation in these pathways was associated with poorer problem-solving skills years later, and the pathway-based models showed good discrimination for early personal-social deficits. These findings suggest that neonatal hair metabolomics may serve as a non-invasive modality for identifying the metabolic origins of neurodevelopmental risk in sFGR.
-
Our findings revealed a consistent pattern of downregulated amino acid, antioxidant, and cofactor and vitamin metabolism in sFGR-DCDA twins than in DCDA-C controls, with the DCDA-S neonates showing the most pronounced alterations. These metabolic disturbances converged on several interconnected pathways, including cysteine and methionine metabolism, glutathione metabolism, aminoacyl-tRNA biosynthesis, and nicotinate and nicotinamide metabolism, suggesting coordinated disruption of antioxidant defense, protein synthesis, and cellular energy homeostasis in the context of sFGR-associated intrauterine stress.
Notably, the DCDA-L infants also exhibited metabolic perturbations distinct from the DCDA-C twins, suggesting that the larger twins in sFGR-DCDA pregnancies are not equivalent to concordant controls[28]. Several mechanisms may account for this finding, including shared maternal systemic influences (e.g., hemodynamic changes and nutritional status), subclinical placental compromise in the larger twin reflecting broader maternal vascular dysfunction, and compensatory growth demands imposing distinct metabolic costs. These observations are consistent with the findings of previous reports suggesting that the larger twin in growth-discordant pairs may also be exposed to a compromised intrauterine environment[13,29], indicating that sFGR in DCDA pregnancies may involve metabolic alterations affecting both twins.
Beyond the metabolic findings, the neurodevelopmental changes observed in DCDA-S neonates at 2–3 years of age, particularly in the problem-solving and personal-social domains, showed apparent attenuation by 5–6 years of age. This improvement may reflect the considerable plasticity of the developing brain during early childhood, during which postnatal environmental factors such as nutritional support and caregiver responsiveness may facilitate compensatory neural reorganization[30]. These observations point to a potential early intervention window. However, whether this improvement represents true neurodevelopmental recovery or adaptive compensation remains to be clarified in future studies with standardized neurocognitive assessments and adjustments for postnatal environmental variables.
-
Our study suggests that the downregulation of antioxidant-associated metabolic pathways, including cysteine, methionine, and glutathione metabolism, is associated with poorer neurobehavioral development in the problem-solving domain at 2–3 years of age in sFGR-DCDA twins. Through transculturation and transmethylation pathways, methionine can be converted into cysteine, which serves as a crucial precursor for glutathione synthesis[31,32]. The cysteine-hub metabolic network regulates oxidative stress, energy metabolism, and cellular autophagy[33]. Accumulating evidence indicates that lower cysteine levels may trigger vascular endothelial damage in the maternal-placenta-fetal circulation through oxidative stress during FGR[34-37]. Consistent with these findings, our previous studies showed reduced methionine and cysteine levels in the neonatal hair and meconium of MCDA twins with sFGR, with the meconium cysteine levels positively correlated with infant neurocognitive development[11,21]. In twin pairs discordant for Kwashiorkor, a similar reduction in sulfur-containing amino acids, including methionine and cysteine, has been reported[38]. Emerging evidence further suggests that H2S, produced from l-cysteine by cystathionine-β-synthase within the brain, may reduce oxidative stress-induced injury and protect against neuroinflammation-associated cognitive dysfunction[39,40].
Similarly, glutathione metabolism was associated with lower neurodevelopmental scores in the problem-solving domains in both 2–3- and 5–6-year-olds. Previous cord-blood evidence supports redox imbalance as a clinically relevant feature of FGR, with glutathione-related biomarkers among the most consistently reported oxidative stress indicators[41]. Glutathione, which consists of glutamic acid, cysteine, and glycine, is one of the most important antioxidants in the central nervous system[42,43]. Neurons are particularly susceptible to oxidative stress because of their reliance on the glutathione redox potential[44], and low glutathione levels contribute to long-term cognitive decline through excessive oxidative stress[45]. Animal models of FGR have demonstrated oxidative stress and mitochondrial dysfunction in the brain[46], with decreased glutathione concentrations in various cerebral cortex regions after hypoxia[47]. Disruptions in glutathione homeostasis, particularly within the hippocampus, compromise antioxidant defense mechanisms, exacerbate oxidative stress, and impair synaptic plasticity and neurocognitive functions in early life[48]. Downregulation of the glutathione and cysteine metabolic pathways in DCDA-S may contribute to oxidative stress and neuroinflammation, which could, in turn, contribute to adverse neurobehavioral outcomes. However, these associations are observational, and future experimental studies are required to establish causality.
-
Downregulation of aminoacyl-tRNA pathways involving cysteine, threonine, and leucine was correlated with poor communication, fine motor skills, and problem-solving at 2–3 years of age as well as problem-solving at 5–6 years of age in the DCDA-S group. Aminoacyl-tRNA synthetases (ARSs), which catalyze the attachment of amino acids to their corresponding tRNAs[49], are integral to protein biosynthesis and crucial for neurodevelopmental processes such as myelination and neuronal connectivity. Deficiencies in ARS activity have been implicated in a spectrum of developmental disorders characterized by central nervous system symptoms, FGR, and failure to thrive[50,51]. We speculate that the downregulation of amino acids such as cysteine, threonine, and leucine associated with discordant growth in utero may indicate the dysregulation of aminoacyl-tRNA biosynthesis, potentially contributing to decreased translation and protein production at a crucial time during brain development. Nonetheless, this association requires further verification, and interventional studies are needed to determine whether restoring aminoacyl-tRNA pathway activity can improve neurodevelopmental outcomes.
-
In sFGR-DCDA twins, the activity level of nicotinate and nicotinamide metabolism was positively correlated with gross motor skills and problem-solving abilities at 2–3 years of age. Subgroup analysis revealed that this correlation was primarily driven by the DCDA-S group. Nicotinamide has been associated with neuronal differentiation by reducing neural progenitor proliferation and accelerating neuronal maturation, neurite outgrowth, and neurotransmitter expression[52,53]. Other studies have highlighted the neuroprotective properties of nicotinamide[54,55], and maternal nicotinamide riboside supplementation has been shown to enhance offspring development and neurogenesis[56]. These findings suggest that nicotinamide may exert a protective effect on fetal neurodevelopment during gestation, particularly by supporting the differentiation and maturation of nerve cells involved in motor and neurocognitive development.
-
This study provides evidence linking neonatal hair metabolic alterations to later adverse neurobehavioral outcomes. In comparison with conventional metabolomic approaches using cord blood or amniotic fluid, which only reflect transient metabolic states at delivery, neonatal hair captures the cumulative metabolic information from late gestation, making it more suitable for capturing the chronic metabolic reprogramming associated with sFGR. From a translational perspective, the metabolic pathway alterations identified in this study, particularly in the antioxidant and protein synthesis pathways, may serve as candidate non-invasive biomarkers for identification of neonates with sFGR at risk of neurodevelopmental difficulties, potentially guiding individualized monitoring and timely intervention. Nevertheless, this study had several limitations. First, the low prevalence of sFGR-DCDA twins, together with the limited availability of neonatal hair samples, constrained the study’s sample size. Second, the dichotomization of continuous ASQ-3 scores at 30 may have resulted in some loss of variance information, and as a parent-reported screening tool administered via phone interviews, the ASQ-3 itself may be subject to recall bias and reduced standardization. Future studies with larger cohorts should consider more comprehensive covariate-adjusted analyses, complementary analyses using continuous scores, and clinician-administered assessments, such as the Bayley Scales of Infant and Toddler Development, to enhance discrimination precision.
-
This study is the first to explore the association between the neonatal hair metabolome and infant neurobehavioral development at 2–3 and 5–6 years of age. Changes in four endogenous metabolites, namely, decreased cysteine, l-leucine, and threonine levels and increased 2-aminobutyric acid levels, discriminated sFGR-DCDA twins from the DCDA-C controls. Hair metabolic alterations were also linked to personal-social abilities at 2–3 years of age and problem-solving abilities at both 2–3 and 5–6 years of age. Thus, metabolomic analysis of neonatal hair may serve as a valuable tool for identifying at-risk infants and providing early interventions to improve long-term neurobehavioral outcomes.
HTML
Study Design and Settings
Hair Sample Preparation, Gas Chromatography-mass Spectrometry Analysis, and Data Processing
Follow-up Assessments of Physical and Neurobehavioral Development
Downstream Metabolomic Analyses
Machine Learning Algorithms
Statistical Analysis
Population Characteristics
Analysis of Hair Metabolome Profiles in DCDA-C and sFGR-DCDA Twins
Pathway Enrichment Analysis for Variable Metabolites in the DCDA-C and sFGR-DCDA Twins
Association of Hair Metabolism Profiles with Physical and Neurocognitive Development at 2–3 Years of Age
Association of Hair Metabolism Profiles with Physical and Neurocognitive Development at 5−6 Years of Age
Machine Learning Analysis of Neurocognitive and Physical Outcomes in DCDA-S Neonates
Metabolic Characteristics of sFGR-DCDA Twins and Neurodevelopmental Implications
Antioxidant-related Metabolic Pathways and Neurocognitive Outcomes in sFGR-DCDA Twins
Aminoacyl-tRNA Biosynthesis and Neurodevelopment in sFGR-DCDA Twins
Nicotinate and Nicotinamide Metabolism and Neurocognitive Outcomes in sFGR-DCDA Twins
Strengths and Limitations
Competing Interests The authors declare that they have no competing interests.
Ethics This study was conducted in accordance with the Declaration of Helsinki and approved by the Ethics Committee of Peking University Third Hospital.
Authors’ Contributions Conceptualization, Methodology, Funding acquisition: Jing Yang, Tingli Han, Yangyu Zhao; Investigation, Data curation: Youzhen Zhang, Tian He, Xiaoyu Liu, Xiya Sun, Yang Yang; Software, Formal analysis: Xiaoyu Liu, Yang Yang, Nana Huang, Jinfang Yuan; Methodology, Supervision: Tian He, Richard Saffery, Jeffrey M Craig, Jingyu Liu, Wenjun Zhou, Yixin Li; Writing-original draft: Youzhen Zhang, Tian He; Review and editing: Tingli Han, Jing Yang, Yangyu Zhao. All the authors provided critical intellectual content and approved the final version of the manuscript.
&These authors contributed equally to this work.

 Quick Links
 DownLoad: