
-
Muscle strength is essential to physical fitness and overall health[1]. Previous studies have linked low muscle strength to a high risk of various adverse health outcomes, including respiratory diseases[2], cardiovascular disease (CVD), and mortality[3]. For example, findings from the Prospective Urban Rural Epidemiology (PURE) study indicated a 17% increase in CVD mortality risk per 5 kg decrease in absolute grip strength[4]. Furthermore, evidence suggests that in the oldest old, muscle strength exhibits a gradual, inverse association with mortality risk rather than being linked through a specific threshold[5]. However, most existing studies have assessed muscle strength solely through grip strength[6], neglecting other relevant measures such as chair-rising time, which reflects lower-limb muscle power[7,8]. Consequently, a combined assessment of grip strength and chair-rising time may provide a more comprehensive and clinically relevant evaluation of the relationship between muscle strength and health outcomes than either measure alone.
Diabetes mellitus (DM) is the major cause of CVD and disability worldwide[9]. Previous studies have shown that low muscle strength is associated with an increased risk of developing DM[10,11], whereas higher muscle strength is associated with a lower likelihood of progression from prediabetes (Pre-DM) to DM in middle-aged and older adults[12]. This close interplay between muscle strength and glycemic status suggests that these factors may synergistically influence the development of CVD. However, whether and in what manner the relationship between muscle strength and CVD risk differs across individuals with varying glycemic statuses remains unclear.
To address these gaps in evidence, we utilized data from the China Health and Retirement Longitudinal Study (CHARLS). This study aimed to (a) examine the association of muscle strength, assessed by both grip strength and chair-rising time, with incident CVD risk following a linear or nonlinear pattern; (b) investigate this association across different glycemic status groups; and (c) determine the joint effect of lower grip strength and prolonged chair-rising time on CVD risk.
-
The CHARLS is an ongoing, nationwide, population-based, prospective cohort study (http://charls.pku.edu.cn/)[13]. Detailed descriptions of its design have been previously published[13-15]. A baseline survey (Wave 1) was conducted from 2011 to 2012, with follow-up surveys conducted in 2013 (Wave 2), 2015 (Wave 3), 2018 (Wave 4), and 2020 (Wave 5). High-quality data on demographic characteristics, lifestyle factors, and health-related information were collected through face-to-face interviews using a standardized questionnaire. The CHARLS protocol was approved by the Peking University Institutional Review Board (IRB00001052–11015) and conformed to the principles of the Declaration of Helsinki. Written informed consent was obtained from all participants upon enrollment in the study. This study followed the Strengthening the Reporting of Observational Studies in Epidemiology (STROBE) reporting guidelines[16].
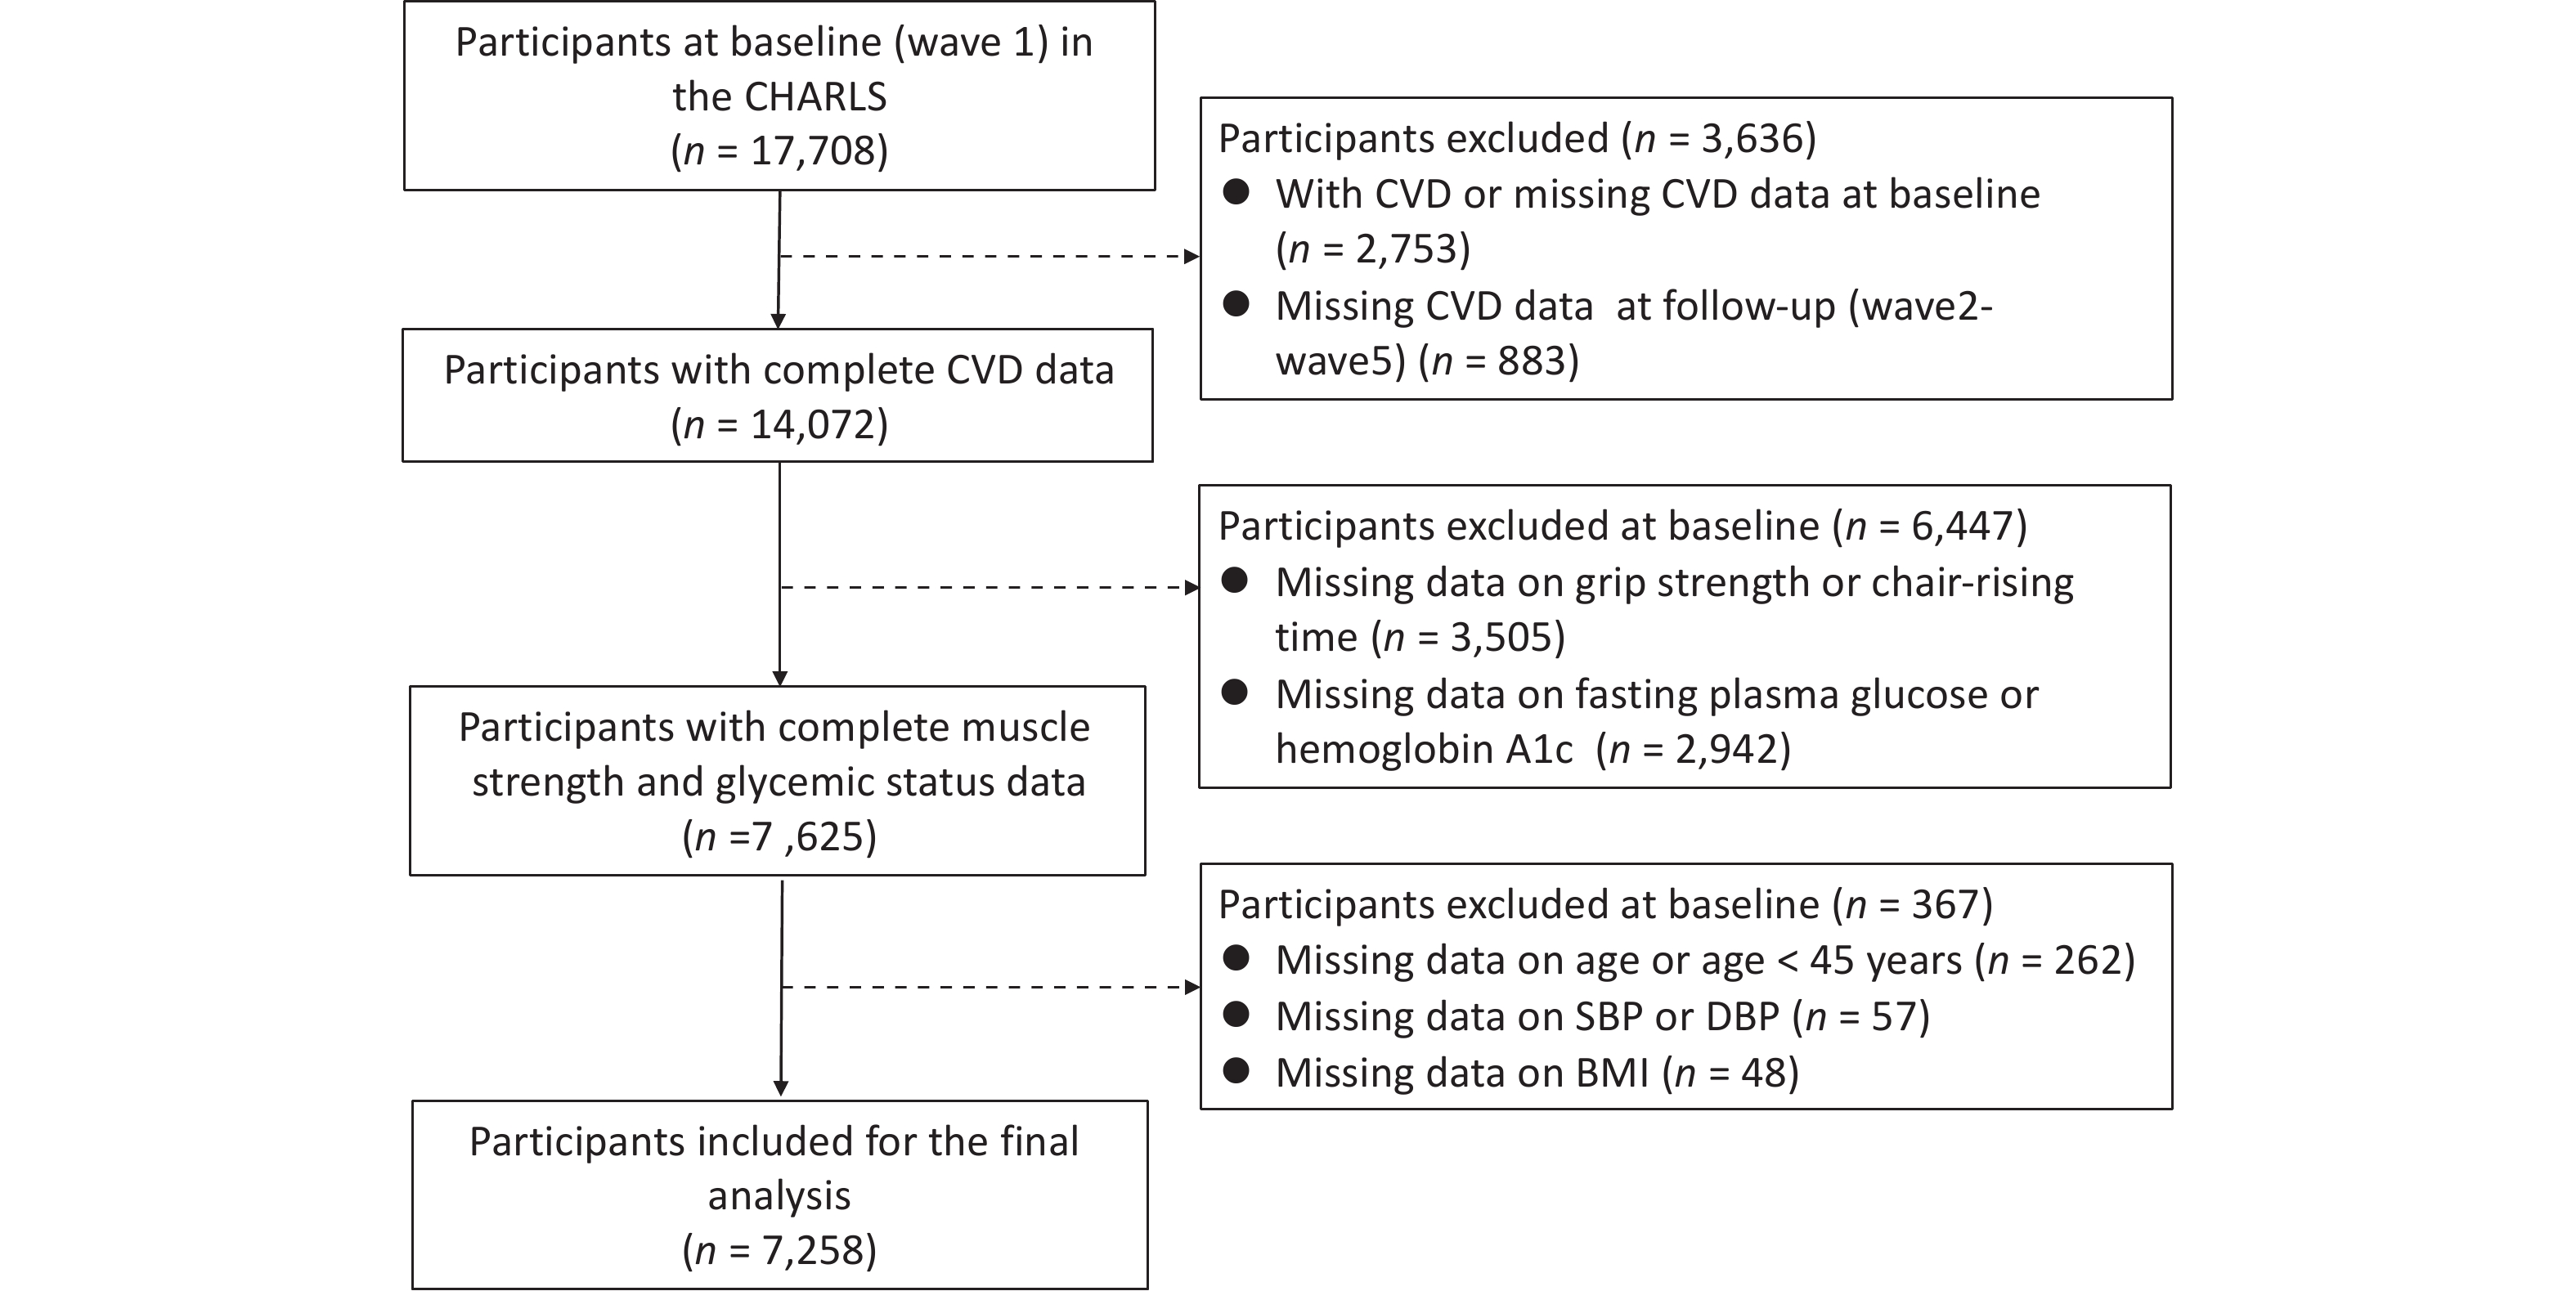
In this study, data from five waves (2011–2020) of CHARLS were used. The baseline sample (CHARLS 2011–2012) included 17,708 participants. We excluded 3,636 individuals with prevalent CVD, missing CVD data at baseline, or missing CVD outcome data during follow-up. An additional 6,447 participants were excluded because of missing data on grip strength, chair-rising time, fasting plasma glucose (FPG), or hemoglobin A1c (HbA1c). An additional 367 individuals were excluded because of missing data on age, systolic blood pressure (SBP), diastolic blood pressure (DBP), or body mass index (BMI) or age < 45 years. After these exclusions, 7,258 participants were included in the final analysis (Figure 1).
Figure 1. Participant inclusion flow diagram. Schematic of the participant screening process showing application of the inclusion and exclusion criteria. CHARLS: China Health and Retirement Longitudinal Study; CVD: cardiovascular disease; SBP: systolic blood pressure; DBP: diastolic blood pressure; BMI: body mass index.
-
Trained interviewers collected all data at the baseline and follow-up visits using standardized protocols. Information on demographic characteristics (age, sex, marital status, and residence), educational level, medical history (hypertension, DM, dyslipidemia, and medication use), and lifestyle factors (smoking and drinking status) was obtained using structured questionnaires. Education level was categorized as elementary school or below, secondary school, or college and above. Height and body weight were measured objectively and BMI was calculated as body weight in kilograms divided by height in meters squared (kg/m2).
Three consecutive measurements of SBP and DBP were obtained using an automated electronic device (Model HEM-7200; Omron Healthcare, Dalian, China) from seated participants after a period of quiet rest, with 45-second(s) intervals between measurements. The average of the last two readings was used for the analysis. Fasting blood samples collected at baseline were analyzed for FPG, HbA1c, total cholesterol (TC), triglyceride (TG), high-density lipoprotein cholesterol (HDL-c), and low-density lipoprotein cholesterol (LDL-c).
Glycemic status was classified according to the American Diabetes Association (ADA) 2010 criteria as follows: 1) DM: FPG ≥ 126 mg/dL (7.0 mmol/L), HbA1c ≥ 6.5%, or self-reported prior diagnosis and/or the use of antidiabetic medication. 2) Pre-DM: FPG between ≥ 100 and < 126 mg/dL (5.6 and 7.0 mmol/L) or an HbA1c between ≥ 5.7 and < 6.5%. 3) Normal glucose regulation (NGR): FPG < 100 mg/dL (5.6 mmol/L) and HbA1c < 5.7%[17].
Hypertension was defined as a SBP ≥ 140 mmHg, a DBP ≥ 90 mmHg, or a self-reported previous diagnosis and/or the use of antihypertensive medication[18].
Dyslipidemia was defined as the presence of any of the following: TC ≥ 240 mg/dL (6.2 mmol/L), LDL-c ≥ 160 mg/dL (4.1 mmol/L), TG ≥ 200 mg/dL (2.3 mmol/L), HDL-c < 40 mg/dL (1.0 mmol/L), or self-reported previous diagnosis and/or the use of lipid-lowering medication[19].
-
The exposures were measures of muscle strength represented by normalized grip strength (kg/kg) and chair-rising time(s). Grip strength (kg) was assessed using a YuejianTM WL-1000 handgrip dynamometer. Prior to data collection, trained interviewers demonstrated a standardized measurement procedure, which required participants to stand upright, hold the dynamometer with the elbow flexed at 90°, and exert maximum force for several seconds. The participants were instructed to squeeze the dynamometer as hard as possible with each hand, and the procedure was repeated to obtain two measurements per hand. The average value of all valid measurements from both hands was calculated and used for analysis. Given the substantial covariance with body weight (kg), grip strength was adjusted and presented as normalized grip strength (kg/kg) [grip strength (kg)/body weight (kg)] [12,20]. The chair-rising time (s) was measured using a stopwatch as the time required for the participants to complete five full sit-to-stand cycles consecutively at the fastest possible pace.
-
The study outcome was the incidence of CVD, a composite of heart disease and stroke. Following the established methodology, incident CVD was diagnosed based on affirmative responses to standardized questions regarding a physician’s diagnosis of heart disease (encompassing heart attack, coronary heart disease, angina, congestive heart failure, and other heart problems) or stroke during the follow-up period[14,21,22]. Follow-up was continued until the first occurrence of incident CVD, death, loss to follow-up, or the end of the study period, whichever came first[23].
-
Baseline characteristics of participants, stratified by quartiles of normalized grip strength and chair-rising time, are presented as the means ± standard deviations (SDs) for continuous variables and as numbers (percentages) for categorical variables. Differences across quartiles were assessed using one-way ANOVA for continuous variables and the χ2 test for categorical variables.
Kaplan–Meier curves were plotted to estimate the cumulative CVD incidence across quartiles of normalized grip strength or chair-rising time, and differences between groups were compared using the log-rank test. Cox proportional hazards models were used to estimate the hazard ratios (HRs) and 95% confidence intervals (CIs) for the association between quartiles of normalized grip strength (or chair-rising time) and the occurrence of incident CVD in the overall study population. Taking normalized grip strength as an example, the highest quartile (Q4) was designated as the reference group. We constructed a series of progressively adjusted models: Model 1 included adjustments for age and sex; Model 2 further incorporated residence, marital status, educational status, smoking status, and alcohol consumption status; and Model 3 additionally accounted for hypertension, dyslipidemia, and glycemic status. To evaluate multicollinearity, we calculated variance inflation factors (VIFs) for all covariates in the final model. All VIFs were below 3, indicating no substantial collinearity (Supplementary Table S1). The P value for the trend across the quartiles was obtained by treating the quartile number as a continuous variable in the regression model. Additionally, we examined potential nonlinear relationships using restricted cubic splines (RCS)[24] with three knots placed at the 10th, 50th, and 90th percentiles of the exposure distribution for continuous measurements of normalized grip strength and chair-rising time.
We further evaluated the joint associations of normalized grip strength (in quartiles) and chair-rising time (in quartiles) with the overall CVD risk among participants using Cox models. The highest quartile of normalized grip strength (Q4) and the lowest quartile of chair-rising time (Q1) were used as reference categories. Additionally, we assessed the relationships between normalized grip strength, chair-rising time (in quartiles), and CVD risk across the glycemic status subgroups (NGR, Pre-DM, and DM). The interaction was formally tested using a global Wald test for the product term between normalized grip strength (chair-rising time) and glycemic status in the Cox proportional hazards model. Moreover, we conducted a series of sensitivity analyses to assess the robustness of our findings: 1) Considering that BMI incorporates height and may provide a more accurate adjustment for body composition, we repeated the main analyses using BMI-normalized grip strength (grip strength/BMI) instead of body weight-normalized grip strength; 2) To minimize reverse causation, we excluded participants who developed CVD within the first two years of follow-up; 3) We handled missing covariates using multiple imputation by chained equations via the PROC MI procedure in Statistics Analysis System (SAS) to reduce potential selection bias, with details on missing data provided in Supplementary Table S2; 4) To address potential residual confounding by sex, we stratified main analyses by sex and modeled normalized grip strength in sex-specific quartiles; 5) We further adjusted for high-sensitivity C-reactive protein (hs-CRP), a biomarker of systemic inflammation that may lie on the pathway linking muscle strength to CVD; 6) We excluded participants with self-reported diabetes to reduce possible recall bias.
Statistical significance was defined as a two-tailed P value < 0.05. All analyses were performed using SAS (version 9.4; SAS Institute Inc., Cary, NC, USA) and R (version 3.6.1; R Foundation for Statistical Computing).
-
The baseline characteristics of the participants stratified by quartiles of normalized grip strength (kg/kg) are listed in Table 1. The baseline characteristics of the participants included in the final analysis and those who were excluded are shown in Supplementary Table S3. This study included 7,258 participants from the CHARLS. The average age of the participants was (58.4 ± 8.9) years, and 47.8% were male (n = 3,470). The mean normalized grip strength was (0.54 ± 0.16) kg/kg, and the mean chair-rising time was (10.6 ± 4.1) s. In terms of glycemic status, 40.7% (n = 2,952) of the participants had NGR, 43.8% (n = 3,178) had Pre-DM, and 15.5% (n = 1,128) had DM.
Characteristics Overall Quartiles of normalized grip strength (kg/kg) P value Q1 (0–0.43) Q2 (0.43–0.54) Q3 (0.54–0.65) Q4 (≥0.65) Participants, n 7,258 1,815 1,814 1,814 1,815 Age, years 58.4 ± 8.9 60.2 ± 9.2 58.5 ± 9.3 57.9 ± 8.7 56.7 ± 8.1 < 0.001 Men, n (%) 3470 (47.8) 332 (18.3) 573 (31.6) 1066 (58.8) 1499 (82.6) < 0.001 Rural residence, n (%) 4824 (66.5) 1169 (64.4) 1165 (64.2) 1196 (65.9) 1294 (71.3) < 0.001 Married, n (%) 6457 (89.0) 1540 (84.8) 1619 (89.3) 1637 (90.2) 1661 (91.5) < 0.001 Educational level, n (%) Elementary school or below 5072 (69.9) 1451 (79.9) 1336 (73.6) 1208 (66.6) 1077 (59.3) < 0.001 Secondary school 1983 (27.3) 339 (18.7) 419 (23.1) 550 (30.3) 675 (37.2) College and above 203 (2.8) 25 (1.4) 59 (3.3) 56 (3.1) 63 (3.5) Lifestyle factors, n (%) Current smoking 2287 (31.6) 250 (13.8) 362 (20.0) 664 (36.7) 1011 (55.9) < 0.001 Current drinking 2513 (34.6) 326 (18.0) 484 (26.7) 756 (41.7) 947 (52.2) < 0.001 Weight (kg) 58.6 ± 11.3 60.7 ± 13.0 59.1 ± 11.0 58.2 ± 11.0 56.2 ± 9.6 < 0.001 BMI (kg/m2) 23.4 ± 3.8 25.3 ± 4.7 24.0 ± 3.4 22.8 ± 3.1 21.5 ± 2.7 < 0.001 Blood pressure (mm Hg) SBP 129 ± 21 132 ± 23 129 ± 21 127 ± 20 125 ± 19 < 0.001 DBP 75 ± 12 76 ± 12 75 ± 12 75 ± 12 74 ± 12 < 0.001 Fasting plasma glucose, mg/dL 109.0 ± 32.4 113.0 ± 38.2 109.4 ± 32.1 108.2 ± 32.1 105.3 ± 25.5 < 0.001 HbA1c, % 5.3 ± 0.8 5.4 ± 0.9 5.3 ± 0.8 5.2 ± 0.7 5.1 ± 0.6 < 0.001 Comorbidities, n (%) Hypertension 2734 (37.7) 865 (47.7) 742 (40.9) 623 (34.3) 504 (27.8) < 0.001 Dyslipidemia 2984 (41.1) 854 (47.1) 805 (44.4) 716 (39.5) 609 (33.6) < 0.001 Glycemic status, n (%) NGR 2952 (40.7) 629 (34.7) 718 (39.6) 797 (43.9) 808 (44.5) < 0.001 Pre-DM 3178 (43.8) 808 (44.5) 818 (45.1) 754 (41.6) 798 (44.0) 0.150 DM 1128 (15.5) 378 (20.8) 278 (15.3) 263 (14.5) 209 (11.5) < 0.001 Medications, n (%) Antidiabetic medications 213 (3.0) 97 (5.4) 51 (2.8) 41 (2.3) 24 (1.3) < 0.001 Antihypertension medications 1139 (15.8) 463 (25.6) 326 (18.0) 214 (11.9) 136 (7.5) < 0.001 Lipid-lowering medications 254 (3.6) 100 (5.6) 77 (4.3) 58 (3.2) 19 (1.1) < 0.001 Normalized grip strength (kg/kg) 0.54 ± 0.16 0.34 ± 0.07 0.48 ± 0.03 0.59 ± 0.03 0.74 ± 0.10 < 0.001 Chair-rising time (s) 10.6 ± 4.1 12.4 ± 5.2 10.7 ± 3.6 10.1 ± 3.4 9.4 ± 3.3 < 0.001 Note. Data are means ± SDs for continuous variables, or numbers (percentages) for categorical variables. The sum of the percentages may not always be 100%, because of rounding. There were 16 missing values for smoking status, 4 for alcohol consumption, 60 for antidiabetic medications, 33 for antihypertensive medications, and 129 for lipid-lowering medications. BMI, body mass index; SBP, systolic blood pressure; DBP, diastolic blood pressure; HbA1c, hemoglobin A1c; NGR, normal glucose regulation; Pre-DM, prediabetes; DM, diabetes mellitus. Table 1. Baseline characteristics of participants stratified by quartiles of normalized grip strength
Participants in higher quartiles of normalized grip strength (kg/kg) were younger, had significantly lower body weight, BMI, SBP, DBP, FPG, HbA1c, and chair-rising time, and had a lower incidence of DM, hypertension, dyslipidemia, and medication use (all P < 0.001). They also included a greater proportion of men, rural residents, married individuals, individuals with secondary school or higher education, smokers, and drinkers (all P < 0.001). As shown in Supplementary Table S4, the participants with shorter chair-rising times exhibited similar trends across most characteristics.
-
During a mean follow-up of 7.8 years, 1,785 (24.6%) incident CVD events were documented. As shown in Supplementary Figure S1, Kaplan–Meier analysis demonstrated a progressive increase in CVD incidence across the lower quartiles of normalized grip strength (log-rank P < 0.0001; Supplementary Figure S1A) and, conversely, across the higher quartiles of chair-rising time (log-rank P < 0.0001; Supplementary Figure S1B). The Cox proportional hazards models indicated that both lower normalized grip strength and longer chair-rising time were significantly associated with an elevated risk of new-onset CVD (Table 2). After full adjustment (Model 3), normalized grip strength showed a significant inverse association with CVD risk (P for trend < 0.001), with the lowest quartile (Q1) associated with a 37% increased risk (HR = 1.37; 95% CI: 1.17–1.61) compared with the highest quartile (Q4). With respect to chair-rising time, a positive dose-response relationship was observed (P for trend < 0.001), with the highest quartile (Q4) conferring a 53% higher risk (HR = 1.53; 95% CI: 1.32–1.77) than the lowest (Q1). Sensitivity analyses using BMI-normalized grip strength, excluding cardiovascular events occurring within the first two years of follow-up, applying multiple imputations for missing covariates, stratifying by sex with sex-specific quartiles, and additionally adjusting for hs-CRP yielded results consistent with those of the primary analysis (Supplementary Table S5–S9).
Variables Total no. of participants No. of CVD cases/ person-years Incidence rate per 1000 person-years HR (95% CI) Model 1 Model 2 Model 3 Normalized grip strength (kg/kg) Q1 (0–0.43) 1,815 562/13,768 40.8 1.54 (1.32–1.80) 1.56 (1.34–1.82) 1.37 (1.17–1.61) Q2 (0.43–0.54) 1,814 471/14,084 33.4 1.32 (1.14–1.53) 1.34 (1.15–1.55) 1.22 (1.04–1.42) Q3 (0.54–0.65) 1,814 403/14,306 28.2 1.13 (0.98–1.31) 1.14 (0.98–1.32) 1.08 (0.94–1.26) Q4 (≥ 0.65) 1,815 349/14,493 24.1 1 (ref.) 1 (ref.) 1 (ref.) P for trend < 0.001 < 0.001 < 0.001 Chair-rising time (s) Q1 (0–8.00) 1,806 327/14,588 22.4 1 (ref.) 1 (ref.) 1 (ref.) Q2 (8.00–10.00) 1,817 430/14,404 29.9 1.26 (1.09–1.46) 1.25 (1.09–1.45) 1.23 (1.07–1.43) Q3 (10.00–12.36) 1,822 472/14,149 33.4 1.35 (1.17–1.56) 1.36 (1.17–1.57) 1.33 (1.15–1.53) Q4 (≥ 12.36) 1,813 556/13,509 41.2 1.58 (1.37–1.82) 1.57 (1.36–1.81) 1.53 (1.32–1.77) P for trend < 0.001 < 0.001 < 0.001 Note. Covariates were adjusted for in sequentially nested models: Model 1: age and sex. Model 2: Model 1 covariates plus residence, marital status, education, smoking status, alcohol consumption, and BMI (for chair-rising time analysis). Model 3: Model 2 covariates plus hypertension, dyslipidemia, and glycemic status. CVD, cardiovascular disease; HR, hazard ratio; CI, confidence interval; BMI, body mass index. Table 2. Associations of normalized grip strength and chair-rising time with the risk of incident CVD
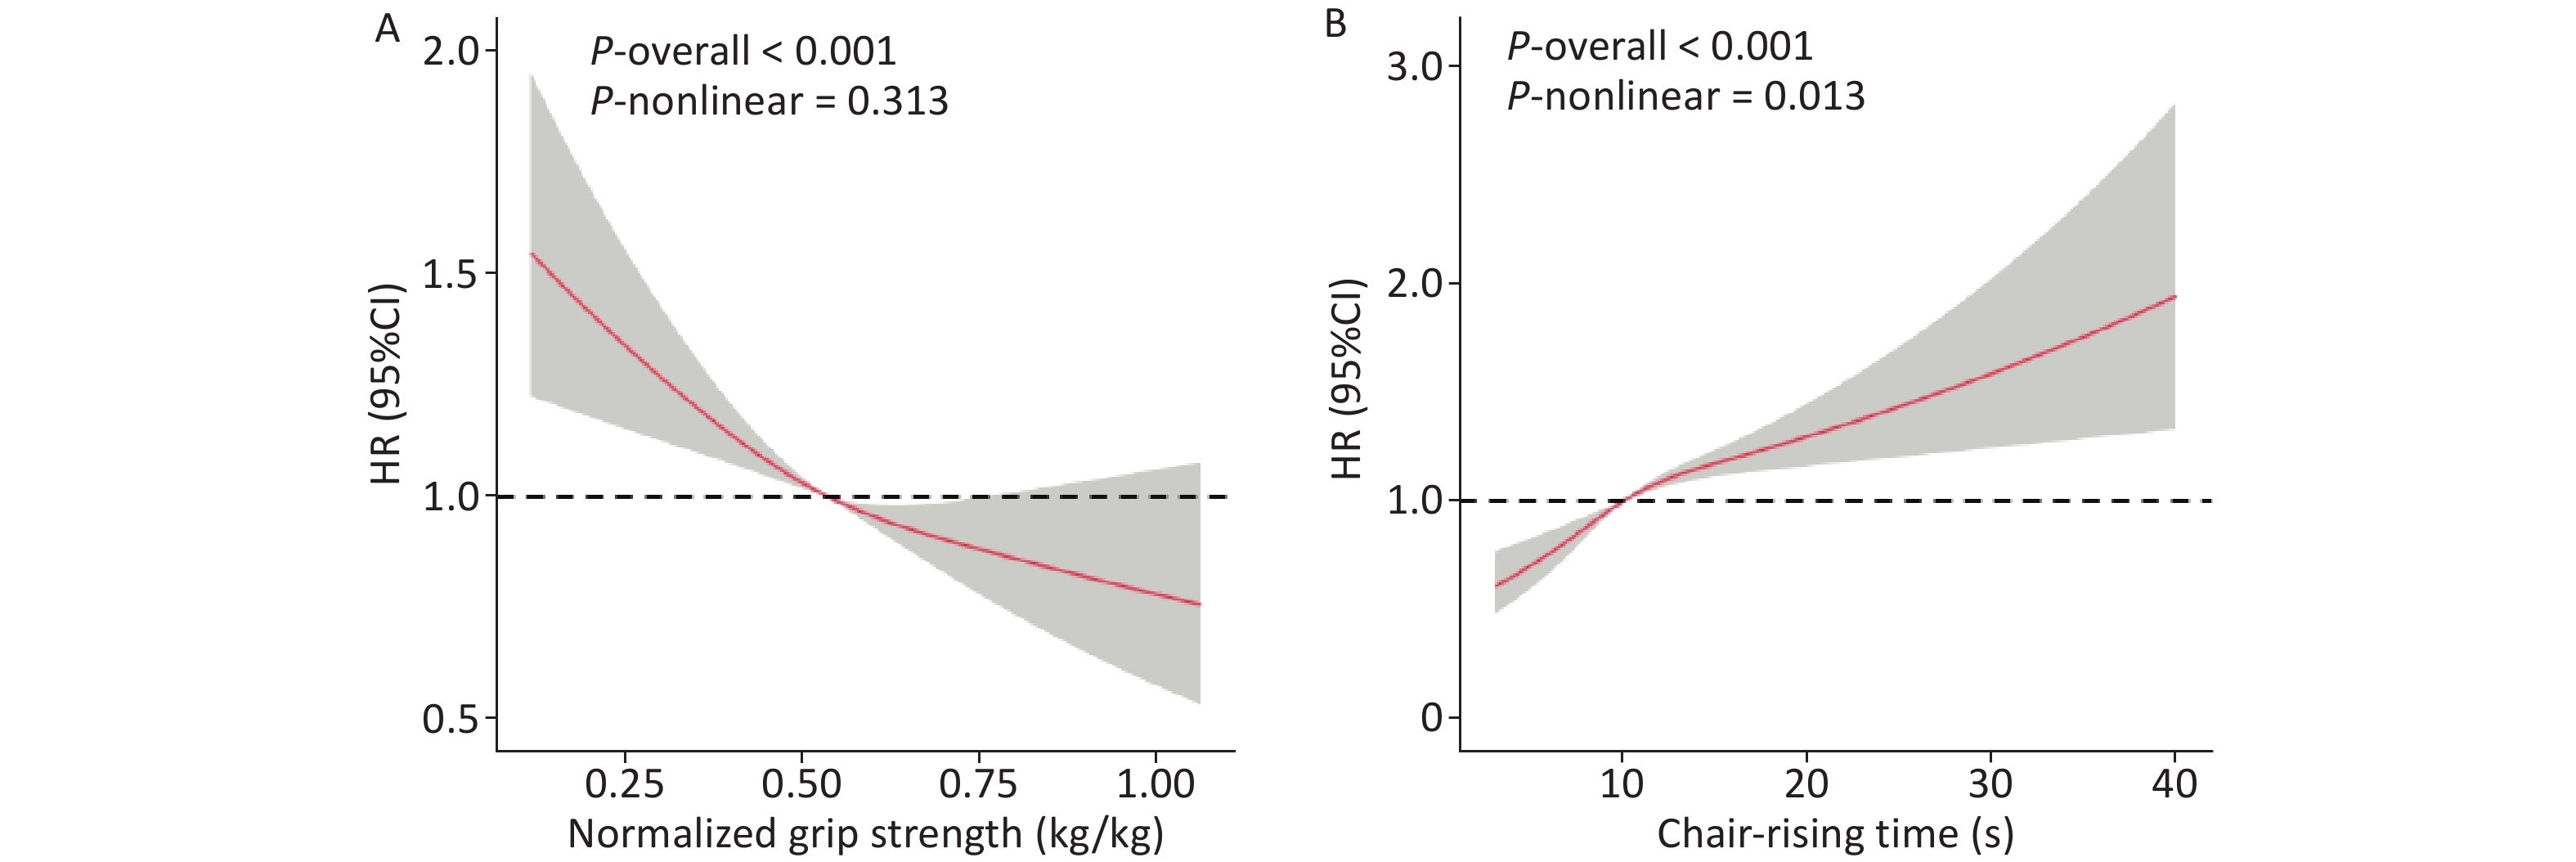
We further examined these associations using RCS. A linear and inverse relationship was observed for normalized grip strength (P-overall < 0.001; P-nonlinear = 0.313) (Figure 2A), whereas chair-rising time exhibited a nonlinear, positive association with CVD risk (P-overall < 0.001; P-nonlinear = 0.013) (Figure 2B), following adjustment for all potential confounders.
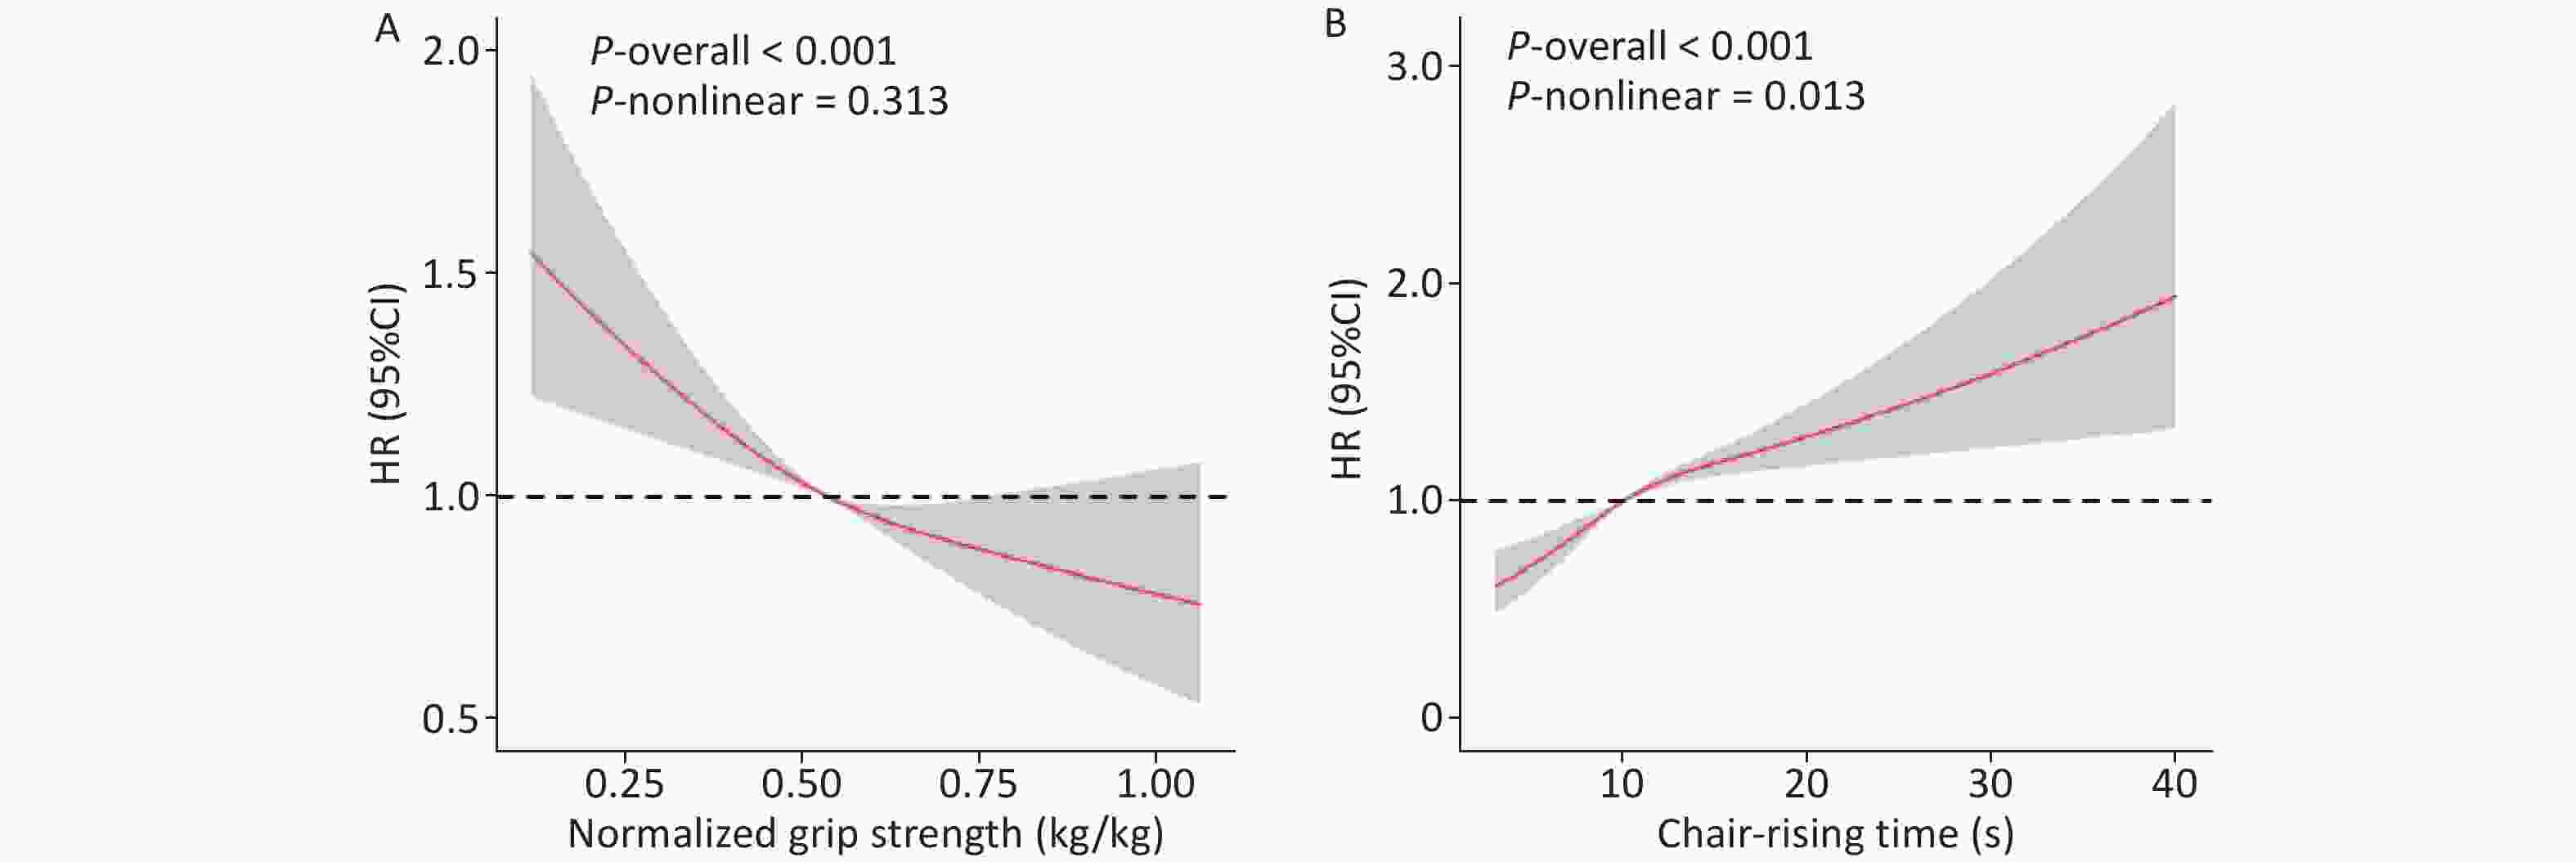
Figure 2. Dose-response relationships between normalized grip strength and chair-rising time and incident CVD risk. Restricted cubic spline plots showing the multivariable-adjusted association of (A) normalized grip strength and (B) chair-rising time with the hazard ratio of incident CVD. Thick red lines indicate hazard ratio (HR) estimates, with shaded areas indicating 95% CI. The model was adjusted for age, sex, residence, marital status, education, smoking status, alcohol consumption status, BMI (for chair-rising time analysis), hypertension, dyslipidemia, and glycemic status.
-
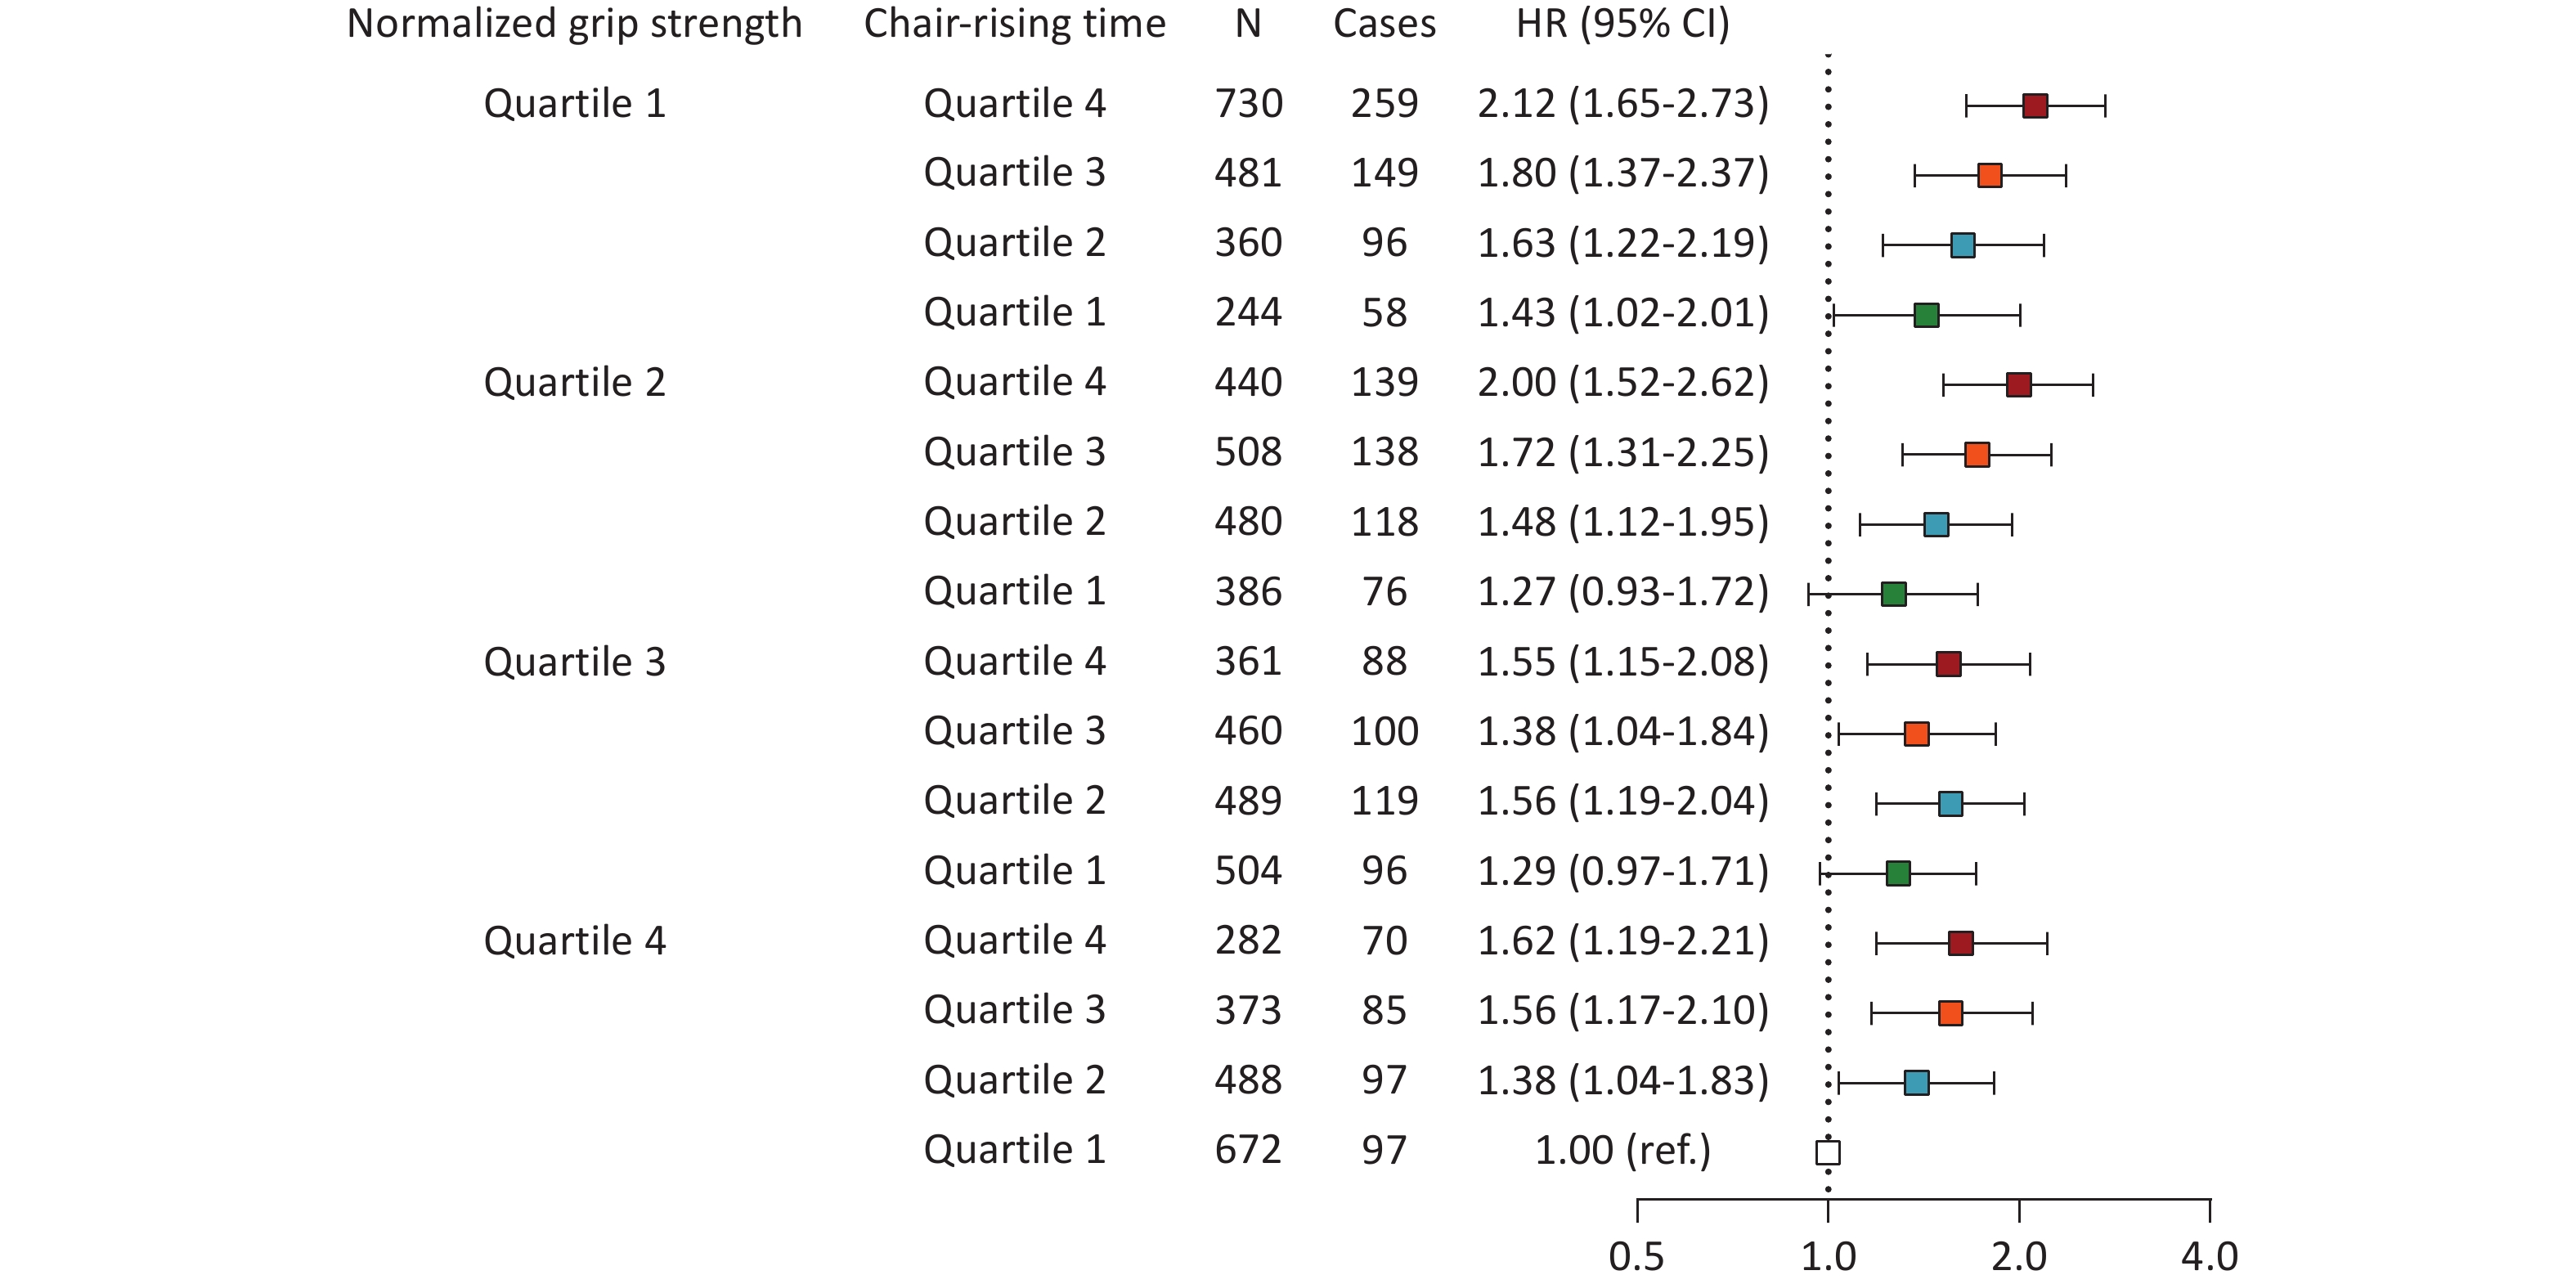
The additive effects of normalized grip strength and chair-rising time on the incidence is shown in Figure 3. The risk was synergistically increased when low grip strength and prolonged chair-rising times were observed. Specifically, the combination of the lowest grip strength (Q1) and the longest chair-rising time (Q4) was associated with the greatest magnitude of risk, more than doubling the incidence of CVD (HR = 2.12; 95% CI, 1.65–2.73) relative to the reference group (Q4 for grip strength and Q1 for chair-rising time).
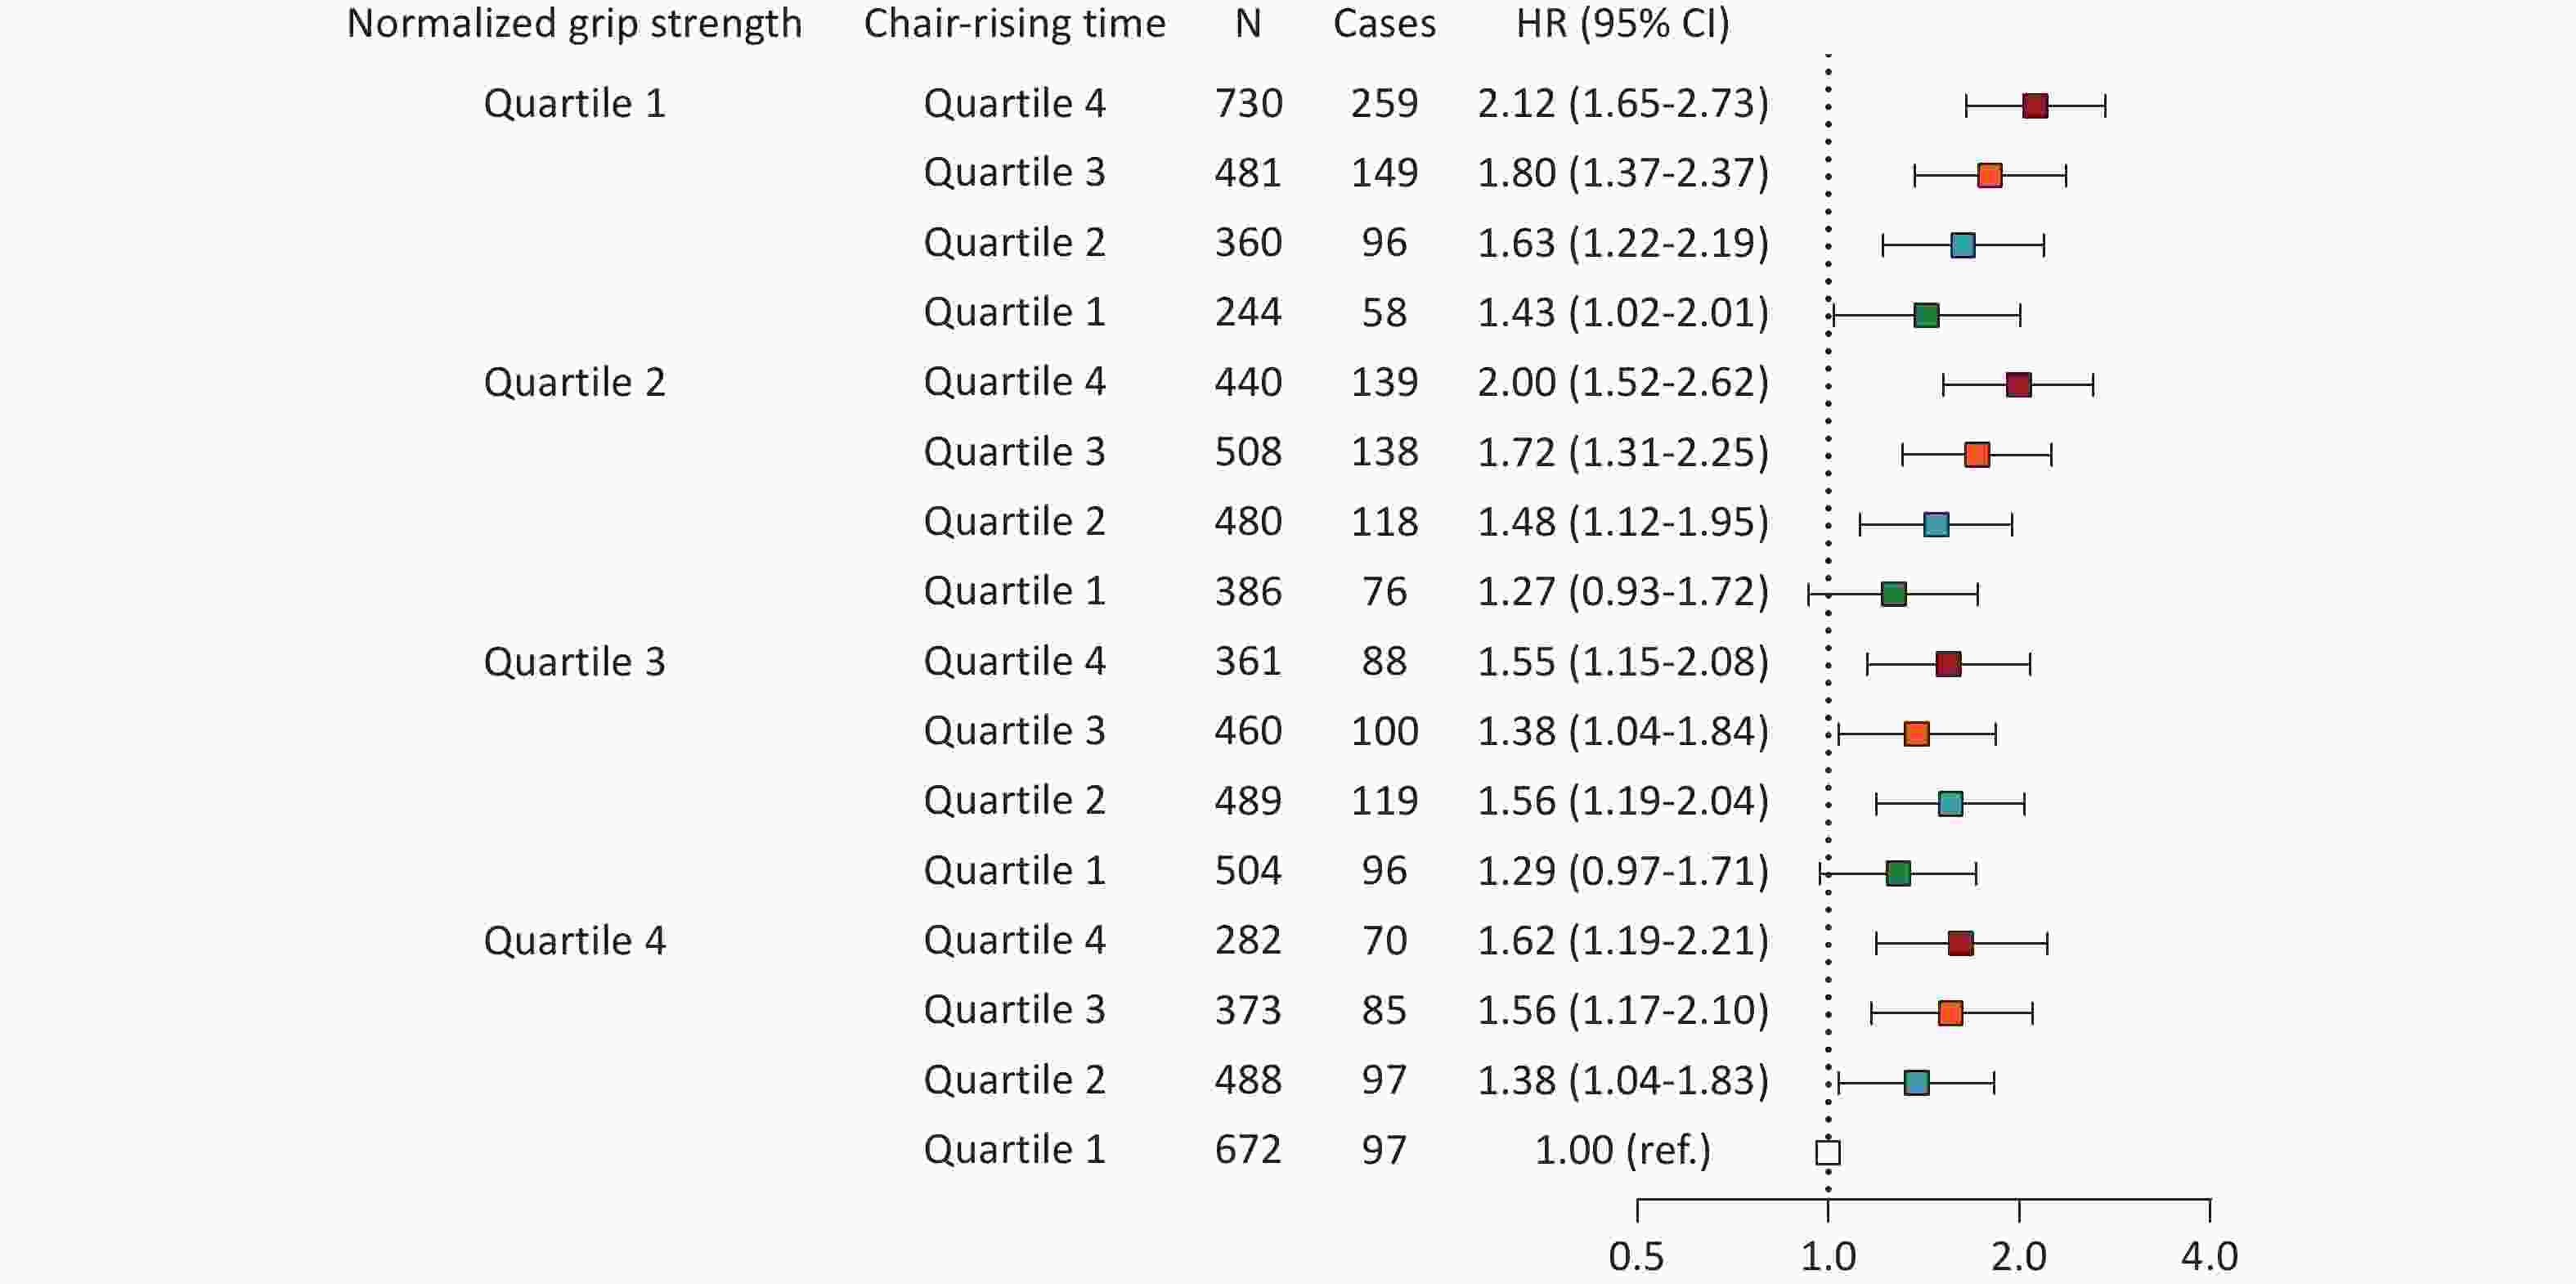
Figure 3. Synergistic effect of low grip strength and prolonged chair-rising time on CVD incidence. The model was adjusted for age, sex, residence, marital status, education, smoking status, alcohol consumption, hypertension, dyslipidemia, and glycemic status. HR, hazard ratio; CI, confidence interval. N: sample size per group. Cases: number of incident CVD cases during follow-up.
-
The associations of normalized grip strength and chair-rising time with incident CVD risk according to the glycemic status are presented in Table 3. After full adjustment, a significant inverse trend was observed between normalized grip strength and CVD risk in individuals with NGR (P for trend < 0.05) and those with Pre-DM (P for trend < 0.05), but not in those with DM (P for trend > 0.05). Specifically, compared with the highest quartile (Q4), the lowest quartile (Q1) of normalized grip strength was associated with a 33% higher risk of CVD in the NGR group (HR = 1.33; 95% CI: 1.03–1.72) and a 38% higher risk in the Pre-DM group (HR = 1.38; 95% CI: 1.10–1.75); a similar but non-significant trend was observed in the DM group (HR = 1.41; 95% CI: 0.94–2.12).
Variables NGR Pre-DM DM Normalized grip strength (kg/kg) Incidence rate per 1000 person-years HR (95% CI) Incidence rate per 1000 person-years HR (95% CI) Incidence rate per 1000 person-years HR (95% CI) Q1 (0–0.43) 37.5 1.33 (1.03–1.72) 41.0 1.38 (1.10–1.75) 46.1 1.41 (0.94–2.12) Q2 (0.43–0.54) 29.8 1.14 (0.90–1.46) 35.0 1.25 (1.00–1.57) 38.7 1.35 (0.90–2.03) Q3 (0.54–0.65) 25.8 1.01 (0.81–1.27) 29.1 1.11 (0.89–1.39) 32.6 1.26 (0.84–1.88) Q4 (≥ 0.65) 24.4 1 (ref.) 23.7 1 (ref.) 24.3 1 (ref.) P for trend 0.016 0.004 0.127 Chair-rising time (s) Q1 (0–8.00) 21.5 1 (ref.) 22.0 1 (ref.) 26.9 1 (ref.) Q2 (8.00–10.00) 27.2 1.17 (0.93–1.49) 31.7 1.33 (1.07–1.65) 31.4 1.12 (0.79–1.60) Q3 (10.00–12.36) 28.8 1.19 (0.94–1.50) 35.2 1.41 (1.14–1.75) 40.3 1.40 (0.99–1.99) Q4 (≥ 12.36) 38.4 1.43 (1.14–1.80) 41.1 1.56 (1.25–1.94) 48.5 1.71 (1.21–2.42) P for trend 0.003 < 0.001 < 0.001 Note. The model for normalized grip strength was adjusted for age, sex, residence, marital status, education, smoking status, alcohol consumption status, hypertension status, and dyslipidemia status for all participants, with adjustments for antidiabetic medications applied exclusively to the DM stratum. The model for chair-rising time was adjusted for age, sex, residence, marital status, education, smoking status, alcohol consumption status, BMI, hypertension status, and dyslipidemia status for all participants, with adjustments for antidiabetic medications applied exclusively to the DM stratum. CVD, cardiovascular disease; NGR, normal glucose regulation; Pre-DM, prediabetes; DM, diabetes mellitus; HR, hazard ratio; CI, confidence interval. Table 3. HRs (95% CIs) of CVD events associated with normalized grip strength or chair-rising time according to glycemic status
In contrast, a longer chair-rising time was associated with an increased CVD risk across all glycemic status groups, with P for trend < 0.05 in each stratum. Compared with the shortest chair-rising time (Q1), the fully adjusted HR for the longest quartile (Q4) was 1.43 (95% CI: 1.14–1.80) in the NGR group, 1.56 (95% CI: 1.25–1.94) in the Pre-DM group, and 1.71 (95% CI: 1.21–2.42) in the DM group. The exclusion of participants with self-reported diabetes yielded similar results (Supplementary Table S10).
However, no significant interaction was found between glycemic status and normalized grip strength (P for interaction = 0.622) or chair-rising time (P for interaction = 0.824) with respect to CVD risk.
-
In this nationwide prospective cohort of middle-aged and older Chinese adults, we found that (a) reduced muscle strength, indicated by low normalized grip strength or prolonged chair-rising time, was associated with an elevated risk of CVD in a dose-dependent manner; (b) individuals exhibiting both the lowest normalized grip strength and the slowest chair-rising time had the highest CVD risk; and (c) lower muscle strength was associated with a higher CVD risk across all glycemic status groups (NGR, Pre-DM, and DM). Collectively, these findings indicate that grip strength and chair-rising time are simple, reliable, and cost-effective measures for stratifying the risk of CVD in clinical and public health practice.
Although previous studies have established an association between muscle strength (primarily assessed by grip strength) and CVD risk[3,4,25,26], evidence regarding the relationship between chair-rising time (another key indicator of muscle function) and new-onset CVD remains limited. Our findings confirmed that both lower normalized grip strength and prolonged chair-rising time were significantly associated with an elevated CVD risk. This partially aligns with a meta-analysis of 42 cohort studies (n = 3,002,203), which reported a pooled HR of 1.21 (95% CI: 1.14–1.29) for CVD per 5-kg reduction in grip strength[26]. Importantly, our study extends the current observational evidence by demonstrating that a prolonged chair-rising time is independently associated with a higher risk of CVD during follow-up. Moreover, RCS analyses revealed distinct dose-response relationships: a gradual, inverse association between grip strength and CVD risk, and a nonlinear, positive association with chair-rising time.
In addition, we identified a synergistic effect, whereby the combination of lower grip strength and prolonged chair-rising time additively increased the risk of CVD. Despite the limited number of prospective studies that have concurrently assessed both measures of muscle strength[10,27], only one has focused on the risk of new-onset CVD[22]. Notably, the first two studies investigated the risk of diabetes[10] and cardiometabolic multimorbidity (CM) [27]. In contrast, the other study[22] focused solely on the individual effects of cumulative grip strength and chair-rising time on CVD risk. Furthermore, they did not examine their joint association with the incidence of CVD, an analysis that could yield more comprehensive insights. We hypothesized a synergistic effect of low grip strength and prolonged chair-rising time on CVD risk, such that their combined effect exceeds the sum of their individual effects. To address this gap, the joint association of grip strength and chair-rising time with CVD incidence was investigated in this study. The findings demonstrated that the combination of the lowest grip strength and longest chair-rising time was associated with a more than two-fold increase in CVD risk.
Our study further indicated that lower muscle strength was associated with a higher incidence of CVD across all glycemic status groups (NGR, Pre-DM, and DM). Specifically, the association with lower grip strength was statistically significant in the NGR and Pre-DM groups, with a similar point estimate observed in the DM group. Prolonged chair-rising times showed statistically significant associations in all three groups. The lack of significant association between grip strength and CVD risk in patients with DM may be attributed to several factors. A key factor is that CVD risk increases with worsening glycemic control[28]. This is supported by evidence indicating a linear and significant association between FPG levels and CVD risk across the entire concentration range[29]. Thus, the powerful direct effect of chronic hyperglycemia on CVD risk may obscure the modest association with grip strength. Another consideration is that grip strength primarily reflects upper limb muscular function[30] and may be less sensitive to the systemic functional decline that underlies CVD risk in the DM population. In contrast, chair-rising time is a composite measure that integrates lower limb strength, balance, and coordination, domains that are more directly linked to overall physical resilience and vascular health[31]. This integration may preserve the prognostic value even in high-risk subgroups. Therefore, these functional measures are complementary and not interchangeable for the assessment of CVD risk.
Our findings underscore the significant role of muscle strength in the prevention of CVD, which has important implications for public health and clinical practice. Accordingly, middle-aged and older Chinese adults should aim to achieve and maintain optimal muscle strength to mitigate the risk of CVD. This can be effectively achieved through well-designed exercise interventions, particularly resistance training. For instance, the 2011 American College of Sports Medicine's (ACSM) guidelines recommend performing strength training at least twice weekly on nonconsecutive days[32]. This recommendation is corroborated by the empirical evidence. A previous randomized controlled trial demonstrated that frail elderly individuals significantly increased their handgrip strength following resistance training at both low and high intensities, conducted three days per week over an eight-week period[33]. Furthermore, a meta-analysis revealed that structured exercise programs can effectively support muscle function in elderly adults with sarcopenia, reinforcing their value in the daily routine[34]. Therefore, for early prevention of CVD, clinicians are encouraged to assess muscle strength and routinely monitor traditional risk factor levels.
This study offers significant strengths in its design and scope; it not only leveraged a large, nationally representative longitudinal cohort with comprehensive muscle strength assessment covering both the upper and lower limbs but also provided, to our knowledge, the first investigation into the longitudinal joint association of combined muscle strength with incident CVD in this population. Additionally, our analysis used normalized grip strength, which directly reflects relative muscle strength and, importantly, adjusts for body size, which is a key methodological advantage that enhances the comparability of our results. Furthermore, we systematically explored the association between muscle strength and CVD risk across the glycemic status groups (NGR, Pre-DM, and DM), maintaining a comprehensive adjustment for potential confounders. However, this study has several limitations. First, its observational design precludes definitive conclusions regarding the causality between muscle strength and CVD risk, necessitating further validation. Second, data on physician-diagnosed heart disease and stroke were self-reported, which are subject to potential recall and information bias. Third, despite adjusting for a wide range of known confounders, residual confounding from unmeasured factors (e.g., nutritional status[35] and physical fitness[36,37]) cannot be ruled out. Finally, because the study population exclusively consisted of middle-aged and older Chinese adults, the generalizability of our findings to other ethnicities or age groups may be limited.
-
In conclusion, our study demonstrated that low muscle strength, as indicated by either low grip strength or prolonged chair-rising time, was significantly associated with the risk of incident CVD in a dose-dependent manner. The highest risk was observed among individuals with the weakest grip strength and slowest chair-rising time. Furthermore, lower grip strength and prolonged chair-rising time were both associated with increased CVD risk across all glycemic status groups (NGR, Pre-DM, and DM), although not all strata reached statistical significance. Our findings provide evidence for the effects of low muscle strength on the risk of CVD, highlighting the importance of maintaining optimal muscle strength in middle-aged and older adults to reduce the risk of CVD.
HTML
Study Design and Participants
Covariates
Assessment of Muscle Strength
Ascertainment of Incident CVD
Statistical Analysis
Baseline Characteristics of the Study Participants
Associations of Normalized Grip Strength and Chair-Rising Time with Incident CVD Risk
Joint Effect of Normalized Grip Strength and Chair-Rising Time on Incident CVD Risk
Associations between Normalized Grip Strength and Chair-Rising Time and Incident CVD Risk According to Glycemic Status
Competing Interest The funding sources of this study had no role in study design, data collection and analysis, decision to publish, or preparation of the article.
Ethics Ethical approval for the CHARLS was obtained from the Institutional Review Board of Peking University (approval number: IRB00001052–11015). Informed consent was obtained from all subjects involved in the study.
Authors’ Contributions Design: Ling Li, Weijia Wu, Ping Yu, Yuwen Zhang, and Xiaolan Bian. Data curation: Weijia Wu, Yanan Hou, Long Wang, Ping Yu, and Yuwen Zhang. Quality control: Ling Li, Weijia Wu, Ping Yu, Yuwen Zhang, and Xiaolan Bian. Data analysis and writing: Ling Li, Weijia Wu, Ping Yu, Yuwen Zhang, and Xiaolan Bian. Data interpretation: Yanan Hou and Long Wang. Data verification: Ping Yu, Yuwen Zhang, and Xiaolan Bian. Manuscript review and comments: Ling Li, Weijia Wu, Ping Yu, Yuwen Zhang, and Xiaolan Bian. All the authors have reviewed and approved the final manuscript.
Availability of Data and Materials The data underlying this article will be shared on reasonable request to the corresponding author. The supplementary materials will be available in www.besjournal.com.
Consent for Publication All authors consent this work for publication.
&These authors contributed equally to this work.

 Quick Links
 DownLoad: