
-
Low birth weight (LBW), defined as a birth weight < 2,500 g, remains an important adverse birth outcome associated with short- and long-term health risks[1]. Residential surrounding greenness, commonly assessed using the normalized difference vegetation index (NDVI), has been proposed as a potentially modifiable environmental factor related to fetal growth. However, previous findings remain inconsistent across populations, exposure metrics, spatial buffers, and adjustment strategies[2,3]. Therefore, this study examined the association between pregnancy-period residential surrounding greenness and LBW in a prospective multicenter maternal-infant cohort in China.
This prospective cohort study included 5,456 pregnant women recruited from 12 participating hospitals between 2023 and 2024, among whom 151 LBW cases were identified. Residential addresses recorded at baseline were geocoded, and the mean NDVI within a 500-m residential buffer (NDVImean-500m) during pregnancy was used as the main exposure. NDVImean-500m was categorized into quartiles, with the first quartile (Q1) representing the lowest exposure group and serving as the reference; the second, third, and fourth quartiles were denoted as Q2, Q3, and Q4, respectively. Logistic regression models were used to estimate odds ratios (ORs) and 95% confidence intervals (CIs) after adjusting for maternal age, residential area, education level, smoking during pregnancy, prepregnancy body mass index (BMI), parity, mode of conception, multiple pregnancies, and gestational age at delivery. Restricted cubic spline (RCS) analysis, sensitivity analysis using the continuous NDVImean-1000m, subgroup analyses, and a brief supplementary meta-analysis were performed to assess the robustness and consistency of the findings.
After applying the eligibility criteria and excluding records with missing key data, a total of 5,456 pregnant women were included in the final analysis. Infants with a birth weight ≥ 4,000 g were not included in the normal birth weight reference group. Among them, 151 delivered infants with LBW, and the incidence of LBW was 2.77%. The remaining 5,305 participants delivered infants with normal birth weight, defined as birth weight ≥ 2,500 g and < 4,000 g. Baseline characteristics differed significantly between the LBW and normal birth weight groups in terms of ethnicity, residence, prepregnancy BMI, parity, multiple pregnancy, assisted reproduction, gestational age at delivery, and maternal delivery weight. No significant differences were observed in maternal age, education level, gravidity, smoking or alcohol consumption during pregnancy, neonatal sex, mode of delivery, or neonatal length (P > 0.05) (Table 1).
Variable Category LBW (n = 151), n (%) Normal birth weight (n = 5305), n (%) P value Maternal age-group ≤ 35 years 137 (90.7) 4967 (93.6) 0.207 > 35 years 14 (9.3) 338 (6.4) Ethnicity Han 140 (92.7) 4583 (86.4) 0.033 Minority 11 (7.3) 722 (13.6) Education level Primary school 24 (15.9) 1245 (23.5) 0.12 Junior middle school 27 (17.9) 997 (18.8) Senior high school 32 (21.2) 1058 (19.9) College or above 68 (45.0) 2005 (37.8) Residence Rural 16 (10.6) 1233 (23.2) < 0.001 Urban 135 (89.4) 4072 (76.8) Prepregnancy BMI group < 18.5 kg/m² 26 (17.2) 517 (9.7) 0.008 18.5–23.9 kg/m² 92 (60.9) 3245 (61.2) 24.0–27.9 kg/m² 21 (13.9) 1141 (21.5) ≥ 28.0 kg/m² 12 (7.9) 402 (7.6) Gravidity 0 14 (9.3) 496 (9.3) 1 ≥ 1 137 (90.7) 4809 (90.7) Parity 0 92 (60.9) 2536 (47.8) 0.002 ≥ 1 59 (39.1) 2769 (52.2) Smoking during pregnancy Yes 2 (1.3) 30 (0.6) 0.507 No 149 (98.7) 5275 (99.4) Alcohol consumption during pregnancy Yes 3 (2.0) 162 (3.1) 0.607 No 148 (98.0) 5143 (96.9) Multiple pregnancy Yes 18 (11.9) 41 (0.8) < 0.001 No 133 (88.1) 5264 (99.2) Assisted reproduction Yes 22 (14.6) 273 (5.1) < 0.001 No 129 (85.4) 5032 (94.9) Neonatal sex Male 70 (46.4) 2726 (51.4) 0.256 Female 81 (53.6) 2579 (48.6) Mode of delivery Vaginal delivery 76 (50.3) 3047 (57.4) 0.098 Cesarean section 75 (49.7) 2258 (42.6) Gestational age at delivery < 37 weeks 40 (26.5) 203 (3.8) <0.001 ≥ 37 weeks 111 (73.5) 5102 (96.2) Neonatal length, median (interquartile range [IQR]), cm 48.00 (4.00) 48.00 (5.00) 0.598 Maternal delivery weight, median (interquartile range [IQR]), kg 70.00 (11.79) 72.43 (12.70) < 0.001 Note. LBW, low birth weight; BMI, body mass index; IQR, interquartile range. Percentages may not sum to 100.0% because of rounding. Table 1. Baseline characteristics by birth weight group
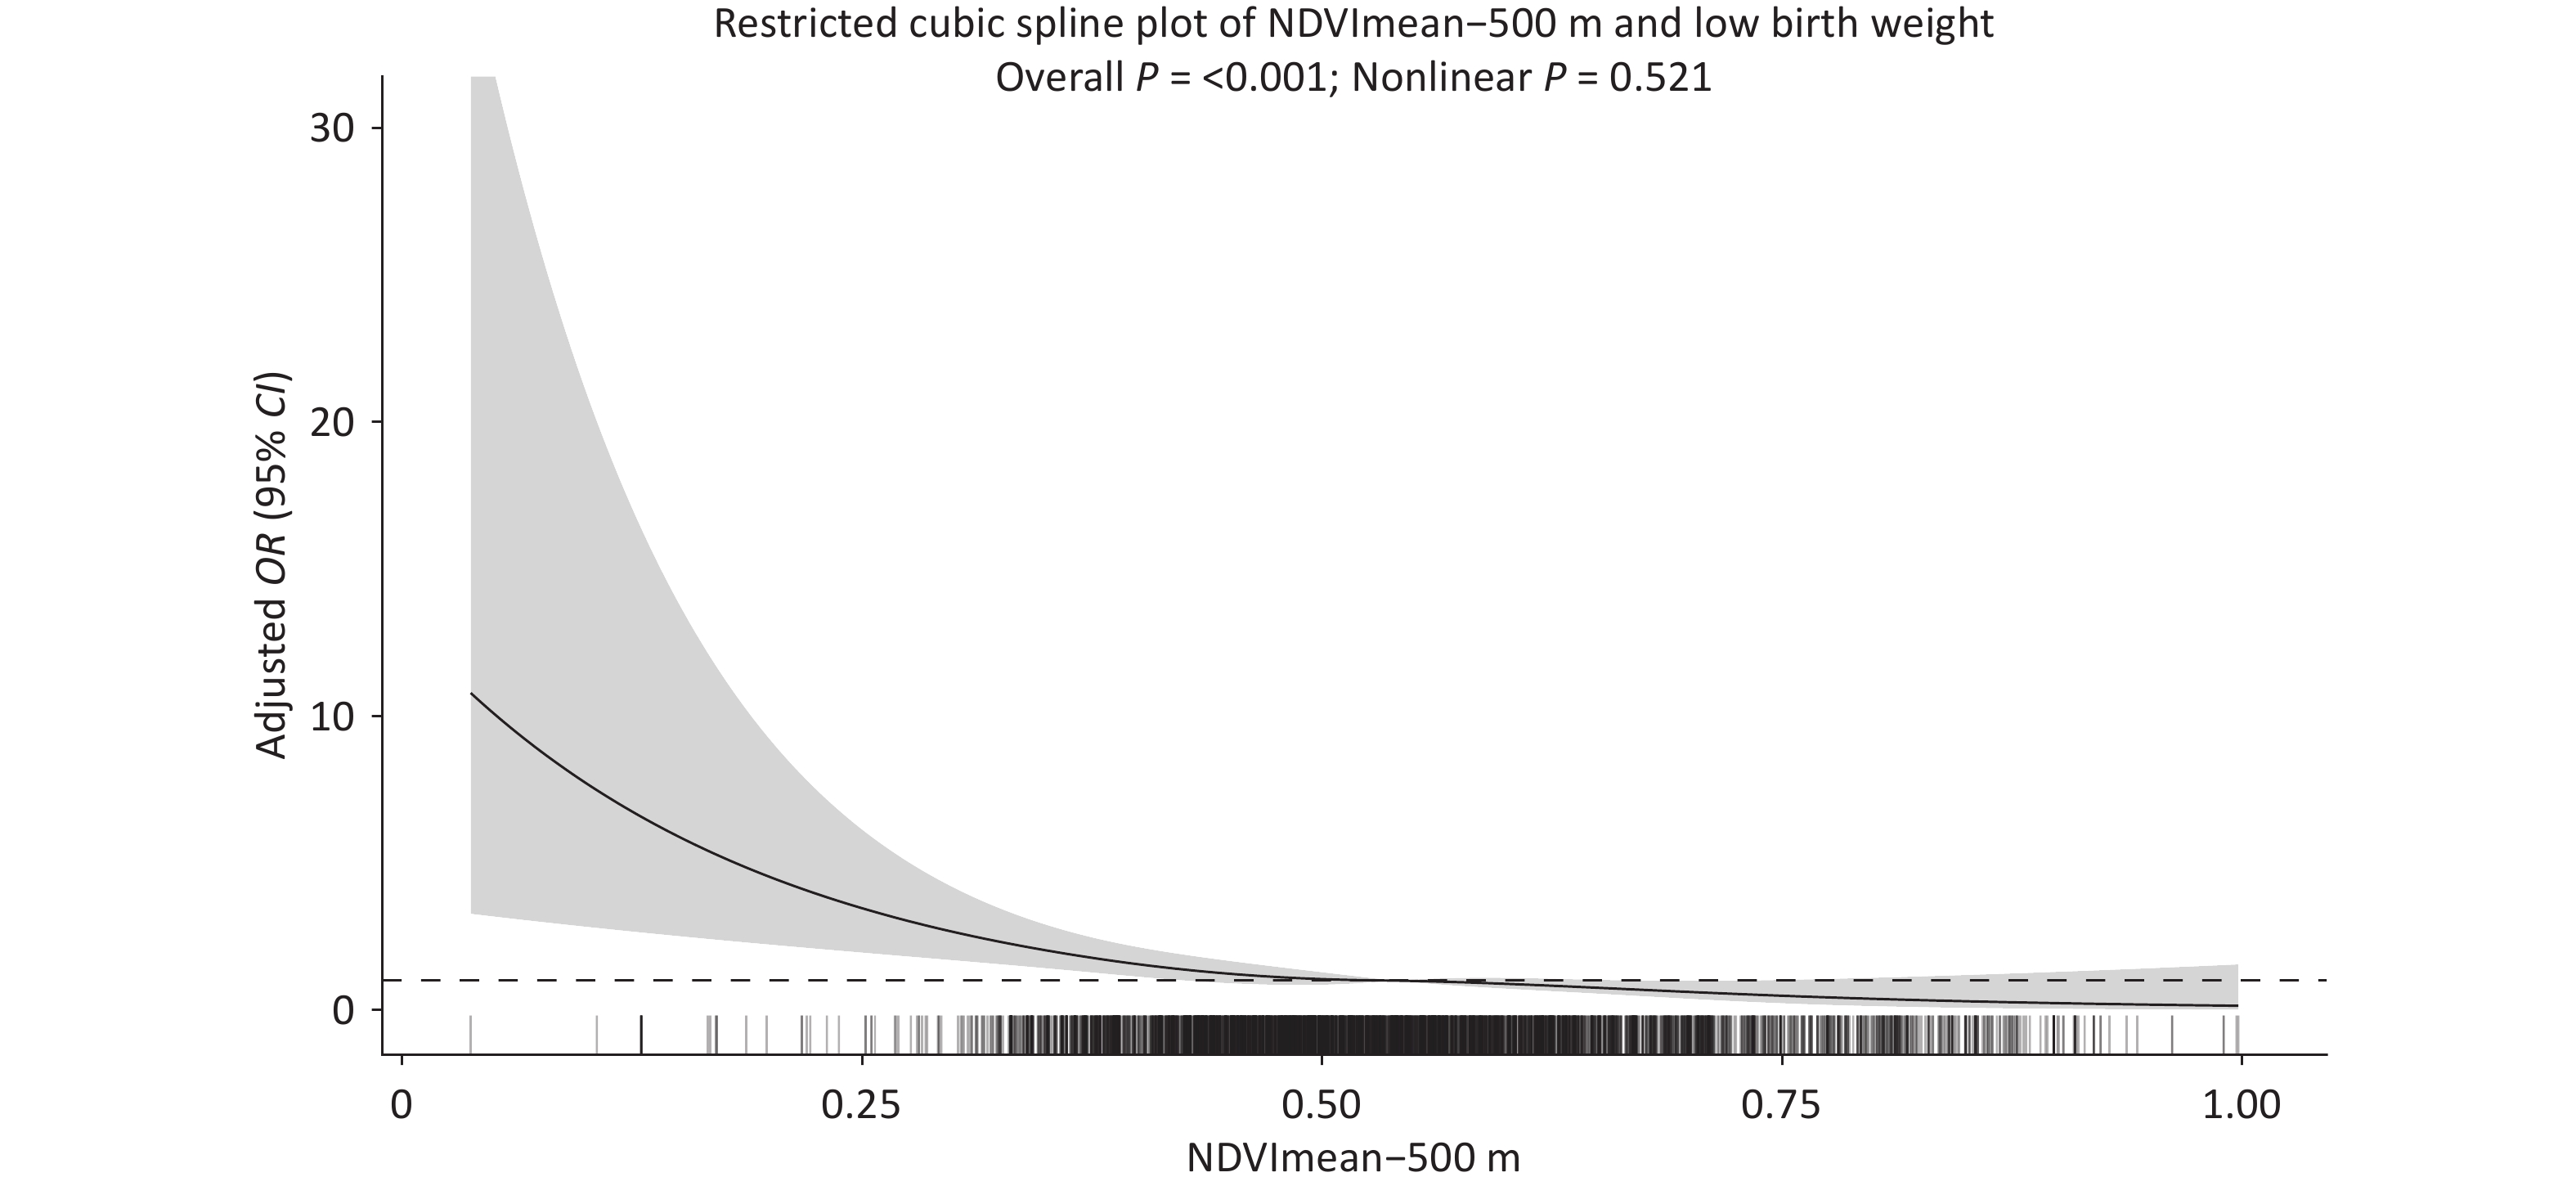
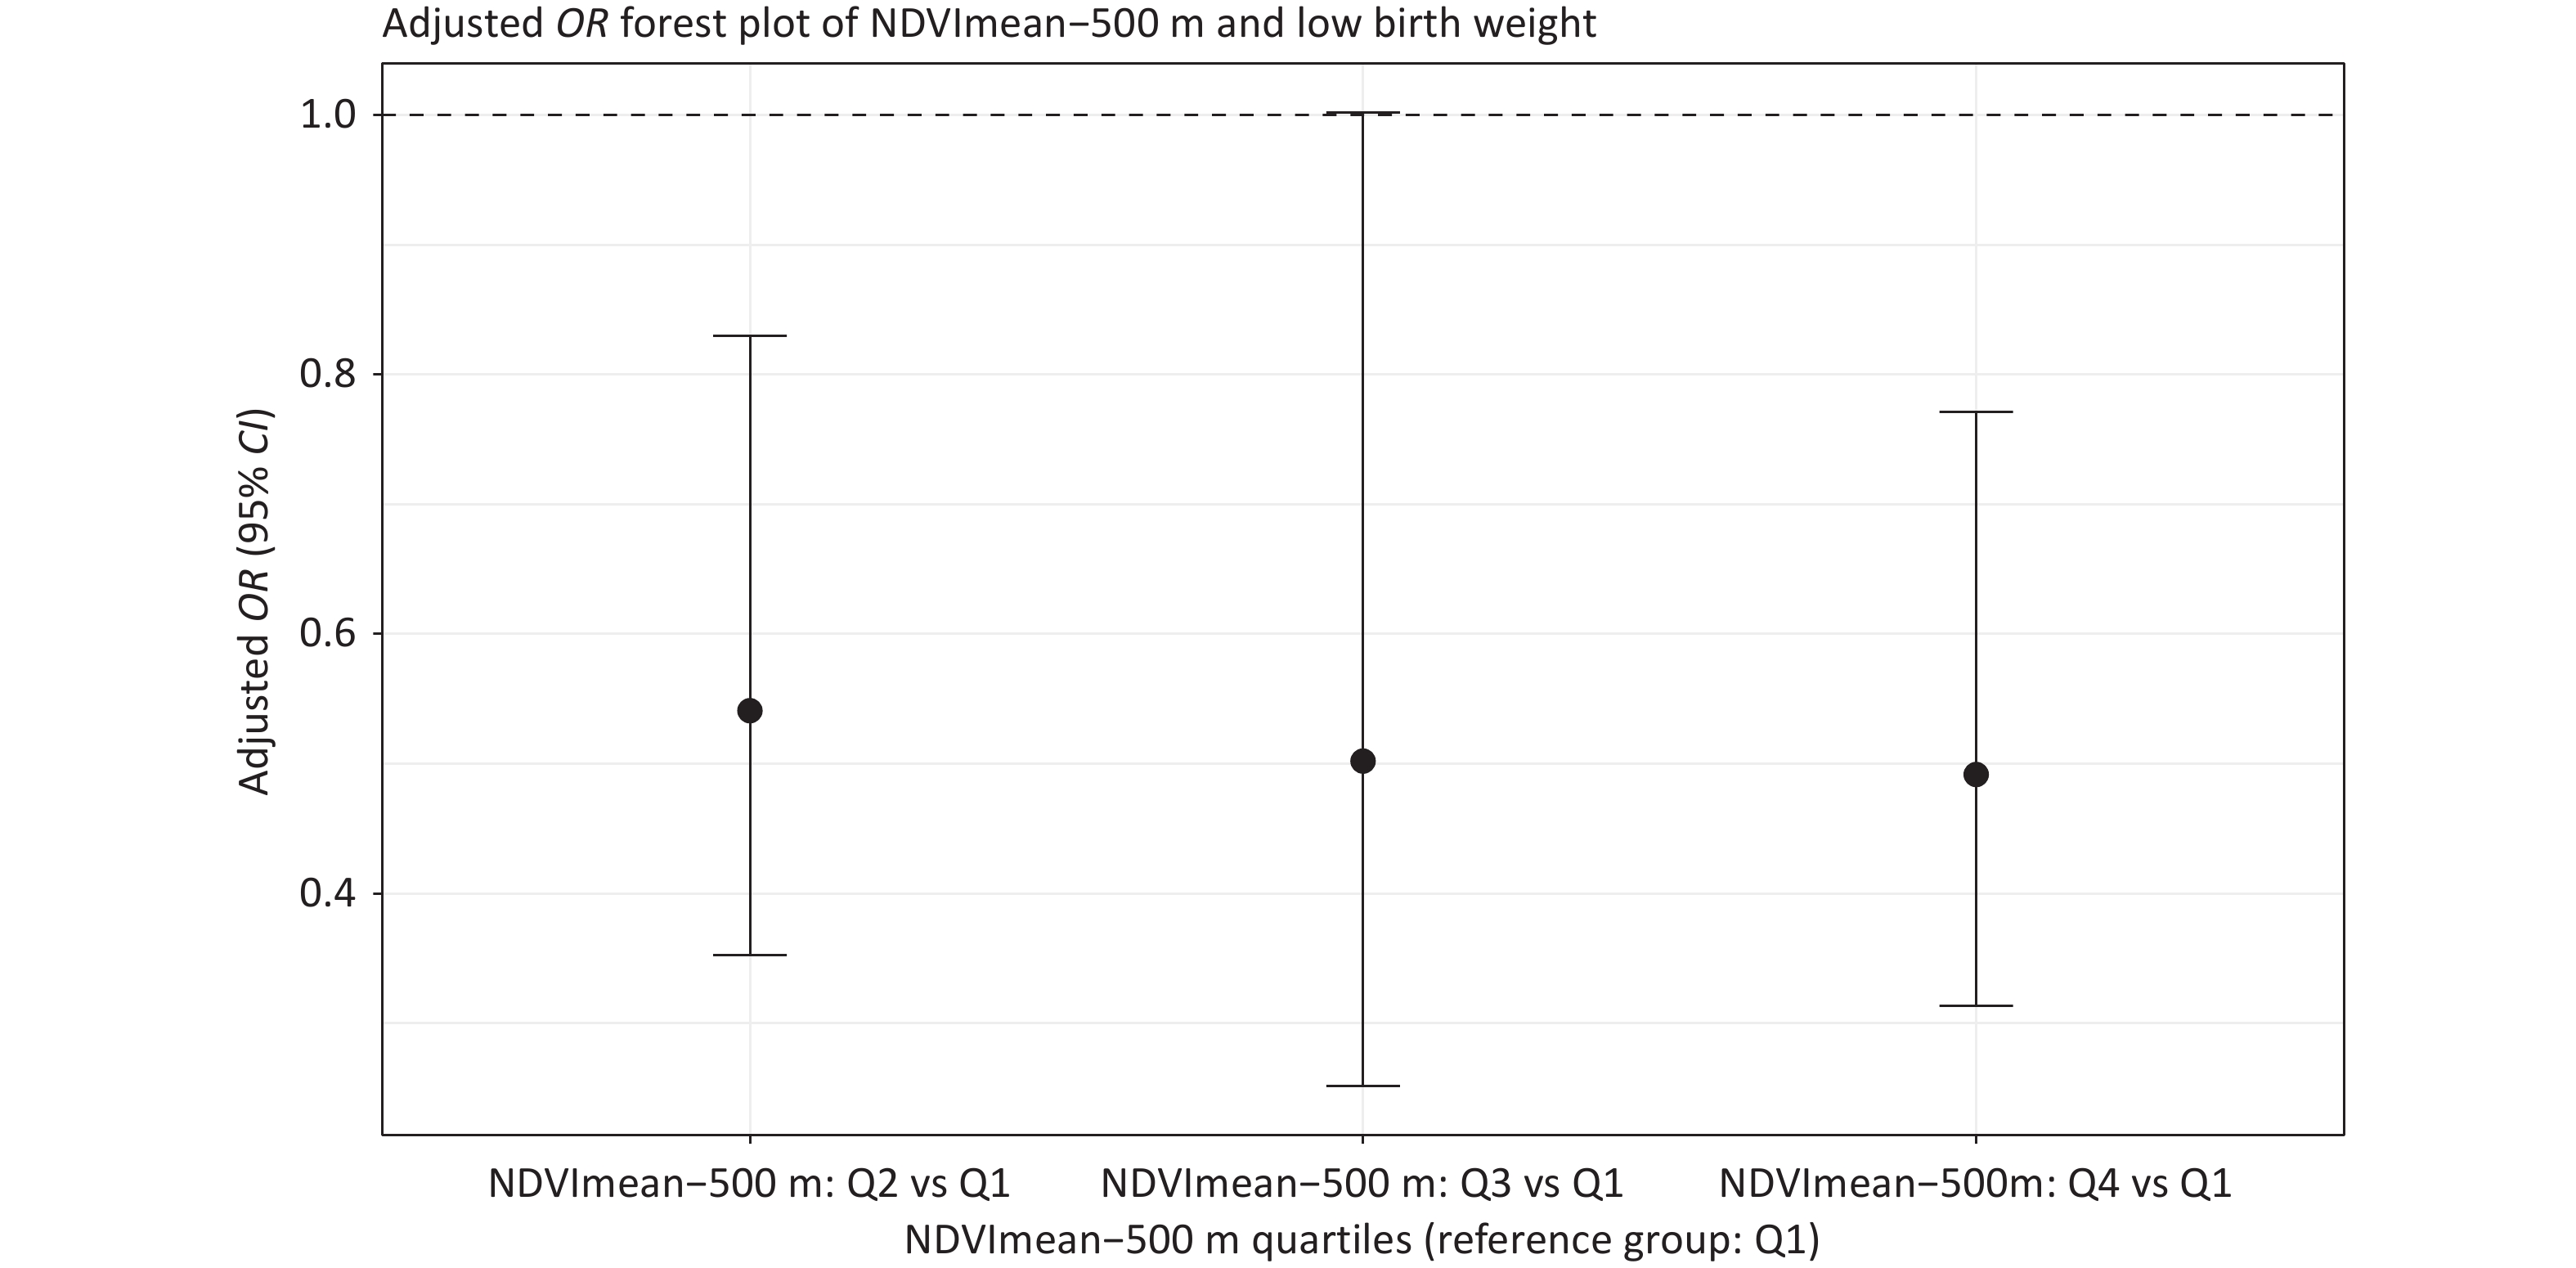
The results showed that compared with the Q1 group, the risk of LBW generally decreased with increasing levels of NDVImean-500m exposure. In the univariate model, the OR values for the Q2, Q3, and Q4 groups were 0.359 (95% CI: 0.242, 0.531), 0.475 (95% CI: 0.242, 0.931), and 0.466 (95% CI: 0.304, 0.715), respectively. After full adjustment for maternal age, residential area, educational level, smoking during pregnancy, prepregnancy BMI, parity, mode of conception, multiple pregnancies, and gestational age at delivery, the risk of LBW was lower in the Q2, Q3, and Q4 groups than in the Q1 group. The adjusted ORs were 0.541 (95% CI: 0.352, 0.830; P = 0.005) for Q2, 0.502 (95% CI: 0.251, 1.002; P = 0.051) for Q3, and 0.492 (95% CI: 0.313, 0.771; P = 0.002) for Q4. The associations were statistically significant in the Q2 and Q4 groups, whereas the Q3 group showed a similar inverse trend with a borderline CI. Overall, higher levels of NDVImean-500m exposure remained associated with a lower risk of LBW after additional adjustment for core maternal and socioeconomic covariates, although the strength of the association varied across exposure quartiles (Figure 1; Supplementary Table S1). No evident multicollinearity was observed among the covariates included in the fully adjusted model (Supplementary Table S2).
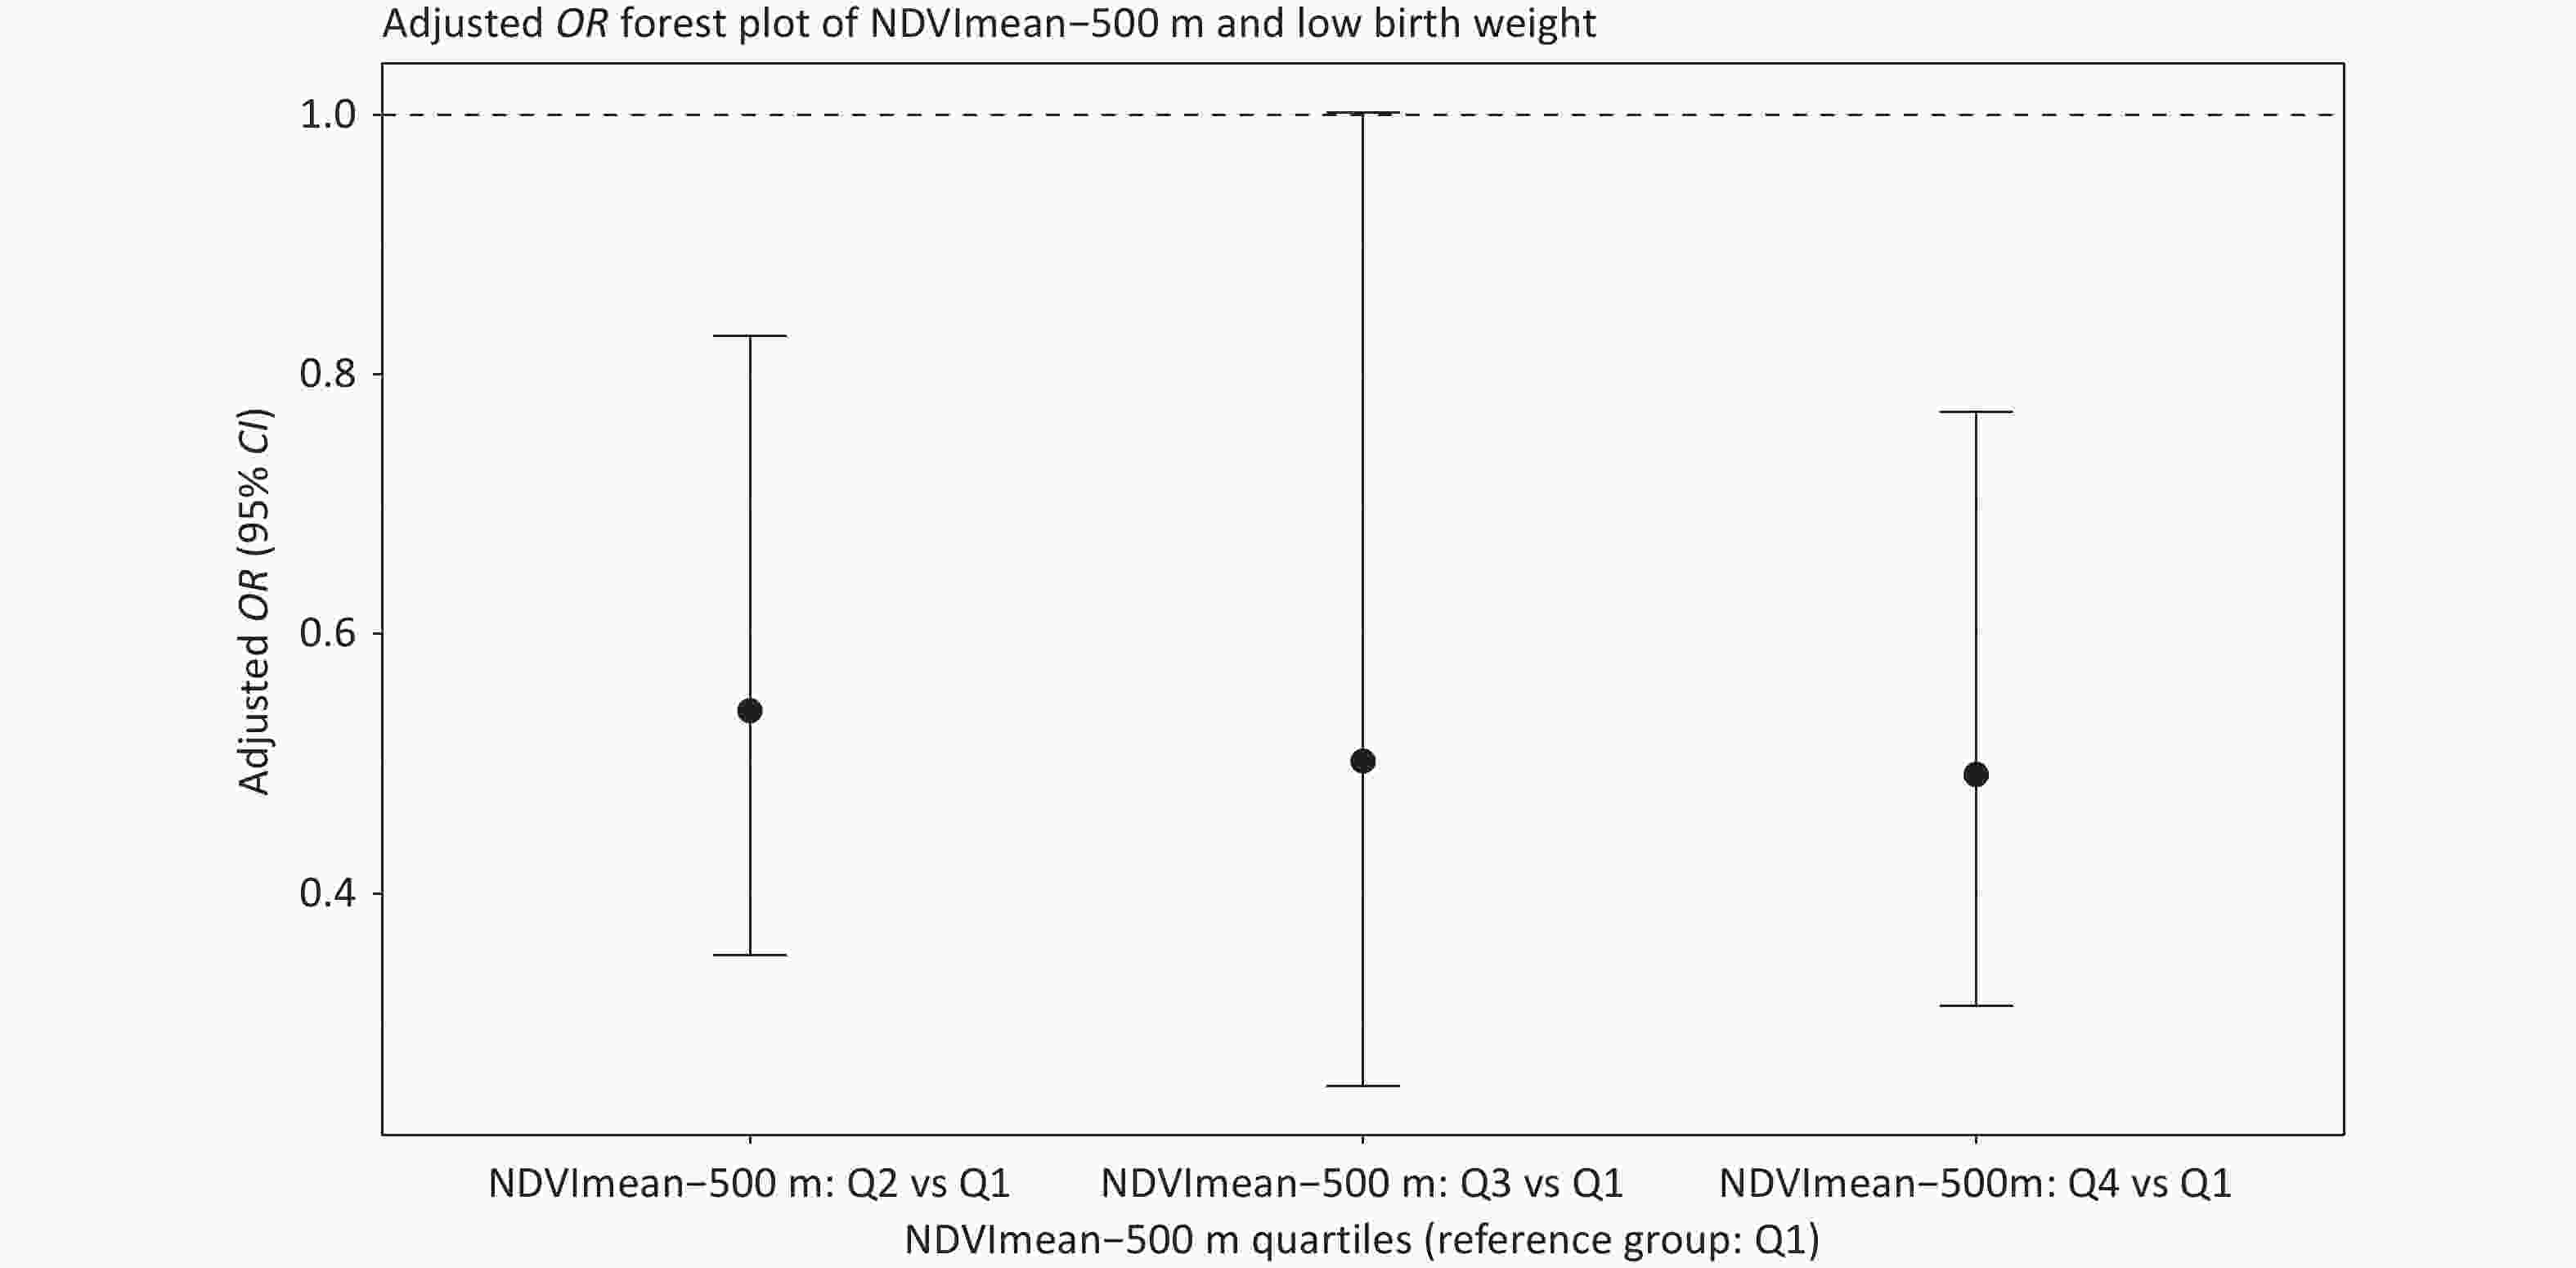
Figure 1. Forest plot of adjusted odds ratios for the association between NDVImean-500m and the risk of low birth weight. NDVI, normalized difference vegetation index; LBW, low birth weight; OR, odds ratio; CI, confidence interval; Q, quartile.
To further evaluate the shape of the association between continuous NDVImean-500m and risk of LBW, a restricted cubic spline analysis was performed. The results showed that NDVImean-500m was significantly associated with the risk of LBW after full adjustment (overall P < 0.001), whereas no evident nonlinear relationship was observed (nonlinear P = 0.521). Overall, higher NDVImean-500m values were associated with a lower risk of LBW (Figure 2).
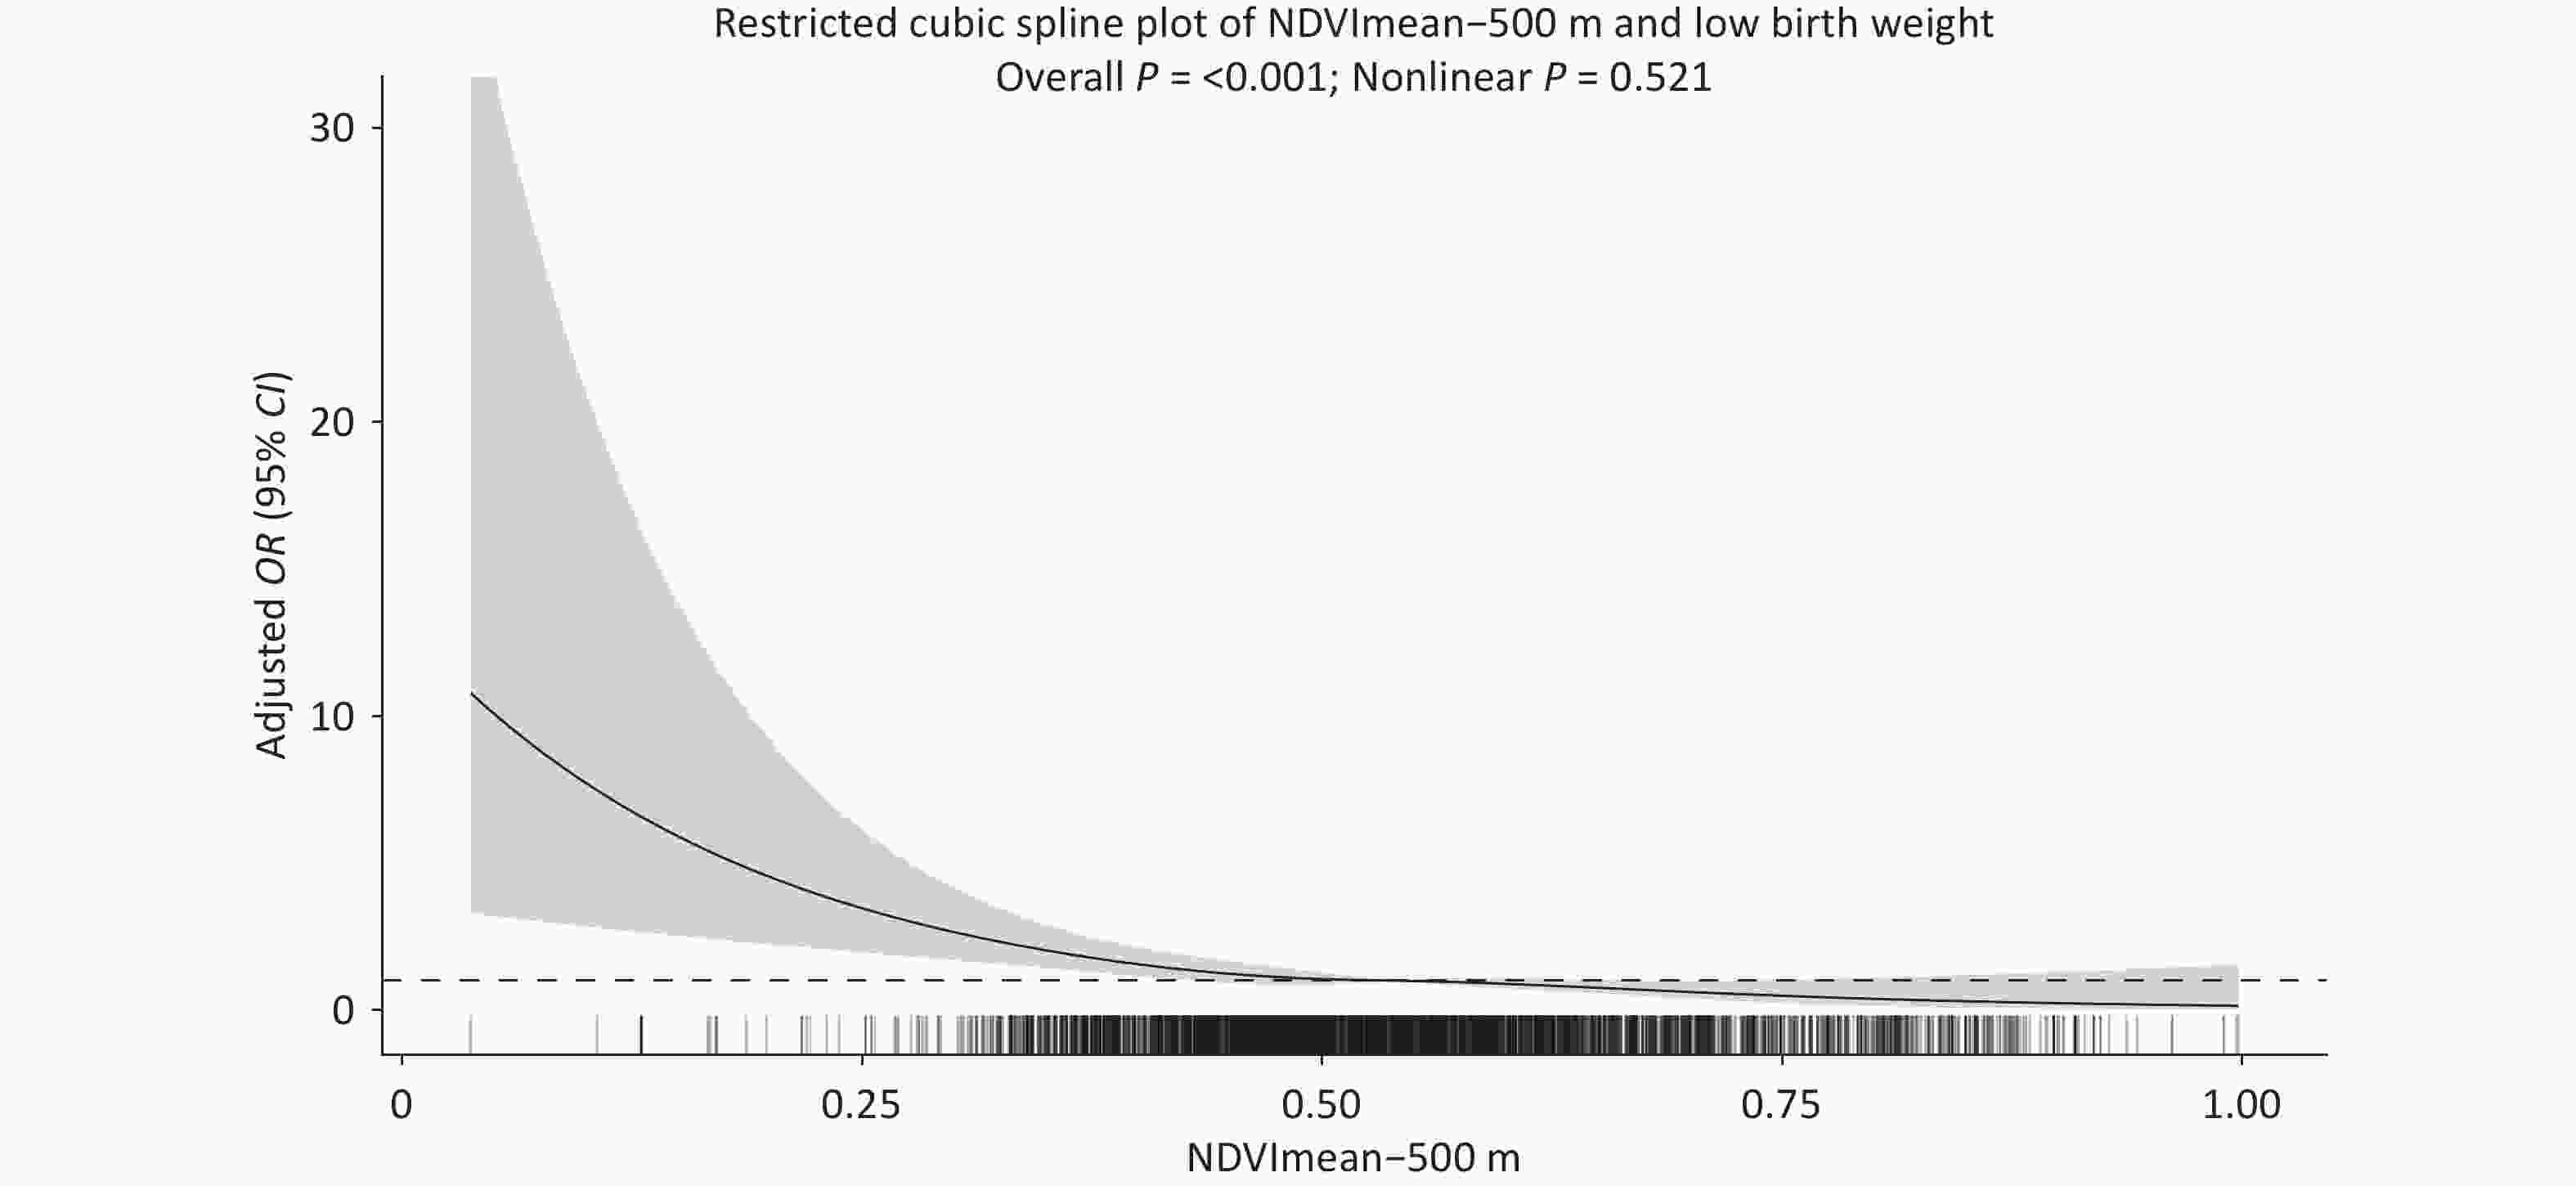
Figure 2. Restricted cubic spline plot of the association between NDVImean-500m and the risk of low birth weight, with an OR = 1 reference line and a rug plot of NDVImean-500m distribution. NDVI, normalized difference vegetation index; LBW, low birth weight; RCS, restricted cubic spline; OR, odds ratio; CI, confidence interval.
Because no LBW events were observed in the highest exposure group in the grouped sensitivity analysis of NDVImean-1000m, resulting in an unstable model estimation, NDVImean-1000m was further included as a continuous variable in the sensitivity analysis. In the sensitivity analysis using continuous NDVImean-1000m, each 0.1-unit increase in NDVImean-1000m was associated with a lower risk of LBW after full adjustment for maternal age, residential area, education level, smoking during pregnancy, prepregnancy BMI, parity, mode of conception, multiple pregnancy, and gestational age at delivery (OR = 0.430, 95% CI: 0.380, 0.487; P < 0.001).The continuous NDVImean-1000m sensitivity analysis showed a consistent inverse association, supporting the robustness of the main findings based on NDVImean-500m (Supplementary Figure S1 and Supplementary Table S3).
After excluding multiple pregnancies, the inverse association between NDVImean-500m and LBW remained generally consistent with that observed in the main analysis. Compared with Q1, the adjusted ORs were 0.560 (95% CI: 0.360, 0.872; P = 0.010) for Q2, 0.596 (95% CI: 0.297, 1.197; P = 0.146) for Q3, and 0.561 (95% CI: 0.352, 0.895; P = 0.015) for Q4. These findings suggested that the observed association was not solely driven by multiple pregnancies (Supplementary Table S4).
Further subgroup analyses were conducted to evaluate the association between the highest NDVImean-500m exposure group (Q4) and LBW, using the lowest exposure group (Q1) as the reference. The inverse direction of the association was generally observed across maternal age groups, singleton and multiple pregnancies, nonassisted conception, and most prepregnancy BMI categories. For prepregnancy BMI, participants were analyzed separately as < 18.5, 18.5–23.9, 24.0–27.9, and ≥ 28.0 kg/m2 groups, consistent with the baseline characteristics table. The association was inverse in the < 18.5, 18.5–23.9, and ≥ 28.0 kg/m2 groups, whereas the estimate in the 24.0–27.9 kg/m2 group was unstable and crossed the null value. The CIs were relatively wide in some subgroups, especially in those with fewer LBW events, indicating that these subgroup findings should be interpreted with caution (Supplementary Figure S2). The estimate for the assisted reproduction subgroup is not displayed because of sparse LBW events and unstable model estimation.
In the supplementary meta-analysis including six previous studies and the present cohort, higher NDVImean-500m exposure showed an inverse but non-significant association with LBW risk, with a pooled OR of 0.89 (95% CI: 0.63–1.27, P = 0.534; I2 = 81.1%). This finding was directionally consistent with the cohort analysis; however, substantial heterogeneity indicated that the pooled evidence should be interpreted with caution. The quality assessment of the included studies is shown in Supplementary Table S5. The literature screening process, forest plot, leave-one-out sensitivity analysis, and funnel plot are provided in Supplementary Figures S3–S6.
The present cohort showed that higher NDVImean-500m exposure was generally associated with a lower risk of LBW, although the quartile-specific estimates were not strictly monotonic. The RCS analysis supported an overall inverse association without significant nonlinearity, and sensitivity and subgroup analyses showed broadly consistent directions. The supplementary meta-analysis also showed a directionally consistent but non-significant pooled association, suggesting that the cohort findings should be interpreted with caution in the context of heterogeneity across populations, exposure assessment methods, and covariate adjustment.
There are several plausible mechanisms that may explain this association. Greener residential environments may reduce exposure to air pollution and heat, alleviate maternal stress, and promote healthier behaviors, which may collectively contribute to fetal growth[4,5]. However, this study did not directly measure air pollutants, temperature, physical activity, or psychosocial stress; therefore, these mechanisms should be interpreted as plausible explanations rather than causal mediation evidence.
This association should be interpreted within a multifactorial framework. Pregnancy-related factors, maternal nutritional status, socioeconomic characteristics, and environmental co-exposures may all contribute to LBW risk. Therefore, the association between NDVI and LBW should be viewed as an adjusted environmental association rather than as evidence of a direct causal effect.
The direction of the present findings is broadly consistent with recent studies suggesting the potential benefits of residential greenness for fetal growth and birthweight-related outcomes[6]. However, previous evidence has not been entirely consistent, possibly due to differences in outcome definitions, exposure windows, buffer sizes, greenness indicators, and covariate adjustment[7].
This study had several limitations that must be considered. First, NDVI reflects vegetation coverage but cannot capture greenness type, accessibility, quality, or actual individual use. Second, the exposure assessment was based on baseline residential address, and maternal mobility or residential relocation during pregnancy could not be fully considered. Third, although several maternal- and pregnancy-related covariates were adjusted for, residual confounding from socioeconomic, environmental, and lifestyle factors cannot be ruled out. Additionally, the supplementary meta-analysis included a limited number of studies, and the pooled estimates should be interpreted cautiously. Further studies with refined spatiotemporal exposure assessments and better control of environmental co-exposures are needed.
In conclusion, higher residential surrounding NDVI exposure during pregnancy was associated with a lower risk of LBW in this prospective cohort. The supplementary meta-analysis showed a directionally consistent but non-significant pooled association. These findings suggest that residential greenness may be a potentially relevant environmental factor for birth outcomes; however, further multicenter studies with refined exposure assessment and control of environmental co-exposures are needed.
HTML
Competing Interests The authors declare that they have no competing interests.
Ethics This study was approved by the Ethics Committee of the Chongqing Health Center for Women and Children (approval No. 2022 Ethical Review [Scientific Research] No. 038) and by the China Human Genetic Resources Administration for the collection of human genetic resources (approval No. Guo Ke Yi Ban Shen Zi [2023] CJ0981). Written informed consent was obtained from all the participants.
Authors’ Contributions Yuefei Wu and Qiaoling Geng contributed equally to this study. Conceptualization and study design: Yuefei Wu and Xiaolin Zhang. Statistical analysis and manuscript drafting: Yuefei Wu. Data collection, data cleaning, and manuscript revision: Qiaoling Geng, Yuting Bu, Haojun Li, Zitong Zhao, Xuan Cao, Qian Li, and Huaiyu Chen. Methodological support and manuscript revision: Sujun Fan. Study supervision, funding acquisition, and critical manuscript revision: Xiaolin Zhang. All the authors have read and approved the final version of the manuscript.
Data Sharing The datasets used and/or analyzed in the current study are available from the corresponding author upon reasonable request. The supplementary materials will be available in www.besjournal.com.
&These authors contributed equally to this work.
Reference

 Quick Links
 DownLoad: