





-
Preterm birth (PTB) is a leading cause of neonatal mortality worldwide and remains a major public health concern in China[1]. Phthalates are widely used in plastics, personal care products, and food packaging; human exposure occurs through ingestion, inhalation, and dermal contact, and these compounds can cross the placenta, potentially affecting fetal development[2].
Evidence linking prenatal phthalate exposure to PTB remains inconsistent. Although several studies have examined exposure during mid-to-late pregnancy, data on first-trimester exposure remain limited, particularly in Asian populations[3,4]. Because the first trimester is a critical period for placental and fetal development and may be especially sensitive to endocrine-disrupting chemicals, and given the widespread environmental contamination in China, we conducted this prospective cohort study to investigate the association between first-trimester phthalate exposure and PTB risk.
We included 1,098 mothers with spontaneous conception from the Jiangsu Birth Cohort (2014–2019) who provided first-trimester urine samples and delivered singleton infants. The study was approved by the Institutional Review Board, and all participants provided written informed consent. Urine samples were analyzed for 17 phthalate metabolites and 3 di-isononyl cyclohexane-1,2-dicarboxylate (DINCH) metabolites using ultra-performance liquid chromatography-tandem mass spectrometry (UPLC-MS/MS). Briefly, 1 mL samples were spiked with a 13C-labeled internal standard, deconjugated with β-glucuronidase at 37°C for at least 2 h, extracted by solid-phase extraction, and eluted with acetonitrile and ethyl acetate. Limits of detection (LODs) ranged from 0.01–0.13 μg/L. Each analytical batch included blanks, quality controls, and 17 study samples. Metabolites were quantified using a 12-point calibration curve ranging from 0.01–500 ng/mL, with R2 values > 0.99. Concentrations below the LOD were imputed as LOD/√2[5], adjusted for specific gravity (SG) using the formula Pc = P × [(1.0184–1)/(SG–1)] (median SG = 1.0184), and natural log-transformed. For parent compounds with multiple metabolites, molar sums were calculated as follows: ∑DEHP = MEHP + MECPP + MEHHP + MEOHP + MCMHP; ∑DnBP = MnBP + MHBP; ∑DiBP = MiBP + MHiBP; ∑DINP = MiNP + oh-MiNP + oxo-MiNP + cx-MiNP; and ∑DINCH = oh-MINCH + oxo-MINCH + cx-MINCH. PTB was defined as delivery before 37 weeks of gestation, and gestational age (GA) was confirmed by ultrasound. Covariates, including maternal age, body mass index (BMI), education, income, parity, residence, and smoking, were selected using a directed acyclic graph[6]. (Supplementary Figure S1). Multivariable linear/logistic regression models were used to assess individual metabolites, while Bayesian kernel machine regression (BKMR) and weighted quantile sum (WQS) regression were applied to evaluate mixture effects. All analyses were performed using R version 4.3.3.
Table 1 presents the characteristics of the 1,098 participants. The mean maternal age was 30.3 years (SD, 3.8), and the mean pre-pregnancy BMI was 21.2 kg/m2 (SD, 2.9). Most participants were nulliparous (78.6%) and had at least a high school education (89.5%). Participants were recruited from two centers: the Women’s Hospital of Nanjing Medical University (62.4%) and Suzhou Affiliated Hospital of Nanjing Medical University (37.6%). Most lived in urban areas (68.8%). Smoking and alcohol use were uncommon, reported by 0.6% and 3.9% of participants, respectively. The cumulative incidence of PTB was 2.8% (n = 31).
Characteristics, No. (%) All births (n = 1,098) Term births (n = 1,067) PTB (n = 31) Age, years mean ± SD 30.32 (3.8) 30.30 (3.8) 30.83 (3.9) < 25 39 (3.6) 38 (3.6) 1 (3.2) 25–30 555 (50.5) 542 (50.8) 13 (41.9) 30–35 367 (33.4) 355 (33.3) 12 (38.7) > 35 137 (12.5) 132 (12.4) 5 (16.1) Study center Nanjing 685 (62.4) 667 (62.5) 18 (58.1) Suzhou 413 (37.6) 400 (37.5) 13 (41.9) Area of residence Rural 343 (31.2) 331 (31.0) 12 (38.7) Urban/sub-urban 755 (68.8) 736 (69.0) 19 (61.3) Household income, CNY < 50,000 79 (7.2) 77 (7.2) 2 (6.5) 50,000–200,000 769 (70.1) 747 (70.1) 22 (71.0) > 200,000 249 (22.7) 242 (22.7) 7 (22.6) BMI, kg/m2 mean ± SD 21.16 (2.9) 21.17 (2.9) 20.90 (2.4) < 18.5 164 (14.9) 161 (15.1) 3 (9.7) 18.5–23.9 774 (70.6) 750 (70.4) 24 (77.4) 24–27.9 126 (11.5) 122 (11.4) 4 (12.9) > 28 33 (3.0) 33 (3.1) 0 (0.0) Education, year ≤ 12 115 (10.5) 111 (10.4) 4 (12.9) > 12 983 (89.5) 956 (89.6) 27 (87.1) Diabetes in pregnancy No 810 (73.8) 792 (74.2) 18 (58.1) Yes 288 (26.2) 275 (25.8) 13 (41.9) Hypertensive disorders in pregnancy No 1060 (96.6) 1032 (96.8) 28 (90.3) Yes 37 (3.4) 34 (3.2) 3 (9.7) Tobacco use No 1091 (99.4) 1060 (99.3) 31 (100.0) Yes 7 (0.6) 7 (0.7) 0 (0.0) Passive smoking No 940 (92.1) 914 (92.0) 26 (92.9) Yes 81 (7.9) 79 (8.0) 2 (7.1) Alcohol intake No 1055 (96.1) 1024 (96.0) 31 (100.0) Yes 43 (3.9) 43 (4.0) 0 (0.0) Parity Nulliparous 863 (78.7) 840 (78.8) 23 (74.2) Multiparous 234 (21.3) 226 (21.2) 8 (25.8) Note. SD, standard deviation; BMI, body mass index; CNY, Chinese Yuan. a, Diabetes in pregnancy includes chronic and gestational diabetes; b, Hypertension disorders in pregnancy include chronic, gestational, and pre-eclampsia; c, The cutoff point to distinguish preterm and term children was 37 gestational weeks. Table 1. Characteristics of mothers enrolled in the Jiangsu prospective birth cohort study conducted from 2014–2019, stratified by preterm birth status.
SG-adjusted concentrations of the 20 phthalate metabolites and 5 parent compounds are shown in Supplementary Table S1. The limit of detection (LOD) ranged from 0.01–0.13 µg/L across metabolites. Most metabolites were detected in nearly all samples, with the proportion of concentrations below the LOD ranging from 0–31.0%. Mono(hydroxybutyl) phthalate (MHBP) had a relatively higher proportion of samples below the LOD (31.0%), with a median concentration of 5.96 µg/L (IQR: 0.04, 13.07). Overall, the urinary concentration distribution indicated widespread exposure to multiple phthalate metabolites in the study population, with particularly high concentrations of MnBP (79.26 µg/L; IQR: 36.31–171.03) and MiBP (33.65 µg/L; IQR: 18.71–60.16).
Pearson correlation coefficients for maternal urinary phthalate metabolite concentrations are shown in Supplementary Figure S2. Correlation coefficients ranged from 0.05 (oxo_MINCH and MHIBP) to 0.99 (MEOHP and MEHHP). Several metabolites were strongly correlated (r ≥ 0.6), and distinct clusters were observed among phthalate ester metabolites, particularly those derived from the same parent compounds.
In multivariable linear regression models using molar sums for parent compounds, continuous log-transformed concentrations of mono-ethyl phthalate (MEP) and diisononyl phthalate (DINP) were significantly associated with shorter GA (MEP: β = −0.07, 95% CI: −0.14, −0.00; DINP: β = −0.09, 95% CI: −0.16, −0.01) (Table 2). These associations remained significant in sensitivity analyses (Supplementary Table S2).
Phthalates Exposure Gestational age Preterm birth β (95% CI)a P value P for trend OR (95% CI)a P value P for trend MMP Mid VS. Low 0.013 (−0.18, 0.20) 0.890 0.247 4.66 (1.07, 20.33) 0.041 0.113 High VS. Low −0.121 (−0.34, 0.10) 0.280 4.34 (0.91, 20.84) 0.066 MEP Mid VS. Low −0.009 (−0.20, 0.18) 0.929 0.040 1.38 (0.48, 3.97) 0.549 0.148 High VS. Low −0.217 (−0.44, 0.00) 0.053 2.16 (0.71, 6.56) 0.172 MnBP Mid VS. Low −0.059 (−0.25, 0.13) 0.543 0.477 1.19 (0.50, 2.81) 0.698 0.222 High VS. Low 0.080 (−0.14, 0.30) 0.471 0.39 (0.10, 1.49) 0.167 MiBP Mid VS. Low −0.132 (−0.32, 0.06) 0.177 0.534 1.42 (0.55, 3.68) 0.473 0.718 High VS. Low −0.069 (−0.29, 0.15) 0.539 0.78 (0.23, 2.63) 0.687 MHBP Mid VS. Low −0.045 (−0.23, 0.14) 0.641 0.723 1.75 (0.68, 4.48) 0.242 0.452 High VS. Low 0.039 (−0.18, 0.26) 0.724 0.51 (0.13, 2.08) 0.349 MHiBP Mid VS. Low −0.223 (−0.41, −0.03) 0.022 0.427 1.41 (0.54, 3.67) 0.481 0.896 High VS. Low −0.105 (−0.32, 0.11) 0.342 0.96 (0.30, 3.04) 0.943 MCPP Mid VS. Low 0.041 (−0.15, 0.23) 0.669 0.315 1.01 (0.42, 2.45) 0.978 0.469 High VS. Low 0.111 (−0.11, 0.33) 0.320 0.65 (0.21, 2.05) 0.464 MBzP Mid VS. Low −0.117 (−0.31, 0.07) 0.230 0.639 0.99 (0.39, 2.49) 0.975 0.950 High VS. Low −0.052 (−0.27, 0.17) 0.646 1.04 (0.35, 3.04) 0.949 MEHP Mid VS. Low 0.027 (−0.16, 0.22) 0.777 0.523 0.53 (0.21, 1.34) 0.182 0.924 High VS. Low −0.078 (−0.30, 0.14) 0.487 1.00 (0.39, 2.59) 0.996 MECPP Mid VS. Low 0.058 (−0.13, 0.25) 0.550 0.692 0.51 (0.21, 1.25) 0.140 0.672 High VS. Low 0.044 (−0.18, 0.26) 0.693 0.83 (0.32, 2.19) 0.713 MEHHP Mid VS. Low 0.061 (−0.13, 0.25) 0.530 0.492 0.67 (0.28, 1.62) 0.375 0.616 High VS. Low −0.084 (−0.30, 0.14) 0.452 0.80 (0.29, 2.21) 0.667 MEOHP Mid VS. Low 0.066 (−0.12, 0.26) 0.492 0.759 0.62 (0.25, 1.53) 0.298 0.843 High VS. Low −0.039 (−0.26, 0.18) 0.726 0.94 (0.35, 2.50) 0.896 MCMHP Mid VS. Low 0.046 (−0.14, 0.24) 0.632 0.617 0.79 (0.33, 1.87) 0.589 0.296 High VS. Low 0.057 (−0.16, 0.28) 0.610 0.55 (0.18, 1.69) 0.299 oh_MINCH Mid VS. Low 0.038 (−0.15, 0.23) 0.698 0.381 0.91 (0.37, 2.21) 0.828 0.680 High VS. Low 0.097 (−0.12, 0.32) 0.387 0.80 (0.27, 2.34) 0.678 oxo_MINCH Mid VS. Low 0.056 (−0.13, 0.25) 0.562 0.474 0.98 (0.38, 2.51) 0.968 0.646 High VS. Low 0.083 (−0.14, 0.30) 0.458 1.25 (0.44, 3.51) 0.678 cx_MINCH Mid VS. Low 0.120 (−0.07, 0.31) 0.215 0.309 0.57 (0.24, 1.37) 0.207 0.546 High VS. Low 0.123 (−0.10, 0.34) 0.272 0.72 (0.27, 1.94) 0.519 MiNP Mid VS. Low 0.107 (−0.08, 0.30) 0.271 0.230 0.43 (0.18, 1.05) 0.064 0.236 High VS. Low 0.128 (−0.09, 0.35) 0.251 0.65 (0.24, 1.71) 0.380 oh_MiNP Mid VS. Low −0.107 (−0.30, 0.08) 0.271 0.760 1.27 (0.48, 3.33) 0.632 0.727 High VS. Low −0.042 (−0.26, 0.18) 0.706 1.24 (0.41, 3.76) 0.708 oxo_MiNP Mid VS. Low −0.076 (−0.26, 0.11) 0.432 0.863 1.09 (0.44, 2.72) 0.854 0.928 High VS. Low −0.023 (−0.24, 0.20) 0.835 0.95 (0.31, 2.90) 0.928 cx_MiNP Mid VS. Low 0.041 (−0.15, 0.23) 0.671 0.234 1.13 (0.46, 2.80) 0.793 0.606 High VS. Low 0.132 (−0.09, 0.35) 0.240 0.73 (0.23, 2.37) 0.605 DEHP Mid VS. Low −0.008 (−0.20, 0.18) 0.936 0.093 1.15 (0.43, 3.09) 0.784 0.158 High VS. Low 0.173 (−0.05, 0.39) 0.125 0.32 (0.06, 1.61) 0.166 DnBP Mid VS. Low −0.022 (−0.22, 0.17) 0.828 0.292 0.41 (0.14, 1.26) 0.119 0.722 High VS. Low −0.123 (−0.35, 0.10) 0.287 1.23 (0.43, 3.54) 0.695 DiBP Mid VS. Low −0.184 (−0.38, 0.01) 0.064 0.387 3.76 (0.83, 17.00) 0.085 0.171 High VS. Low −0.105 (−0.33, 0.12) 0.360 3.44 (0.68, 17.39) 0.135 DINCH Mid VS. Low −0.088 (−0.28, 0.11) 0.373 0.065 3.38 (0.74, 15.38) 0.114 0.105 High VS. Low −0.208 (−0.43, 0.01) 0.066 3.92 (0.80, 19.25) 0.093 DINP Mid VS. Low −0.087 (−0.28, 0.11) 0.381 0.192 0.88 (0.30, 2.54) 0.811 0.805 High VS. Low −0.151 (−0.37, 0.07) 0.187 1.14 (0.36, 3.63) 0.825 Note. Bold indicates statistical significance. a, adjusted for maternal age, maternal BMI, household income, maternal education, parity, residence, and maternal smoking status. OR, Odds ratio; 95% CI, 95% confidence interval; MMP, mono-methyl phthalate; MEP, mono-ethyl phthalate; MiBP, mono-isobutyl phthalate; MHiBP, mono hydroxyisobutyl phthalate; MnBP, mono-n-butyl phthalate; MHBP, mono-hydroxybutyl phthalate; MCPP, mono-3-carboxypropyl phthalate; MBzP, mono-benzyl phthalate; MEHP, mono-2 ethylhexyl phthalate; MEHHP, mono-2-ethyl-5-hydroxyhexyl phthalate; MEOHP, mono-2 ethyl-5-oxohexyl phthalate; MECPP, mono-2-ethyl-5-carboxypentyl phthalate; MCMHP, mono[2- (carboxymethyl)hexyl] phthalate; MiNP, mono-isononyl phthalate; cx_MiNP, mono carboxyisooctyl phthalate; oxo_MiNP, mono-carboxyisononyl phthalate; oh_MiNP, mono hydroxyisononyl phthalate; oh_MINCH, cyclohexane-1,2-dicarboxylic acid mono hydroxy isononyl ester; oxo_MINCH, cyclohexane-1,2-dicarboxylic acid mono-carboxy isononyl ester; cx_MINCH, cyclohexane1,2-dicarboxylic acid mono-carboxy isooctyl ester; DINCH, diisononyl cyclohexane-1,2-dicarboxylate; DINP, diisononyl phthalate. Table 2. Exposure effects of maternal urinary phthalate metabolite concentrations across tertiles on gestational age and preterm birth.
Tertile analyses provided additional insight (Table 2). Higher MEP exposure showed a trend toward shorter GA (P-trend = 0.040). However, direct comparisons between the highest and lowest tertiles (High vs Low: β = −0.22, 95% CI: −0.44, 0.00) and between the middle and lowest tertiles (Mid vs Low: β = −0.01, 95% CI: −0.20, 0.18) did not reach statistical significance. A significant reduction in GA was also observed for the middle tertile of mono-hydroxyisobutyl phthalate (MHiBP) exposure (β = −0.22, 95% CI: −0.41, −0.03).
We then assessed the association between phthalate exposure and PTB (Table 2). The most notable association was observed for mono-methyl phthalate (MMP): women in the middle tertile had higher odds of PTB than those in the lowest tertile (adjusted OR = 4.66; 95% CI: 1.07, 20.33). DiBP showed a suggestive but non-significant association with PTB (OR for the middle tertile = 2.89; 95% CI: 0.92, 9.08). Metabolites associated with shorter GA in linear models, including MEP and DINP, generally showed elevated but non-significant odds of PTB.
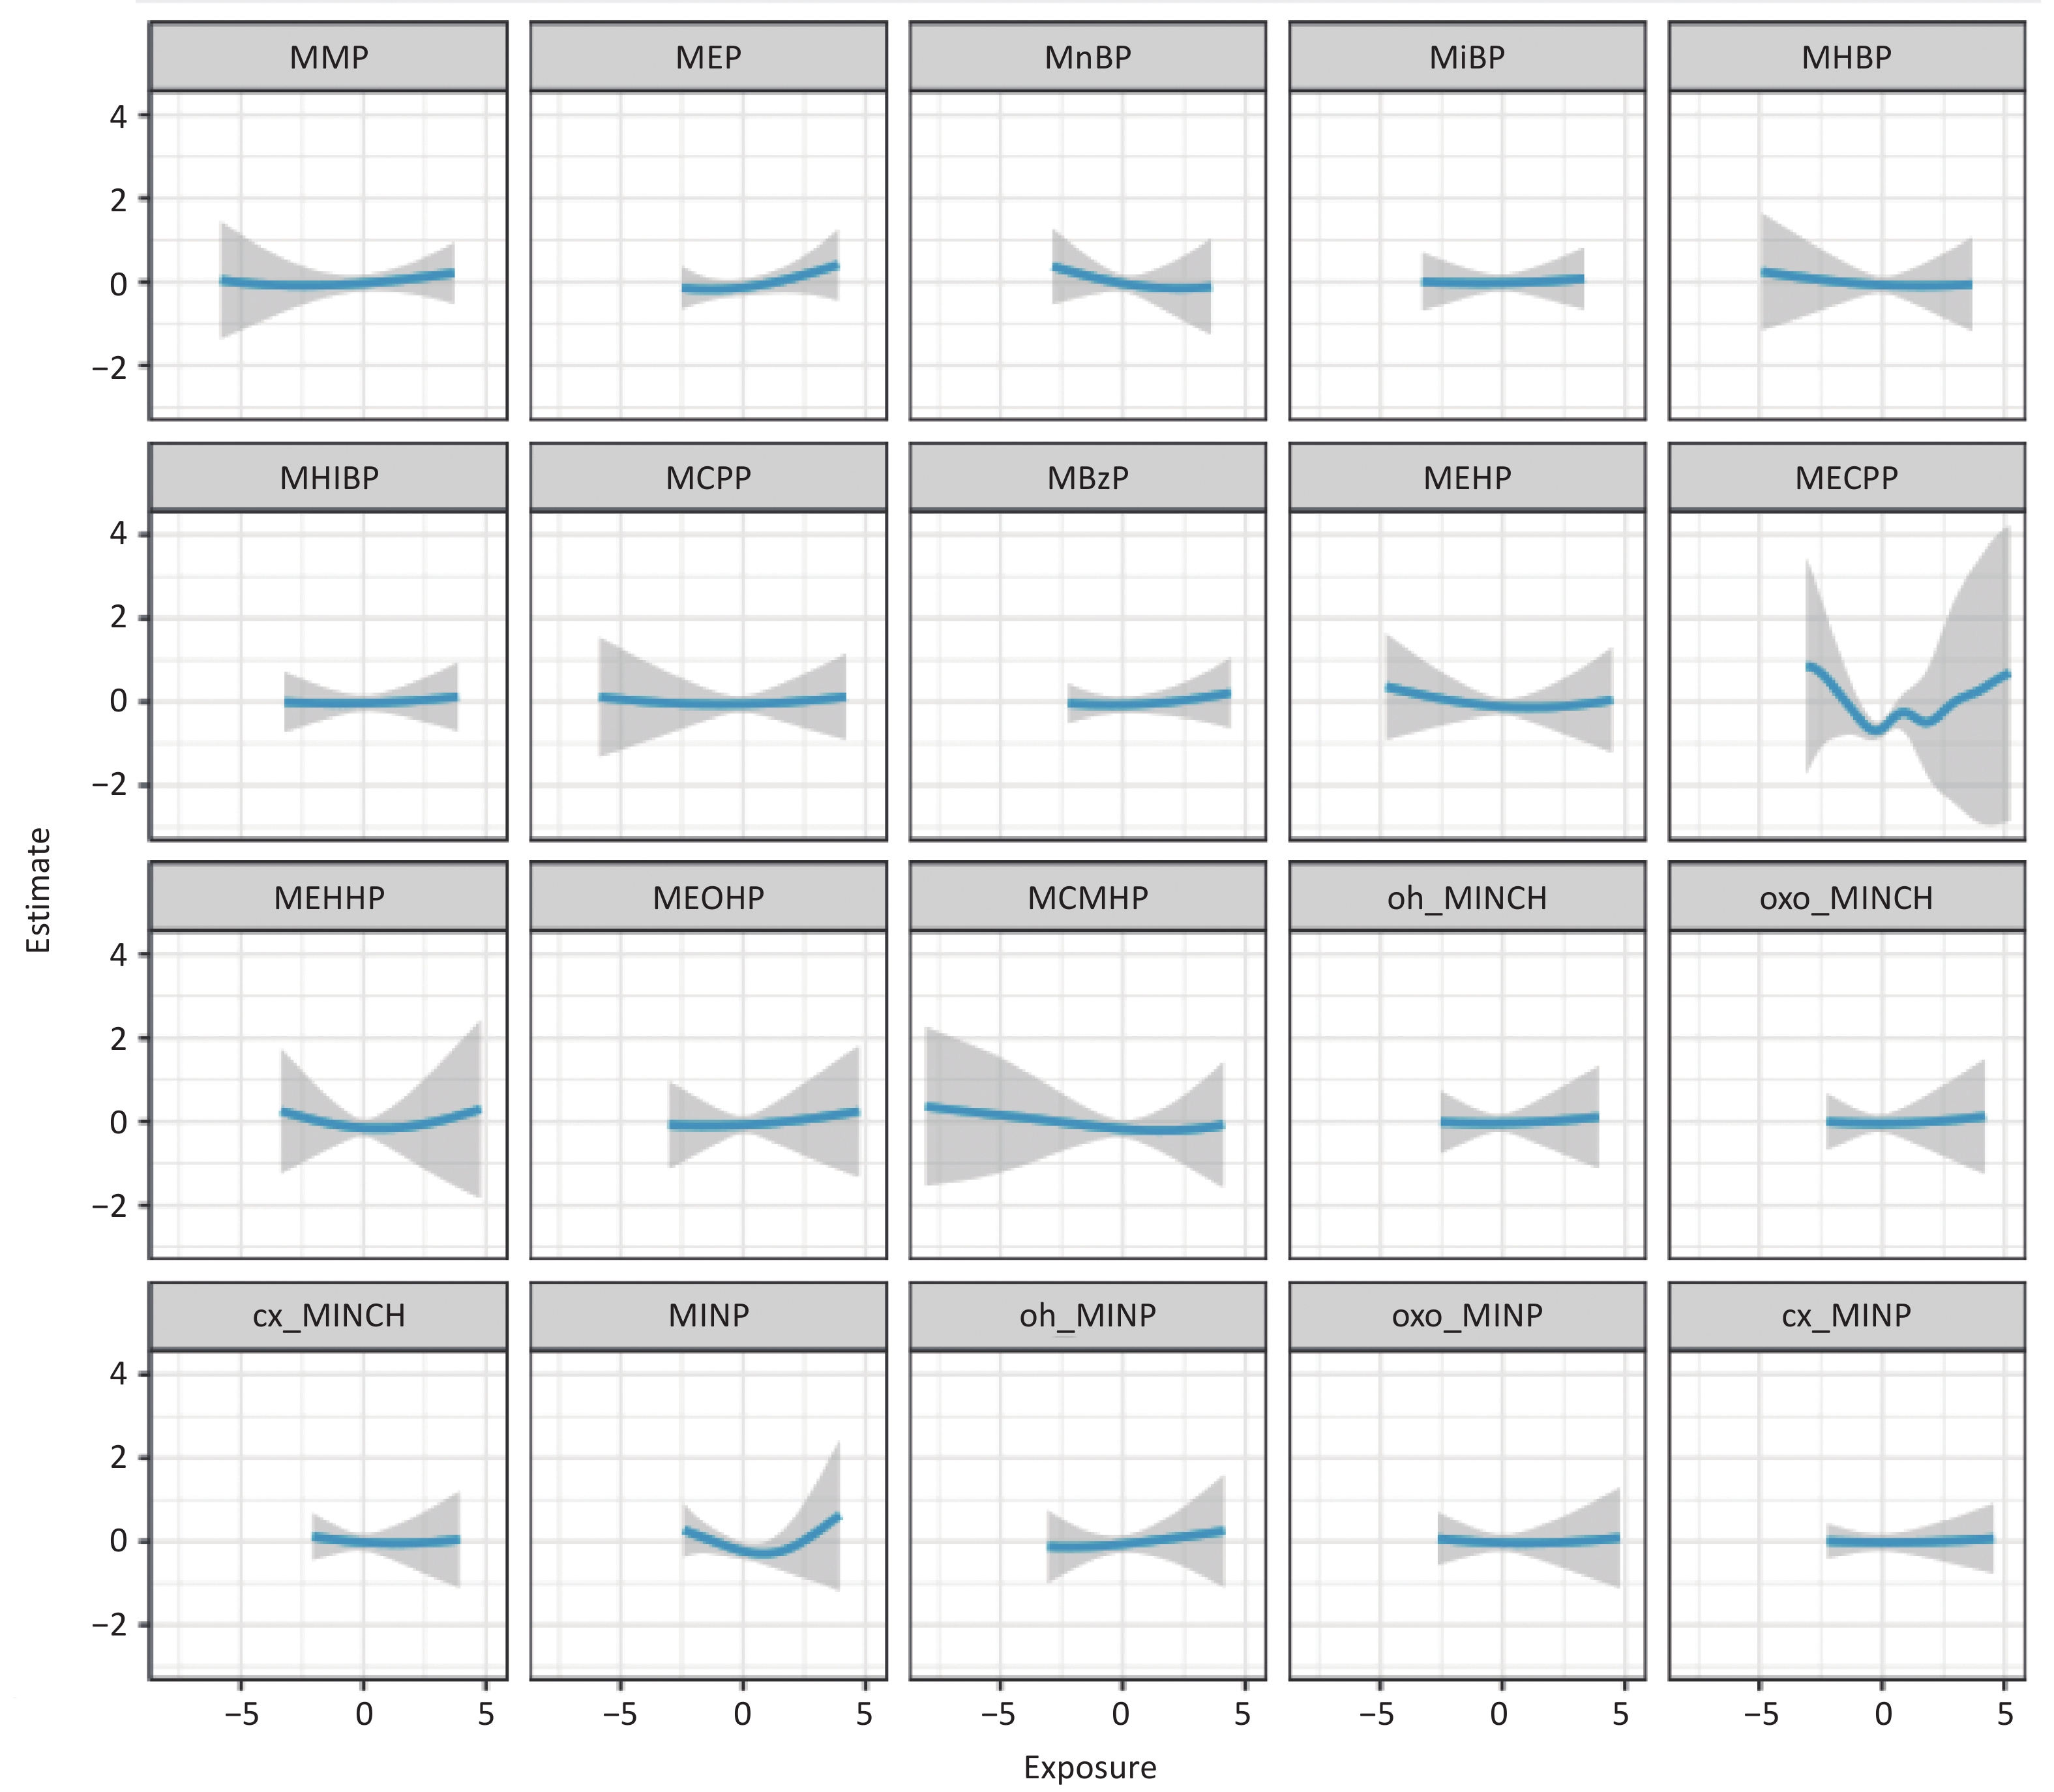
BKMR and WQS regression were used to evaluate the joint effects of the phthalate mixture. In the BKMR model, no significant overall mixture effect on PTB risk was observed when all metabolites were increased from the 50th to the 75th percentile (Supplementary Figure S3). Posterior inclusion probabilities (PIPs) identified MEP (PIP = 0.528), mono-2-ethyl-5-carboxypentyl phthalate (MECPP; PIP = 0.499), and MiNP, a ∑DINP metabolite (PIP = 0.549), as the most influential metabolites in the mixture (Supplementary Table S4). Univariate exposure–response functions revealed potential non-linear patterns for some phthalates; however, all credible intervals included the null value (Figure 1).
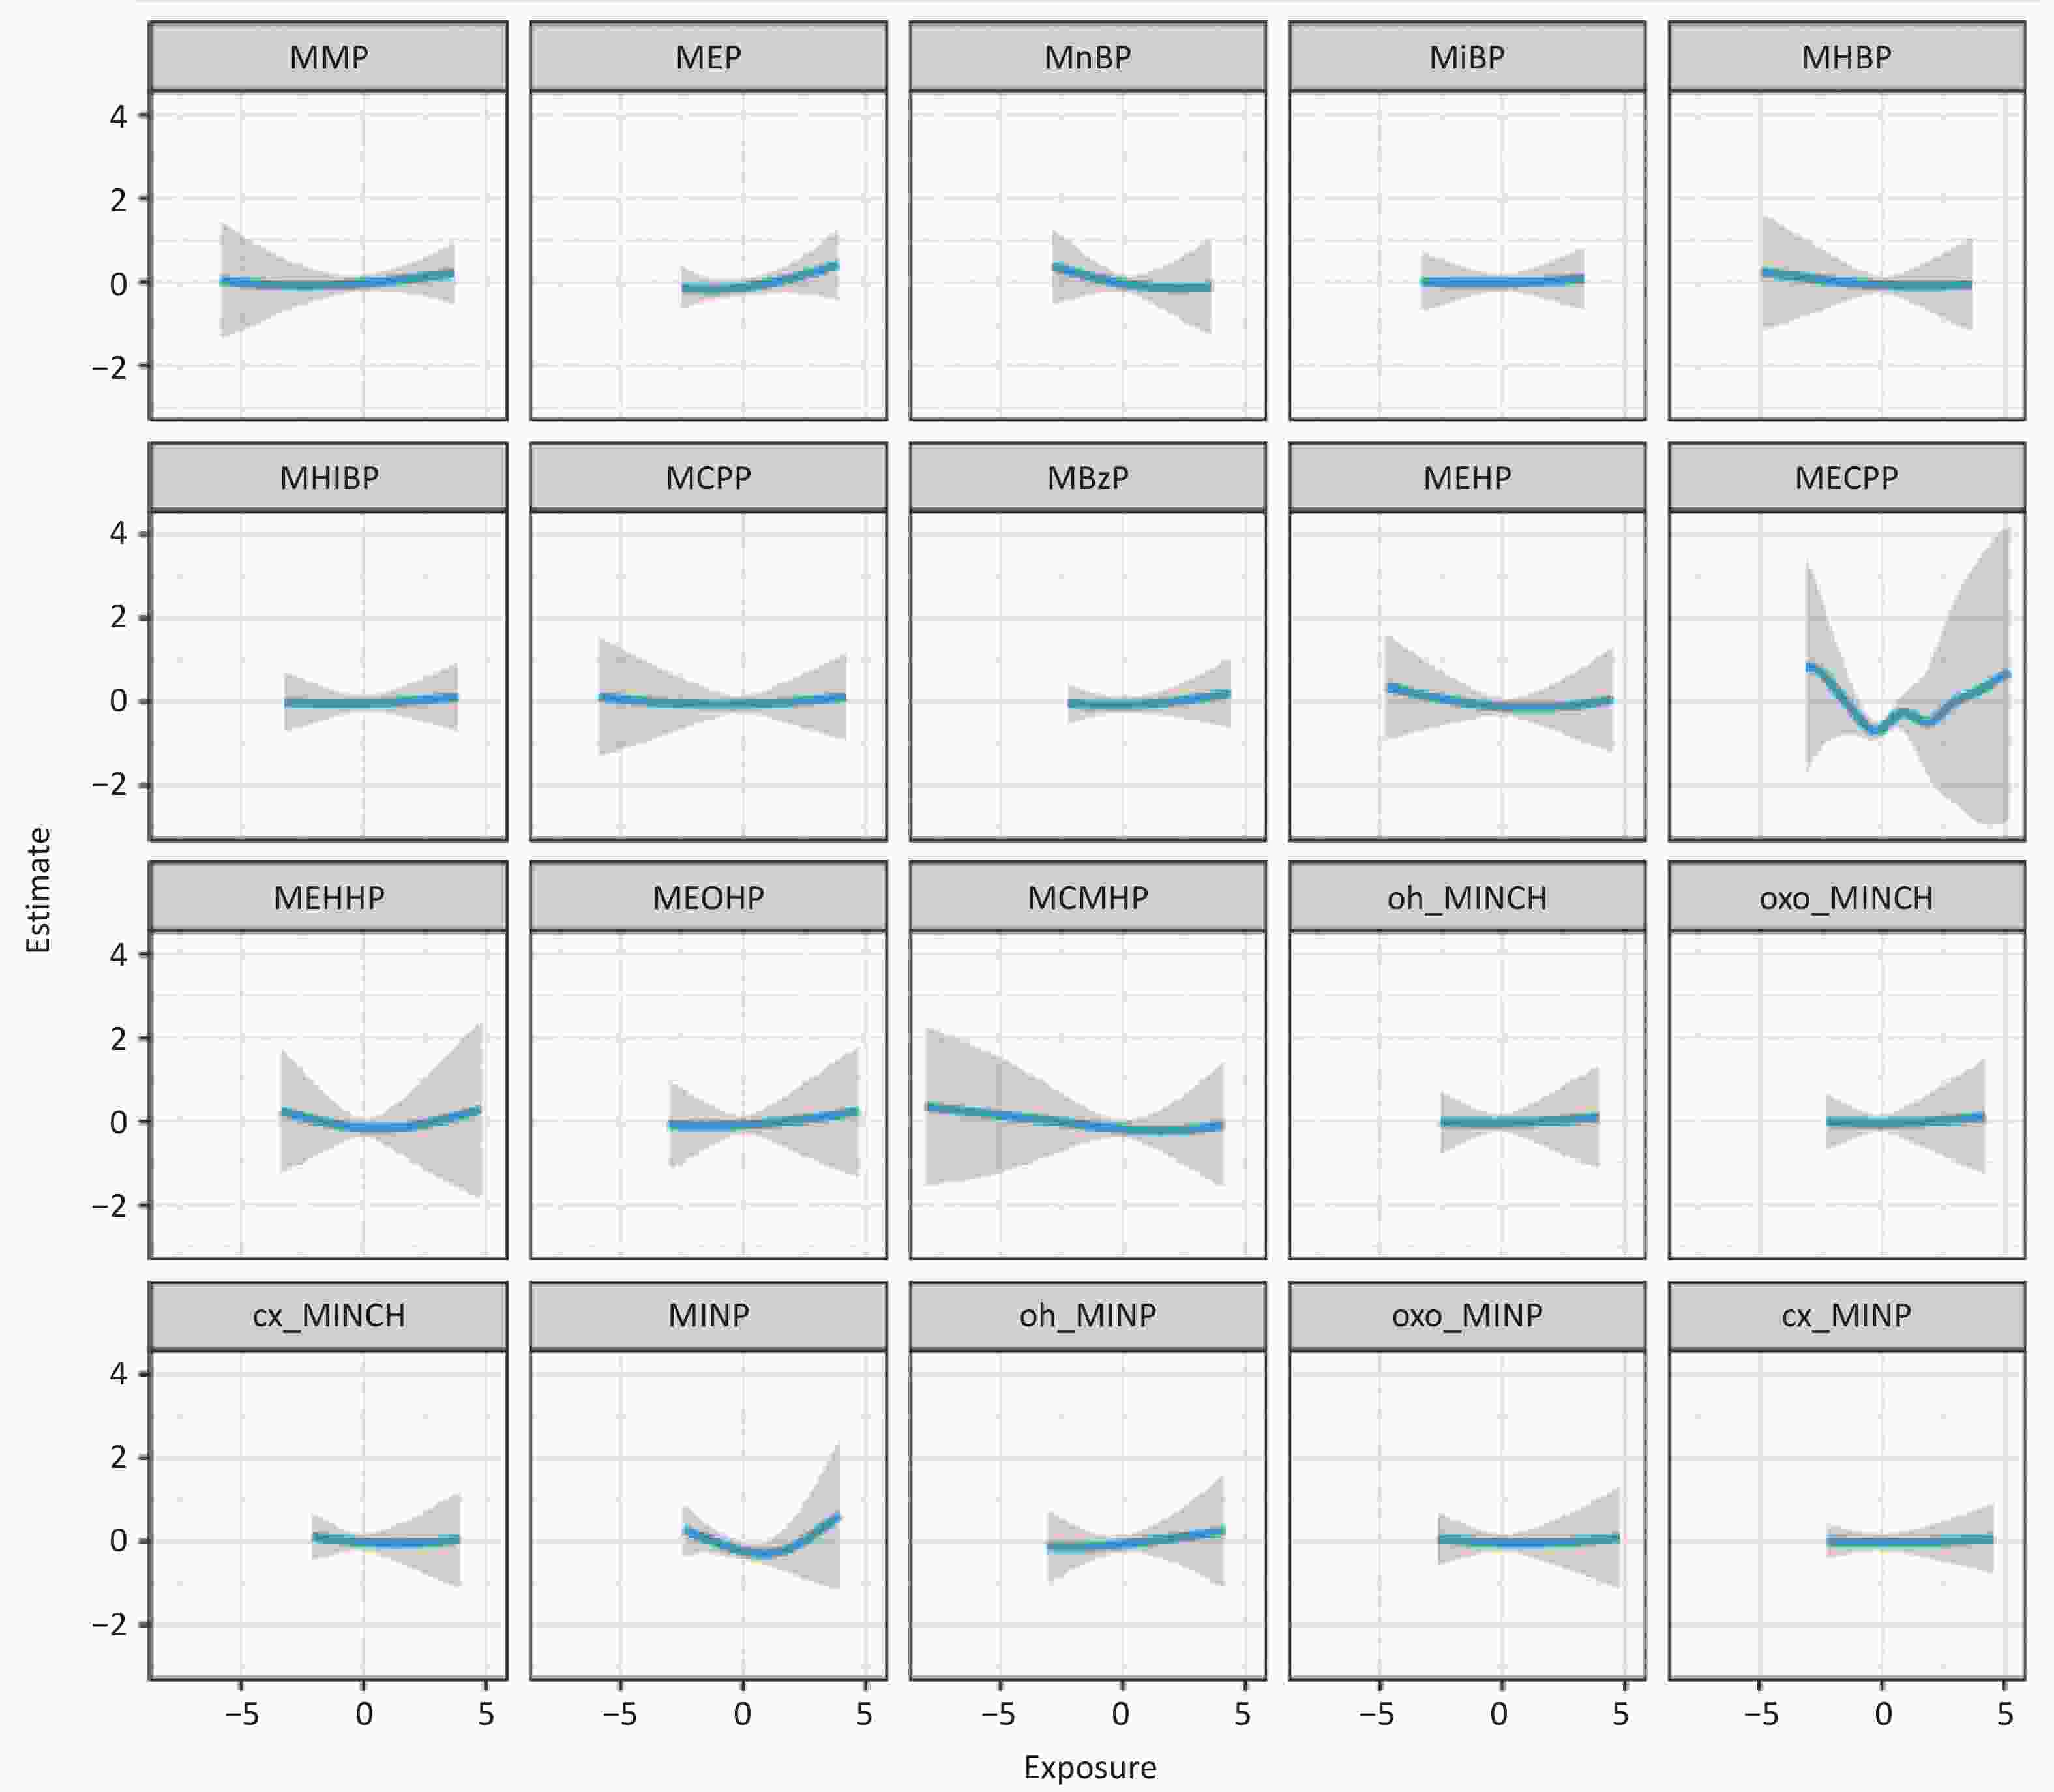
Figure 1. Univariate dose-response functions for phthalate metabolites and preterm birth risk, holding other biomarkers at median concentrations (adjusted for age, BMI, income, education, parity, residence, and smoking).
Consistent with the BKMR findings, WQS analysis showed no significant overall effect of the phthalate mixture on PTB (OR = 0.75; 95% CI: 0.50, 1.15) or GA (β = −0.03; 95% CI: −0.10, 0.04). WQS weights indicated that MBzP and DEHP metabolites contributed most to the PTB index, whereas MEHP was the largest contributor to the GA index (Supplementary Figure S4 and S5). Differences in the leading contributors identified by BKMR and WQS highlight the influence of model choice on mixture analyses. Furthermore, the BKMR analysis did not reveal any stable pairwise interactions among phthalate metabolites (Supplementary Figure S6).
The most notable finding of this study was the non-linear association between MMP exposure and PTB risk, suggesting a possible threshold effect. Emerging mechanistic evidence indicates that low-molecular-weight phthalates may impair trophoblast invasion and alter placental gene expression related to inflammation and angiogenesis[7]. For DiBP metabolites, previous evidence suggests disruption of progesterone and estrogen synthesis, as well as epigenetic modifications in placental tissue[8]. For DINP, experimental studies have reported oxidative stress and inflammatory responses in placental cells[9].
BKMR and WQS analyses did not show a significant mixture effect on PTB or GA (Figure 1, Supplementary Figure S3–S6). PIPs identified MEP (0.528), MiNP (0.549), and MECPP (0.499) as the most influential metabolites (Supplementary Table S3). In addition to limited statistical power due to the small number of PTB cases (n = 31), several factors may explain the null mixture findings: opposing biological pathways that produce antagonistic interactions, dominance of a small number of compounds, high multicollinearity among metabolites (r > 0.8), and non-linear threshold effects that may not be fully captured by linear models.
This study has several strengths, including its prospective design, first-trimester exposure assessment, and application of advanced mixture methods. However, this study has some limitations, including reliance on single-spot urine samples, although intraclass correlation coefficients of 0.3–0.6 support moderate reproducibility[10]; the small number of PTB cases, which provided 80% power to detect only relatively large effects (OR ≥ 3.0); and limited generalizability. Larger studies are warranted to confirm these findings and further characterize mixture effects during early pregnancy.
In conclusion, maternal exposure to MMP, MEP, MHiBP, and DINP was associated with shorter GA and increased PTB risk. Reducing phthalate exposure during early pregnancy may help prevent adverse birth outcomes.
HTML
Competing Interest The authors declare no relevant financial or non-financial interests to disclose.
Ethics Ethical approval was obtained from the Ethics Committee of Nanjing Medical University (NJMUIRB [2014>]248).
Author’S Contribution Conceived and supervised the study: Jiangbo Du and Zhibin Hu. Performed the initial analyses and revised the manuscript: Mamoud Alieu Jalloh, Yuxin Liu, and Qi Xi. Contributed to study design, data collection, and follow-up: Jing Wei, Cong Liu, Hong Lv, Xin Xu, Yuanyan Dou, Rui Qin, Bo Xu, Yue Jiang, and Jiaping Chen. Proofread the manuscript: Hongxia Ma, Tao Jiang, Jiong Li, and Yuan Lin. All authors have approved the final version of the manuscript, and agreed to be accountable for all aspects of the work.
Data Sharing The data used in this study are confidential.
Reference

 Quick Links
 DownLoad: