
-
Passive smoking, also known as secondhand smoke, remains a significant public health challenge globally, contributing to approximately 1.6 million deaths annually among non-smokers, according to 2025 estimates from the World Health Organization (WHO)[1]. Prospective evidence and systematic reviews have associated passive smoking with increased risks of all-cause mortality, cardiovascular disease, respiratory illnesses, and cancer in non-smoking populations[2]. However, the underlying biological pathways through which passive smoking affects health are not fully understood. Passive exposure is known to create an inflammatory microenvironment characterized by lymphocyte accumulation and elevated levels of inflammatory cytokines in the lungs[3] while also triggering oxidative stress[4]. Most mechanistic insights, however, originate from studies involving active smokers. There is a notable lack of multi-omics investigations directly and systematically exploring the biological processes related to passive smoking. This study aimed to evaluate the relationship between passive smoking and all-cause mortality in never-smokers, assess the potential mediating role of accelerated biological aging, and identify proteomic and metabolomic signatures associated with passive smoking exposure.
The United Kingdom (UK) Biobank is a large-scale prospective cohort comprising over 500,000 participants aged 40 to 69 years at recruitment[5]. Following the exclusion of ever-smokers, current smokers, and those with incomplete passive smoking data, 248,980 never-smokers were included (Figure 1). Passive smoking exposure was determined through self-reported weekly hours of exposure to others' tobacco smoke, both at home and outside. Participants reporting more than 0 hours per week in either setting were classified as exposed (n = 52,480), while the remaining 196,500 were considered unexposed. This binary classification (> 0 vs. 0 hours/week) was selected to reflect the public health principle that no level of secondhand smoke exposure is safe and to provide a clinically relevant contrast. Sensitivity analyses evaluated alternative exposure definitions, encompassing a continuous passive smoking index, three exposure categories (0, < 4, and ≥ 4 hours/week), and a stricter binary definition classifying participants with < 1 hour/week exposure as unexposed. It is acknowledged that self-reported exposure may introduce recall inaccuracies and social desirability biases, likely leading to effect estimates biased toward the null. The passive smoking index (total hours/week) was utilized to examine dose-response relationships through restricted cubic spline analysis. Baseline characteristics were presented as mean (standard deviation) or n (%), and standardized mean differences (SMDs) were calculated to quantify group imbalances independent of sample size. Imbalances in baseline characteristics among groups were observed (Table 1), necessitating subsequent adjustment.
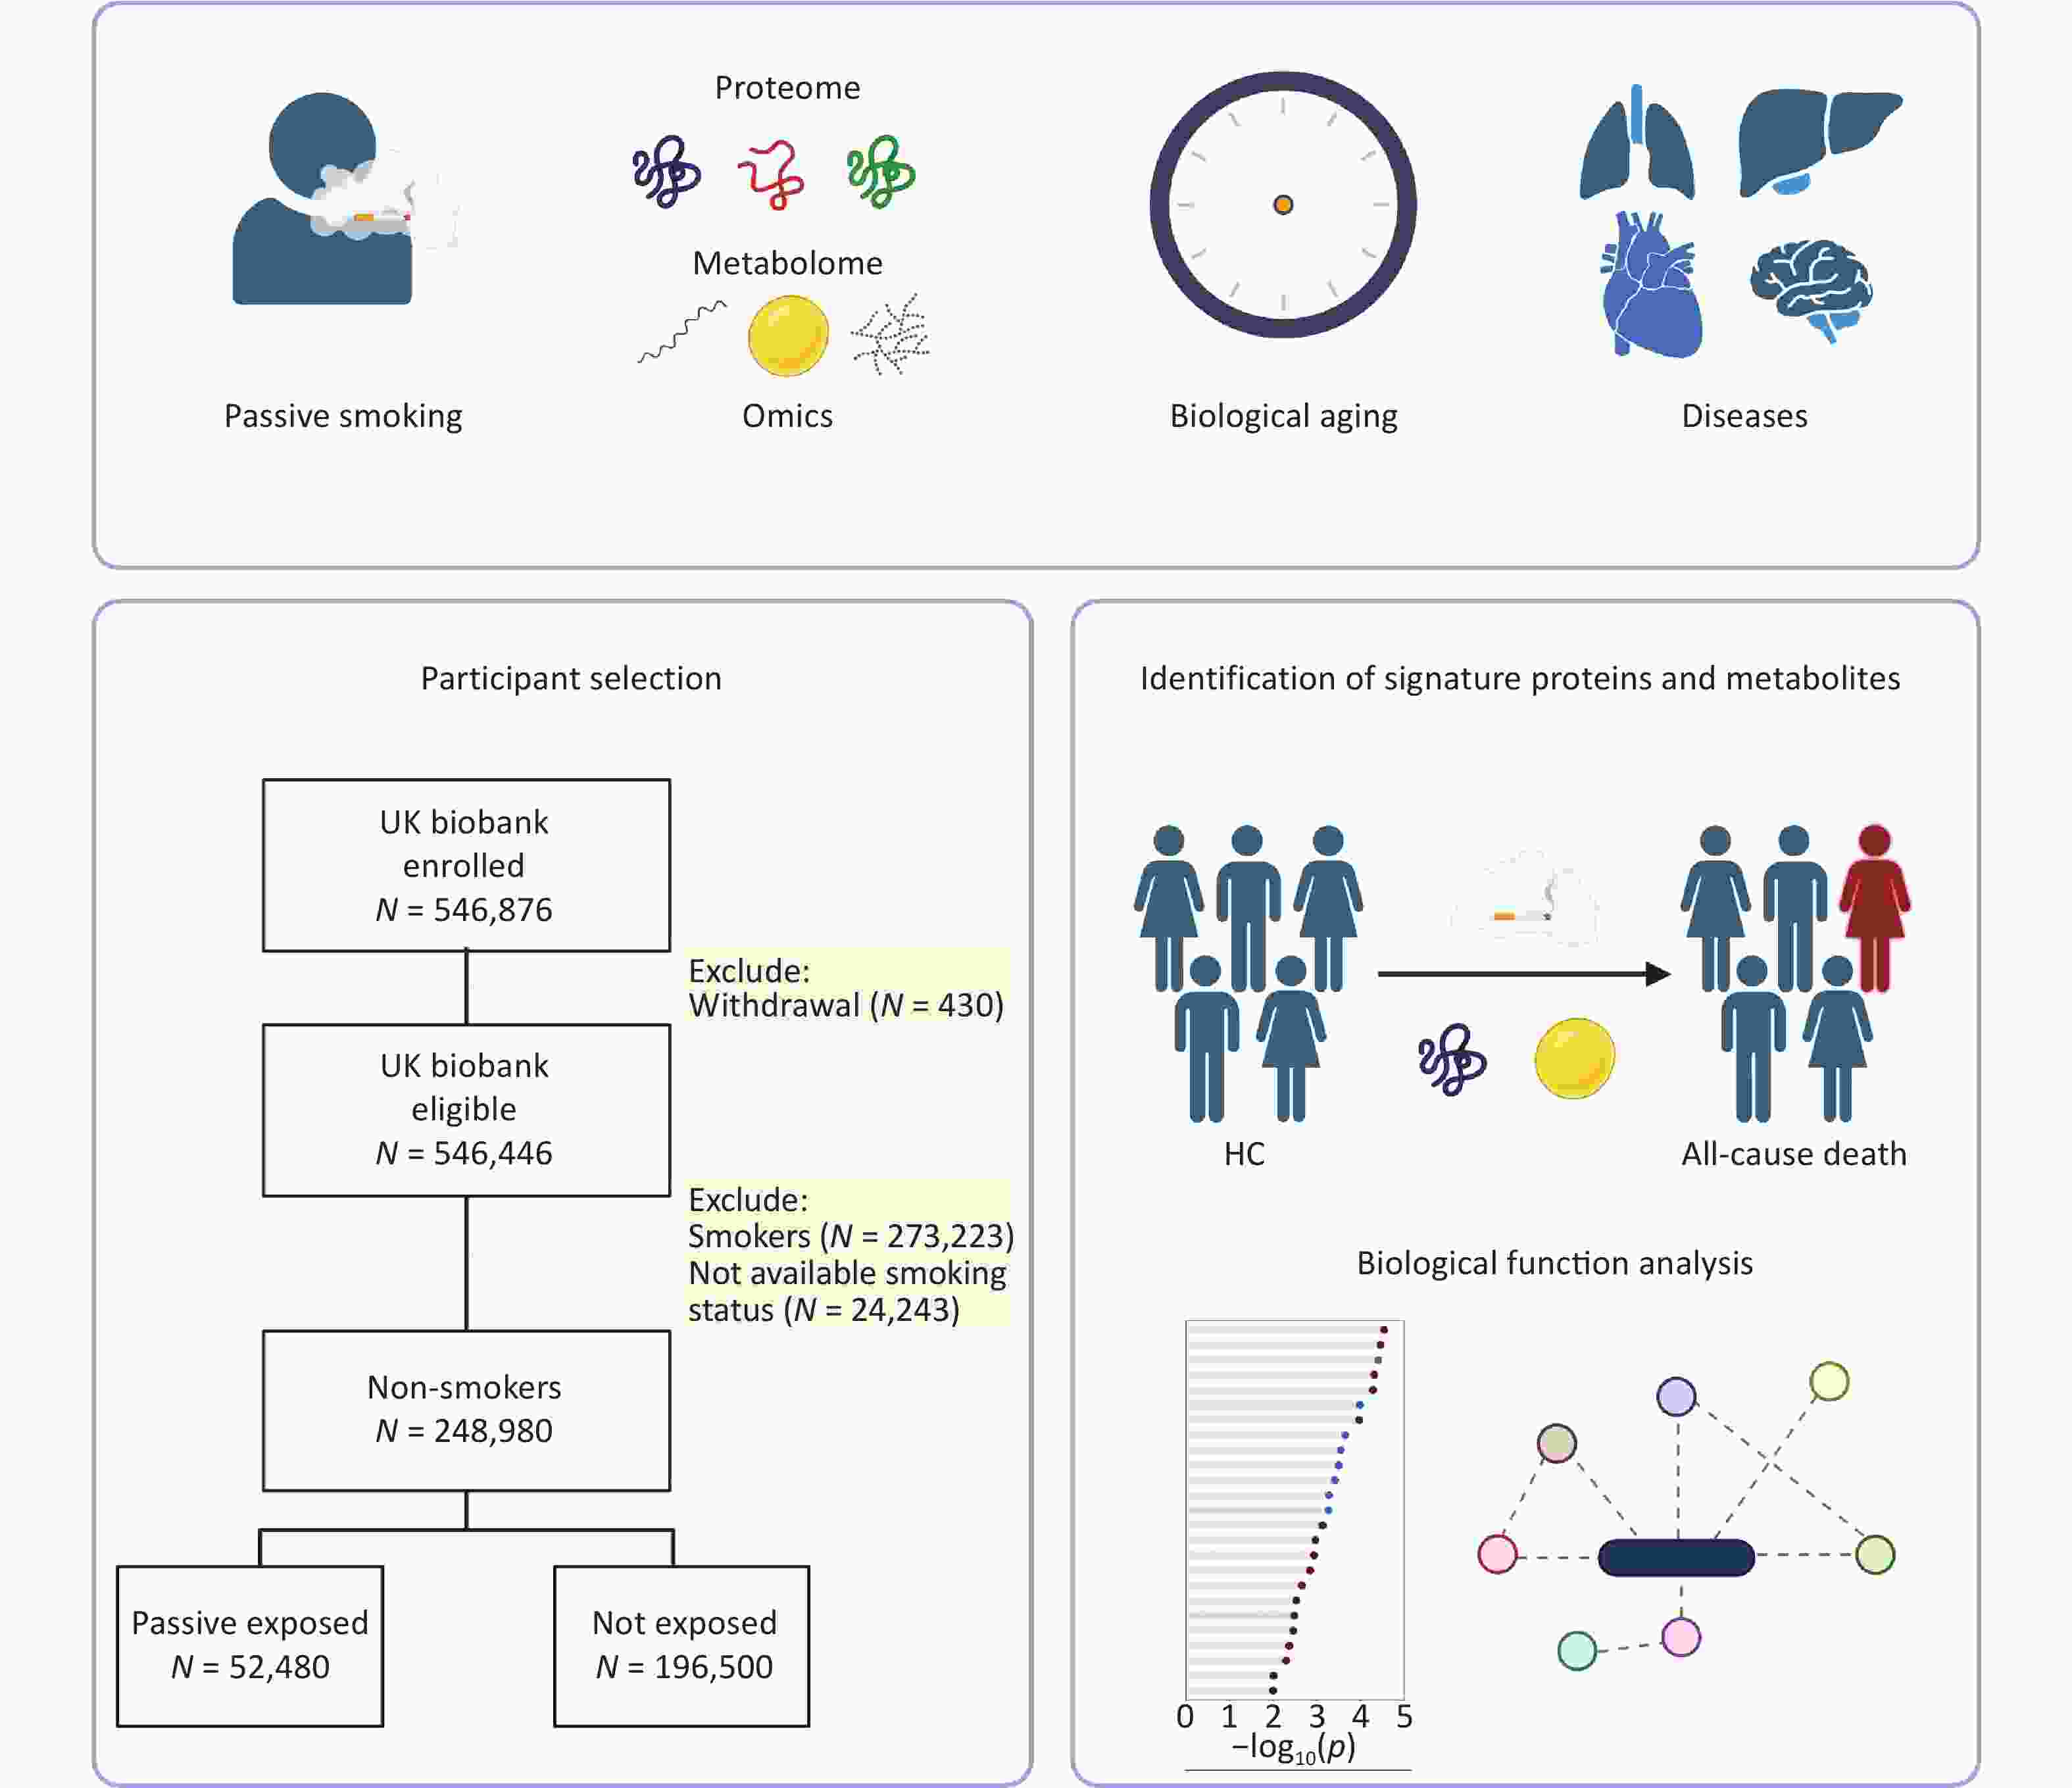
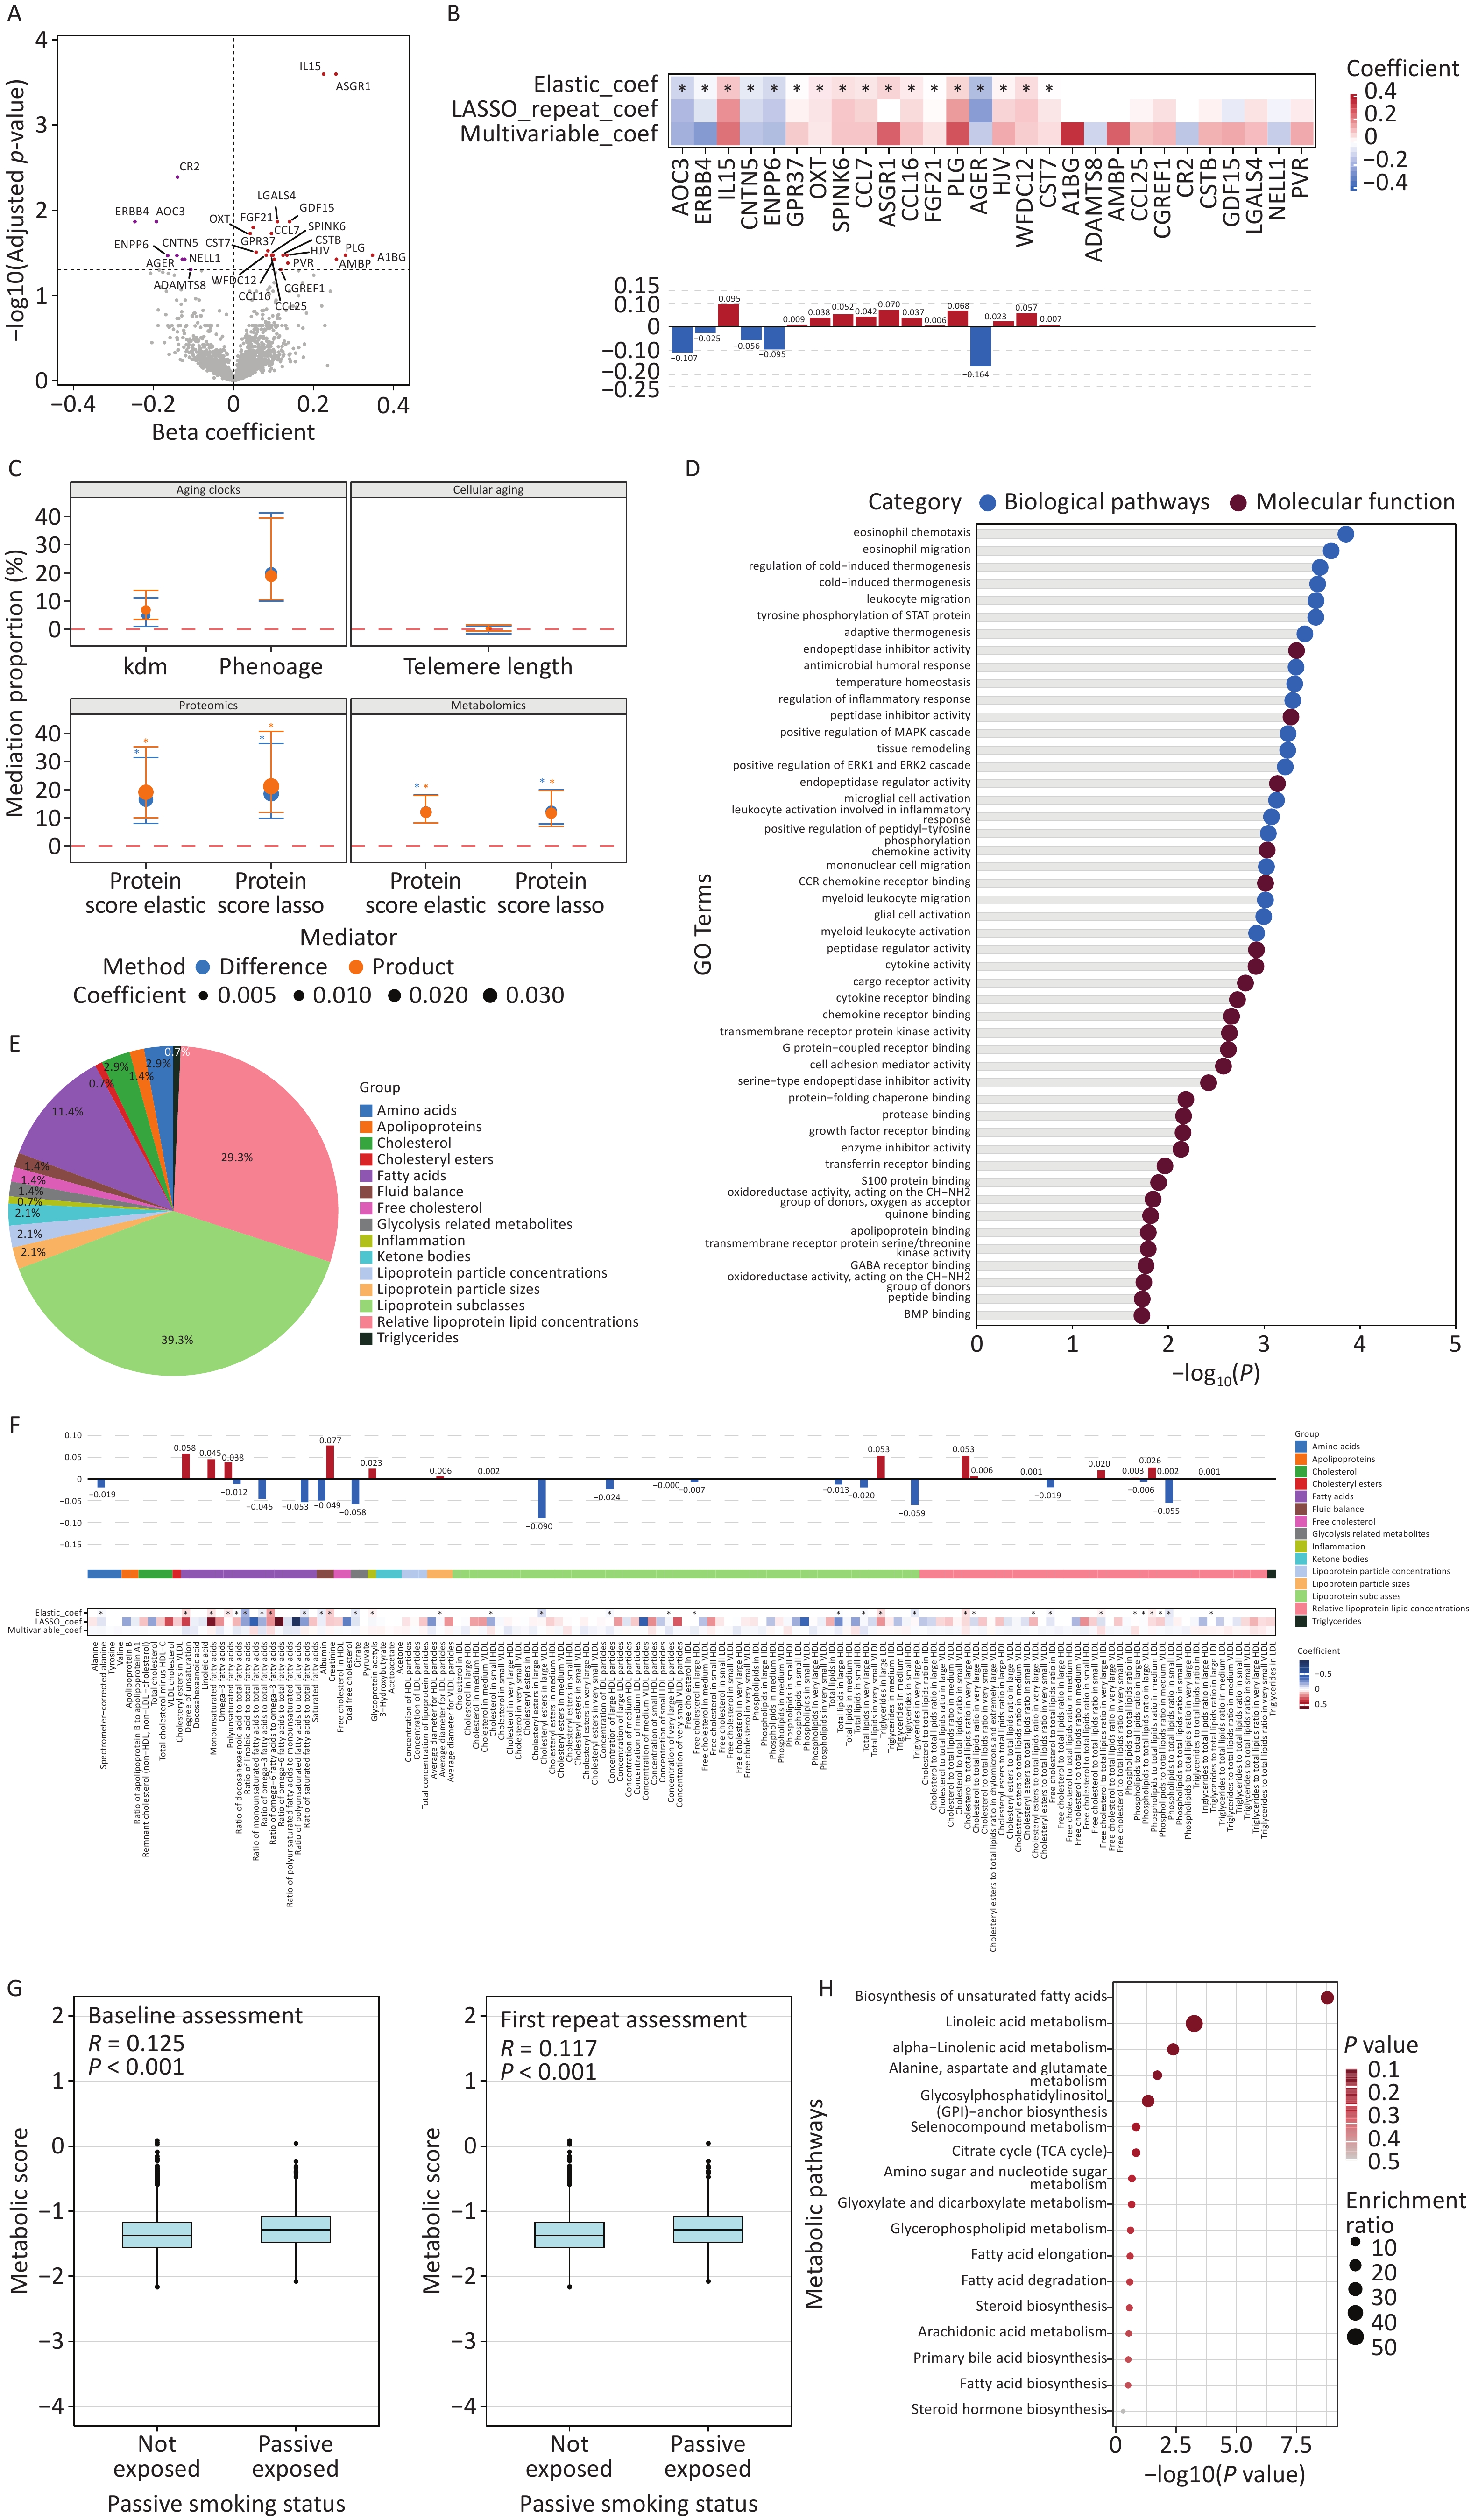
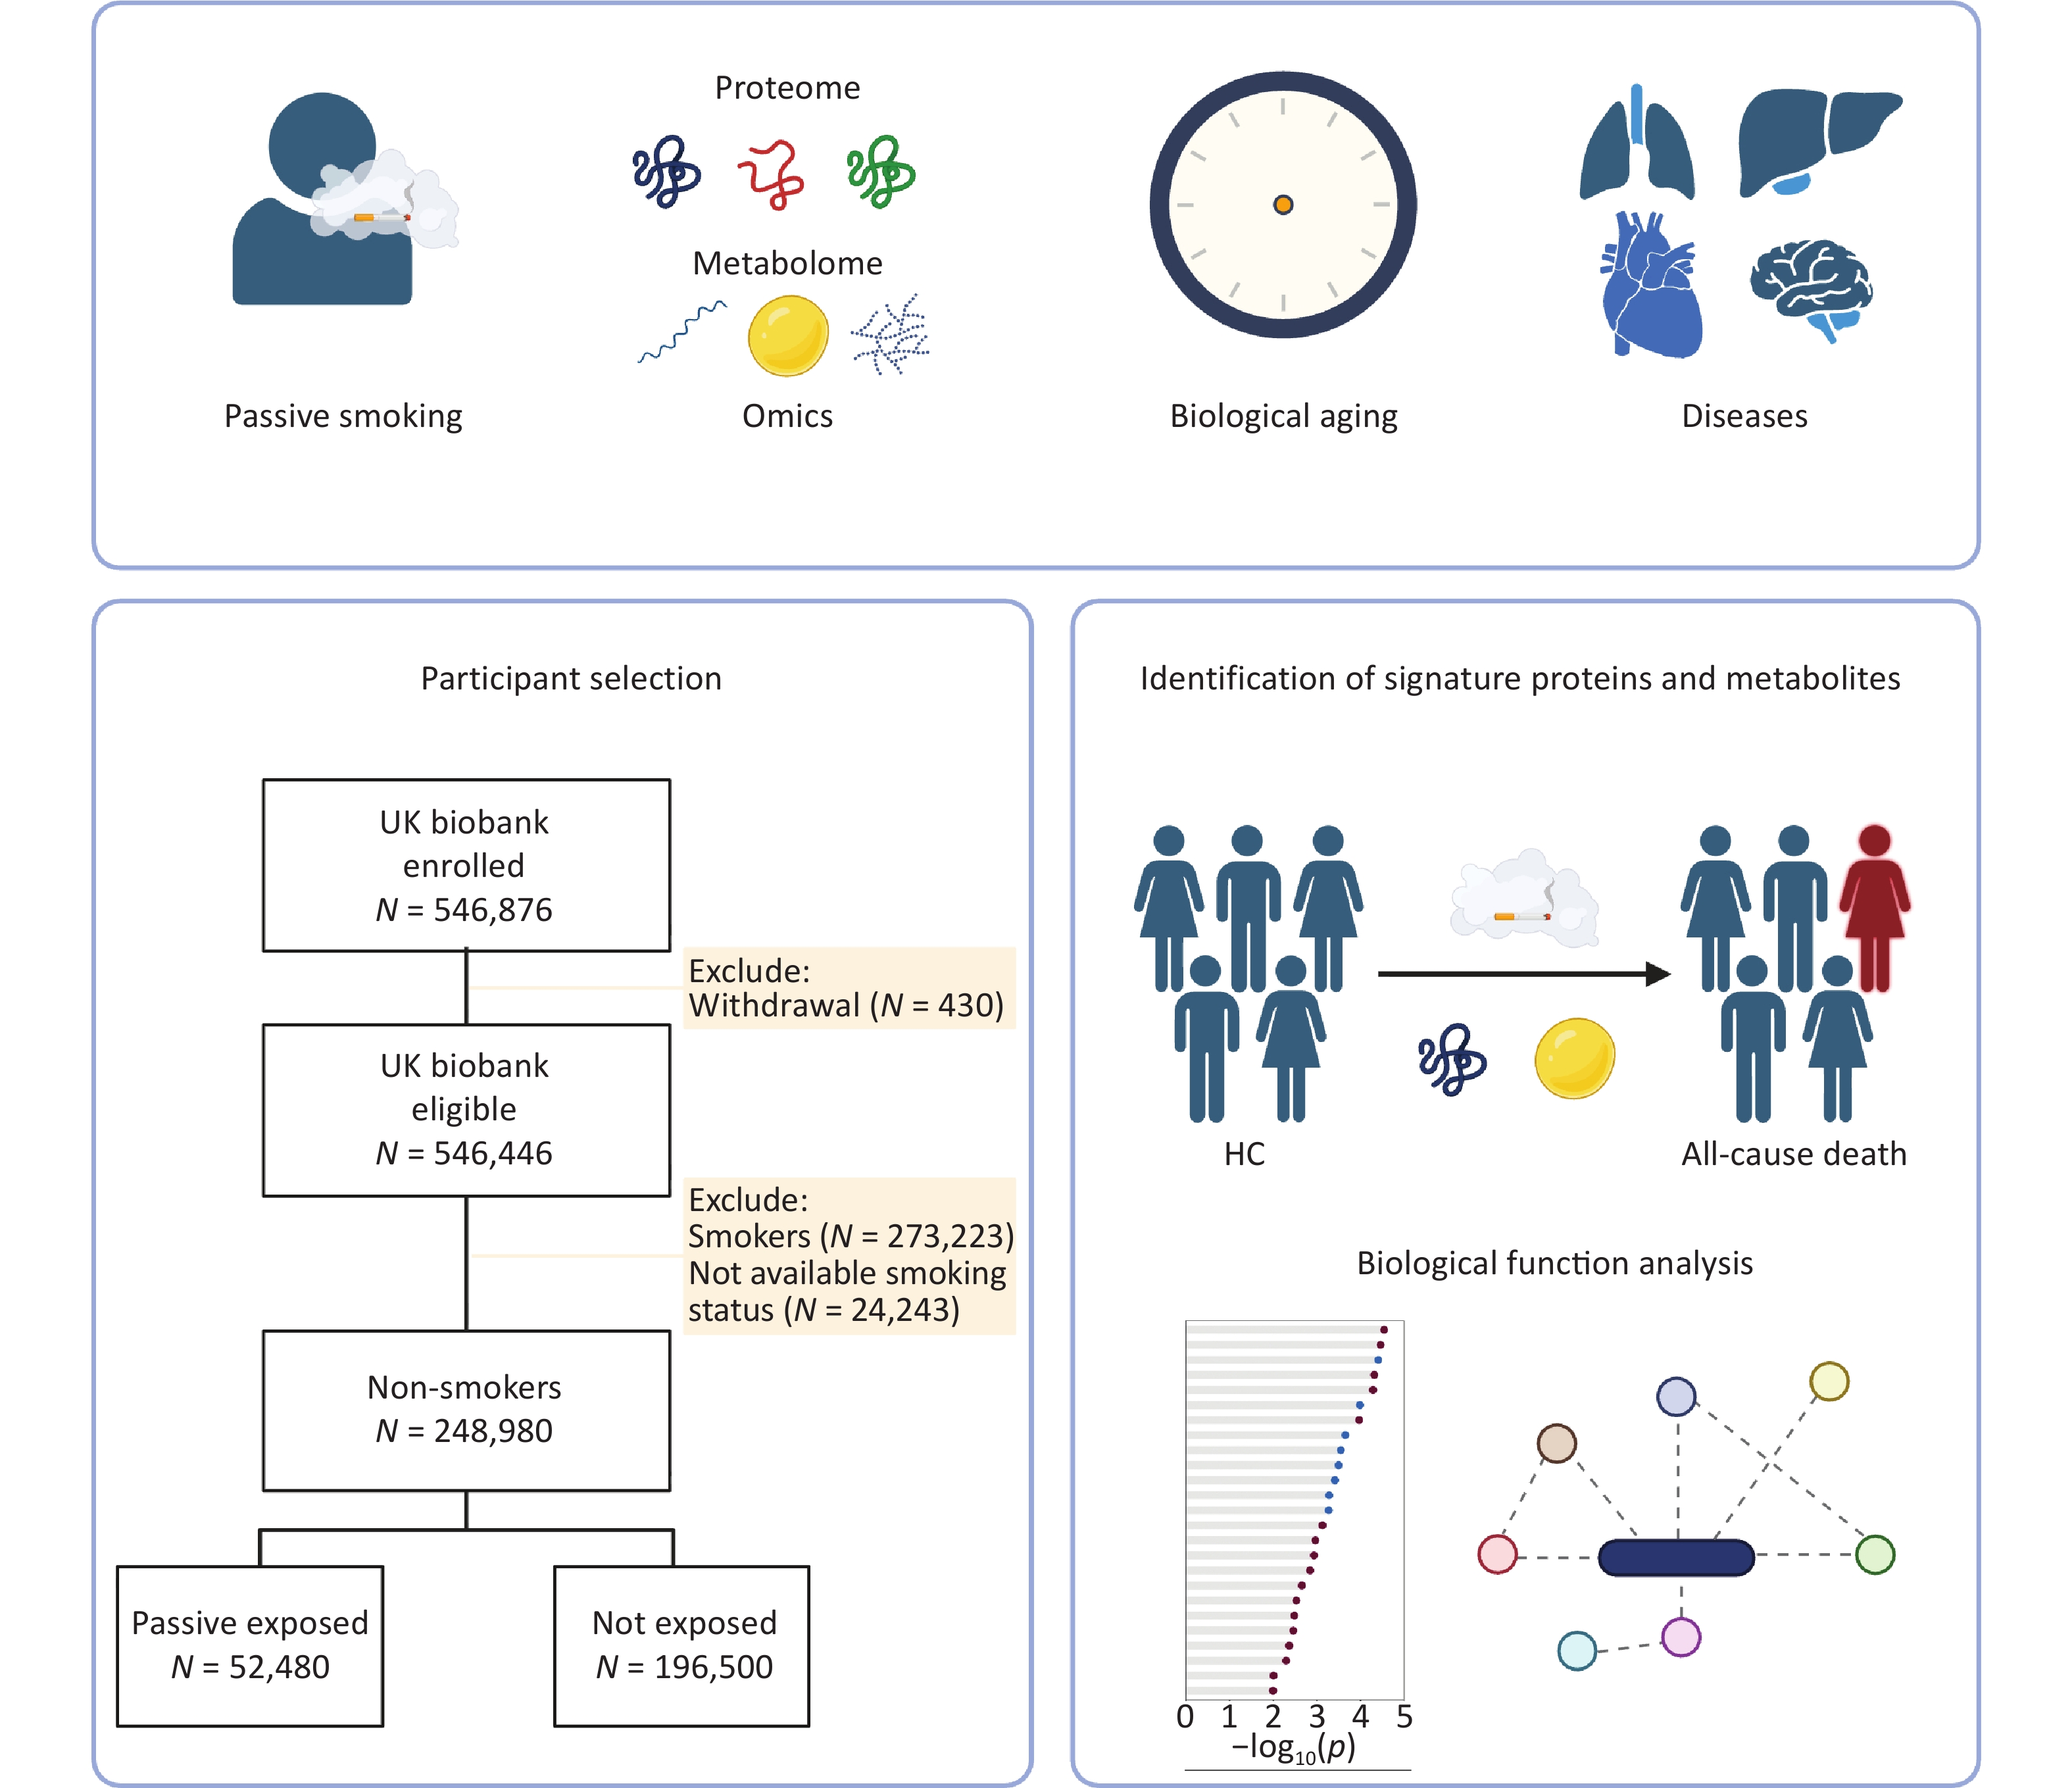
Figure 1. Study design overview and participant inclusion flow chart. (A) Study aims: to evaluate the association of passive smoking with all-cause mortality and its relationships with biological aging, proteome, and metabolome. (B) Among 546,876 enrolled participants, 248,980 never-smokers with available passive smoking data were included. (C) Multi-omics analyses were conducted among participants with available proteomic (n = 25,983) and metabolomic data (n = 242,369) to construct molecular signatures.
Characteristics Overall population
(N = 248,980)Passive Exposed
(N = 52,480)Not Exposed
(N = 196,500)P value SMD
(95% CI)Sex, male 103,228 (41%) 25,209 (48%) 78,019 (40%) < 0.001 0.17 (0.16 to 0.18) Age, years 55.66 ± 8.13 54.80 ± 8.17 55.89 ± 8.11 < 0.001 0.13 (0.13 to 0.14) BMI, kg/m2 27.12 ± 4.77 28.10 ± 5.10 26.86 ± 4.64 < 0.001 0.25 (0.24 to 0.26) Townsend Deprivation Index −1.67 ± 2.89 −0.87 ± 3.24 −1.89 ± 2.75 < 0.001 0.34 (0.33 to 0.35) PM2.5, µg/m3 9.92 ± 1.03 10.10 ± 1.06 9.88 ± 1.01 < 0.001 0.21 (0.20 to 0.22) PM2.5-10, µg/m3 6.41 ± 0.90 6.46 ± 0.90 6.40 ± 0.90 < 0.001 0.06 (0.05 to 0.07) PM10, µg/m3 16.17 ± 1.90 16.35 ± 1.88 16.12 ± 1.90 < 0.001 0.12 (0.11 to 0.13) Ethnicity < 0.001 0.18 (0.17 to 0.19) White 233,420 (94%) 47,520 (91%) 185,900 (95%) Mixed 1,265 (0.5%) 352 (0.7%) 913 (0.5%) Black or Black British 4,438 (2%) 1,900 (4%) 2,538 (1%) Asian or Asian British 5,909 (2%) 1,559 (3%) 4,350 (2%) Chinese 1,011 (0.4%) 229 (0.4%) 782 (0.4%) Other ethnic group 2,236 (0.9%) 753 (1%) 1,483 (0.8%) Education level < 0.001 0.20 (0.19 to 0.21) Less than high school 74,683 (30%) 18,098 (34%) 56,585 (29%) High school or equivalent 80,415 (32%) 18,324 (35%) 62,091 (32%) College or above 91,806 (37%) 15,514 (30%) 76,292 (39%) Birthplace < 0.001 0.11 (0.10 to 0.12) England 193,540 (78%) 39,543 (75%) 153,997 (78%) Wales 11,198 (4%) 2,204 (4%) 8,994 (5%) Scotland 20,039 (8%) 4,323 (8%) 15,716 (8%) Northern Ireland 1,457 (0.6%) 289 (0.6%) 1,168 (0.6%) Republic of Ireland 1,896 (0.8%) 429 (0.8%) 1,467 (0.7%) Elsewhere 20,556 (8%) 5,609 (11%) 14,947 (8%) Passive smoking index, hours/week 0.44 ± 2.41 2.08 ± 4.92 0.00 ± 0.00 < 0.001 0.60 (0.58 to 0.61) Alcohol consumption < 0.001 0.05 (0.04 to 0.06) Daily or almost daily 38,731 (16%) 7,773 (15%) 30,958 (16%) Three or four times a week 56,964 (23%) 11,511 (22%) 45,453 (23%) Once or twice a week 69,111 (28%) 14,713 (28%) 54,398 (28%) One to three times a month 30,783 (12%) 6,648 (13%) 24,135 (12%) Special occasions only 30,808 (12%) 6,834 (13%) 23,974 (12%) Never 22,471 (9%) 4,967 (9%) 17,504 (9%) Physical activity, MET-mins/week 2594.02 ± 2579.08 2823.99 ± 2781.68 2532.63 ± 2518.70 < 0.001 0.11 (0.10 to 0.12) KDM-BA, years 54.28 ± 8.80 53.74 ± 8.73 54.42 ± 8.81 < 0.001 0.08 (0.06 to 0.09) KDM-BA acceleration, years −0.14 ± 3.64 0.15 ± 3.80 −0.22 ± 3.59 < 0.001 0.10 (0.09 to 0.11) PhenoAge, years 49.08 ± 9.17 48.72 ± 9.28 49.17 ± 9.13 < 0.001 0.05 (0.04 to 0.06) PhenoAge acceleration, years −0.41 ± 4.30 0.09 ± 4.47 −0.53 ± 4.25 < 0.001 0.14 (0.13 to 0.15) Telomere length 0.05 ± 0.99 0.05 ± 0.99 0.05 ± 0.99 0.226 0.01 (0.00 to 0.02) Note. Values are presented as mean ± SD for continuous variables and n (%) for categorical variables. P-values were calculated using Pearson's chi-squared test or one-way analysis of variance, as appropriate. SMDs compare passive exposed and not exposed groups. BMI, body mass index; CI, confidence interval; KDM-BA, Klemera-Doubal method biological age; MET, metabolic equivalent of task; PM, particulate matter; SD, standard deviation; SMD, standardized mean difference; TDI, Townsend Deprivation Index. Table 1. Baseline characteristics of never-smokers grouped by passive smoking status
Biological age was assessed using two validated metrics. The Klemera-Doubal biological age (KDM-BA) estimates biological age by regressing multiple aging biomarkers—including albumin, creatinine, glucose, C-reactive protein, lymphocyte percentage, mean cell volume, red cell distribution width, alkaline phosphatase, and white blood cell count—against chronological age, employing a method that minimizes their covariance. PhenoAge, a composite measure derived from a Gompertz proportional hazard model, incorporates nine clinical biomarkers alongside chronological age to predict mortality. Both metrics were calculated using the BioAge R package and have been validated in UK Biobank data[6]. Age acceleration was computed as the residuals from regressing each biological age measure on chronological age, with positive values indicating accelerated aging. Leukocyte telomere length (TL) was measured using multiplex quantitative polymerase chain reaction (PCR) and subsequently z-standardized.
Plasma proteomic profiling was conducted on a randomly selected subset of 25,983 participants utilizing Olink's proximity extension assay technology, measuring 2,911 proteins after excluding those with more than 20% missing measurements (the threshold applied to mitigate the risk of assay failure or values below the detection limit). Baseline comparisons using SMDs confirmed that this proteomic subset was generally comparable to the entire cohort (all SMDs < 0.15, Supplementary Table S1). Metabolomic profiling was performed via nuclear magnetic resonance (NMR) spectroscopy in 242,369 participants, assessing 251 metabolic biomarkers; given that metabolomic data were available for nearly all analytic participants, additional representativeness comparisons were deemed unnecessary for this dataset.
For signature construction, associations between each protein/metabolite and passive smoking status were first evaluated using multivariable linear regression with Benjamini-Hochberg false discovery rate (FDR) correction for multiple testing. Significantly associated features (FDR < 0.05) were incorporated into elastic net logistic regression with 10-fold cross-validation for hyperparameter selection. The signature was computed as the weighted sum of selected features utilizing elastic net coefficients. Robustness was evaluated through 100 repetitions of least absolute shrinkage and selection operator (LASSO) regression with 10-fold cross-validation, retaining features with non-zero coefficients across all repetitions. The metabolic signature was further validated using internal repeat assessment visit data. Functional analyses included Gene Ontology biological process (GO-BP) enrichment for proteins, MetaboAnalyst enrichment for metabolites, and protein-protein interaction network analysis using STRING and Cytoscape.
Multivariable Cox proportional hazards models were utilized to estimate hazard ratios (HR) and 95% confidence intervals (CI) for all-cause mortality and cause-specific deaths. These models were adjusted for factors including age, sex, body mass index (BMI), Townsend deprivation index (TDI), ethnicity, education level, frequency of alcohol consumption, and physical activity (measured in metabolic equivalent of task [MET]-minutes/week). Additional analyses accounted for particulate matter with an aerodynamic diameter ≤ 2.5 µm (PM2.5) air pollution in 2010 and excluded participants with baseline cancer or prevalent chronic diseases. E-values were calculated to determine the minimum strength of association that an unmeasured confounder would need to exhibit with both passive smoking and mortality to account for the observed association. Mediation analyses employed product and difference methods to decompose the overall association between passive smoking and mortality into direct and indirect effects through biological aging and omics signatures. Given that exposure and mediators were measured concurrently at baseline, a temporal sequence cannot be established; these analyses were interpreted as exploratory decompositions of the total association rather than formal causal mediation. Joint effects of proteomic and metabolomic signatures were evaluated utilizing quantile-based g-computation[7].
During a median follow-up of 14.8 years, passive smoking was linked to a 12% increased risk of all-cause mortality (adjusted HR = 1.12, 95% CI 1.08–1.17, P < 0.001, Supplementary Figure S1A). Although this association demonstrates a modest magnitude, its direction aligns with a prior systematic review and meta-analysis indicating an 18% higher all-cause mortality risk among never-smokers exposed to secondhand smoke[2]. Considering the high prevalence of passive smoking among never-smokers globally, even a modest relative risk may correspond to a significant population-attributable burden. Spline analysis revealed a significant positive dose-response relationship between the passive smoking index and mortality risk (Supplementary Figure S1B). Alternative exposure definitions yielded consistent findings: each 1-hour/week increase in the passive smoking index was associated with an increased mortality risk (HR = 1.01, 95% CI 1.00–1.01), while exposures of < 4 and ≥ 4 hours/week were associated with HRs of 1.08 (95% CI 1.04–1.13) and 1.31 (95% CI 1.21–1.41), respectively, compared to 0 hours/week (Supplementary Table S2). When participants with < 1 hour/week exposure were categorized as unexposed, the association remained unchanged (HR = 1.12, 95% CI 1.08–1.17; Supplementary Table S2). The robustness of these associations persisted across sensitivity analyses excluding participants with baseline diseases and additional adjustments for PM2.5, as well as across subgroups defined by age, sex, and BMI (Supplementary Tables S2–S3). In terms of cause-specific mortality, passive smoking was associated with a 63% increased risk of death from lung disease (excluding cancer) (HR = 1.63, 95% CI 1.28–2.07, P < 0.001), with marginally elevated risks identified for deaths due to coronary artery disease (HR = 1.17, 95% CI 1.02–1.35, P = 0.022), cancer (HR = 1.08, 95% CI 1.00–1.15, P = 0.037), and non-alcoholic fatty liver disease (NAFLD) (HR = 1.99, 95% CI 1.09–3.64, P = 0.026, Supplementary Figure S1C). The E-value for the primary all-cause mortality association was 1.39 for the point estimate and 1.29 for the lower confidence limit, indicating that an unmeasured confounder would need to be associated with both passive smoking and mortality at least at these magnitudes to fully explain the association (Supplementary Table S2).
Passive smoking was associated with accelerated biological aging, as indicated by KDM-BA (adjusted β = 0.022, 95% CI 0.011–0.033, P < 0.001) and PhenoAge (adjusted β = 0.046, 95% CI 0.035–0.057, P < 0.001). No significant difference in TL was observed between groups (adjusted β = −0.01, 95% CI −0.02–0.003, P = 0.15). Biological age acceleration played a notable mediating association role: KDM-BA acceleration accounted for 6.9% (95% CI 3.6–13.7%) of the association between passive smoking and mortality, while PhenoAge acceleration accounted for 18.9% (95% CI 10.5–39.5%), suggesting that the erosion of systemic physiological integrity is a significant pathway through which passive smoking may reduce lifespan.
From the proteomic analysis, 28 proteins were significantly linked to passive smoking status after FDR correction (Figure 2A). Elastic net regression revealed a 17-protein signature (including AGER, AOC3, ASGR1, CCL16, CCL7, CNTN5, CST7, ENPP6, ERBB4, FGF21, GPR37, HJV, IL15, OXT, PLG, SPINK6, WFDC12), all of which were robustly selected through repeat LASSO analysis (Figure 2B). This proteomic signature was associated with a significantly elevated risk of all-cause mortality (adjusted HR = 3.25, 95% CI 2.50–4.22, P < 0.001, Figure 2C), independent of passive smoking status. The signature accounted for 19.1% (95% CI 10.0–35.3%) of the passive smoking-mortality association in exploratory mediation analyses (Supplementary Table S4). Enrichment analyses indicated that these proteins are involved in eosinophil chemotaxis and migration, cold-induced thermogenesis, and leukocyte migration (Figure 2D). The protein-protein interaction network identified plasminogen (PLG) as the protein with the highest connectivity.
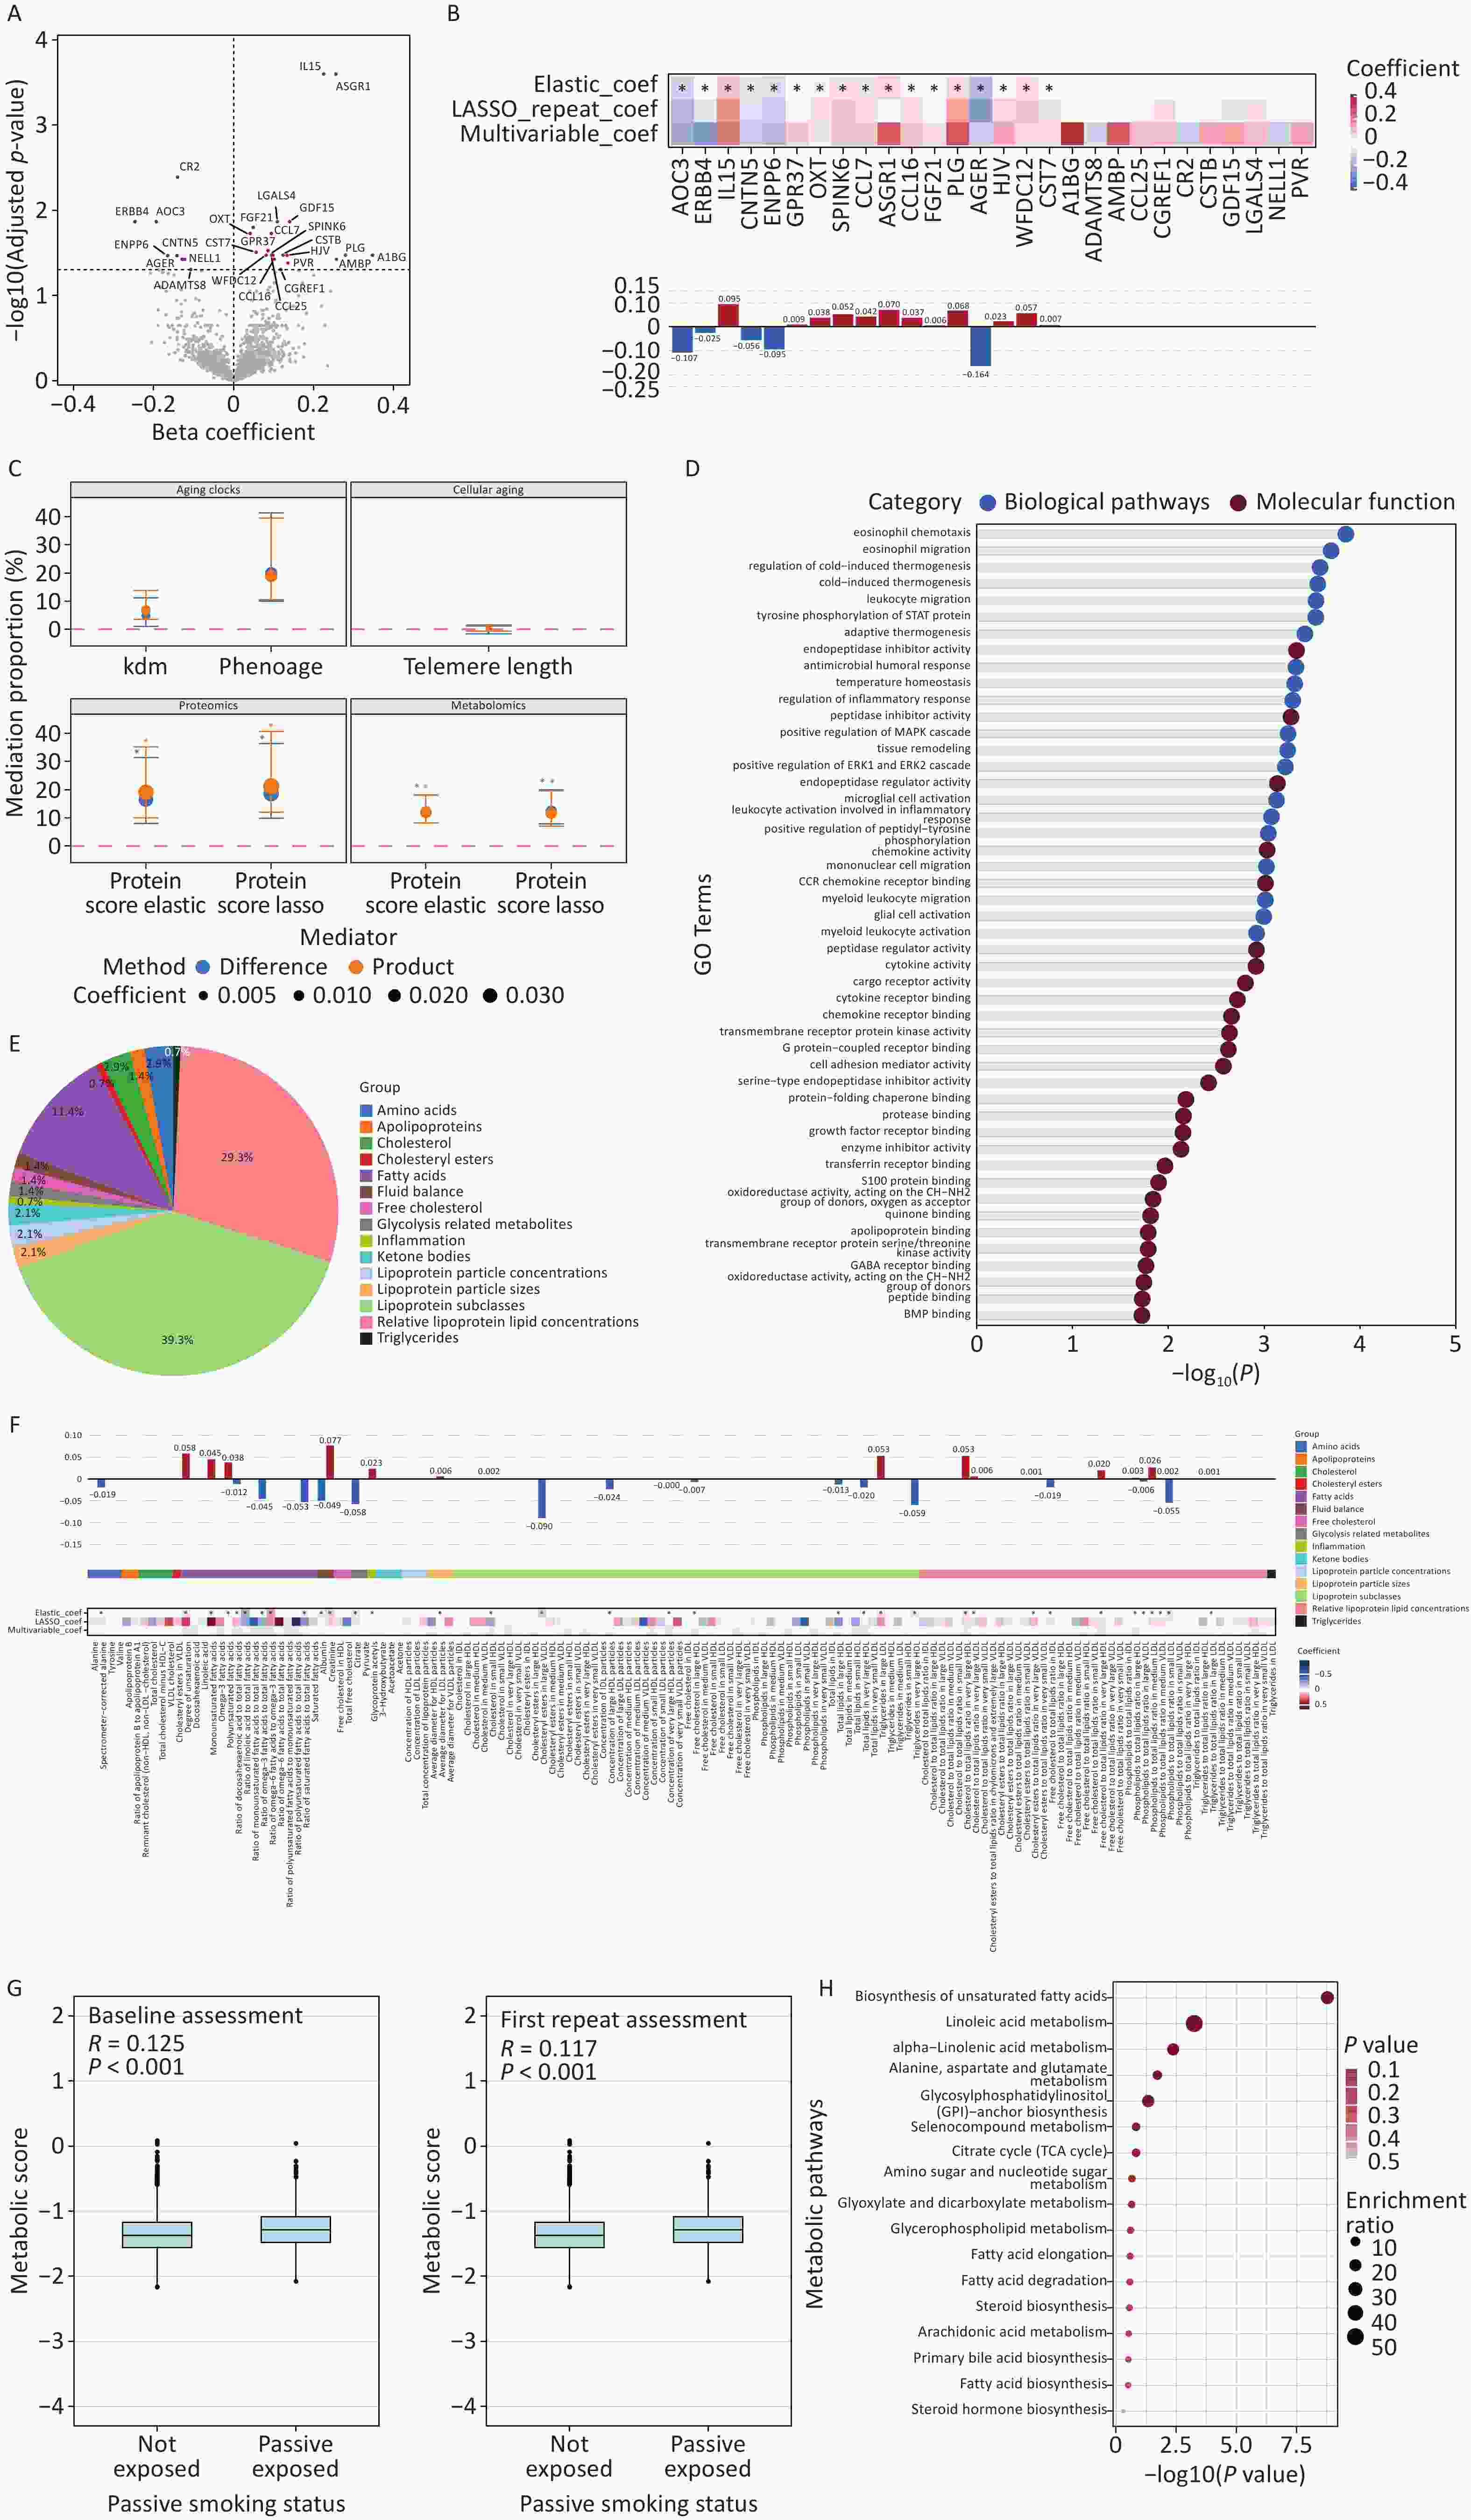
Figure 2. Passive smoking-related proteomic and metabolomic signatures. (A) Volcano plot of 2,911 proteins tested for association with passive smoking status by multivariable linear regression with false discovery rate (FDR) correction; 28 proteins reached FDR < 0.05. (B) Protein coefficients from elastic-net, repeat-least absolute shrinkage and selection operator (LASSO), and multivariable models; asterisks indicate proteins retained in the 17-protein signature. (C) Exploratory mediation analysis results for biological aging, proteomic, and metabolic signatures showing indirect association proportions with 95% CI. (D) Gene Ontology biological process (GO-BP) enrichment results for the passive-smoking-associated proteins. (E) Distribution of metabolite classes in the metabolic signature. (F) Metabolic-signature coefficients and feature classes. (G) Internal validation of the metabolic signature at baseline and first repeat assessment. (H) Enrichment results for the passive-smoking-associated metabolites.
In the metabolomic analysis, 140 metabolites were significantly associated with passive smoking after FDR correction (Figure 2E). A 34-metabolite signature was constructed, with 33 of 34 components (97%) robustly selected through repeat LASSO analysis (Figure 2F) and showed statistically significant but modest reproducibility in the first repeat assessment (r = 0.117, P < 0.001, Figure 2G). This metabolic signature correlated with a 51% increased risk of all-cause mortality (adjusted HR = 1.51, 95% CI 1.42–1.61, P < 0.001) and accounted for 12.0% (95% CI 8.1–18.0%) of the passive smoking-mortality
association. Enrichment analysis identified biosynthesis of unsaturated fatty acids and linoleic acid metabolism as the top two enriched pathways (adjusted P < 0.05, Figure 2H and Supplementary Table S6). The proteomic and metabolic signatures jointly affected mortality (HR = 1.10 per simultaneous one-decile increase, 95% CI 1.07–1.12, P < 0.001), with the proteomic signature contributing 79% and the metabolic signature 21% of the joint effect, indicating that proteomic alterations may represent a predominant downstream consequence of passive smoking exposure.
This study offers several novel contributions. First, it was demonstrated that biological age acceleration significantly accounted for a substantial proportion of the association between passive smoking and mortality, particularly highlighting PhenoAge acceleration (18.9%), reinforcing the notion that passive smoking is linked to systemic physiological decline[8]. Second, the identified proteomic signature was enriched in immune and inflammation-related pathways, consistent with prior evidence indicating that passive smoking fosters a pro-inflammatory state. AGER (RAGE), a pattern recognition receptor in alveolar type I cells, has been implicated in downstream PI3K-Akt and NF-κB signaling in experimental models of secondhand smoke exposure[9]. Third, the metabolic signature revealed disturbances in the biosynthesis of unsaturated fatty acids and linoleic acid metabolism. Given the known anti-inflammatory and antioxidant properties of these fatty acids[10], this finding aligns with the proteomic evidence of inflammatory pathway involvement, warranting further experimental validation.
Several limitations warrant consideration. First, the assessment of passive smoking relied on self-reporting; objective measures such as cotinine or nicotine biomarkers were unavailable for this population, which would have provided a more accurate exposure assessment. Second, external validation cohorts for the molecular signatures were not accessible, although robustness was supported by cross-validation, repeat LASSO analysis, and internal validation using repeat assessment data. Third, both passive smoking exposure and molecular mediators were assessed during the same baseline visit, leading to an interpretation of mediation analyses as exploratory decompositions of associations rather than definitive causal relationships. Fourth, residual confounding from variables such as dietary patterns, occupational exposures, and indoor environmental conditions may persist, despite adjustments for socioeconomic indicators, alcohol consumption, physical activity, baseline health status in sensitivity analyses, and PM2.5 exposure. While E-value analyses offer a quantitative benchmark for evaluating the potential impact of unmeasured confounding, they do not fully mitigate this concern. Fifth, the UK Biobank participants predominantly comprise individuals of white ethnicity (94%), which may limit the generalizability of these findings to more diverse populations where patterns of passive smoking prevalence differ. Finally, mechanistic interpretations drawn from pathway enrichment analyses would require experimental validation to support their accuracy.
In conclusion, this large-scale prospective study establishes that passive smoking is associated with increased all-cause mortality among never-smokers, with biological age acceleration contributing to this association. Specific proteomic and metabolomic signatures related to inflammation, immune response, and fatty acid metabolism were identified as correlates of passive smoking exposure, further accounting for the associated mortality risk. These findings highlight the public health significance of comprehensive smoke-free policies and highlight potential molecular pathways for future investigation.
Supplementary materials: Supplementary Figure S1 (mortality curves, dose-response analysis, and cause-specific mortality) and Supplementary Tables S1–S6 are provided as online-only supplementary files.
HTML
Competing Interests All authors declare no competing interests.
Ethics Provided by the UK Biobank study.
Authors’ Contributions Conception and design: Ziqi Wan, Nan Zhao. Administrative support: Ziqi Wan, Jiarui Mi, Jieying Tang. Methodology: all authors. Data analysis: Ziqi Wan, Jiarui Mi, Nan Zhao. Interpretation: all authors. Manuscript writing and reviewing: all authors.
Data Sharing This study used UK Biobank data under Application 100787. Data access can be requested via https://www.ukbiobank.ac.uk/. The supplementary materials will be available in www.besjournal.com.
&These authors contributed equally to this work.
Reference

 Quick Links
 DownLoad: