
-
Alzheimer’s disease (AD) is the leading cause of dementia, affecting millions of people worldwide[1,2]. Although this disease is classically characterized by amyloid plaques and neurofibrillary tangles in the brain, a growing body of research has shown that disrupted energy metabolism is also a fundamental feature[3–5]. Recent evidence from chronotype- and gut-brain axis-related studies suggests that systemic metabolic and circadian factors may contribute to AD risk, further supporting the need to examine AD from a broader metabolic perspective[6]. Imaging studies have shown that glucose utilization declines in key brain regions years before clinical symptoms appear, primarily due to impaired glycolysis, which fails to meet the energy demands of synaptic function[7–9]. Despite the well-recognized cerebral hypometabolism in AD, lactate dehydrogenase (LDH)-related metabolic alterations in AD have not been systematically characterized. In particular, it remains unclear whether circulating LDH activity is altered in mild cognitive impairment (MCI) and AD and how LDH-encoding genes are expressed across different brain regions.
LDH plays a critical role in glycolysis, converting pyruvate to lactate and back and is essential for maintaining the energy balance and redox state of various cells[10,11]. In clinical practice, LDH is a marker of cell damage, and its levels increase in conditions such as cancer, myocardial infarction, or tissue injury[12–14]. Previous studies have provided valuable evidence regarding LDH- and lactate-related metabolism in AD, including cerebrospinal fluid lactate levels, LDH release in experimental models, and tissue-specific changes[15–19]. However, how these LDH-related alterations are reflected at the clinical level and within brain transcriptomic networks remains unclear.
In this study, we evaluated LDH-related alterations in AD from clinical and transcriptomic perspectives. We measured serum LDH activity in a clinical cohort, including HC and patients with MCI and AD, and analyzed its association with cognitive function. We then used public brain transcriptomic datasets to analyze LDHA and LDHB expression patterns across different brain regions and cell types. Finally, we performed co-expression analysis, enrichment analysis, protein–protein interaction (PPI) network analysis, and AD-related weighted gene co-expression network analysis (WGCNA) to characterize the functional networks associated with LDH-encoding genes. This study aimed to evaluate the relationship between LDH-related alterations and AD and explore the biological processes (BPs) potentially involved in LDHA- and LDHB-associated transcriptional networks.
-
This retrospective study included participants from Xuanwu Hospital, Capital Medical University. Patients with cognitive impairment were recruited from the Department of Neurology and HC were recruited from the Health Examination Center during the same study period. Experienced neurologists diagnosed MCI and AD according to the 2011 National Institute on Aging–Alzheimer’s Association (NIA–AA) criteria[20,21].
Exclusion criteria were defined to minimize potential confounding factors such as systemic and organ dysfunction, medications, and alcohol consumption. Participants were excluded if they met any of the following conditions: (1) history of stroke, traumatic brain injury, neurosyphilis, or other neurological or psychiatric disorders that could affect cognitive function; (2) acute or unstable cardiovascular or cerebrovascular events, malignancy, severe systemic illness, or any hepatic or renal dysfunction; (3) acute febrile illness or active infection, perioperative recovery after major surgery, or known infectious diseases such as syphilis or HIV; and (4) documented alcohol abuse or long-term heavy alcohol consumption.
HC were selected from individuals who underwent routine health examinations during the study period. The inclusion criteria for HCs were as follows: (1) recruitment from the Health Examination Center; (2) no documented cognitive complaints; (3) no clinical diagnosis of MCI, AD, or other types of dementia; and (4) no documented major neurological or psychiatric disorders. Because MMSE and MoCA scores were not routinely available for HC in this retrospective cohort, cognitive status of the control group was not defined using standardized cognitive screening cutoffs. HCs were defined as individuals with no documented cognitive impairment in their available medical records. The exclusion criteria for HCs were consistent with those applied to the patient groups.
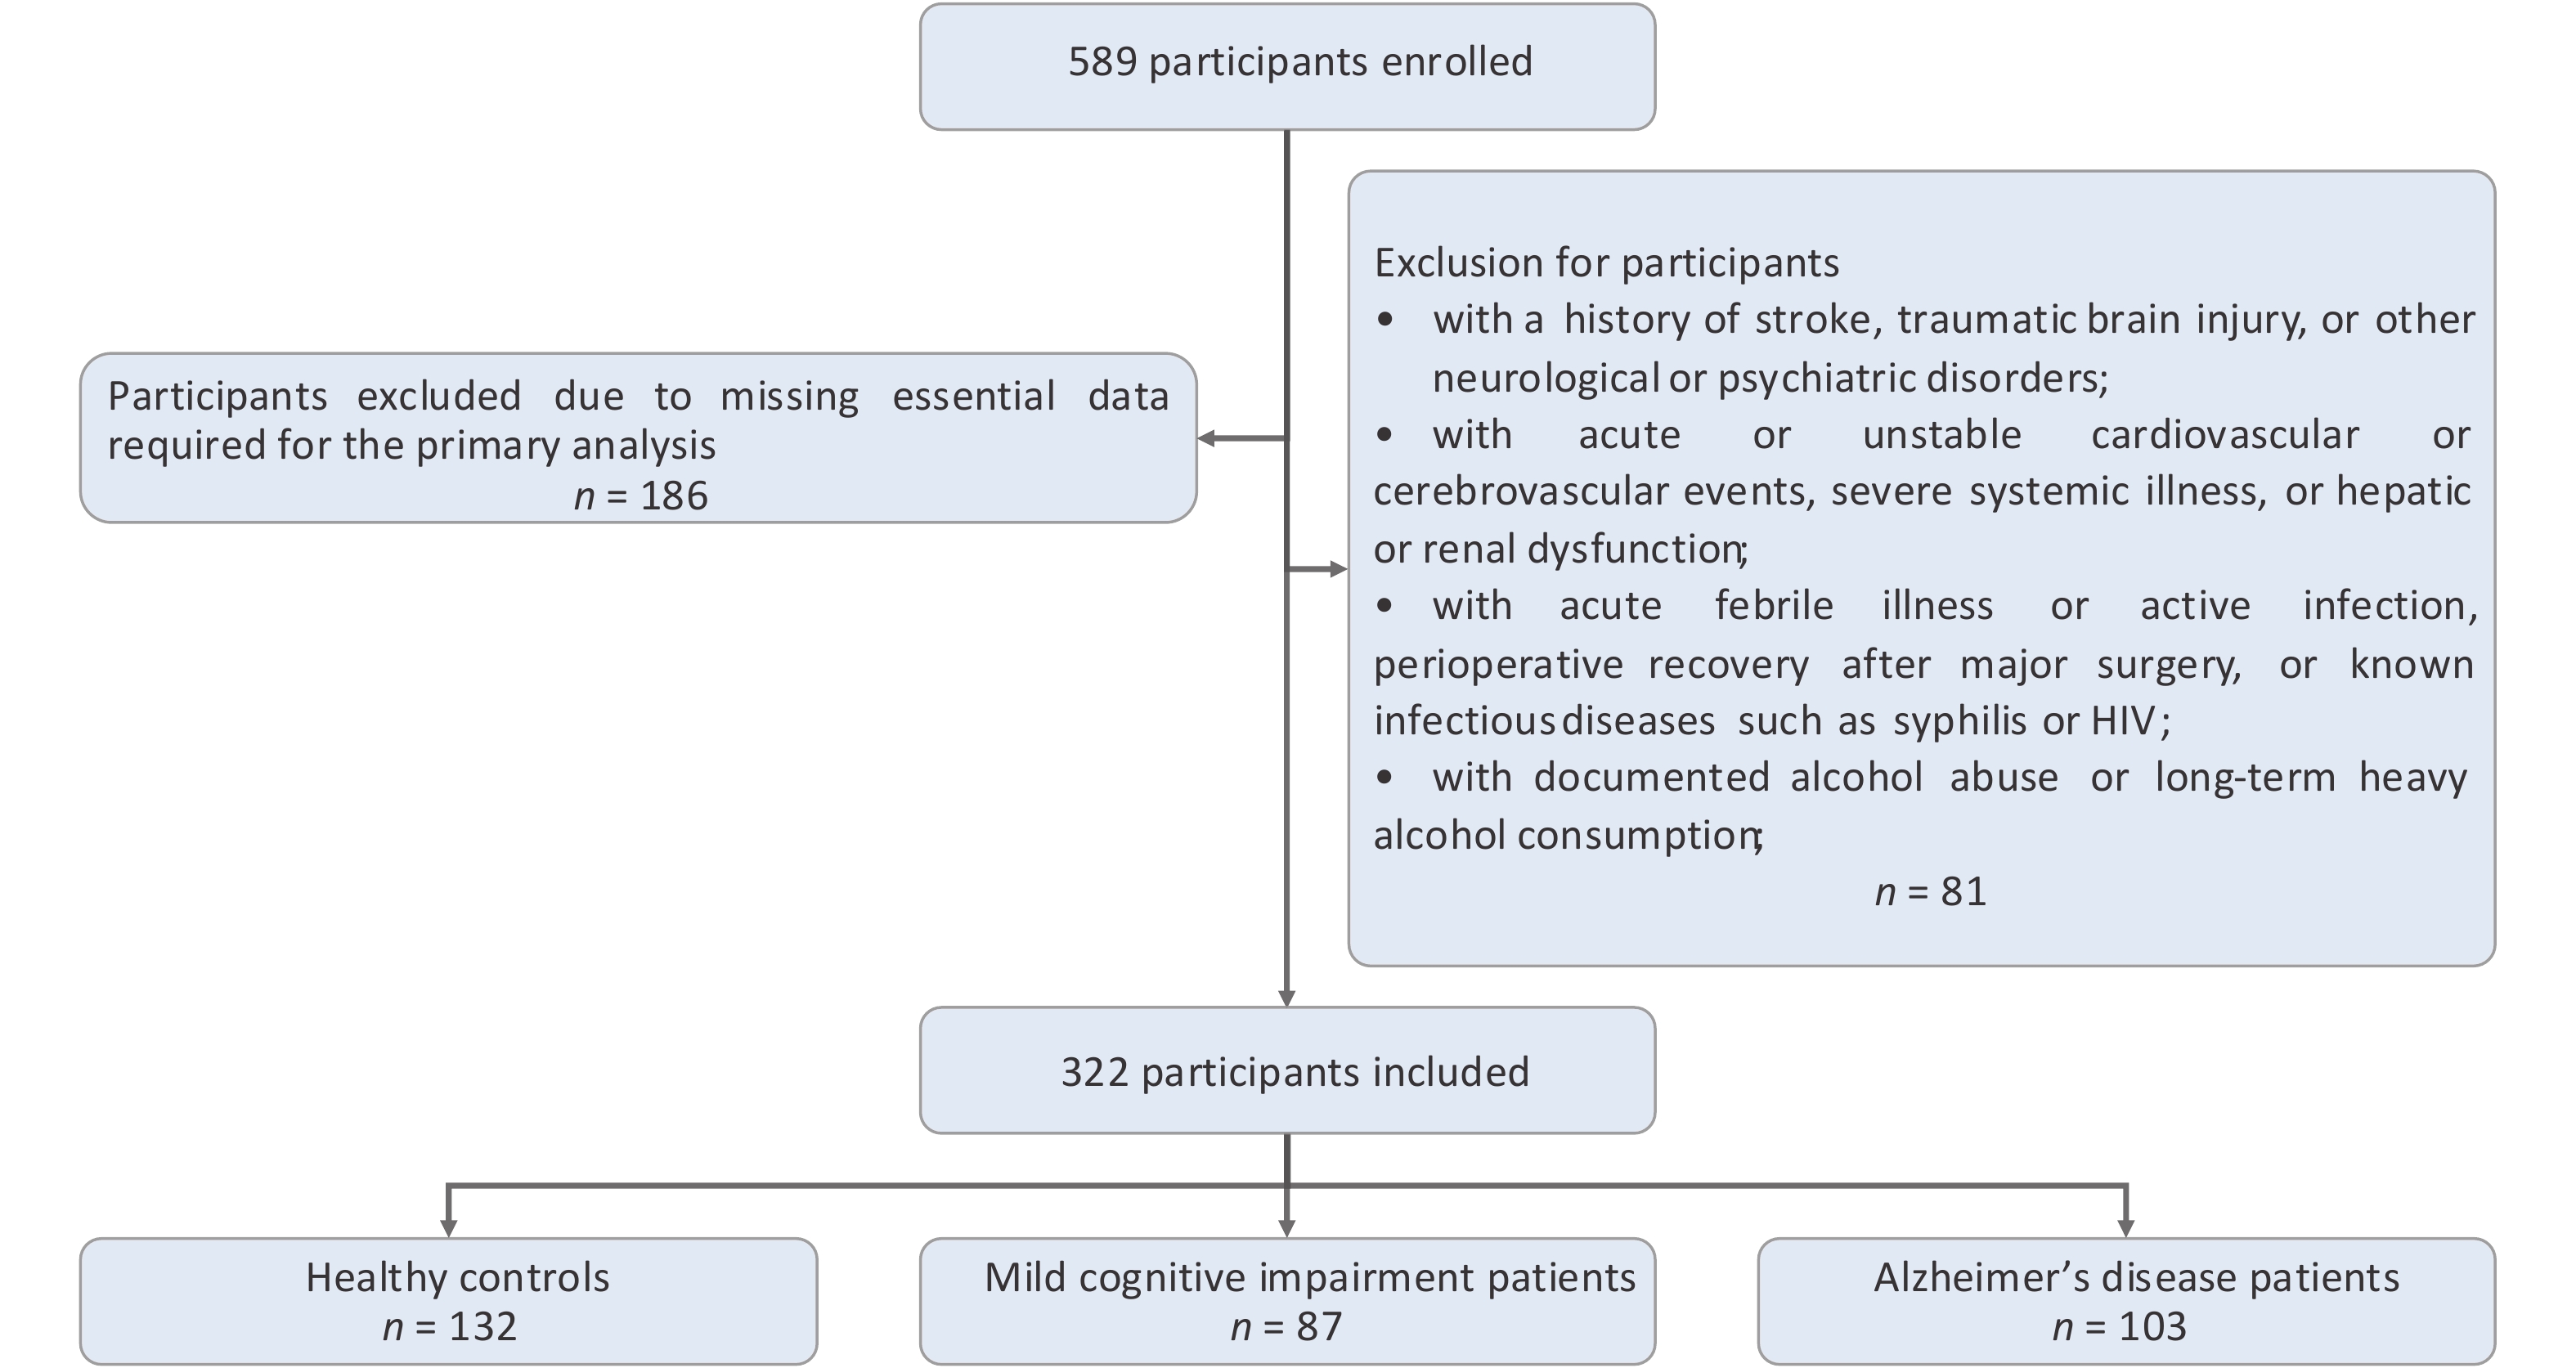
In total, 322 participants were included in the final analysis: 132 HC, 87 patients with MCI, and 103 with AD. The study flowchart and final cohort composition are presented in Figure 1. This study was approved by the ethics committee of Xuanwu Hospital, Capital Medical University, Beijing, China and was conducted in accordance with the principles of the Declaration of Helsinki.
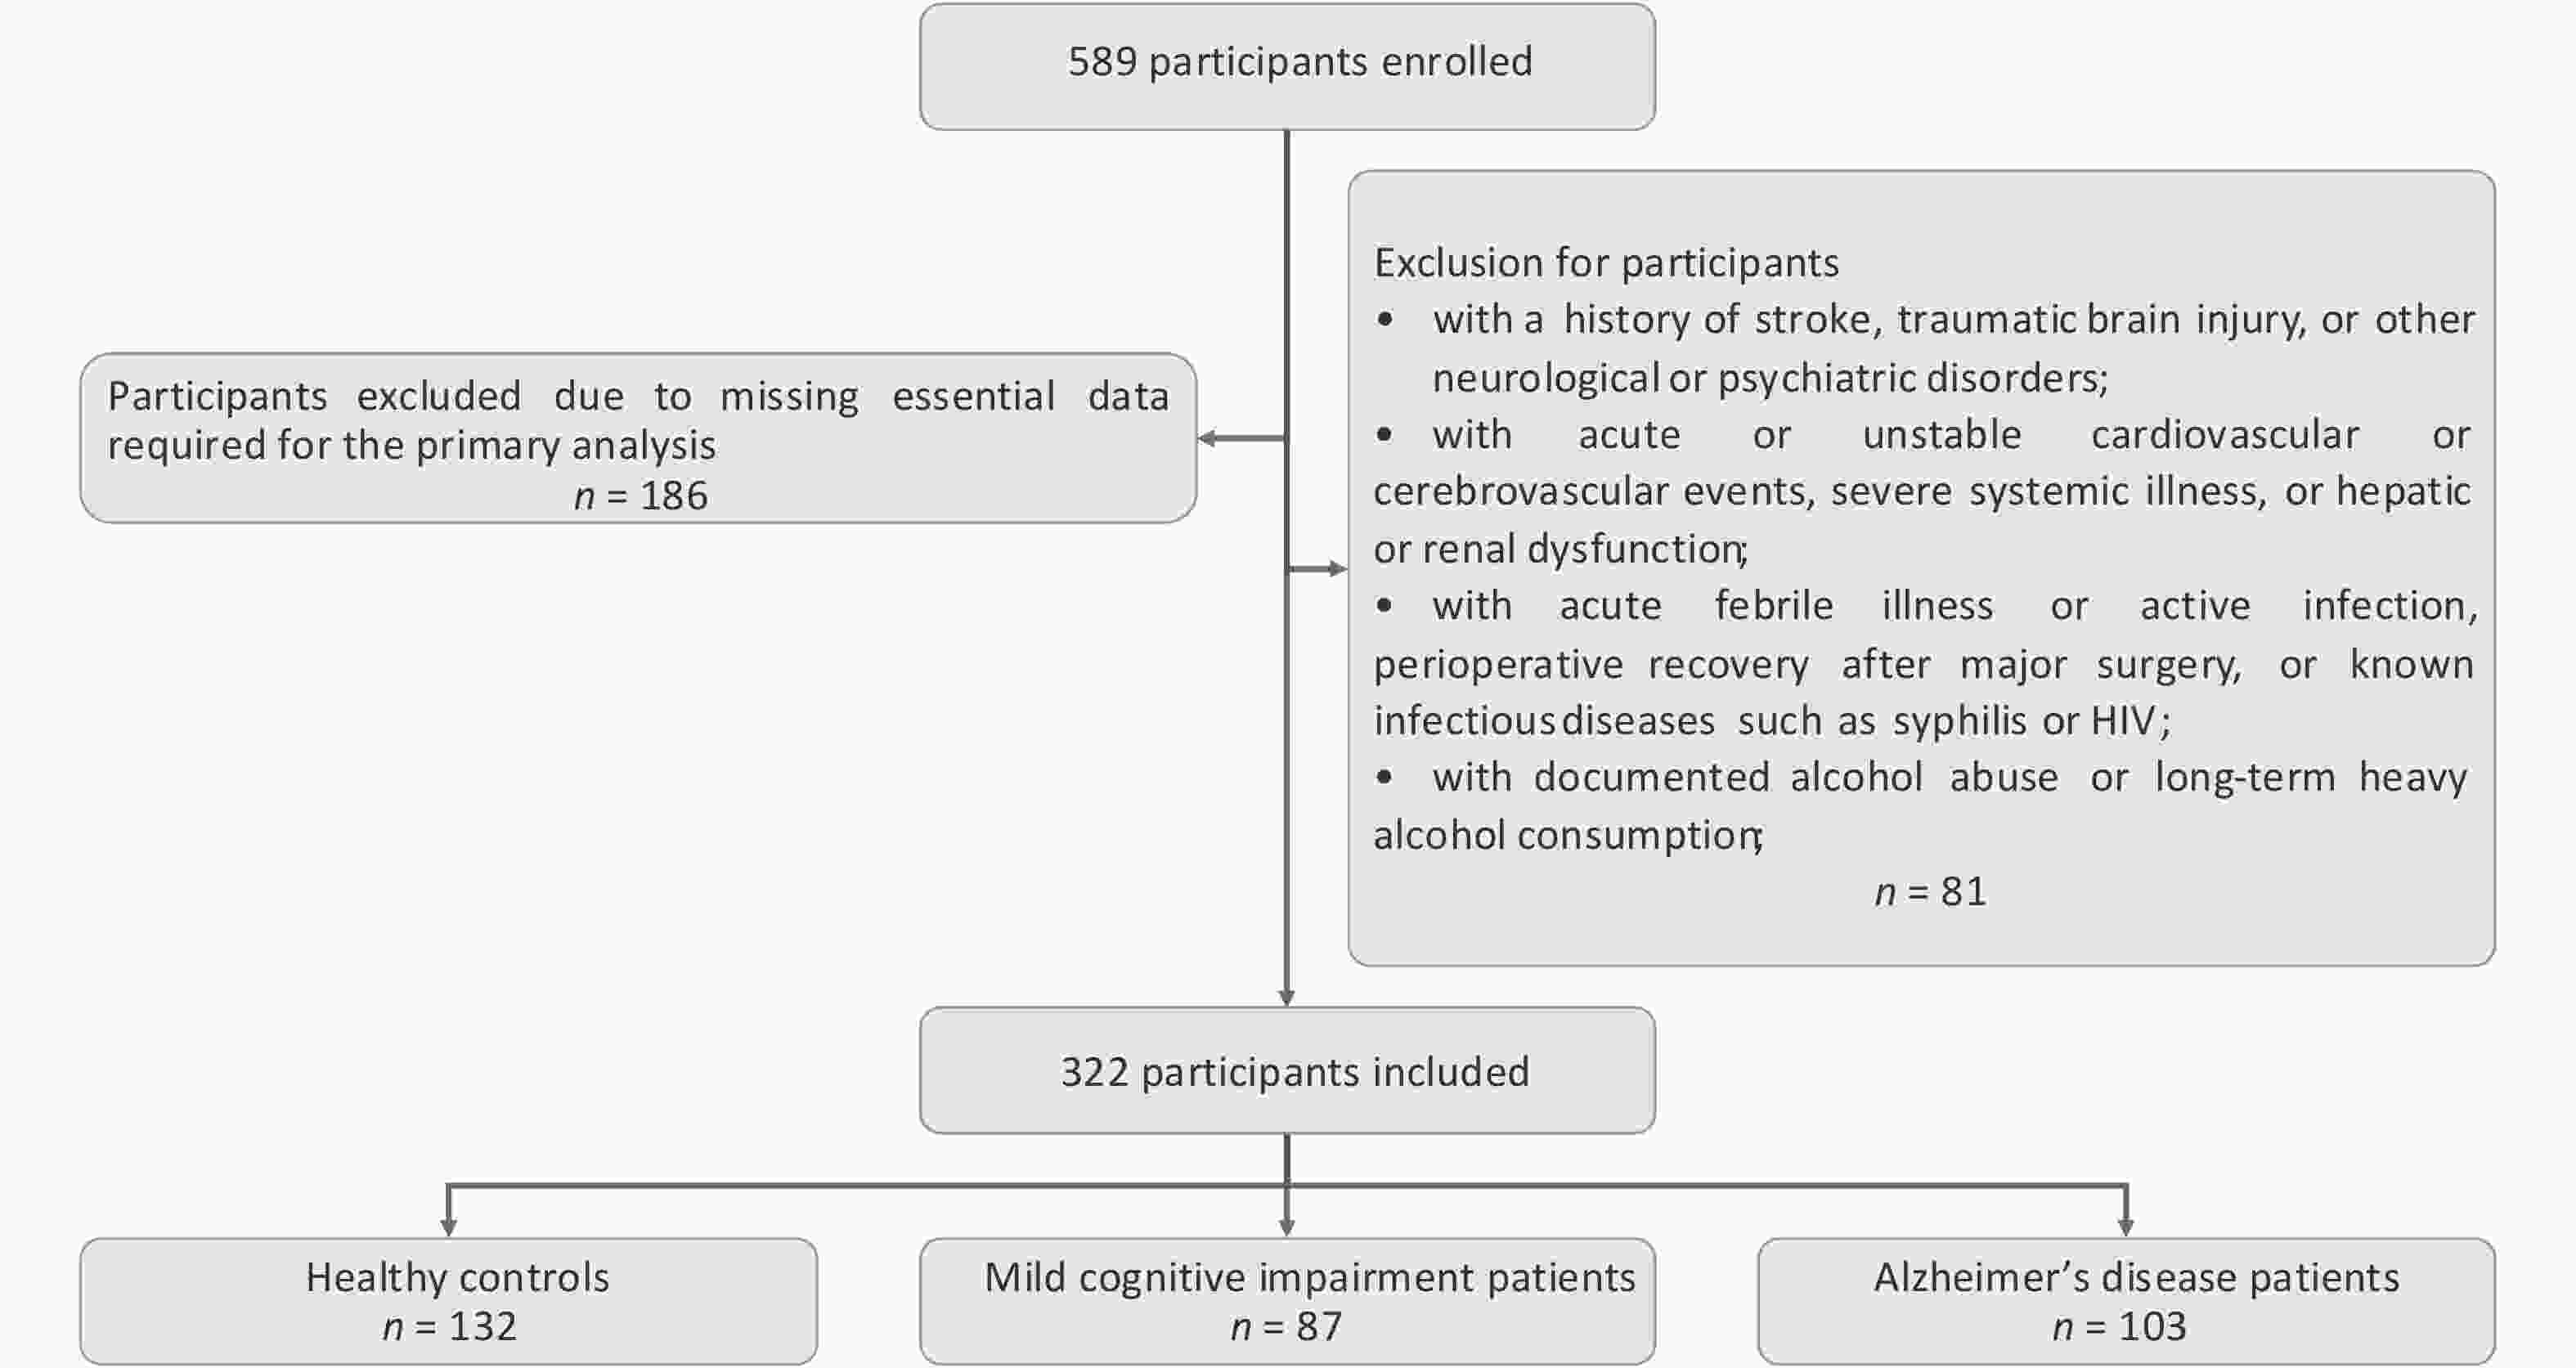
Figure 1. Flowchart of participant selection in the Xuanwu Hospital cohort. Participants were recruited from the Department of Neurology and the Health Examination Center. After applying exclusion criteria related to systemic and organ dysfunction, medications, and alcohol use, 132 healthy controls, 87 patients with MCI, and 103 patients with AD were included in the final analysis.
-
For participants in the Xuanwu Hospital cohort, fasting blood samples (≥8 hours) were collected in the morning. Blood was drawn into serum tubes and centrifuged at 1800 × g for 10 min. Serum lactate dehydrogenase (LDH) activity was measured on a Hitachi analyzer using the lactic substrate method.
-
AD Risk Score data were obtained from the Agora platform. AD Risk Score Data included the Target Risk Score (TRS), Genetics Score, and Multi-omic Risk Score. TRS represent the general relevance of gene targets in AD. TRS is the sum of the target's Genetic Risk Score and Multi-omic Risk Score. Target Risk Scores range from 0 to 5, with higher scores indicating a greater likelihood of a disease association. The Genetic Risk Score is a summary of genetic evidence supporting the association of the target gene with late-onset AD from multiple genetic studies. Genetic Risk Scores range from 0 to 3, with higher scores indicating a greater likelihood of disease association. The Genetics Score is based on genetic evidence retrieved from genome-wide association studies (GWAS), GWAS by proxy (GWAX), quantitative trait locus (QTL) studies, and the predicted severity of variants assigned to each target. This score also incorporates phenotypic evidence supporting a given target from both humans and model organisms. The Multi-omic Risk Score is a summary of transcriptomic and proteomic evidence supporting the association of a target gene with late-onset AD from multiple studies. Multi-omic Risk Scores ranged from 0 to 2, with higher scores indicating a greater likelihood of disease association. Transcriptomic data were generated using RNA-Seq profiling, whereas proteomic data were generated using both label-free quantitation (LFQ) and Tandem Mass Tagging (TMT) shotgun profiling methods. Proteomic evidence was weighted more heavily in the scoring calculation to account for the practicality of therapeutic intervention strategies at the protein level than at the transcript level.
-
Bulk brain transcriptomic data were obtained from the AlzData Database and Agora platform. As for brain transcriptomic data from the AlzData Database[22,23], the dataset of EC included GSE26927, GSE26972, GSE48350, and GSE5281; that of the hippocampus included GSE28146, GSE29378, GSE36980, GSE48350, and GSE5281; that of the temporal cortex included GSE29652, GSE36980, GSE37263, and GSE5281; and that of the frontal cortex included GSE12685, GSE36980, GSE48350, GSE5281, GSE53890, and GSE66333. All differential expression results were adjusted for age and sex.
The Agora portal (https://agora.adknowledgeportal.org) integrates and harmonizes datasets from several postmortem brain cohorts, including the Religious Orders Study and Memory and Aging Project (ROSMAP), Mount Sinai Brain Bank (MSBB), and Mayo Clinic cohort. Differential expression data (log2 FC and adjusted P) across distinct central nervous system regions were visualized using R software (version 4.3.3). A dot plot was generated using ggplot2 and dplyr packages. The size of the bubbles represents the statistical significance (-log10 corrected P), and the color gradient of the bubbles maps the fold change in expression (log2 FC).
-
Cell-type-level expression analyses were performed using public single-cell/single-nucleus transcriptomic resources. First, GSE67835 from the AlzData Database was used to examine the distribution of LDHA and LDHB expression across major human brain cell types. This dataset was originally generated by Darmanis et al., and contains single-cell transcriptomic profiles from human brain samples[24]. Because GSE67835 was used as a reference dataset for cell-type expression distribution, it was not used for AD differential expression analysis. Second, to examine LDHA and LDHB expression in AD and normal control samples at the cell-type level, we used the CELLxGENE gene expression analysis platform (https://cellxgene.cziscience.com). Public preprocessed and curated human brain single-cell/single-nucleus datasets available in CELLxGENE, including GSE267301[25], GSE147528[26], and syn52074156[27], were also queried. For each dataset, only cells or nuclei annotated as AD and normal controls were selected. The analysis was based on preprocessed and curated data available through CELLxGENE[28]. We did not reprocess the raw sequencing data, perform additional batch corrections, or conduct de novo cell-type annotation. Instead, normalized expression values, quality-controlled cells, and cell-type annotations provided by the original studies and the CELLxGENE platform were used. The results are shown as dotted plots. Dot size represents the percentage of cells expressing the gene in a specific cell population, and dot color represents the log-normalized average expression level. Detailed information on the dataset source, disease status, donor number, sample number, cell/nucleus number, quality-control procedures, and cell-type annotation is provided in Supplementary Table S15.
-
The Gene Expression Profiling Interactive Analysis 2 (GEPIA2) platform was used to explore the transcriptional landscapes of LDHA and LDHB in the human brain. Transcriptomic data were obtained from the Genotype-Tissue Expression (GTEx) project, including 13 brain regions: amygdala, anterior cingulate cortex (BA24), caudate (basal ganglia), cerebellar hemisphere, cerebellum, cortex, frontal cortex (BA9), hippocampus, hypothalamus, nucleus accumbens (basal ganglia), putamen (basal ganglia), spinal cord (cervical c-1), and substantia nigra. Genes with expression patterns similar to those of LDHA and LDHB were also identified in these tissues. The top 1,000 positively correlated genes were retained for each target, including three gene sets: the LDHA-correlated set (n = 1,000), LDHB-correlated set (n = 1,000), and their overlap (n = 505).
-
Functional enrichment analyses were performed using the clusterProfiler package in R. Over-representation of gene ontology (GO) terms, including biological process (BP), cellular component (CC), and molecular function (MF), was performed to analyze the three gene sets. Kyoto Encyclopedia of Genes and Genomes (KEGG) pathways were analyzed for each gene set. Statistical significance was set at a false discovery rate (FDR) < 0.05.
-
The gene set enrichment analysis (GSEA) was performed using pre-ranked lists of genes based on their correlation coefficients with LDHA or LDHB. The analysis was performed with the clusterProfiler package, and gene sets with FDR < 0.05 were considered significantly enriched. This approach allowed us to identify biological pathways that were consistently associated with LDH subunit expression across brain regions.
-
Protein–protein interaction (PPI) network analysis was conducted on the overlapping gene set (n = 505) using the STRING database (version 11.5). Interactions with a combined confidence score ≥ 0.7 were retained. The active evidence channels included text mining, experiments, databases, co-expression, co-occurrence, neighborhood, and gene fusion. Genes without any qualifying interactions (i.e., isolated nodes) were excluded from this analysis. The resulting network was visualized using Cytoscape (version 3.9.1). Degree centrality was used as the main rule for defining hub genes. The degree was calculated as the number of retained interactions linked to each node. The top 40 genes ranked by degree were selected as hub genes. Degree centrality was used as the predefined primary hub selection rule. The Louvain clustering algorithm implemented in Cytoscape was used to explore the modular organization of the network, which partitioned the core interacting proteins (top 40) into two major functional modules.
-
A weighted gene co-expression network analysis (WGCNA) was performed using the WGCNA package in R. Cross-platform-normalized transcriptomic data were obtained from AlzData. Four AD-related brain regions were analyzed: the frontal cortex, temporal cortex, hippocampus, and entorhinal cortex. The dataset of entorhinal cortex was included GSE26927, GSE26972, GSE48350, and GSE5281; the dataset of the hippocampus was included GSE28146, GSE29378, GSE36980, GSE48350, and GSE5281; the dataset of temporal cortex was included GSE29652, GSE36980, GSE37263, and GSE5281; the dataset of frontal cortex was included GSE12685, GSE36980, GSE48350, GSE5281, GSE53890, and GSE66333. For each brain region, the expression matrix was converted to a sample-by-gene format before analysis. Data quality was checked before network construction. Genes and samples of poor quality were examined using the goodSamplesGenes function. Sample clustering was then performed using the Euclidean distance and average linkage. Possible outlier samples were removed by static tree cutting. The cut height was set to the 95th percentile of the pairwise sample distance. Only samples in the main cluster were retained for subsequent analyses. Disease status was matched to each sample-by-sample ID. AD samples were coded as 1 and control samples as 0. The soft-threshold power was selected using the pickSoftThreshold function. The tested powers included 1–10, and even numbers ranging from 12 to 20. Scale-free fit and mean connectivity were used to determine the final power of each brain region. A signed co-expression network was built using the blockwiseModules function. The main settings were minModuleSize = 30, deepSplit = 2, reassignThreshold = 0, mergeCutHeight = 0.25, and pamRespectsDendro = FALSE. Module labels were changed to module colors for subsequent analyses. Module eigengenes were calculated for all modules. The relationship between each module and AD status was tested using Pearson’s correlation. Gene significance was defined as the correlation between each gene and the AD status. Module membership was defined as the correlation between each gene and the eigengene of the module. The modules containing LDHA or LDHB were identified in each brain region. Genes in these modules were extracted for functional analysis. GO enrichment analysis was performed using the clusterProfiler package and org. Hs. (e.g., db). The BP, CC, and MF terms were analyzed. A KEGG pathway analysis was performed after the gene symbols were changed to Entrez IDs. FDR was used for multiple test corrections in the GO analysis. For KEGG analysis, pathways with P < 0.05 and q < 0.1 were considered significant.
-
Continuous variables were assessed for normality using the Shapiro–Wilk test. Homogeneity of variance was evaluated using Levene’s test. Continuous variables are presented as median with interquartile range (Median, [Q1, Q3]) or mean ± standard deviation [Mean ± SD]; categorical variables are presented as frequency and percentage [n (%)]. For comparisons among the healthy control, MCI, and AD groups, normally distributed continuous variables were compared using one-way analysis of variance, whereas non-normally distributed continuous variables were compared using the Kruskal–Wallis test. When the overall group difference was significant, post-hoc pairwise comparisons were made. Pairwise comparisons of non-normally distributed variables were performed using the Mann–Whitney U test. Pairwise comparisons were performed using the Bonferroni method. Pairwise comparisons of normally distributed variables were performed using an independent t test. Categorical variables were compared using the chi-squared test. A Spearman’s correlation analysis was used to examine the associations between serum LDH activity and cognitive scores, including MMSE and MoCA scores. Pearson correlation coefficients are reported as r. Spearman correlation coefficients are reported as rs. Multivariable general linear models were used to evaluate whether the association between the diagnostic group and serum LDH activity was independent of clinical covariates. Serum LDH levels were used as the dependent variable, and the diagnostic group was used as the main independent variable, with the healthy control group as the reference group. Model 1 was unadjusted. Model 2 was adjusted for age and sex. Model 3 was further adjusted for diabetes, total cholesterol, total triglycerides, alanine aminotransferase, aspartate aminotransferase, creatinine, and creatine kinase. Adjusted mean differences with 95% confidence intervals (CIs) were reported for pairwise comparisons. Partial η2 was used to estimate the effect size of the diagnostic group in each model. To further evaluate whether age or sex modified the association between the diagnostic group and serum LDH activity, the interaction terms for the diagnostic group × age and diagnostic group × sex were tested in the general linear model. Age- and sex-stratified sensitivity analyses were also performed. Age stratification was conducted using the median age of the total cohort as the cutoff. The direction and consistency of the differences in serum LDH levels across strata were examined to assess the robustness of the main findings. Receiver operating characteristic (ROC) analyses were performed to evaluate the standalone discriminative ability of serum LDH to distinguish participants with MCI or AD from HC. The area under the curve (AUC), 95% CI, and P value were reported. P < 0.05 was considered statistically significant. Statistical analyses were performed using SPSS version 27.0 (IBM Corp., Armonk, NY, USA) and R version 4.3.3.
-
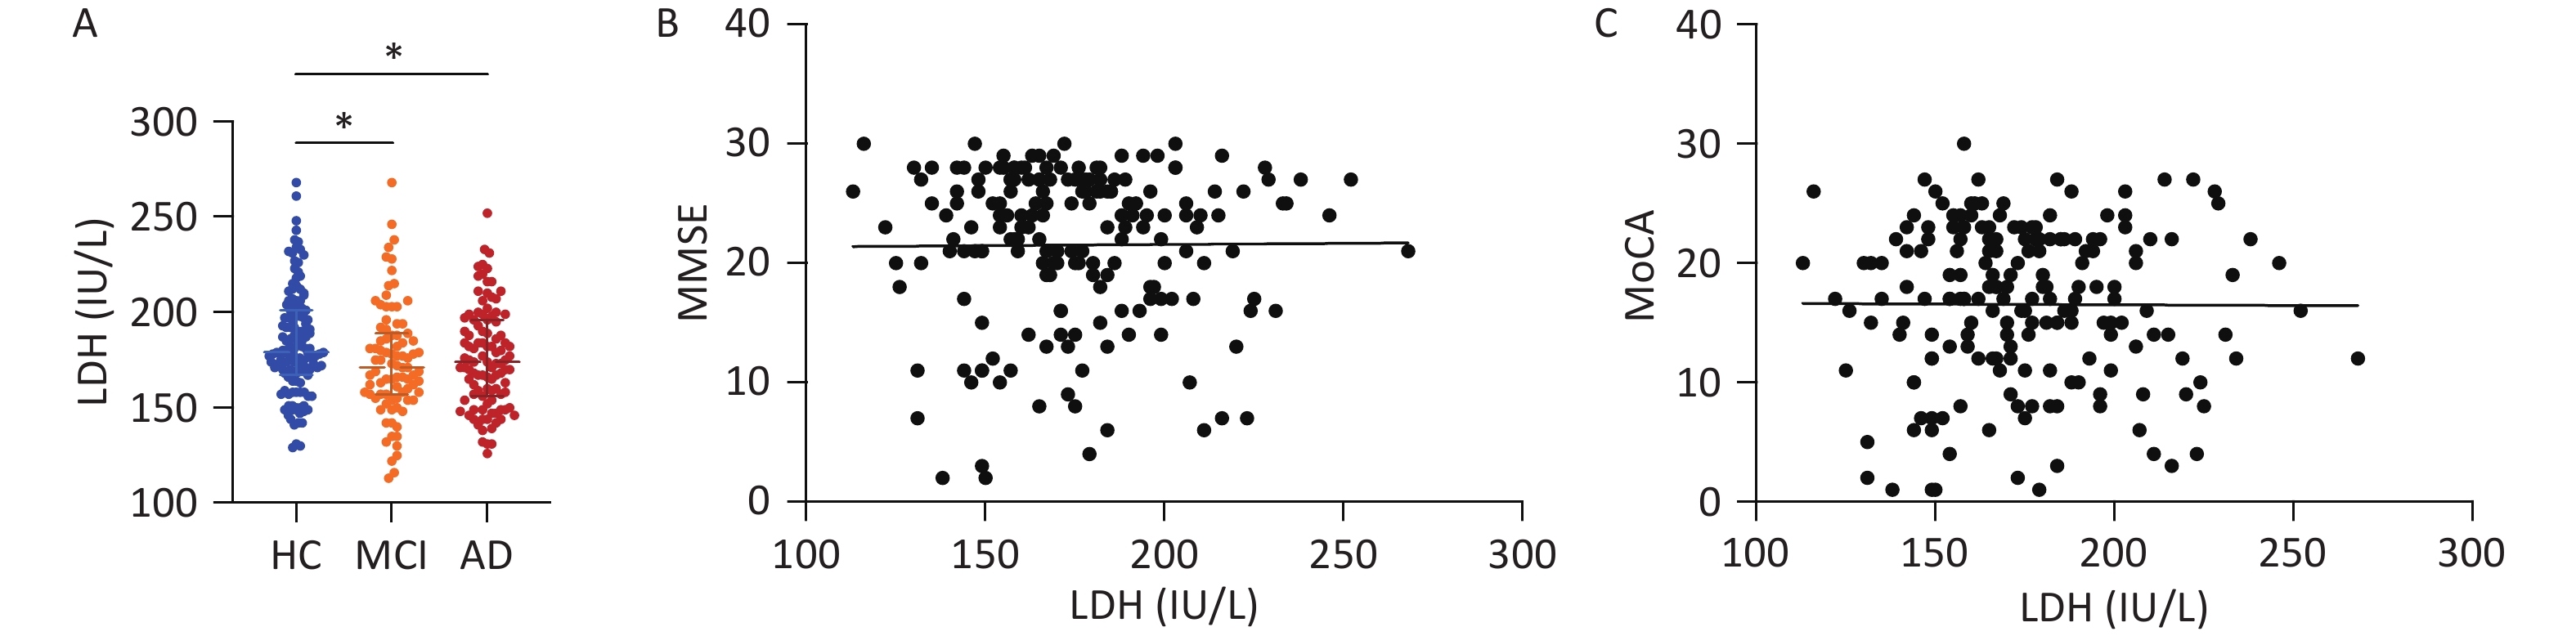
The demographic and clinical characteristics of the participants are presented in Table 1. Age and sex distributions differed significantly among the three groups, whereas diabetes prevalence did not differ among groups. Serum LDH activity differed significantly between the HC, MCI, and AD groups (P = 0.025; Figure 2A). Specifically, both the MCI (median, 171.50 IU/L; IQR, 158.00–194.00) and AD groups (median, 174.00 IU/L; IQR, 155.00–196.50) exhibited lower serum LDH activity compared with the HC group (median, 179.00 IU/L; IQR, 167.00–201.00). No significant differences in serum LDH activity were observed between the MCI and AD groups. We then used multivariable general linear models to examine whether the difference in serum LDH activity was influenced by clinical covariates (Table 2). In the unadjusted model, the diagnostic group was significantly associated with serum LDH activity (Model 1: P = 0.024, partial η2 = 0.023). After adjustment for age and sex, the association remained significant (Model 2: P = 0.005, partial η2 = 0.033). This association remained significant after further adjustment for diabetes, lipid parameters, liver function markers, kidney function markers, and creatine kinase (Model 3: overall P = 0.030, partial η2 = 0.023). In the fully adjusted model, serum LDH activity remained lower in both the MCI and AD groups than in the HC group. The adjusted mean differences were 8.267 IU/L for HC vs. MCI (95% CI, 1.303–15.231; P = 0.020) and 7.183 IU/L for HC vs. AD (95% CI, 0.610–13.755; P = 0.032). Additionally, no significant interactions were observed between the diagnostic group and age or sex (Supplementary Table S1). Age- and sex-stratified sensitivity analyses confirmed consistently decreasing trends in serum LDH activity in the MCI and AD groups (Supplementary Table S2). Next, we evaluated the correlation between serum LDH activity and cognitive performance in patients with MCI and AD. Serum LDH activity was not significantly correlated with MMSE (rs = −0.03, P = 0.673) (Figure 2B) or MoCA scores (rs = −0.01, P = 0.859) (Figure 2C). In addition, ROC analyses revealed limited standalone discriminative performance for serum LDH activity, with AUC of 0.5982 for distinguishing MCI from HC and 0.5784 for distinguishing AD from HC (P < 0.05; Supplementary Table S3).
Characteristic HC (N = 132) MCI (N = 87) AD (N = 103) P Age (years) 74.00 (59.00–78.00) 70.00 (62.75–73.25) 68.00 (60.50–72.00) a 0.005 Sex (female/male) 52/80 52/35 67/36 < 0.001 BMI (kg/m2) NA 24.51 ± 2.90 23.83 ± 2.86 0.102 Years of education (years) NA 12.00 (9.00−15.00) 12.00 (9.00−15.00) 0.474 Cardiovascular disease n/N, (%) NA 22/83 (26.51) 11/102 (10.78) 0.005 Hypertension, n/N (%) NA 41/83 (49.40) 40/102 (39.22) 0.215 Diabetes, n/N (%) 26/132 (19.70) 18/83 (21.69) 20/102 (19.61) 0.925 APOE ε4 carrier/non-ε4 carrier NA 17/14 27/29 0.554 Statin use, n/N (%) NA 29/83 (34.94) 26/102 (25.49) 0.162 Cholinesterase inhibitor use, n/N (%) NA 7/83 (8.43) 14/101 (13.86) 0.249 Memantine use, n/N (%) NA 1/83 (1.20) 11/102 (10.78) 0.009 DBP, mmHg NA 80.00 (70.00–88.75) 79.50 (70.00–85.00) 0.277 SBP, mmHg NA 130.00 (120.50–147.00) 125.50 (114.50–138.50) 0.006 MMSE NA 26.50 (24.00–28.00) 19.00 (13.00–23.00) < 0.001 MoCA NA 21.00 (17.25–23.00) 14.00 (8.00–17.00) < 0.001 LDH (IU/L) 179.00 (167.00–201.00) 171.50 (158.00–194.00) a 174.00 (155.00–196.50) a 0.025 GLU (mmol/L) 5.54 (5.10–6.48) 4.83 (4.49–5.59) a 4.82 (4.26–5.36) a < 0.001 HbA1c (%) 5.80 (5.60–6.20) 5.70 (5.40–6.30) 5.60 (5.30–6.10) 0.052 TC (mmol/L) 4.59 (4.10–5.06) 4.39 (3.72–4.89) 4.67 (4.04–5.46) 0.054 TG (mmol/L) 1.21 (0.86–1.52) 1.27 (0.98–1.68) 1.18 (0.96–1.57) 0.071 ALT (IU/L) 17.00 (13.00–21.00) 15.00 (12.75–20.00) 14.00 (11.00–19.50) 0.141 AST (IU/L) 20.00 (17.00–23.00) 20.00 (16.00–23.00) 20.00 (17.00–22.00) 0.904 Cre (umol/L) 67.00 (58.00–78.00) 61.00 (53.00–72.00) 58.00 (51.50–68.00) a < 0.001 CK (IU/L) 83.00 (65.00–103.00) 77.00 (56.00–104.75) 65.00 (51.50–94.00) a < 0.001 Note. Normality of distribution is assessed using the Shapiro–Wilk test. Continuous variables are presented as median with interquartile range (Median, [Q1, Q3]) or mean ± standard deviation [Mean ± SD]; categorical variables are presented as frequency and percentage [n (%)]. For categorical variables with missing information, N indicates the number of participants with available data for that variable. Normally distributed continuous variables are compared using one-way analysis of variance. Non-normally distributed continuous variables are compared using the Kruskal–Wallis test. If the overall comparison is significant, post-hoc pairwise comparisons were performed using the Mann–Whitney U test. Pairwise comparisons are adjusted using the Bonferroni method. Categorical variables are compared using the chi-squared test. Superscript “a” indicates P < 0.05 compared with the HC group. For variables not available in the HC group, P values are calculated between the MCI and AD groups only. Abbreviations: AD, Alzheimer’s disease; ALT, alanine aminotransferase; AST, aspartate aminotransferase; BMI, body mass index; CK, creatine kinase; Cre, creatinine; DBP, diastolic blood pressure; GLU, glucose; HbA1c, glycated hemoglobin A1c; HC, healthy controls; LDH, lactate dehydrogenase; MCI, mild cognitive impairment; MMSE, Mini-Mental State Examination; MoCA, Montreal Cognitive Assessment; NA, not available; SBP, systolic blood pressure; TC, total cholesterol; TG, triglyceride. Table 1. Demographic and Clinical Characteristics of Participants
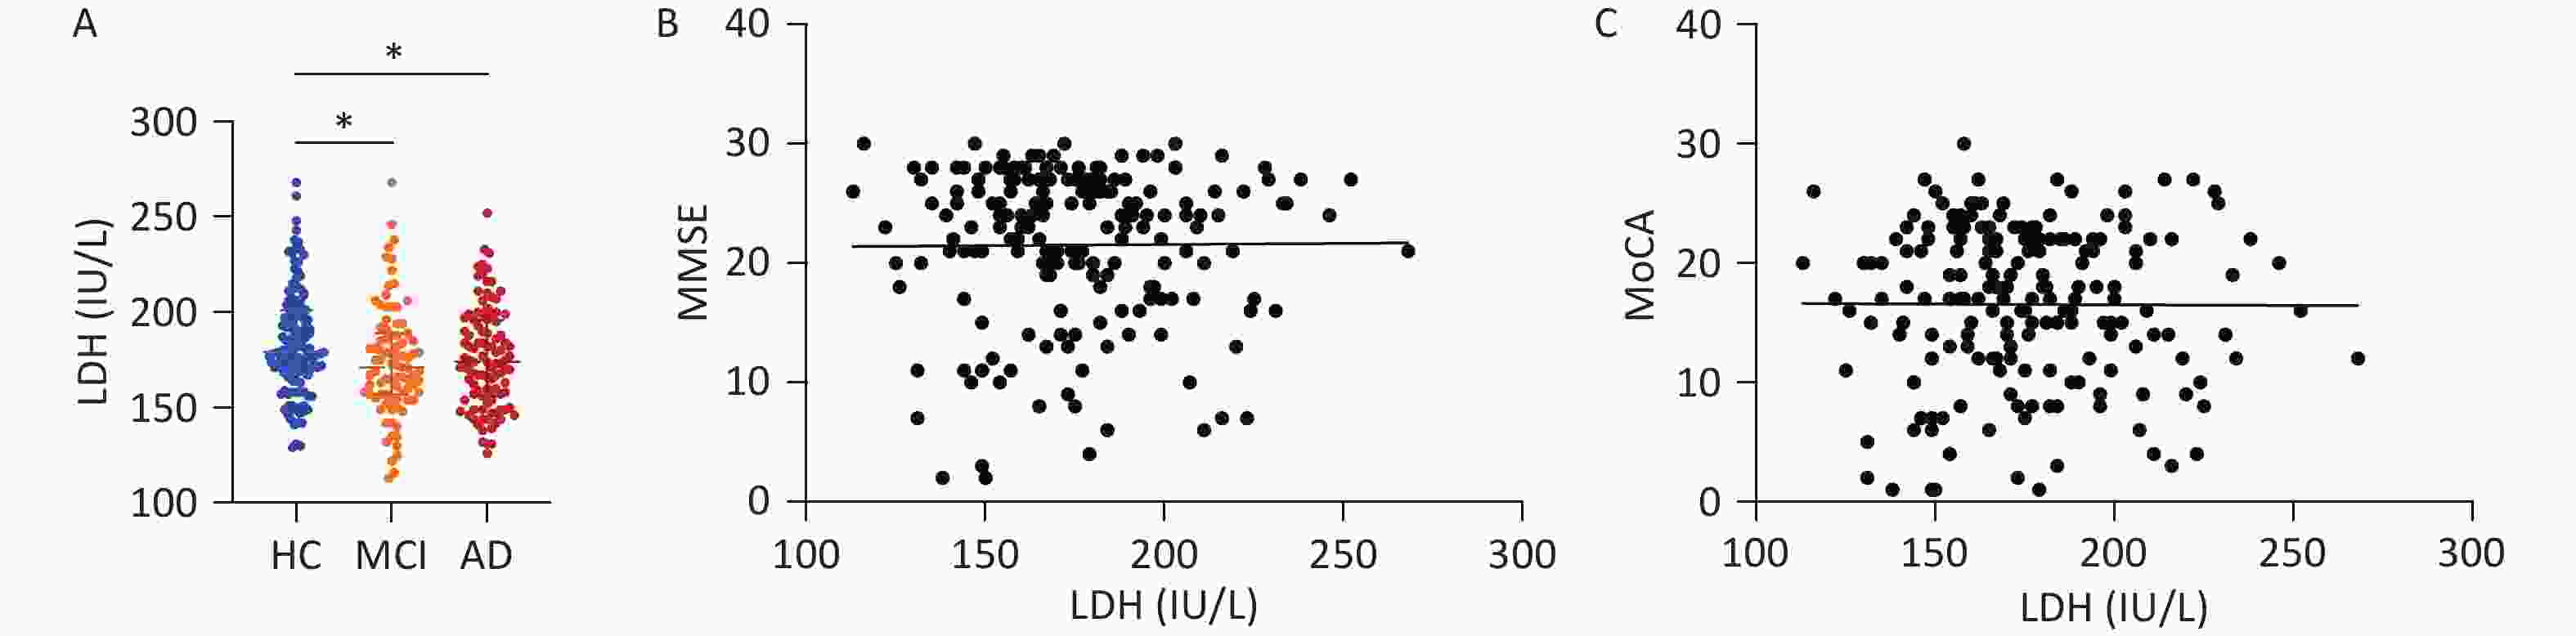
Figure 2. Serum LDH activity in the Xuanwu Hospital cohort and their association with cognitive function. (A) Serum LDH activity in HC, MCI, and AD. Each dot represents an individual participant. The horizontal line and error bars indicate the median and interquartile range. Statistical comparisons were performed using the Kruskal–Wallis test followed by pairwise Mann–Whitney U tests. *P < 0.05. (B, C) The correlation analysis between serum LDH and MMSE scores (B) or MoCA scores (C) in MCI and AD. Spearman correlation analysis was used. The solid line represents the fitted trend line for visualization. *P < 0.05. AD, Alzheimer’s disease; HC, healthy controls; LDH, lactate dehydrogenase; MCI, mild cognitive impairment; MMSE, Mini-Mental State Examination; MoCA, Montreal Cognitive Assessment.
Model Overall P η2 HC vs. MCI, LDH (IU/L),
mean difference (95% CI)HC vs MCI, P HC vs. AD, LDH (IU/L),
mean difference (95% CI)HC vs AD, P Model1 0.024 0.023 9.416 (0.215, 18.617) 0.043 7.721 (−1.035, 16.481) 0.104 Model2 0.005 0.033 11.145 (2.126, 20.164) 0.009 9.220 (0.485, 17.956) 0.035 Model3 0.030 0.023 8.267 (1.303, 15.231) 0.020 7.183 (0.610, 13.755) 0.032 Note. Serum LDH activity was used as the dependent variable, and the diagnostic group was used as the main independent variable, with the HC group as the reference group. Model 1 was unadjusted. Model 2 is adjusted for age and sex. Model 3 was further adjusted for the available metabolic, hepatic, renal, and muscle-related covariates, including diabetes, TC, TG, ALT, AST, Cre, and CK. Adjusted mean differences are shown with 95% CIs. The mean difference was calculated as HC minus MCI or HC minus AD. Partial η² was used to estimate the effect size of the diagnostic group in each model. Abbreviations: AD, Alzheimer’s disease; ALT, alanine aminotransferase; AST, aspartate aminotransferase; CI, confidence interval; CK, creatine kinase; Cre, creatinine; HC, healthy control; LDH, lactate dehydrogenase; MCI, mild cognitive impairment; TC, total cholesterol; TG, triglycerides. Table 2. Multivariable Regression Analyses of Serum LDH Activity
-
To further describe the AD relevance of LDHA and LDHB from an independent multi-omic resource, we analyzed AD Risk Scores from the Agora platform (Table 3). The AD Risk Scores included TRS (range: 0–5), Genetic Risk Score (range: 0–3), and Multi-omic Risk Score (range: 0–2). For LDHA, TRS was 3.3, the Genetic Risk Score was 1.34, and Multi-omic Risk Score was 1.96. For LDHB, TRS was 2.97, the Genetic Risk Score was 1.01, and Multi-omic Risk Score was 1.96. Relatively high Multi-omic Risk Scores suggest that LDHA and LDHB have multi-omic relevance in AD.
Risk Scores LDHA LDHB Target Risk Score 3.30 2.97 Genetic Risk Score 1.34 1.01 Multi-omic Risk Score 1.96 1.96 Note. (1) Target risk score represents the gene target's general relevance to AD. The Target Risk Score is the sum of the target's Genetic Risk Score and Multi-omic Risk Score. Target Risk Scores range from 0 to 5, with higher scores indicating a greater likelihood of disease association. (2) The Genetic Risk Score is a summary of genetic evidence supporting the target gene's association with late-onset AD from multiple genetic studies. Genetic Risk Scores range from 0 to 3, with higher scores indicating a greater likelihood of disease association. (3) The Multi-omic Risk Score is a summary of transcriptomic and proteomic evidence supporting the target gene's association with late-onset AD from multiple studies. Multi-omic Risk Scores range from 0 to 2, with higher scores indicating a greater likelihood of disease association. Abbreviation: AD, Alzheimer’s disease; LDHA, lactate dehydrogenase A; LDHB, lactate dehydrogenase B. Table 3. Risk Scores of AD
-
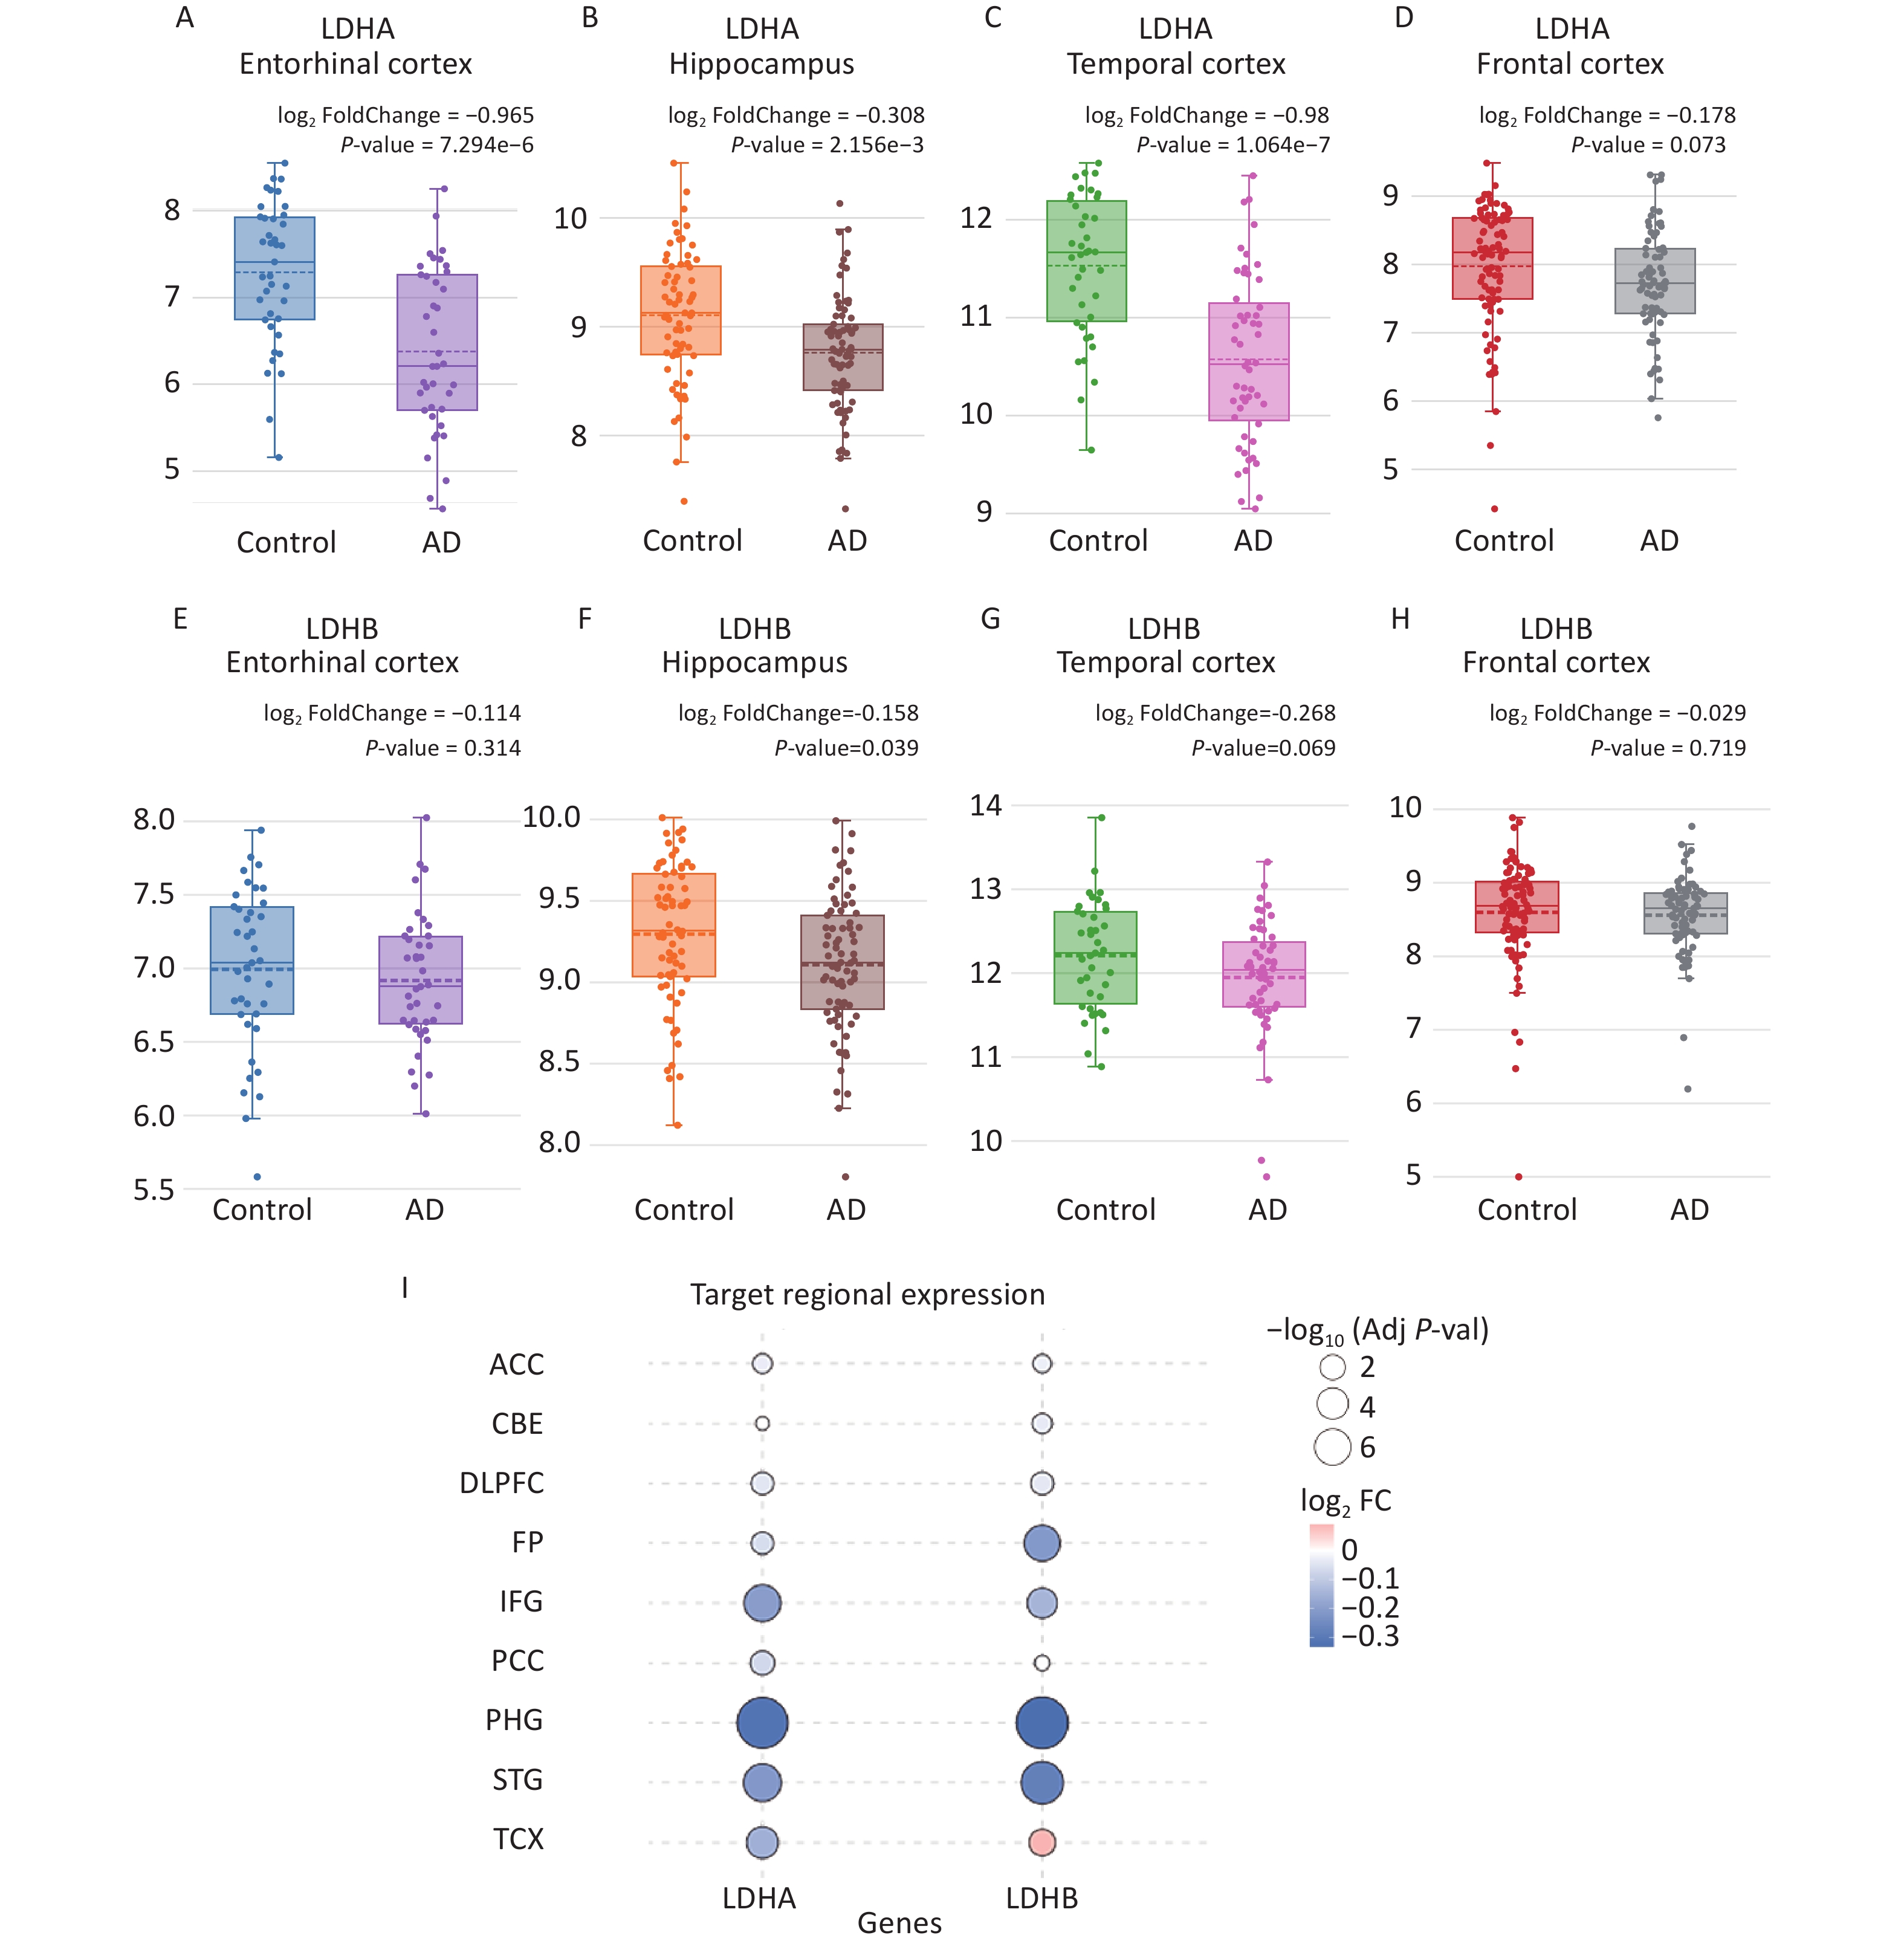
To evaluate regional expression changes in LDHA and LDHB in AD, we analyzed bulk brain transcriptomic data from the AlzData Database across four brain regions: the entorhinal cortex, hippocampus, temporal cortex, and frontal cortex. Compared with normal controls, LDHA was significantly downregulated in the entorhinal cortex, hippocampus, and temporal cortex of patients with AD, with the most pronounced differences observed in the temporal and entorhinal cortices (Figures 3A–D). Similarly, LDHB expression was significantly downregulated in the hippocampus, with a downward trend in the entorhinal, temporal, and frontal cortices (Figures 3E–H). To further examine these regional alterations, we used transcriptomic data from the Agora platform (Figure 3I). In the Agora dataset, LDHA expression decreased in the parahippocampal gyrus (PHG), superior temporal gyrus (STG), temporal cortex (TCX), and inferior frontal gyrus (IFG) (P = 0.0001, 0.0024, 0.0320, and 0.0030, respectively). A parallel reduction in LDHB was observed in the frontal pole (FP), PHG, and STG (P = 0.0055, 0.0001, and 0.0002, respectively).
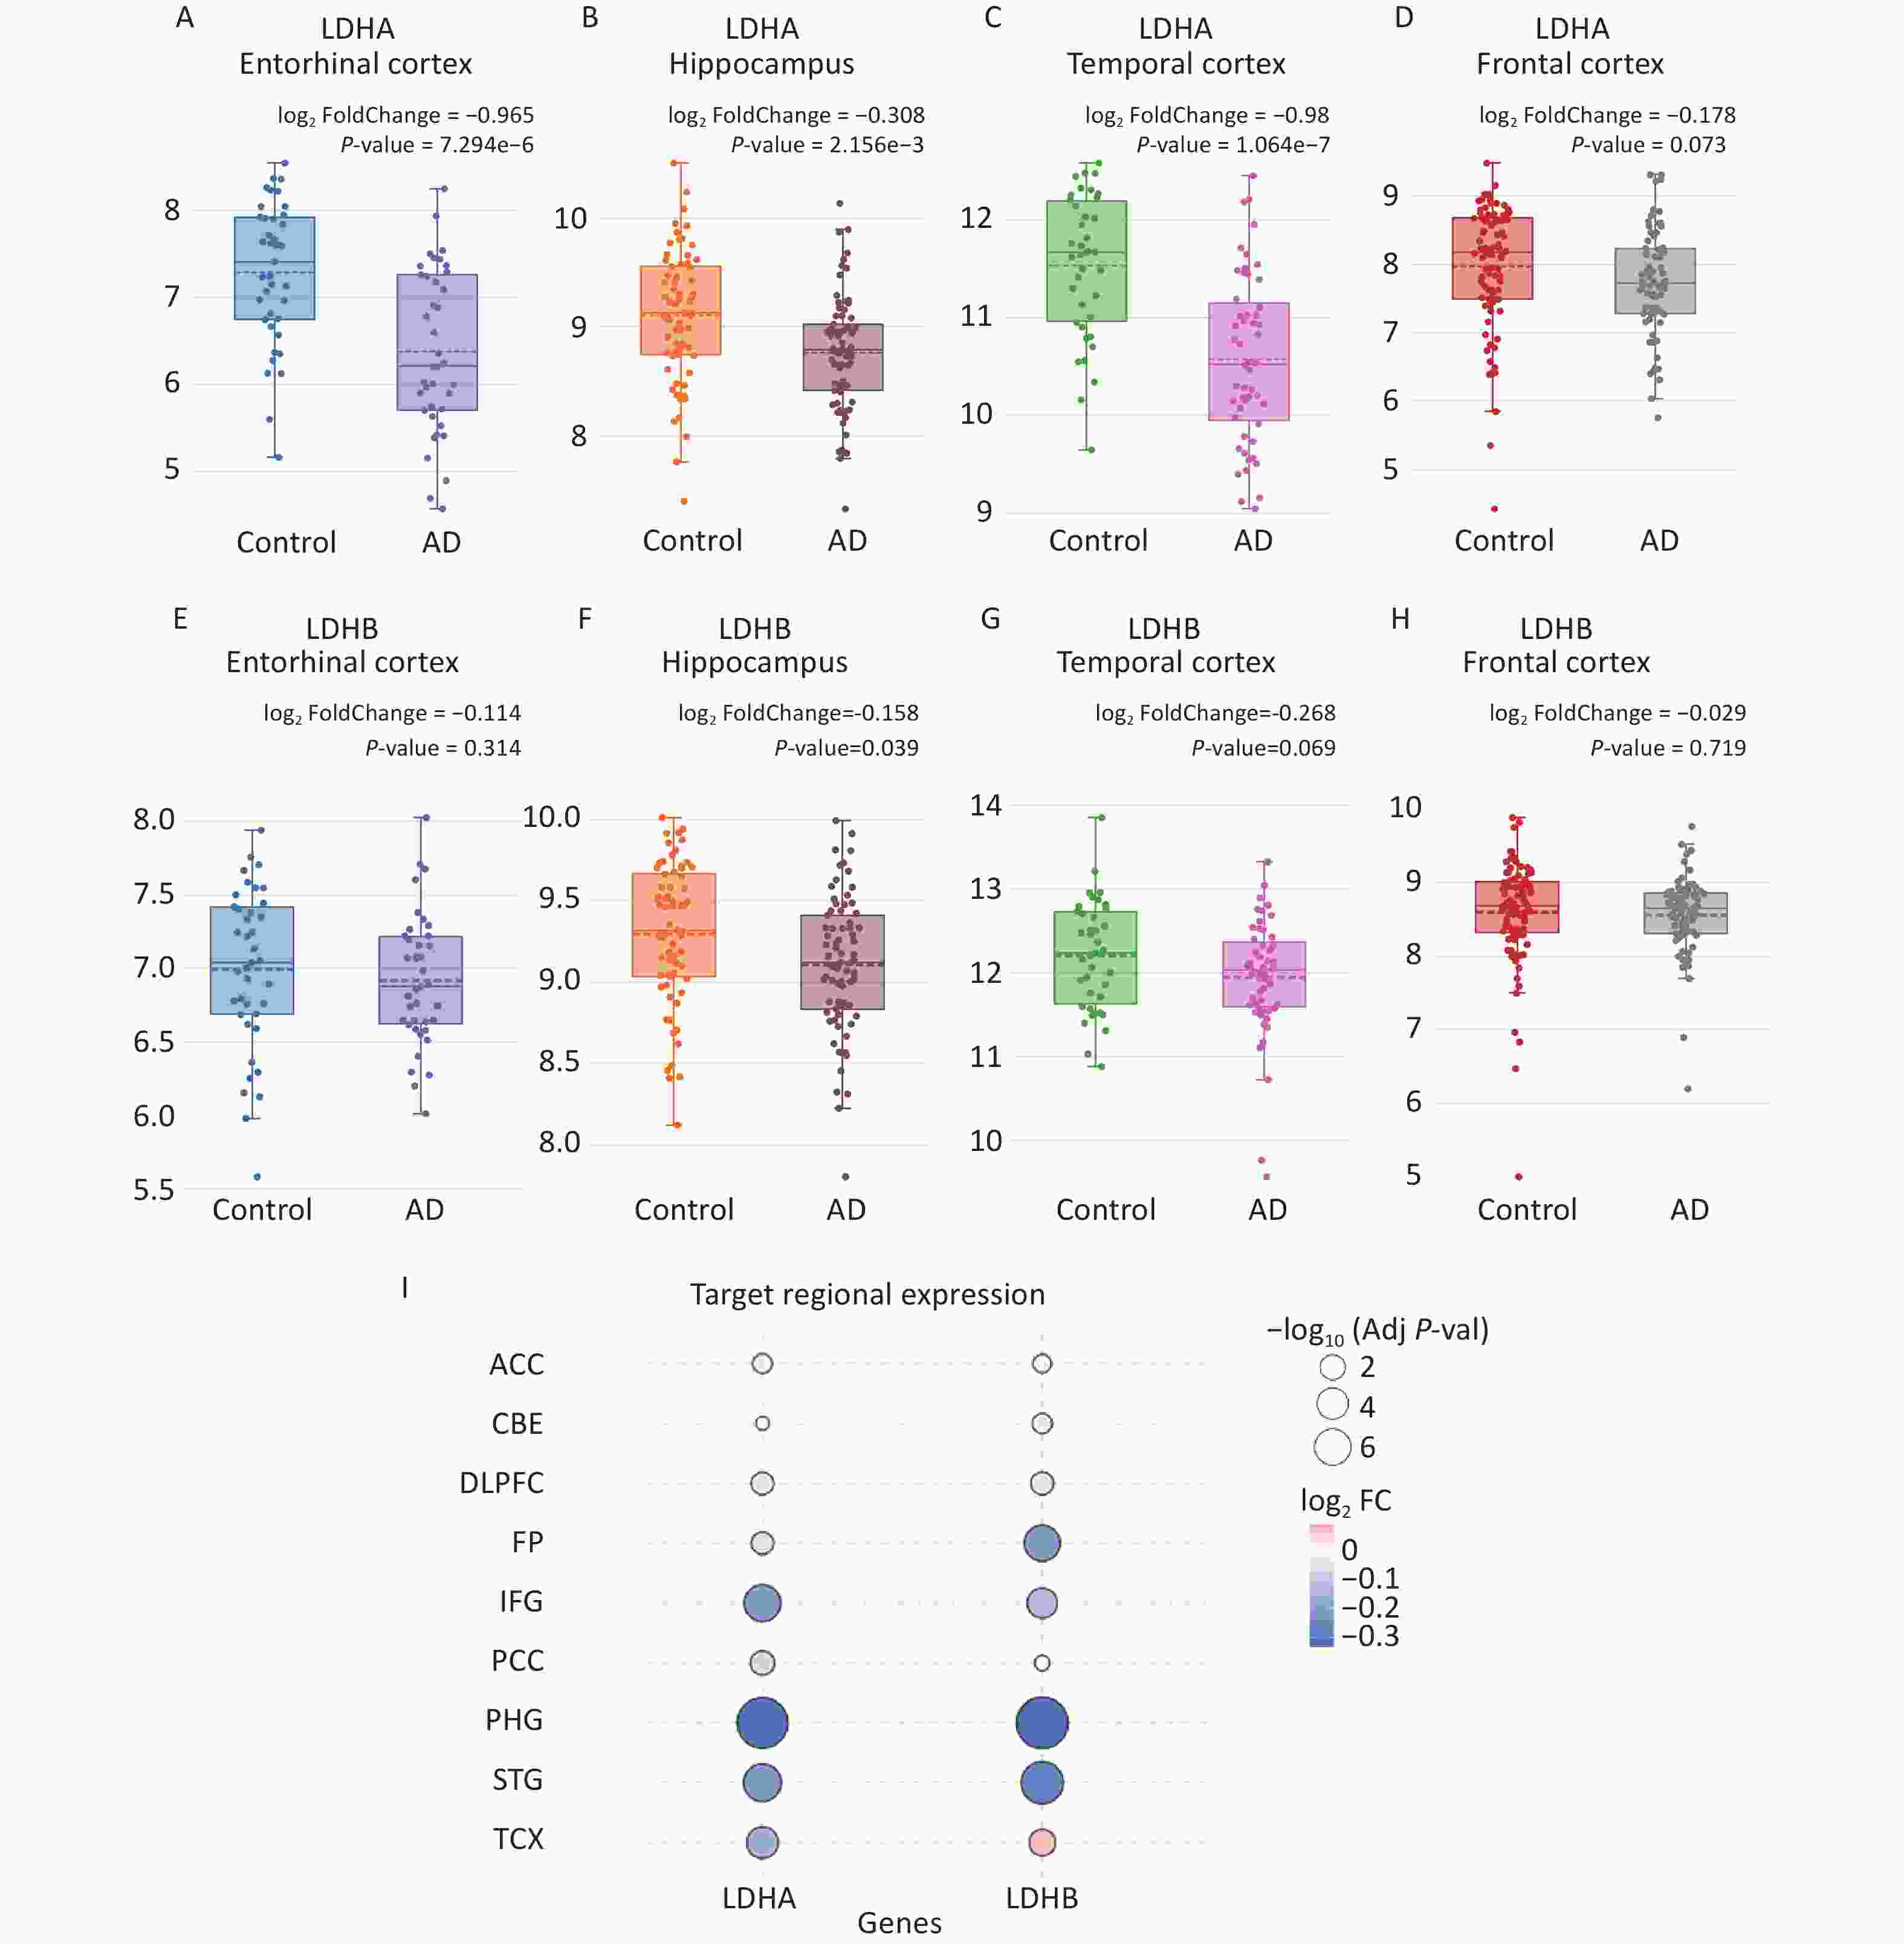
Figure 3. Expression of LDHA and LDHB in the specific brain regions of AD patients. (A–D) LDHA expression in the entorhinal cortex, hippocampus, temporal cortex, and frontal cortex from control and AD samples. (E–H) LDHB expression in the entorhinal cortex, hippocampus, temporal cortex, and frontal cortex from control and AD samples. (I) Regional changes in LDHA and LDHB expression across multiple brain regions. Bubble size represents statistical significance (-log10 adjusted P), and color gradient indicates log2 fold change. Abbreviations: ACC, anterior cingulate cortex; AD, Alzheimer’s disease; CBE, cerebellum; DLPFC, dorsolateral prefrontal cortex; FP, frontal pole; IFG, inferior frontal gyrus; PCC, posterior cingulate cortex; PHG, parahippocampal gyrus; STG, superior temporal gyrus; TCX, temporal cortex.
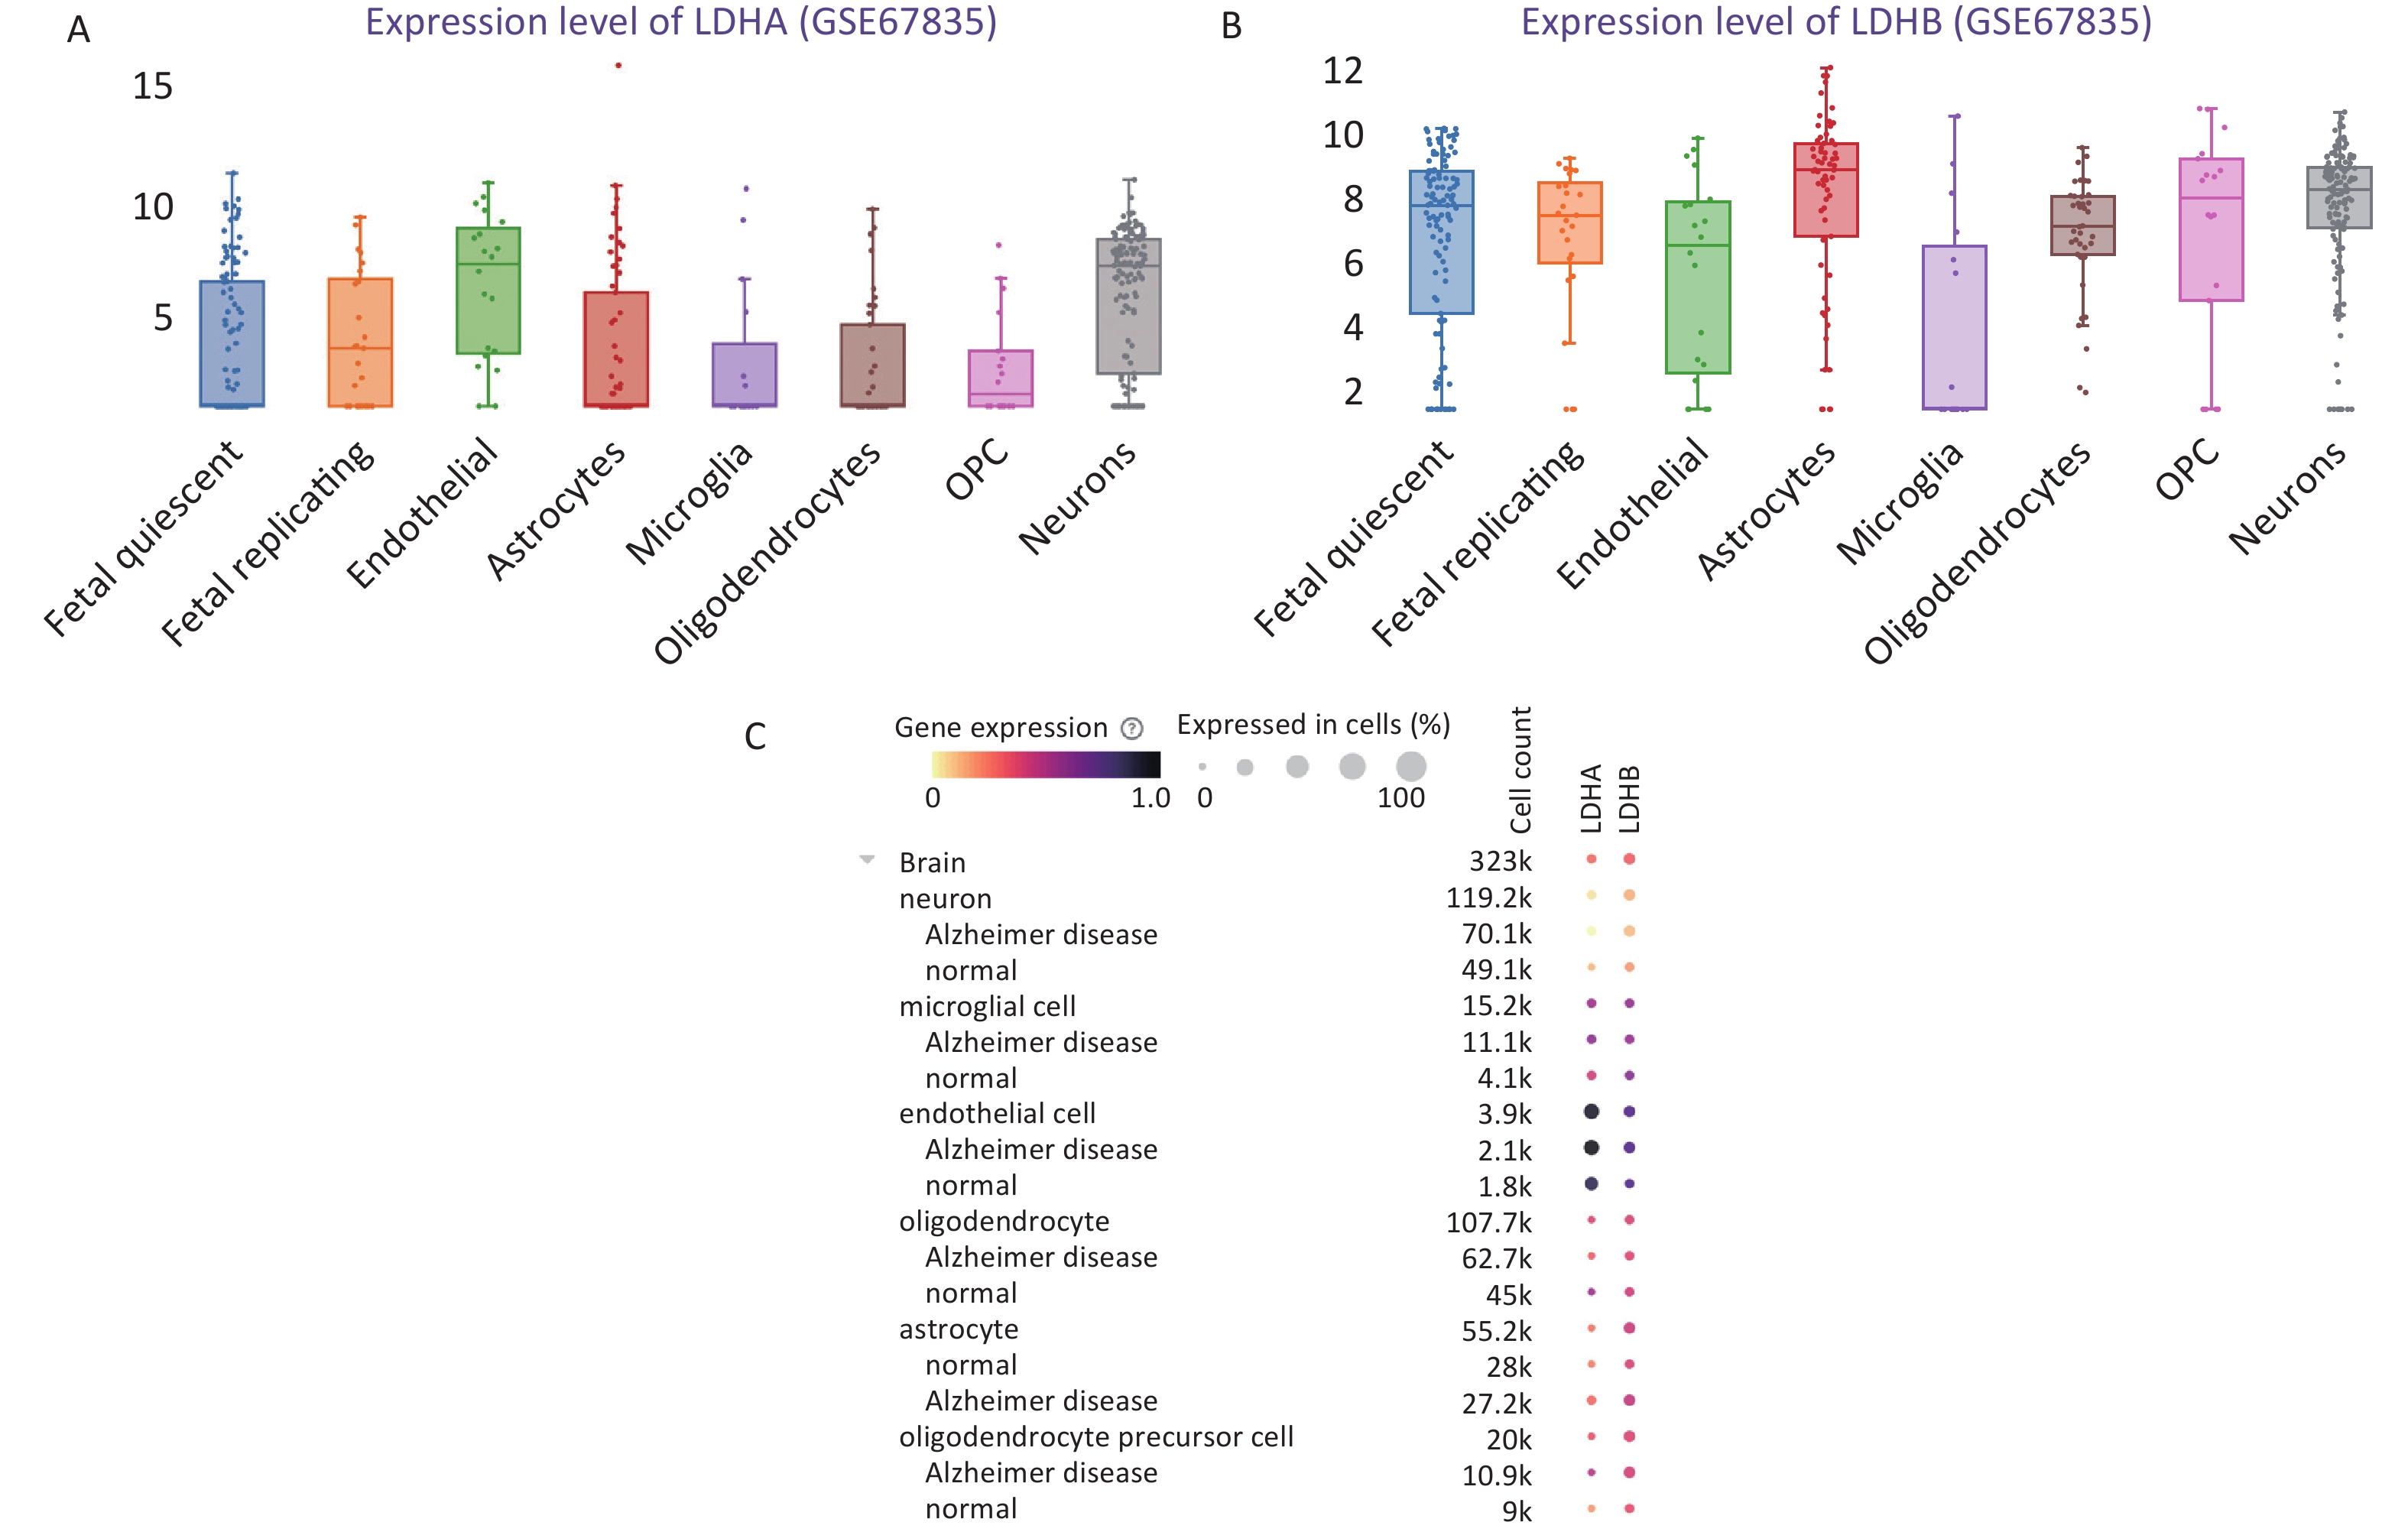
To determine the cell-type-specific distribution of LDHA and LDHB in the brain, we analyzed single-cell expression data from the AlzData and CELLxGENE platforms. The AlzData single-cell dataset was used as a reference dataset to describe baseline cell-type expression patterns rather than AD-related expression differences. LDHA showed relatively high expression in endothelial cells and neurons, whereas LDHB showed a broader expression pattern in astrocytes, neurons, oligodendrocyte precursor cells (OPCs), oligodendrocytes, and endothelial cells (Figure 4A-B; Supplementary Tables S4–S5). We used CELLxGENE to compare LDHA and LDHB expression between normal and AD brain cells. Both genes were detectable across multiple major brain cell types with relatively prominent expression in neurons. Descriptive comparison showed small AD-control differences in LDHA and LDHB expression across major cell types, with modest decreases mainly observed in neurons and oligodendrocytes, and small or inconsistent changes in other cell types (Figure 4C; Supplementary Table S6). These findings suggest that LDHA and LDHB have multicell-type expression patterns in the human brain, and that their AD-related alterations may be cell-type dependent rather than uniformly decreased across all brain cell populations.
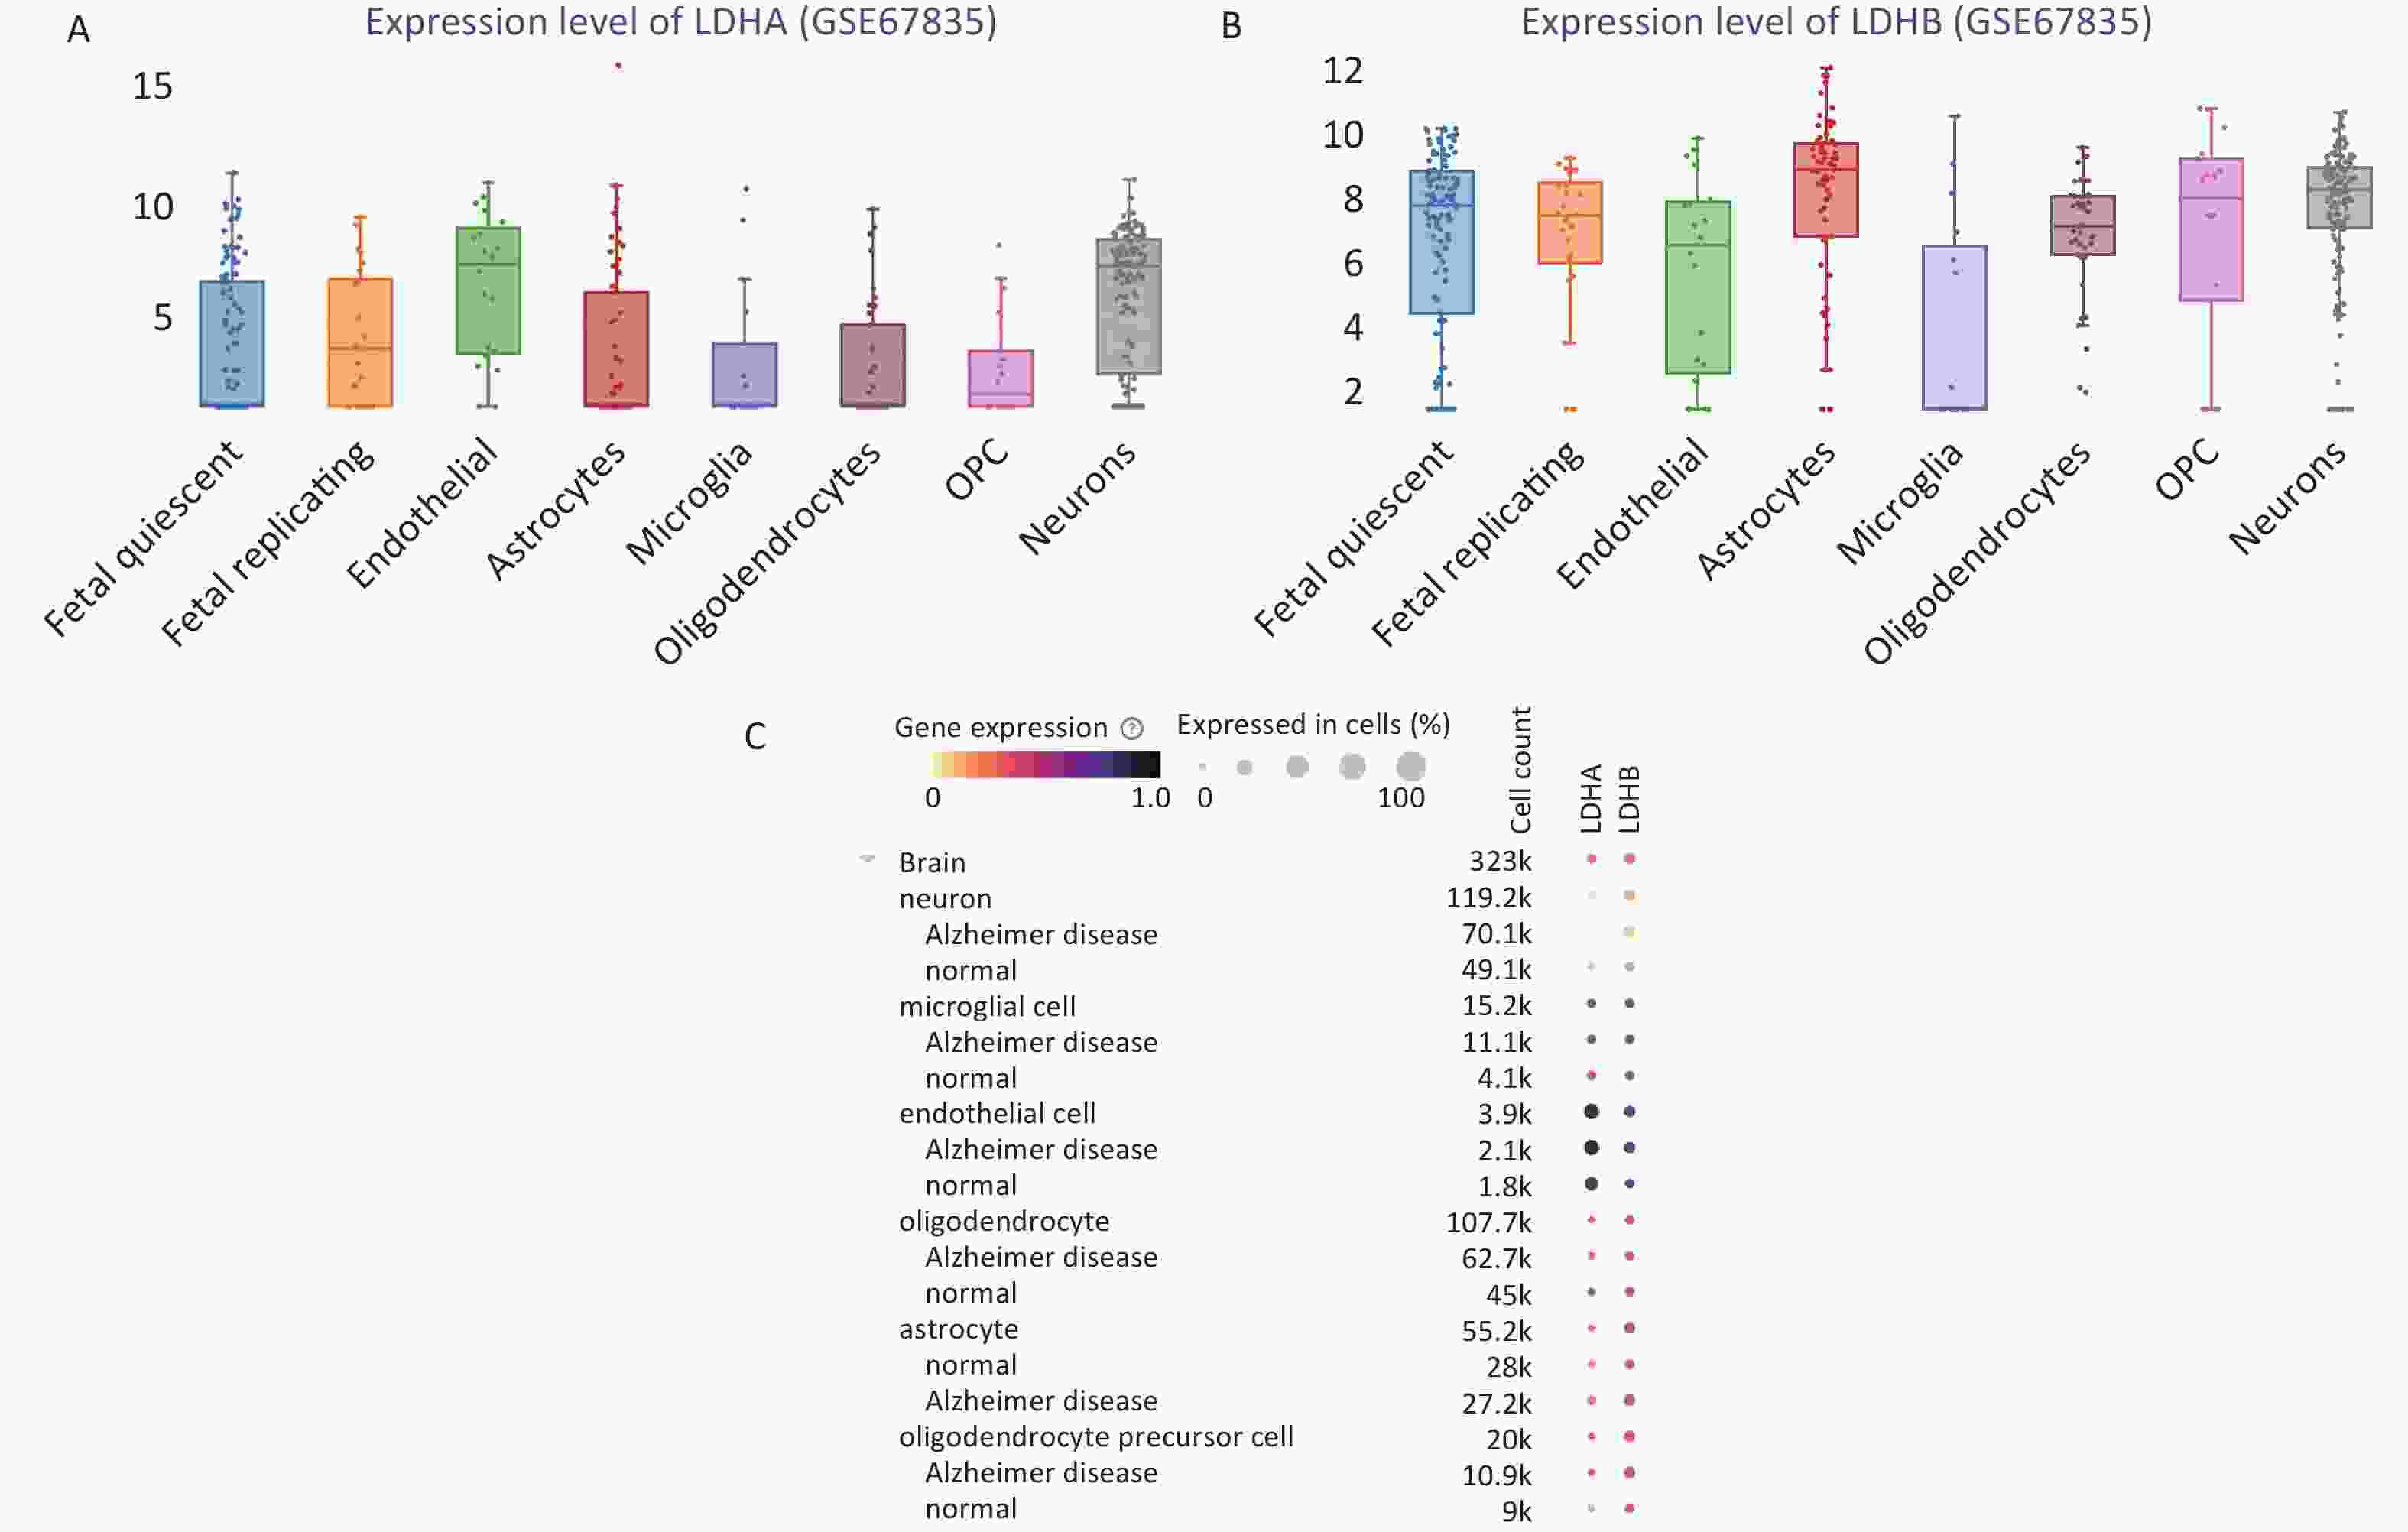
Figure 4. Cell-type distribution of LDHA and LDHB in the human brain. (A, B) Cell-type distribution of LDHA and LDHB expression based on the AlzData single-cell dataset GSE67835. (C) Cell-type-level comparison of LDHA and LDHB expression between AD and normal control samples using public CELLxGENE datasets. Bubble size indicates the proportion of cells expressing the gene in each cell type; color intensity represents average log-normalized expression. AD, Alzheimer’s disease; LDHA, lactate dehydrogenase A; LDHB, lactate dehydrogenase B; OPC, oligodendrocyte precursor cell.
-
To identify the BPs associated with LDHA and LDHB under physiological (non-disease) conditions, we performed a GTEx-based co-expression analysis across 13 human brain regions using GEPIA2. For each target, the top 1,000 positively correlated protein-coding genes were identified for subsequent functional annotation. The 10 genes most strongly correlated with LDHA and LDHB are detailed in Tables 4 and 5, respectively, and the complete gene lists are provided in Table S7. The top LDHA-correlated genes were PGK1 (r = 0.87), PGAM1 (r = 0.85), and VDAC1 (r = 0.85), which primarily mediate glycolysis, energy metabolism, and mitochondrial function. Other highly correlated genes were related to vesicular trafficking (RAB1A, r = 0.87; RAB11A, r = 0.83) or linked to mitochondrial protein import and biogenesis (TIMM17A, r = 0.83; TMEM70, r = 0.83). The top LDHB-correlated genes included ATP5J (r = 0.86), ATP5F1 (r = 0.85), and ATP5O (r = 0.84), which encode the subunits of ATP synthase. Other highly correlated genes such as UQCRFS1 (r = 0.83), NDUFB3 (r = 0.82), and COX5A (r = 0.82) are related to respiratory chain complexes and cytochrome c oxidase, whereas MRPL15 (r = 0.85) and COA3 (r = 0.82) are associated with mitochondrial translation and respiratory chain assembly. The LDHB-correlated gene set exhibited a narrower focus on mitochondrial respiration than did the LDHA-correlated set, which encompassed a broader range of both glycolytic and mitochondrial processes.
Gene Symbol Gene ID r RAB1A ENSG00000138069.16 0.87 PGK1 ENSG00000102144.13 0.87 GRPEL1 ENSG00000109519.12 0.86 VDAC1 ENSG00000213585.10 0.85 PGAM1 ENSG00000171314.8 0.85 NANS ENSG00000095380.10 0.84 NDUFAF4 ENSG00000123545.5 0.83 TMEM70 ENSG00000175606.10 0.83 RAB11A ENSG00000103769.9 0.83 TIMM17A ENSG00000134375.10 0.83 Note. r, Pearson correlation coefficient Table 4. Co-expression gene sets of LDHA in the normal human brain (Top 10)
Gene Symbol Gene ID r ATP5J ENSG00000154723.12 0.86 MRPL15 ENSG00000137547.8 0.85 ATP5F1 ENSG00000116459.10 0.85 ATP5O ENSG00000241837.6 0.84 UQCRFS1 ENSG00000169021.5 0.83 GLRX5 ENSG00000182512.4 0.83 COA3 ENSG00000183978.7 0.82 CHCHD2 ENSG00000106153.12 0.82 NDUFB3 ENSG00000119013.8 0.82 COX5A ENSG00000178741.11 0.82 Note. r, Pearson correlation coefficient Table 5. Co-expression gene sets of LDHB in the normal human brain (Top 10)
-
After identifying the genes co-expressed with LDHA in GTEx normal brain tissues, we characterized their biological functions using GO, KEGG, and GSEA. Standard enrichment analyses revealed a broad functional profile, encompassing translation initiation, ribosomal structural constituents, vesicle organization, and mitochondrial translation (Figure 5A). Consistent with this, the KEGG pathway analysis highlighted the proteasome, oxidative phosphorylation, carbon metabolism, and neurodegenerative disease-related KEGG pathways (Figure 5B). Furthermore, GSEA demonstrated that LDHA-correlated genes were prominently enriched in autophagy-related processes (e.g., macroautophagy and autophagosome assembly), actin cytoskeletal organization, and metal ion transport (Figures 5C–D). The corresponding GSEA-KEGG analysis further implicated endocytosis, proteasomes, and a cluster of neurodegenerative diseases (Figure 5E). Collectively, these findings suggest that, under normal physiological conditions, LDHA-associated genes are broadly involved in proteostasis (protein synthesis and degradation), vesicular trafficking, autophagy, and basic energy metabolism (full results of Figures 5A–E in Supplementary Table S8).
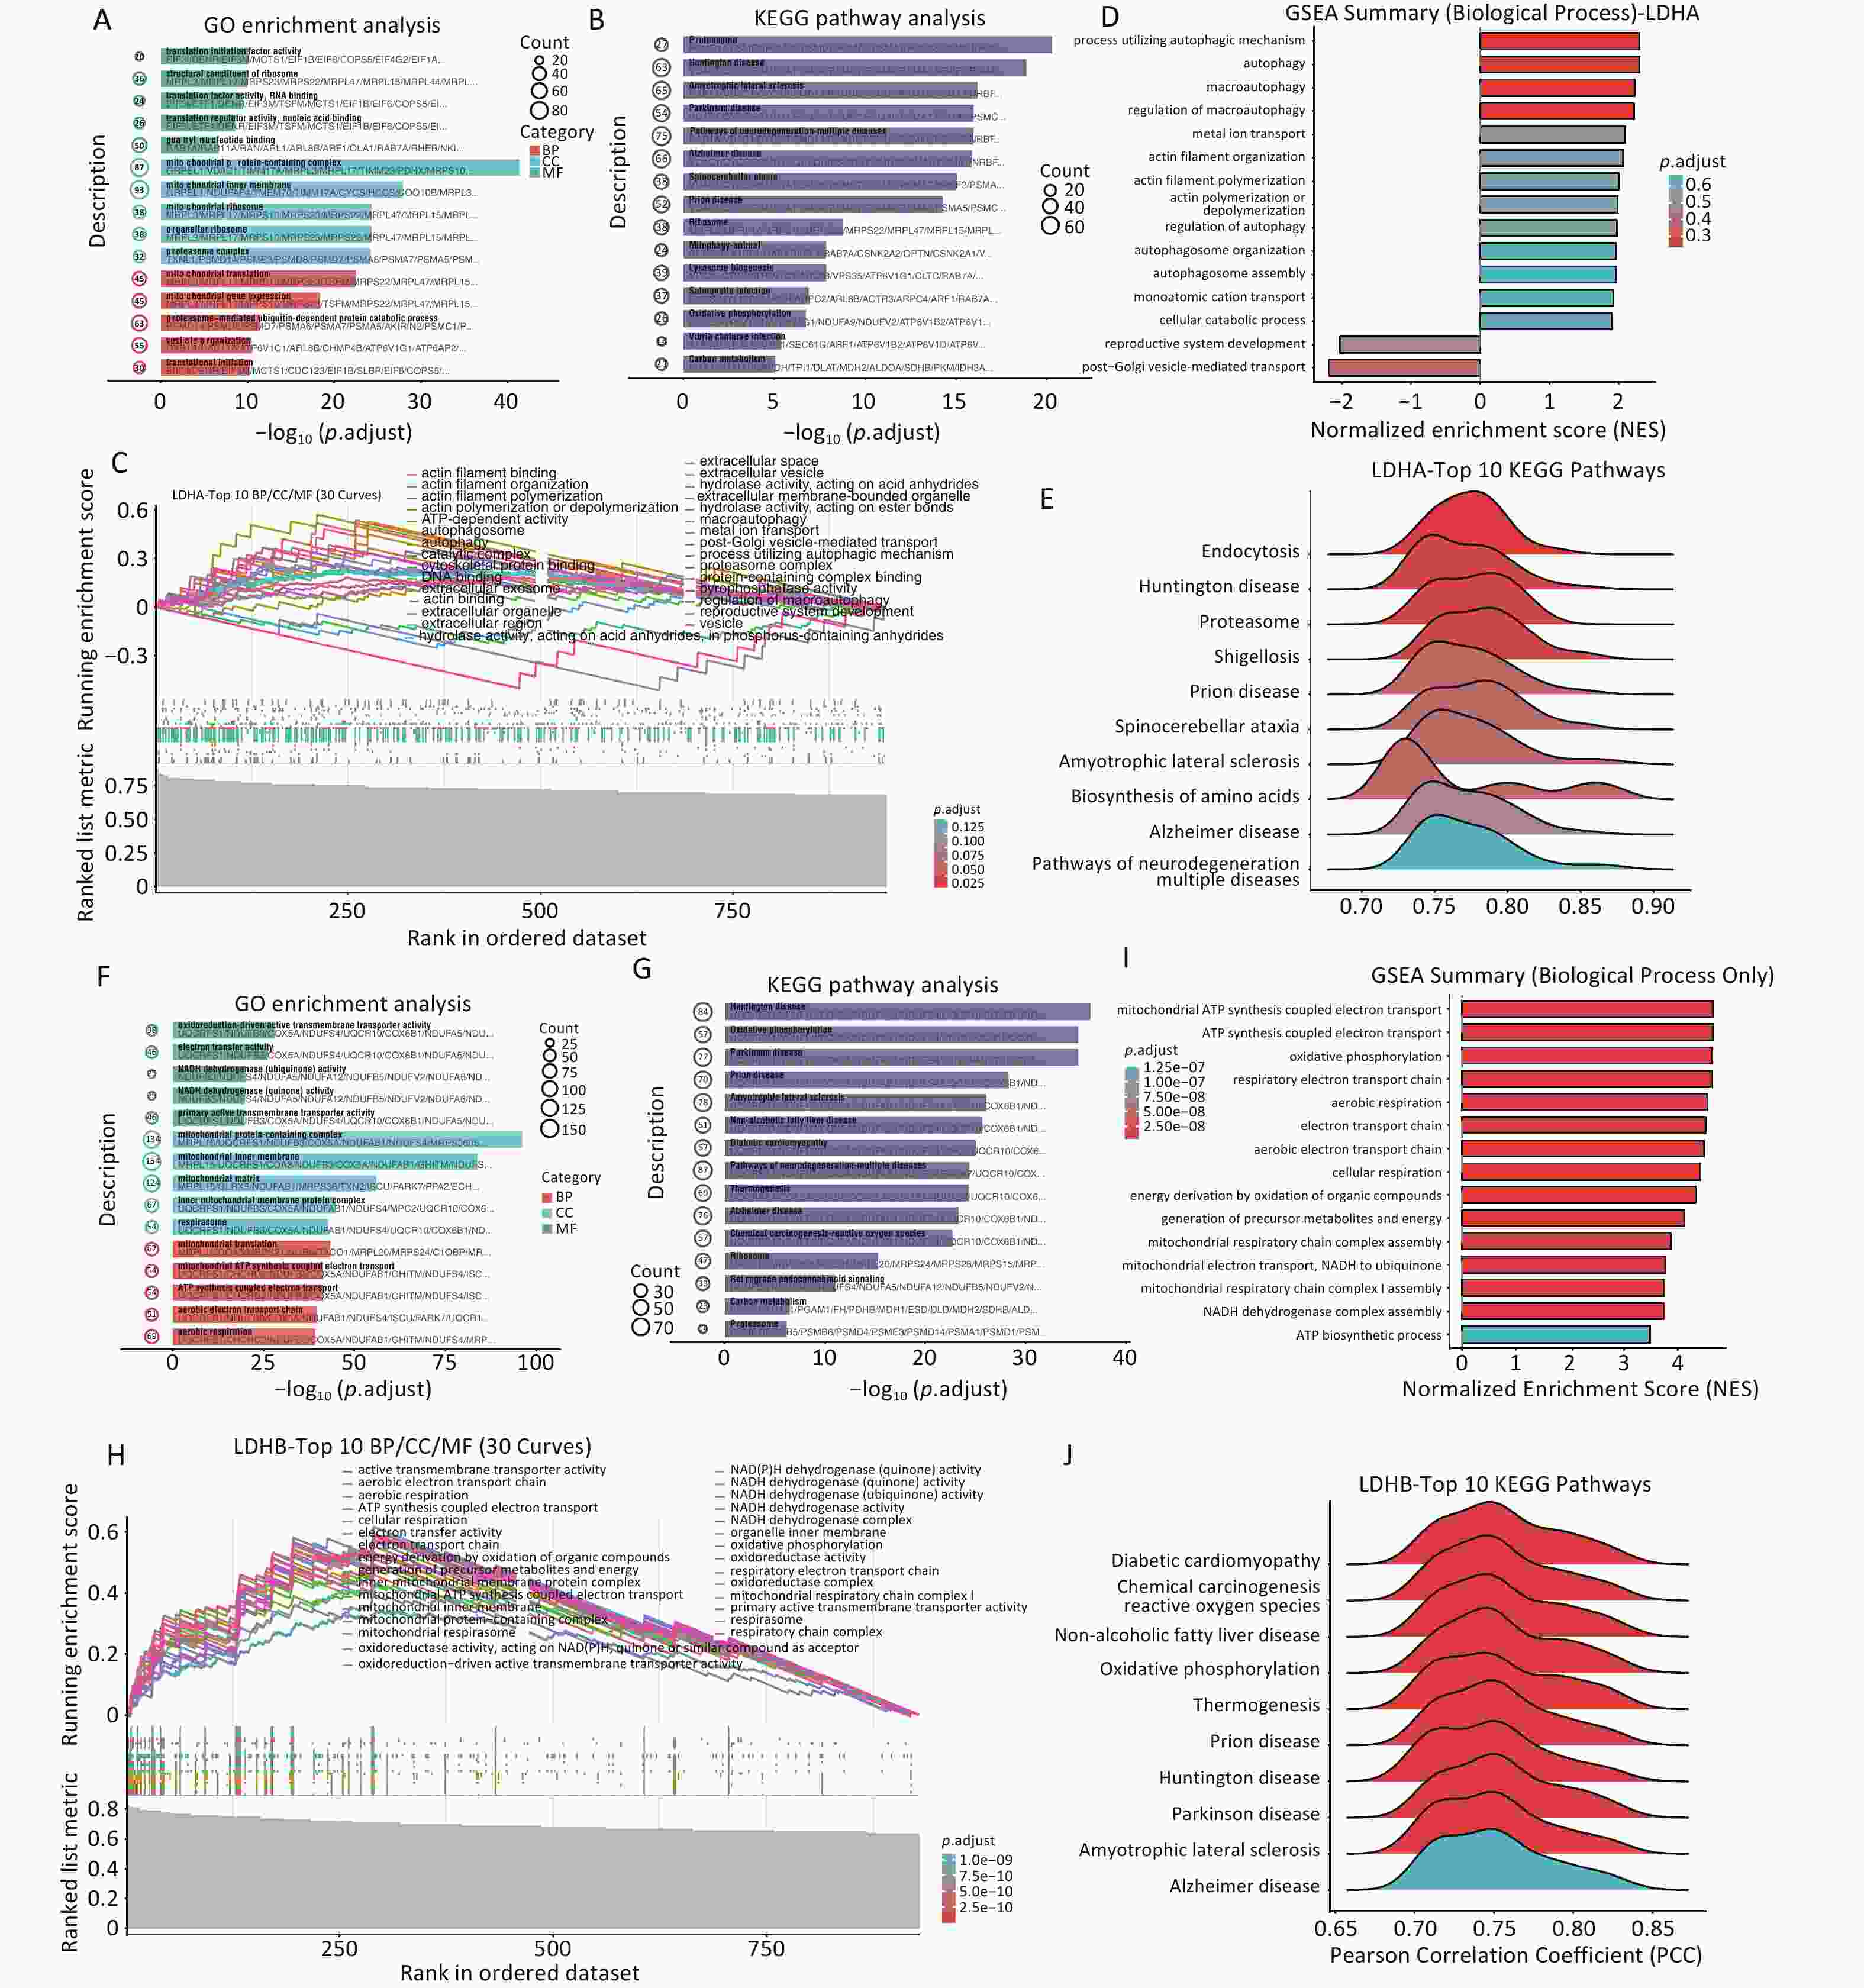
Figure 5. Functional enrichment of LDHA- and LDHB-correlated gene sets. (A, B) Gene Ontology (GO) and Kyoto Encyclopedia of Genes and Genomes (KEGG) over-representation analyses of LDHA-associated genes. (C) GSEA-GO enrichment curves based on genes ranked by their correlation with LDHA, including representative terms from BP, CC, and MF categories. (D) Top enriched GO BP terms from the LDHA-ranked gene list. (E) Top enriched KEGG pathways from the LDHA-ranked gene list. (F, G) GO and KEGG over-representation analyses of LDHB-associated genes. (H) GSEA-GO enrichment curves based on genes ranked by their correlation with LDHB, including representative terms from BP, CC, and molecular function categories. (I) Top enriched GO BP terms from the LDHB-ranked gene list. (J) Top enriched KEGG pathways from the LDHB-ranked gene list. In the over-representation plots, bar length indicates -log10 adjusted P value and dot size indicates gene count. In the GSEA summary plots, bar length indicates the normalized enrichment score, and color indicates the adjusted P value. Adjusted P values are indicated in the plots, and an adjusted P value < 0.05 was considered statistically significant. BP, biological process; CC, cellular component; FDR, false discovery rate; GO, Gene Ontology; GSEA, gene set enrichment analysis; KEGG, Kyoto Encyclopedia of Genes and Genomes; LDHA, lactate dehydrogenase A; LDHB, lactate dehydrogenase B; MF, molecular function; NES, normalized enrichment score. Full results are provided in Supplementary Tables S8–9.
Compared with the LDHA-correlated gene set, standard enrichment analyses of LDHB-correlated genes revealed a highly focused functional profile encompassing mitochondrial translation, ATP synthesis coupled with electron transport, aerobic respiration, and oxidoreduction-driven transmembrane transporter activity (Figure 5F). Consistent with this, the KEGG pathway analysis highlighted oxidative phosphorylation, thermogenesis, and neurodegenerative disease-related pathways (Figure 5G). Furthermore, GSEA demonstrated that LDHB-correlated genes were prominently enriched in mitochondrial respiration processes (e.g., respiratory electron transport chain and cellular respiration), the inner mitochondrial membrane protein complex, and mitochondrial respirasome (Figures 5H–I). GSEA-KEGG analysis further implicated oxidative phosphorylation, diabetic cardiomyopathy, and a cluster of neurodegenerative diseases (Figure 5J). Collectively, these findings suggest that under normal physiological conditions, LDHB-associated genes are mainly involved in mitochondrial energy production (full results of Figures 5F–J are provided in Supplementary Table S9).
-
Having identified the top 1,000 genes co-expressed with LDHA and LDHB, we analyzed the overlap between the two sets. In total, 505 genes were positively correlated with both LDH subunits across 13 normal human brain regions (full list in Supplementary Table S7). To characterize the functional landscape of this overlapping gene set, we performed GO and KEGG enrichment analyses. The overlapping gene set was strongly enriched for mitochondrial function and energy metabolism. The most prominent BPs include mitochondrial translation, aerobic respiration, and ATP synthesis, coupled with electron transport. CC and MF analyses consistently pointed to the mitochondrial inner membrane, respirasome, structural constituents of the ribosome, and iron-sulfur cluster binding (Figure 6A). Furthermore, the KEGG pathway analysis highlighted oxidative phosphorylation, carbon metabolism, and multiple neurodegenerative diseases (e.g., Huntington’s, Parkinson’s, and Alzheimer’s diseases), along with ribosome and lysosome biogenesis pathways (Figure 6B). Collectively, these results indicate that, in the normal human brain, genes co-expressed with both LDH subunits strongly converge on mitochondrial oxidative phosphorylation, protein synthesis, and basic energy metabolism (full results in Supplementary Table S10).
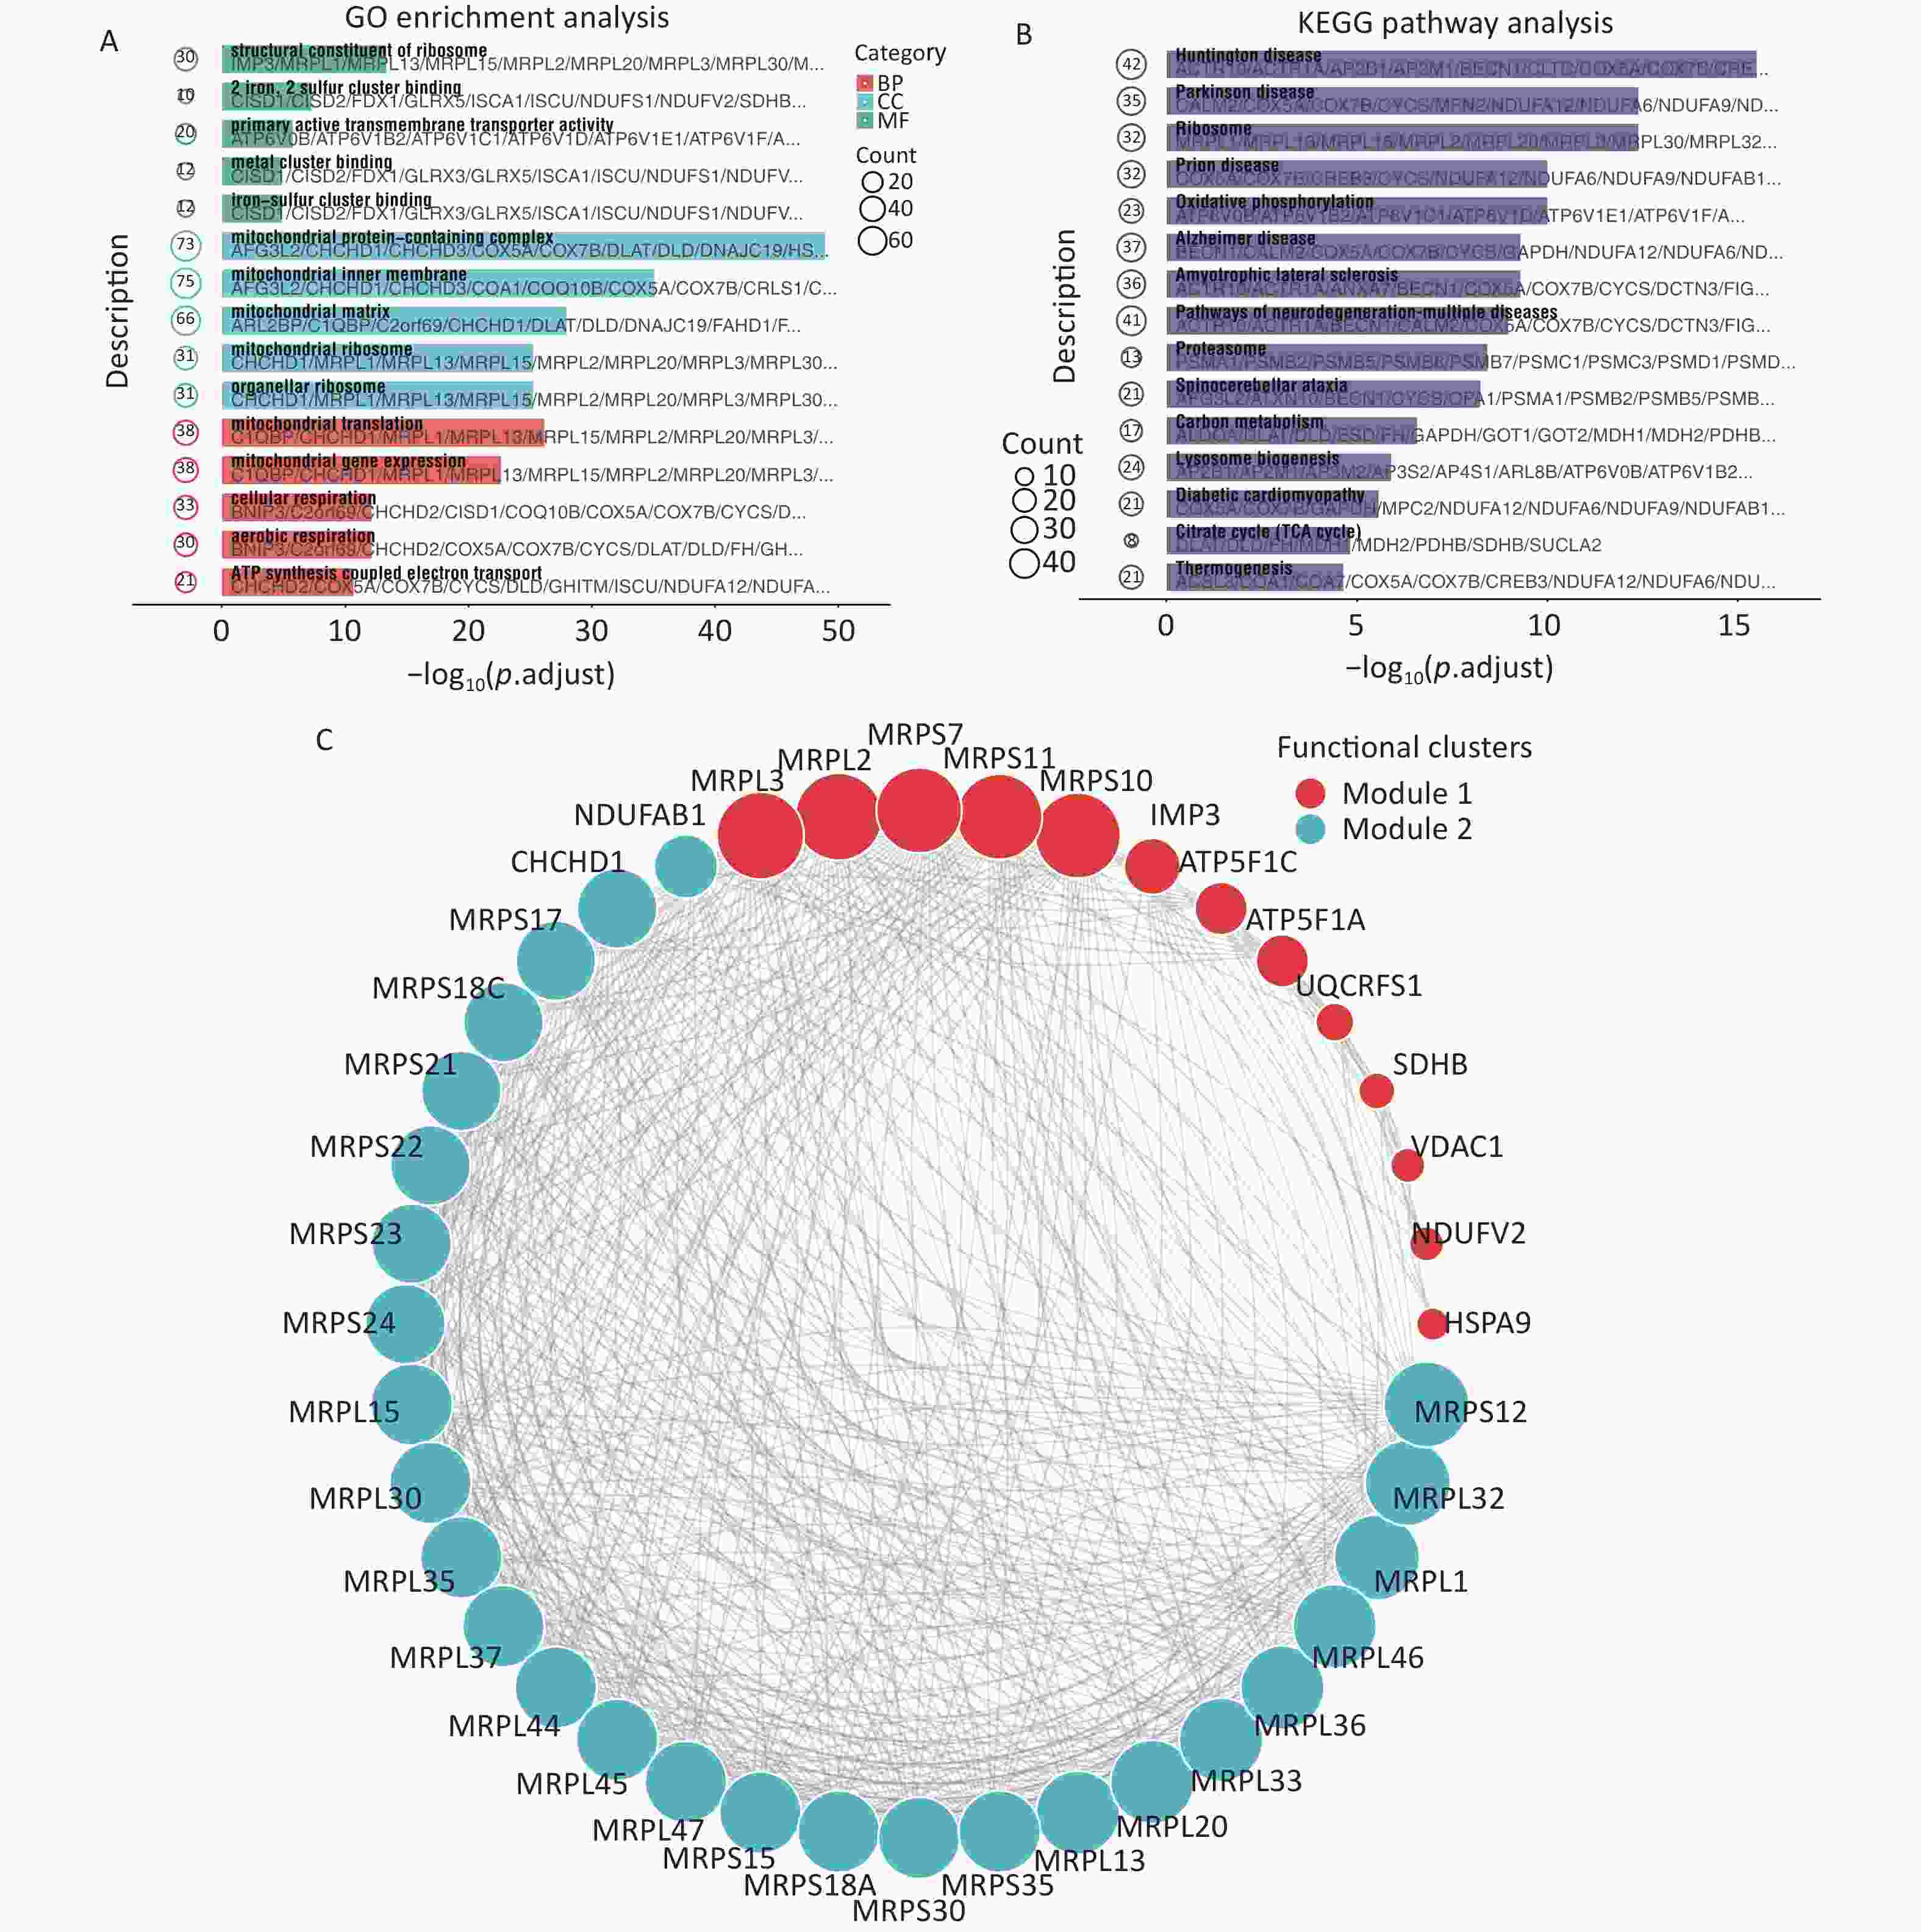
Figure 6. Functional characterization and protein–protein interaction network of the overlapping gene set. (A) Gene Ontology (GO) enrichment analysis of the 505 overlapping genes co-expressed with both LDHA and LDHB, including the top enriched terms from BP, CC, and molecular function categories. (B) Kyoto Encyclopedia of Genes and Genomes (KEGG) pathway enrichment analysis of the overlapping gene set. In panels A and B, bar length indicates -log10 adjusted P value, and dot size indicates gene count. Full enrichment results are provided in Supplementary Table S10. (C) Protein–protein interaction network of the top 40 hub genes from the overlapping gene set, ranked by degree centrality. The full network contained 387 nodes and 1,206 edges, with significantly more interactions than expected by chance (PPI enrichment P < 1.0 × 10⁻¹⁶). Node color indicates Louvain cluster assignment. BP, biological process; CC, cellular component; GO, Gene Ontology; KEGG, Kyoto Encyclopedia of Genes and Genomes; LDHA, lactate dehydrogenase A; LDHB, lactate dehydrogenase B; MF, molecular function; PPI, protein–protein interaction.
To map the functional interactome of this core gene set, we constructed a protein–protein interaction (PPI) network using the STRING database. After excluding disconnected nodes, the resulting network comprised 387 nodes and 1,206 edges. Significant PPI enrichment suggested that these proteins were functionally connected rather than randomly assembled (PPI enrichment P < 1.0 × 10⁻¹⁶). Based on degree centrality, we identified the top 40 hub genes and used Louvain clustering to partition this core network into two distinct modules (Figure 6C). Module 1 contained a mixture of oxidative phosphorylation subunits (ATP5F1A, ATP5F1C, UQCRFS1, SDHB, and NDUFV2), mitochondrial ribosomal proteins (MRPL2, MRPL3, and MRPS7), chaperone HSPA9, and voltage-dependent anion channel VDAC1. Module 2 was predominantly composed of mitochondrial ribosomal proteins (including MRPL1, MRPS12, and 24 other MRPL/MRPS subunits), along with the complex I assembly factor NDUFAB1 and mitochondrial protein CHCHD1. The close connection between these modules suggests a functional relationship between mitochondrial translation and oxidative phosphorylation components. Collectively, this PPI network represents a shared reference protein-interaction landscape of the two LDH subunits in the normal human brain, providing a basis for comparison with LDHA- and LDHB-containing modules identified in AD brain transcriptomic datasets.
-
To examine LDHA- and LDHB-containing co-expression modules in AD-related brain datasets, we performed WGCNA using cross-platform-normalized transcriptomic data from the AlzData Database. We constructed co-expression networks across four AD-vulnerable brain regions (hippocampus, entorhinal cortex, temporal cortex, and frontal cortex) to identify modules containing LDHA and LDHB and characterize the enriched biological functions of these modules.
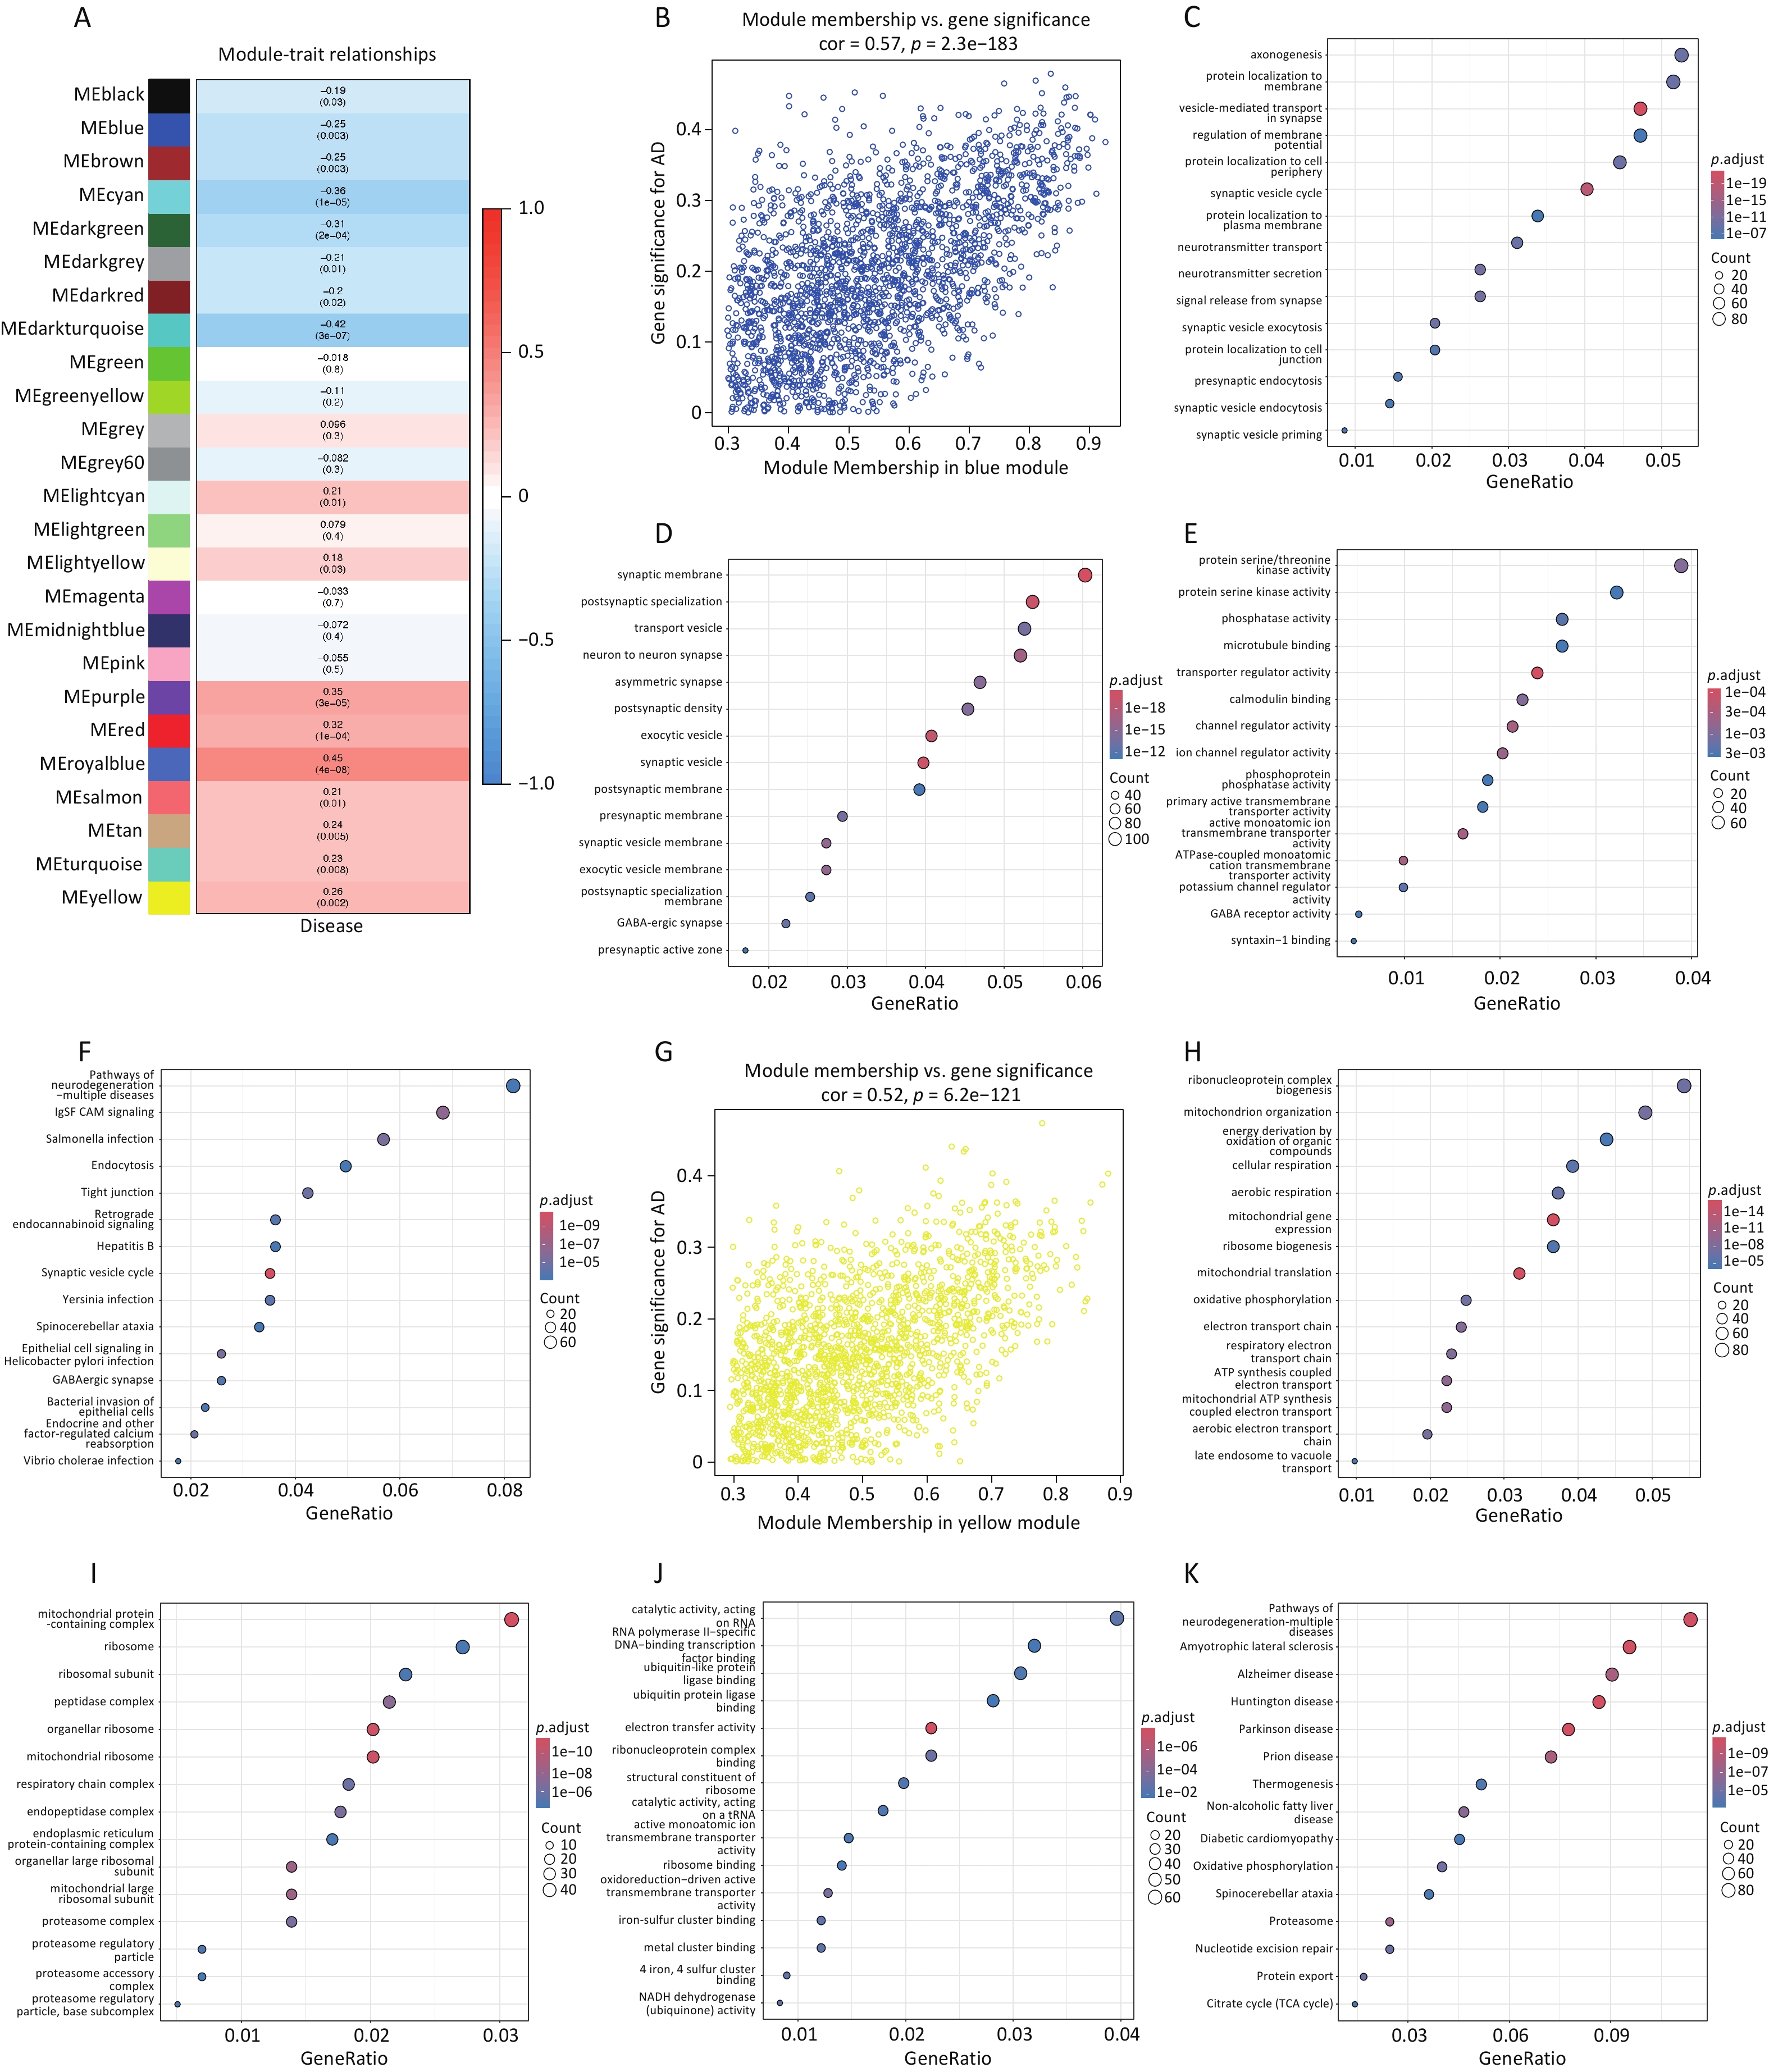
The hippocampus is critical for memory consolidation and one of the earliest targets of AD pathogenesis. WGCNA revealed that LDHA and LDHB segregated into distinct functional modules in the hippocampus (Figure 7A; Supplementary Table S11). LDHA was assigned to the blue module (containing 2,125 genes). At module level, the blue module was negatively correlated with AD status (r = −0.25, P = 0.003; Figure 7A). At gene level, LDHA showed a high module membership (MM; MM = 0.618) and a significant negative correlation with AD (Gene Significance [GS] = −0.311, P = 2.21 × 10⁻⁴; Figure 7B). Functional enrichment analysis revealed that the LDHA blue module was mainly associated with synaptic functions. The enriched BPs included synaptic vesicle cycle, vesicle-mediated transport in the synapse, and neurotransmitter secretion. The CC terms included the synaptic membrane, postsynaptic specialization, and presynaptic active zone. The MF and KEGG pathways were mainly enriched in ion channel regulator activity, GABAergic synapses, endocytosis, and retrograde endocannabinoid signaling (Figure 7C–F).
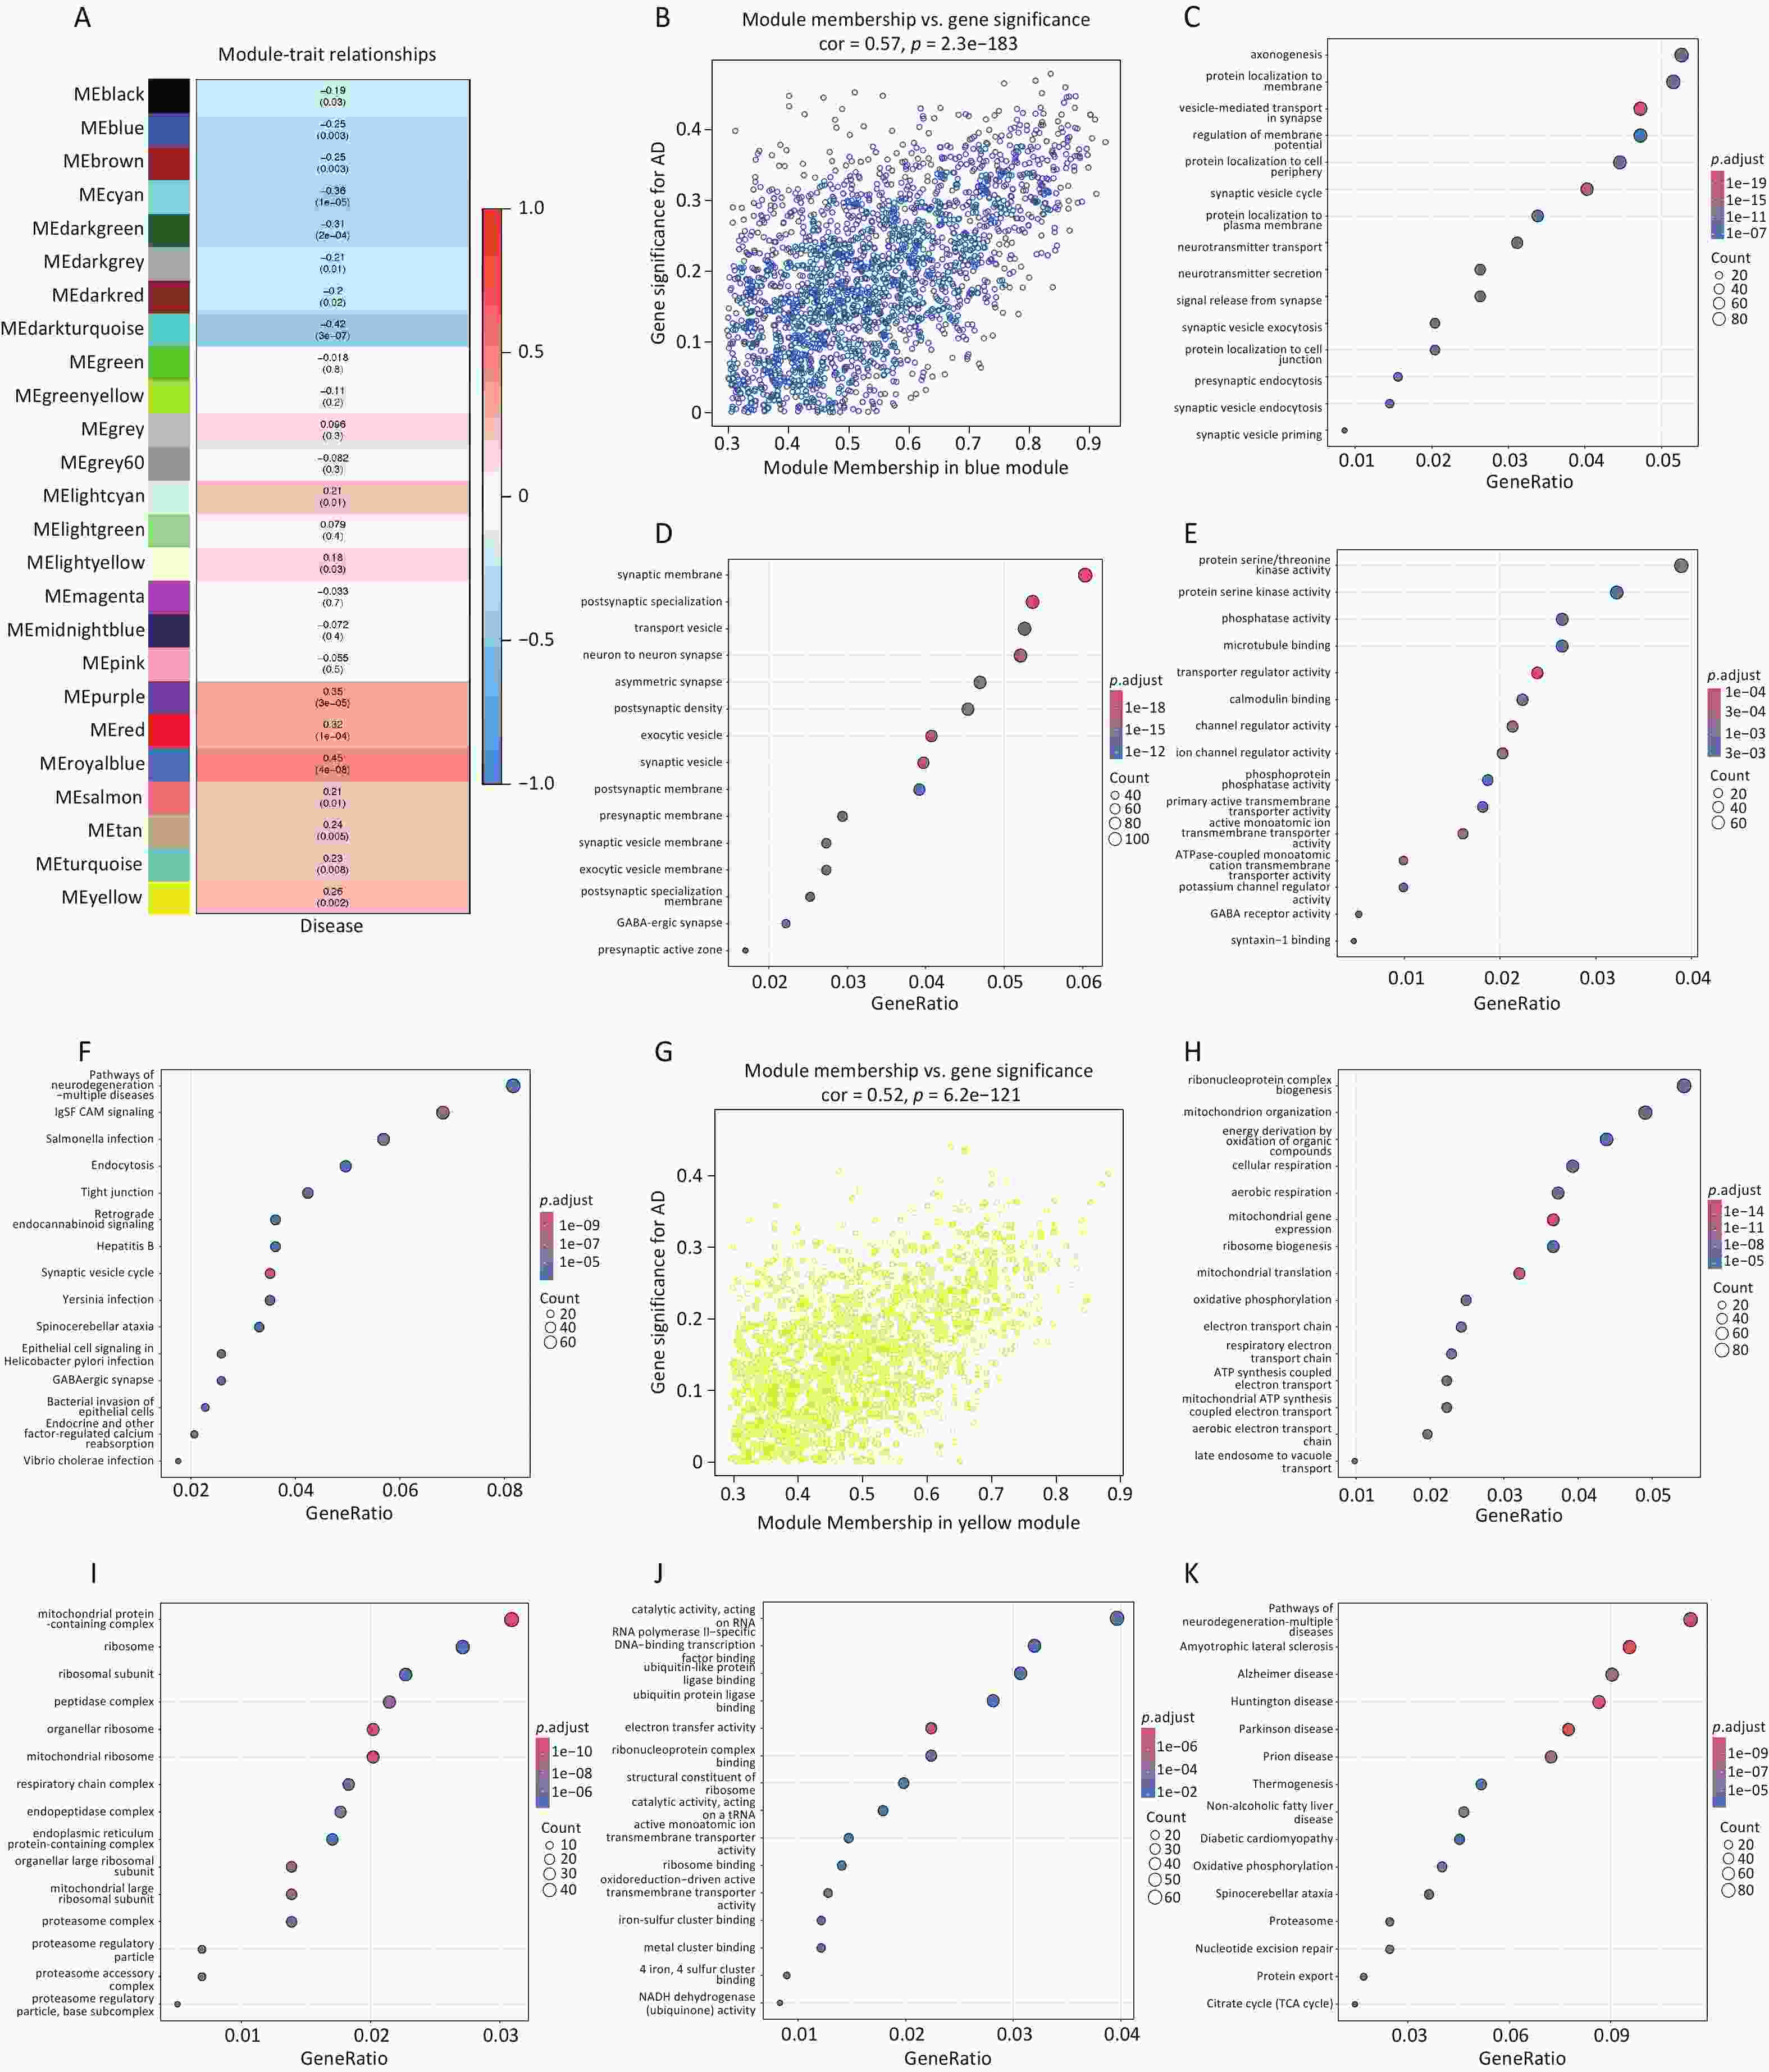
Figure 7. Identification and functional annotation of AD-associated WGCNA modules in the hippocampus. (A) Correlation heatmap between WGCNA module eigengenes and AD status. Each cell shows the correlation coefficient, with the corresponding P value shown in parentheses. Red indicates positive correlation, and blue indicates negative correlation. (B) Correlation between MM and GS for AD in the blue module. (C-F) Functional enrichment analysis of genes in the blue module, including Gene Ontology BP (C), CC (D), molecular function (E), and KEGG pathway enrichment (F). (G) Correlation between module membership and GS for AD in the yellow module. (H–K) Functional enrichment analysis of genes in the yellow module, including Gene Ontology BP (H), CC (I), molecular function (J), and KEGG pathway enrichment (K). In the enrichment plots, the x-axis indicates the gene ratio, dot size indicates gene count, and dot color indicates the adjusted P value. Full enrichment results are provided in Supplementary Table S11. AD, Alzheimer’s disease; BP, biological process; CC, cellular component; GO, Gene Ontology; GS, gene significance; KEGG, Kyoto Encyclopedia of Genes and Genomes; MF, molecular function; MM, module membership; MS, Module Membership; WGCNA, weighted gene co-expression network analysis.
In contrast, LDHB was assigned to the yellow module (containing 1,737 genes). At module level, the yellow module was significantly correlated with AD (r = 0.26, P = 0.002; Figure 7A). However, at gene level, LDHB showed a high MM (MM = 0.651) and a significant negative correlation with AD (GS = −0.237, P = 0.005; Figure 7G). Therefore, the functional enrichment of the LDHB-containing module should be interpreted at module level, whereas the direction of LDHB itself was evaluated using GS. Unlike the LDHA module, the yellow LDHB module was mainly enriched in mitochondrial energy metabolism. The most enriched terms included mitochondrial translation, ATP synthesis coupled with electron transport, oxidative phosphorylation, and TCA cycle (Figure 7H–K). Together, these results indicate that in the AD hippocampus, the LDHA co-expression module is highly enriched in synaptic and vesicular transport functions, showing stronger synaptic features than do the GTEx normal brain data. The LDHB-containing module was predominantly enriched in mitochondrial oxidative metabolism-related pathways, which is consistent with the physiological GTEx results.
A similar pattern of module separation was observed in the entorhinal cortex (Supplementary Table S12). LDHA was assigned to the blue module (containing 2,197 genes). At the gene level, LDHA showed a high MM (MM = 0.836) and a significant negative correlation with AD (GS = −0.455, P = 3.3 × 10⁻⁵; Supplementary Figure S1B). Functional enrichment showed that the LDHA blue module was associated with both energy metabolism and synaptic functions, including the synaptic vesicle cycle, vesicle-mediated transport, aerobic respiration, and ATP synthesis (Supplementary Figures S1C–F). In contrast, LDHB was assigned to the pink module (containing 342 genes), showing a high MM (MM = 0.752) and a GS of −0.120 (P = 0.299; Supplementary Figure S1G). The LDHB pink module was mainly enriched in vesicle transport, autophagy, and RNA processing, including endosomal transport, macroautophagy, the SNARE complex, and electron transport chain (Supplementary Figures S1H–K).
Different module assignment patterns were observed in the temporal and frontal cortices, where LDHA and LDHB converged into shared co-expression modules. In the temporal cortex, both LDHA and LDHB were assigned to the same blue module (2,339 genes; Supplementary Table S13). LDHA showed MM of 0.807 and GS of −0.505 (P = 3.83 × 10⁻⁷), while LDHB showed MM of 0.612 and GS of −0.169 (P = 0.112) (Supplementary Figure S2B). Functional enrichment analysis showed that this shared module integrated cellular respiration, ATP synthesis, vesicle localization, the synaptic vesicle cycle, and proteasome complex (Supplementary Figures S2C–F). Similarly, in the frontal cortex, both subunits were assigned to the turquoise module (2,710 genes; Supplementary Table 14). LDHA showed MM of 0.704 (GS = −0.170, P = 0.0329), and LDHB showed MM of 0.595 (GS = −0.088, P = 0.273; Supplementary Figure S3B). Functional enrichment of this shared module also revealed a highly integrated profile encompassing cellular respiration, vesicle-mediated transport in the synapse, macroautophagy, and oxidative phosphorylation (Supplementary Figures S3C–F). Collectively, these results show that LDHA and LDHB belong to different functional modules in the hippocampus and entorhinal cortex, but share the same module in the temporal and frontal cortices.
-
This case-control study integrated a clinical cohort with public brain transcriptomic datasets to evaluate LDH-related alterations in AD from the peripheral, brain regional, cell-type level, and functional network perspectives. The results showed that (1) serum LDH activity was significantly decreased in patients with MCI and AD; (2) public brain transcriptomic datasets showed reduced LDHA and LDHB expression in several AD-related brain regions, whereas cell-type-level analyses suggested multicell-type expression patterns with modest AD-control differences; and (3) GTEx-based reference co-expression analysis and AD-related WGCNA indicated that LDHA- and LDHB-associated gene networks were related to synaptic vesicle function, mitochondrial energy metabolism, autophagy, and proteostasis. Importantly, these findings should be interpreted as convergent but non-paired evidence and do not establish a direct peripheral-central association or causal mechanism.
We observed a significant decrease in serum LDH activity in patients with MCI and AD. This reduction remained significant after adjusting for major clinical covariates. In parallel, brain transcriptomic datasets showed a downregulation of LDHA and LDHB in AD-related regions. This parallel decline contrasts with the LDH elevation typically observed in acute systemic diseases such as myocardial injury or malignancy[12,14,29]. Under these acute conditions, elevated serum LDH levels are generally interpreted as nonspecific indicators of tissue injury and increased cell membrane permeability[12]. Similarly, in vitro assays often measure extracellular LDH release to quantify acute amyloid-beta (Aβ) cytotoxicity[30,31]. Our findings indicated different BP. In chronic neurodegenerative process such as AD, the decrease in serum LDH activity and brain LDHA/LDHB expression is less likely to indicate acute cellular leakage and may instead reflect long-term metabolic remodeling[5,8,16,32]. This may reflect the chronic remodeling of energy metabolism and reduced LDH-mediated lactate-pyruvate metabolic capacity[5,8,16,32,33]. This interpretation is supported by previous studies using APP/PS1 mouse models, which showed reduced energy metabolite levels, decreased brain lactate levels, and downregulated neuronal LDH expression[34–36].
Furthermore, previous studies have reported that lactate levels in human cerebrospinal fluid (CSF) are unchanged or even elevated in AD[15,17]. The discrepancy between lactate levels in CSF and the reduced LDHA and LDHB expression observed in our study underscores a critical biological distinction between intracellular enzymatic capacity within brain tissue and extracellular fluid concentration[10,15]. LDHA and LDHB expression reflect part of the endogenous enzyme pool responsible for pyruvate-lactate conversion[10,37]. In contrast, human CSF lactate concentration is a fluid biomarker that may be influenced by multiple confounding processes, including reactive glial lactate production, lactate transport dynamics, and blood-brain barrier (BBB) integrity[15,32,37,38]. In patients with AD, CSF lactate levels may be influenced by age and BBB integrity, which may partly explain why CSF lactate levels do not necessarily indicate clinical severity. Therefore, the tissue-specific downregulation of LDHA and LDHB observed in our study is not expected to cause a simple, unidirectional decrease in total CSF lactate. Instead, our findings are better understood as localized dysregulation of metabolic networks, potentially involving impaired neuronal lactate utilization, disruption of the astrocyte-neuron lactate shuttle, or reactive glial glycolytic changes[32,33,37,39].
However, it should be noted that LDH-related metabolic abnormalities are not strictly specific to AD[19,38,40]. Lactate-related metabolic alterations have also been reported in other neurodegenerative and neuroinflammatory conditions including Huntington’s disease, Parkinson’s disease, and multiple sclerosis[41–43]. The direction of these changes varies depending on the disease, tissue source, and progression stage. Therefore, serum LDH levels cannot be regarded as an AD-specific diagnostic biomarker[12]. Furthermore, we found no significant correlation between serum LDH activity and cognitive scores (MMSE or MoCA). Notably, serum LDH activity was significantly reduced in the MCI group and did not show a further progressive decrease in the AD group. This nonprogressive pattern suggests that reduced serum LDH activity may already be present around the MCI stage but may not change linearly with later cognitive decline. Although brain-specific LDH metabolism is crucial for synaptic plasticity and memory, circulating serum LDH is a composite measure derived from multiple peripheral tissues[12,32,33,39]. Consequently, it cannot directly reflect local brain activity or serve as a substitute indicator of cognitive severity. Instead, decreased serum LDH levels are better interpreted as early stage peripheral metabolic alterations associated with AD-related metabolic remodeling.
In normal brain reference data, LDHA- and LDHB-correlated genes showed partially distinct functional profiles: LDHA-associated genes were more broadly related to glycolysis, vesicle trafficking, autophagy, and proteostasis, whereas LDHB-associated genes were more concentrated in mitochondrial oxidative phosphorylation. AD-related WGCNA further showed that LDHA- and LDHB-containing modules were organized in a region-dependent manner[44]. In the hippocampus and entorhinal cortex, LDHA and LDHB were assigned to separate modules, with the hippocampal LDHA-containing module mainly enriched in synaptic vesicles and neurotransmitter-related processes, and the hippocampal LDHB-containing module mainly enriched in mitochondrial translation and oxidative phosphorylation. In the temporal and frontal cortices, LDHA and LDHB were assigned to shared modules enriched in mitochondrial respiration, synaptic vesicle-related processes, autophagy, and proteostasis-related pathways[45]. These findings suggest that LDH-related transcriptional networks may exhibit region-dependent functional organization in AD-related brain datasets.
These findings are consistent with the known enzymatic functions of LDH. LDH isoenzymes with higher LDHA content preferentially favor pyruvate-to-lactate conversion, whereas those with higher LDHB content preferentially favor lactate-to-pyruvate conversion[10,46,47]. Recent evidence indicates that lactate-derived protein lactylation can regulate autophagy-related pathways. For example, Vps34 lactylation enhances Vps34 lipid kinase activity and promotes autophagic flux and endolysosomal trafficking[48]. This mechanism provides a plausible, albeit indirect, biological link between LDHA-associated lactate metabolism and the autophagy/endolysosomal pathways observed in our co-expression analysis. The consistent enrichment of LDHB in the oxidative phosphorylation modules aligns with experimental evidence showing that LDHB-deficient neurons have reduced lactate utilization and impaired memory function[33,49–51]. However, our results were based on gene co-expression and only provide correlational evidence. This should not be interpreted as evidence that LDHA or LDHB directly regulates these pathways. Further experiments, such as protein expression analysis, isotope tracing for lactate flux, and functional interventions in animal models, are needed to confirm the exact roles of these networks in AD pathology.
This study has several limitations. In the clinical cohort, the observed decrease in serum LDH activity had a small effect size, indicating that the statistical evidence from this cohort alone is relatively weak, and may have been sensitive to minor sample variations. Furthermore, the retrospective design limited data availability for HC. Specifically, MMSE and MoCA scores were not routinely collected from this group. Several baseline clinical variables were not uniformly available, including body mass index (BMI), history of hypertension, blood pressure, and detailed medication history. In addition, we lacked information related to lifestyle and physiological factors such as physical activity, direct muscle mass measurements, and dietary intake. Consequently, residual confounding cannot be entirely ruled out. Another limitation relates to the measurement of LDH and lack of tissue specificity. We measured only the total serum LDH activity and did not profile LDH isoenzymes, limiting our ability to identify specific tissue origins. Additionally, serum and brain transcriptomic data were derived from independent cohorts rather than matched samples from the same individuals. Therefore, rather than establishing a direct individual-level association, the consistent patterns observed across these datasets should be viewed as parallel lines of evidence supporting the involvement of LDH-related metabolism in AD. Moreover, our results are primarily based on observational data. Cell-type-level analyses relied on public single-cell/single-nucleus transcriptomic resources and platform-curated annotations, rather than on in situ validation. Furthermore, due to the lack of gain- or loss-of-function experiments for LDHA and LDHB, we could not confirm whether these genes directly regulate AD pathology. Additionally, without tracking AD mouse models over time, it is difficult to determine whether reduced lactate dehydrogenase (the reduced LDH) metabolism is a cause or consequence of AD.
To address these limitations, future studies should establish a unified prospective cohort to collect paired serum and CSF samples, along with LDH isoenzyme profiling, metabolic neuroimaging, AD core biomarkers, and detailed cognitive assessments. To determine disease specificity, these studies should also include disease-control groups such as vascular dementia, dementia with Lewy bodies, frontotemporal, and Parkinson’s disease dementia. In parallel, experimental studies using AD mouse models across different disease stages should include LDHA/LDHB genetic manipulation, lactate flux measurements, and mitochondrial function assays. Finally, exploring potential upstream mechanisms, such as HIF-1α- and ATF4-related transcriptional regulation, epigenetic modifications, and protein degradation pathways, may help clarify the regulatory basis of LDH-related metabolic alterations in AD.
HTML
Participants
Laboratory Tests
AD Risk Scores Data
Bulk Brain Transcriptomic Analyses
Cell-Type-Level Expression Analyses
Co-Expression Network Construction
GO and KEGG Enrichment Analysis
Gene Set Enrichment Analysis
Protein–protein Interaction Network Analysis
AD-related WGCNA and Module Enrichment Analysis
Statistical Analysis
Clinical Characteristics and Serum LDH Activity Across Diagnostic Groups
AD Risk Scores of LDHA and LDHB
Expression of LDHA and LDHB in Brain Tissue and Brain Cells
Co-expression Gene Sets of LDHA and LDHB in the Normal Human Brain
Functional Enrichment of LDHA- and LDHB-correlated Gene Sets
Overlapping Gene Set and Integrated Network Analysis
AD-related WGCNA and Module-Level Enrichment Analysis
Competing Interests The authors report no competing interests.
Authors’ Contributions Conceptualization and Methodology: Qiao Song, Wen Li, Qiliang Li, and Peichang Wang. Clinical samples and data collection: Qiao Song, Wen Li, Yang Liu, Sigen Li, Leyang Ju, Shuo Gao, Zhichen Liao, Jingrong Cao, Yaqi Wang, Yuli Hou, Haixia Ma, Yunxiu Zhang, Diandian Chen, Wenshuo Yang, and Xiang Yang. Writing original draft and review editing: Qiao Song, Wen Li, Qiliang Li, and Peichang Wang. Supervision: Qiliang Li and Peichang Wang. Data access and verification: Qiao Song, Wen Li, and Peichang Wang. All authors had reviewed and approved the final manuscript, and accepted responsibility for the decision to submit the manuscript for publication.
Data Sharing Owing to the clinical nature of the data, the data that support the findings of this study are not freely available, but can be made available by the corresponding author upon reasonable request. A formal data-sharing agreement is required before data can be shared. The supplementary materials will be available in www.besjournal.com.
&These authors contributed equally to this work.

 Quick Links
 DownLoad: