





-
Cognitive function encompasses learning, memory, language, and executive domains, with aging remaining the predominant non-modifiable risk factor for cognitive decline worldwide[1]. Accelerated population aging has made age-related cognitive impairment and Alzheimer’s disease a major public health burden accompanied by rising medical expenditures and socioeconomic pressures[2]. Without timely intervention, subtle cognitive deterioration gradually progresses to mild cognitive impairment and irreversible dementia. However, current therapeutic strategies cannot reliably halt long-term neurodegeneration[3]. Therefore, identification of simple and accessible laboratory biomarkers for early risk screening in older adults is clinically urgent and valuable.
Most previous studies have separately explored the associations between peripheral monocytes or serum albumin and cognitive performance; however, few population-based investigations have integrated these two indicators into the monocyte-to-albumin ratio (MAR) to evaluate cognitive outcomes in the elderly[4]. This integration represents a major innovation of the present study. The MAR simultaneously reflects systemic pro-inflammatory activation and endogenous nutritional/anti-inflammatory reserves, which better align with the inflammatory-nutritional multifactorial pathogenesis of cognitive aging than conventional single inflammatory markers, such as C-reactive protein (CRP), neutrophil-to-lymphocyte ratio (NLR), and platelet-to-lymphocyte ratio (PLR)[5]. Moreover, the MAR can be easily calculated from routine blood and biochemical tests (complete blood count and serum albumin measurement), making it suitable for large-scale primary care screening in aging populations without additional costs.
This cross-sectional study was conducted using data from the National Health and Nutrition Examination Survey (NHANES) 2011–2014 database, which received ethical approval from the National Center for Health Statistics, and written informed consent was obtained from all participants[6]. After the stepwise exclusion of ineligible individuals (aged < 60 years, missing cognitive test data, missing monocyte/albumin data, or missing key covariates), a final sample of 1,234 adults aged ≥60 years was enrolled. A detailed screening flowchart is shown in Supplementary Figure S1. Cognitive function was assessed using four classic neuropsychological tests: CERAD word list learning (CERAD-WL, three learning trials, score range 0–30), CERAD delayed recall (CERAD-DR, score range 0–10), Animal Fluency Test (AFT, score range 3–39), and Digit Symbol Substitution Test (DSST, score range 0–105)[7]. Raw scores were converted into standardized z-scores (z = (x – μ)/σ) in order to eliminate dimensional heterogeneity, and the summed z-score was used to reflect global cognitive performance. The risk of cognitive dysfunction was defined according to the quartile distribution; specifically, a binary summed score >2 (i.e., performing in the lowest quartile on more than two tests) was classified as a high risk of cognitive impairment. Major covariates, including demographic characteristics (age, gender, race, education, marital status, poverty income ratio), lifestyle indicators (alcohol intake, smoking, physical activity), chronic diseases (congestive heart disease, diabetes, hypertension), body mass index (BMI), and sleep statuswere fully adjusted to minimize confounding bias. Weighted statistical methods (using NHANES-recommended survey weights), restricted cubic spline (RCS) regression, multivariable linear and logistic regression, and subgroup interaction analyses were systematically applied in order to verify the stability and specificity of the associations.
The mean age of participants was 68.85 ± 6.39 years, with males accounting for 56.01% of the total cohort. Baseline demographic and clinical characteristics across the MAR quartiles are summarized in Supplementary Table S1. Stratified analysis showed that higher MAR levels were accompanied by significant differences in gender distribution, poverty-income ratio, BMI, and the prevalence of coronary heart disease and diabetes. Notably, the CERAD-WL, CERAD-DR, DSST, and overall composite z-score all declined progressively with higher MAR, directly indicating that abnormal MAR elevation is closely correlated with multidimensional cognitive deterioration in older adults.
Table 1 presents the associations between the MAR and individual cognitive test scores using the three statistical models. Model 1 was unadjusted; Model 2 was adjusted for age, gender, and race; and Model 3 was further adjusted for all covariates listed in Table 1 (i.e., full adjustment). In the unadjusted model, continuous MAR was significantly negatively associated with verbal learning (CERAD-WL), delayed memory (CERAD-DR), processing speed (DSST), and global cognitive z-score but not with AFT. After stepwise adjustment for age, gender, race, and all potential confounders, the inverse association remained stable, particularly in the memory domain and global cognition. In the fully adjusted Model 3, participants in the highest MAR quartile exhibited significantly lower CERAD-DR scores (β = −0.57, 95% CI: −0.90 to −0.24, P < 0.05) and reduced global cognitive z-scores (β = −0.70, 95% CI: −1.11 to −0.30, P < 0.05) when compared with the lowest quartile, suggesting that elevated MAR predominantly impairs memory and overall cognitive function in older adults. Notably, a trend toward significance was also observed for the DSST, but it did not reach the threshold in the fully adjusted model.
Cognitive function β (95% CI) Model 1 Model 2 Model 3 CERAD W-L score MAR (continuous) –0.23 (–0.44, –0.01)* −0.08 (−0.27, 0.12) −0.02 (−0.21, 0.18) MAR group Quartile 1 Reference Reference Reference Quartile 2 −1.04 (−1.71, −0.38)* −0.75 (−1.37, −0.13)* −0.58 (−1.20, 0.03) Quartile 3 −0.68 (−1.33, −0.02)* −0.13 (−0.75, 0.48) 0.11 (−0.50, 0.71) Quartile 4 −1.85 (−2.52, −1.18)* −1.12 (−1.75, −0.48)* −0.83 (−1.46, −0.19)* P for trend < 0.0001 0.0086 0.0984 CERAD D-R score MAR (continuous) −0.18 (−0.28, −0.07)* −0.11 (−0.21, −0.01)* −0.10 (−0.20, 0.01) MAR group Quartile 1 Reference Reference Reference Quartile 2 −0.45 (−0.78, −0.11)* −0.31 (−0.62, 0.01) −0.29 (−0.61, 0.03) Quartile 3 −0.44 (−0.77, −0.11)* −0.21 (−0.52, 0.10) −0.16 (−0.47, 0.15) Quartile 4 −0.98 (−1.31, −0.64)* −0.65 (−0.97, −0.33)* −0.57 (−0.90, −0.24)* P for trend < 0.0001 0.0004 0.0032 AFT score MAR (continuous) −0.07 (−0.34, 0.20) −0.08 (−0.34, 0.18) −0.02 (−0.27, 0.22) MAR group Quartile 1 Reference Reference Reference Quartile 2 0.02 (−0.82, 0.87) 0.14 (−0.66, 0.94) 0.43 (−0.35, 1.21) Quartile 3 0.36 (−0.47, 1.19) 0.51 (−0.28, 1.30) 0.82 (0.06, 1.59)* Quartile 4 −1.04 (−1.89, −0.19)* −0.78 (−1.60, 0.04) −0.19 (−0.99, 0.61) P for trend 0.0468 0.1443 0.9332 DSST score MAR (continuous) −1.34 (−2.14, −0.53)* −0.92 (−1.63, −0.21)* −0.60 (−1.22, 0.03) MAR group Quartile 1 Reference Reference Reference Quartile 2 −2.17 (−4.71, 0.37) −1.19 (−3.43, 1.04) −0.09 (−2.07, 1.89) Quartile 3 −4.49 (−6.99, −2.00)* −2.88 (−5.09, −0.66)* −1.48 (−3.42, 0.46) Quartile 4 −6.83 (−9.37, −4.30)* −4.48 (−6.76, −2.20)* −1.88 (−3.92, 0.15) P for trend <0.0001 <0.0001 0.6434 Total z-score MAR (continuous) −0.22 (−0.37, −0.07)* −0.14 (−0.27, −0.01)* −0.09 (−0.22, 0.03) MAR group Quartile 1 Reference Reference Reference Quartile 2 −0.57 (−1.04, −0.09)* −0.36 (−0.77, 0.06) −0.22 (−0.62, 0.17) Quartile 3 −0.55 (−1.02, −0.09)* −0.20 (−0.61, 0.21) −0.03 (−0.42, 0.36) Quartile 4 −1.46 (−1.93, −0.98)* −0.96 (−1.38, −0.53)* −0.70 (−1.11, −0.30)* P for trend <0.0001 0.0001 0.0054 Note. Model 1 was unadjusted. Model 2 included adjustments for age, gender, and race. Model 3 was further adjusted for all of the covariates listed in Table 1. CERAD-WL, Consortium to Establish a Registry for Alzheimer’s Disease word learning; DSST, digit symbol substitution test; AFT, animal fluency test; CERAD-DR, Consortium to Establish a Registry for Alzheimer’s Disease delayed recall; CI, confidence interval; MAR, monocyte-to-albumin ratio. *P < 0.05. Table 1. Association between the MAR and cognitive function scores.
Mechanistically, increased monocyte count reflects persistent systemic chronic inflammation, which accelerates cerebral amyloid-β deposition, neuroinflammation, and neuronal damage[8]. Chronic low-grade inflammation is known to impair synaptic plasticity and promote blood-brain barrier disruption, both of which are critical in the pathogenesis of Alzheimer’s disease. As a critical nutritional and anti-inflammatory biomarker, albumin maintains blood–brain barrier integrity, exerts antioxidant effects, and alleviates neurotoxic injury; hypoalbuminemia further weakens the endogenous neuroprotective capacity[9]. Low albumin levels are also associated with frailty and malnutrition, which are common in older adults, and they independently predict cognitive decline. As a composite index, the MAR precisely captures the dual pathological state of “excessive inflammation plus insufficient nutritional/anti-inflammatory reserve,” which explains why MAR outperforms single indicators in reflecting cognitive impairment risk[10].
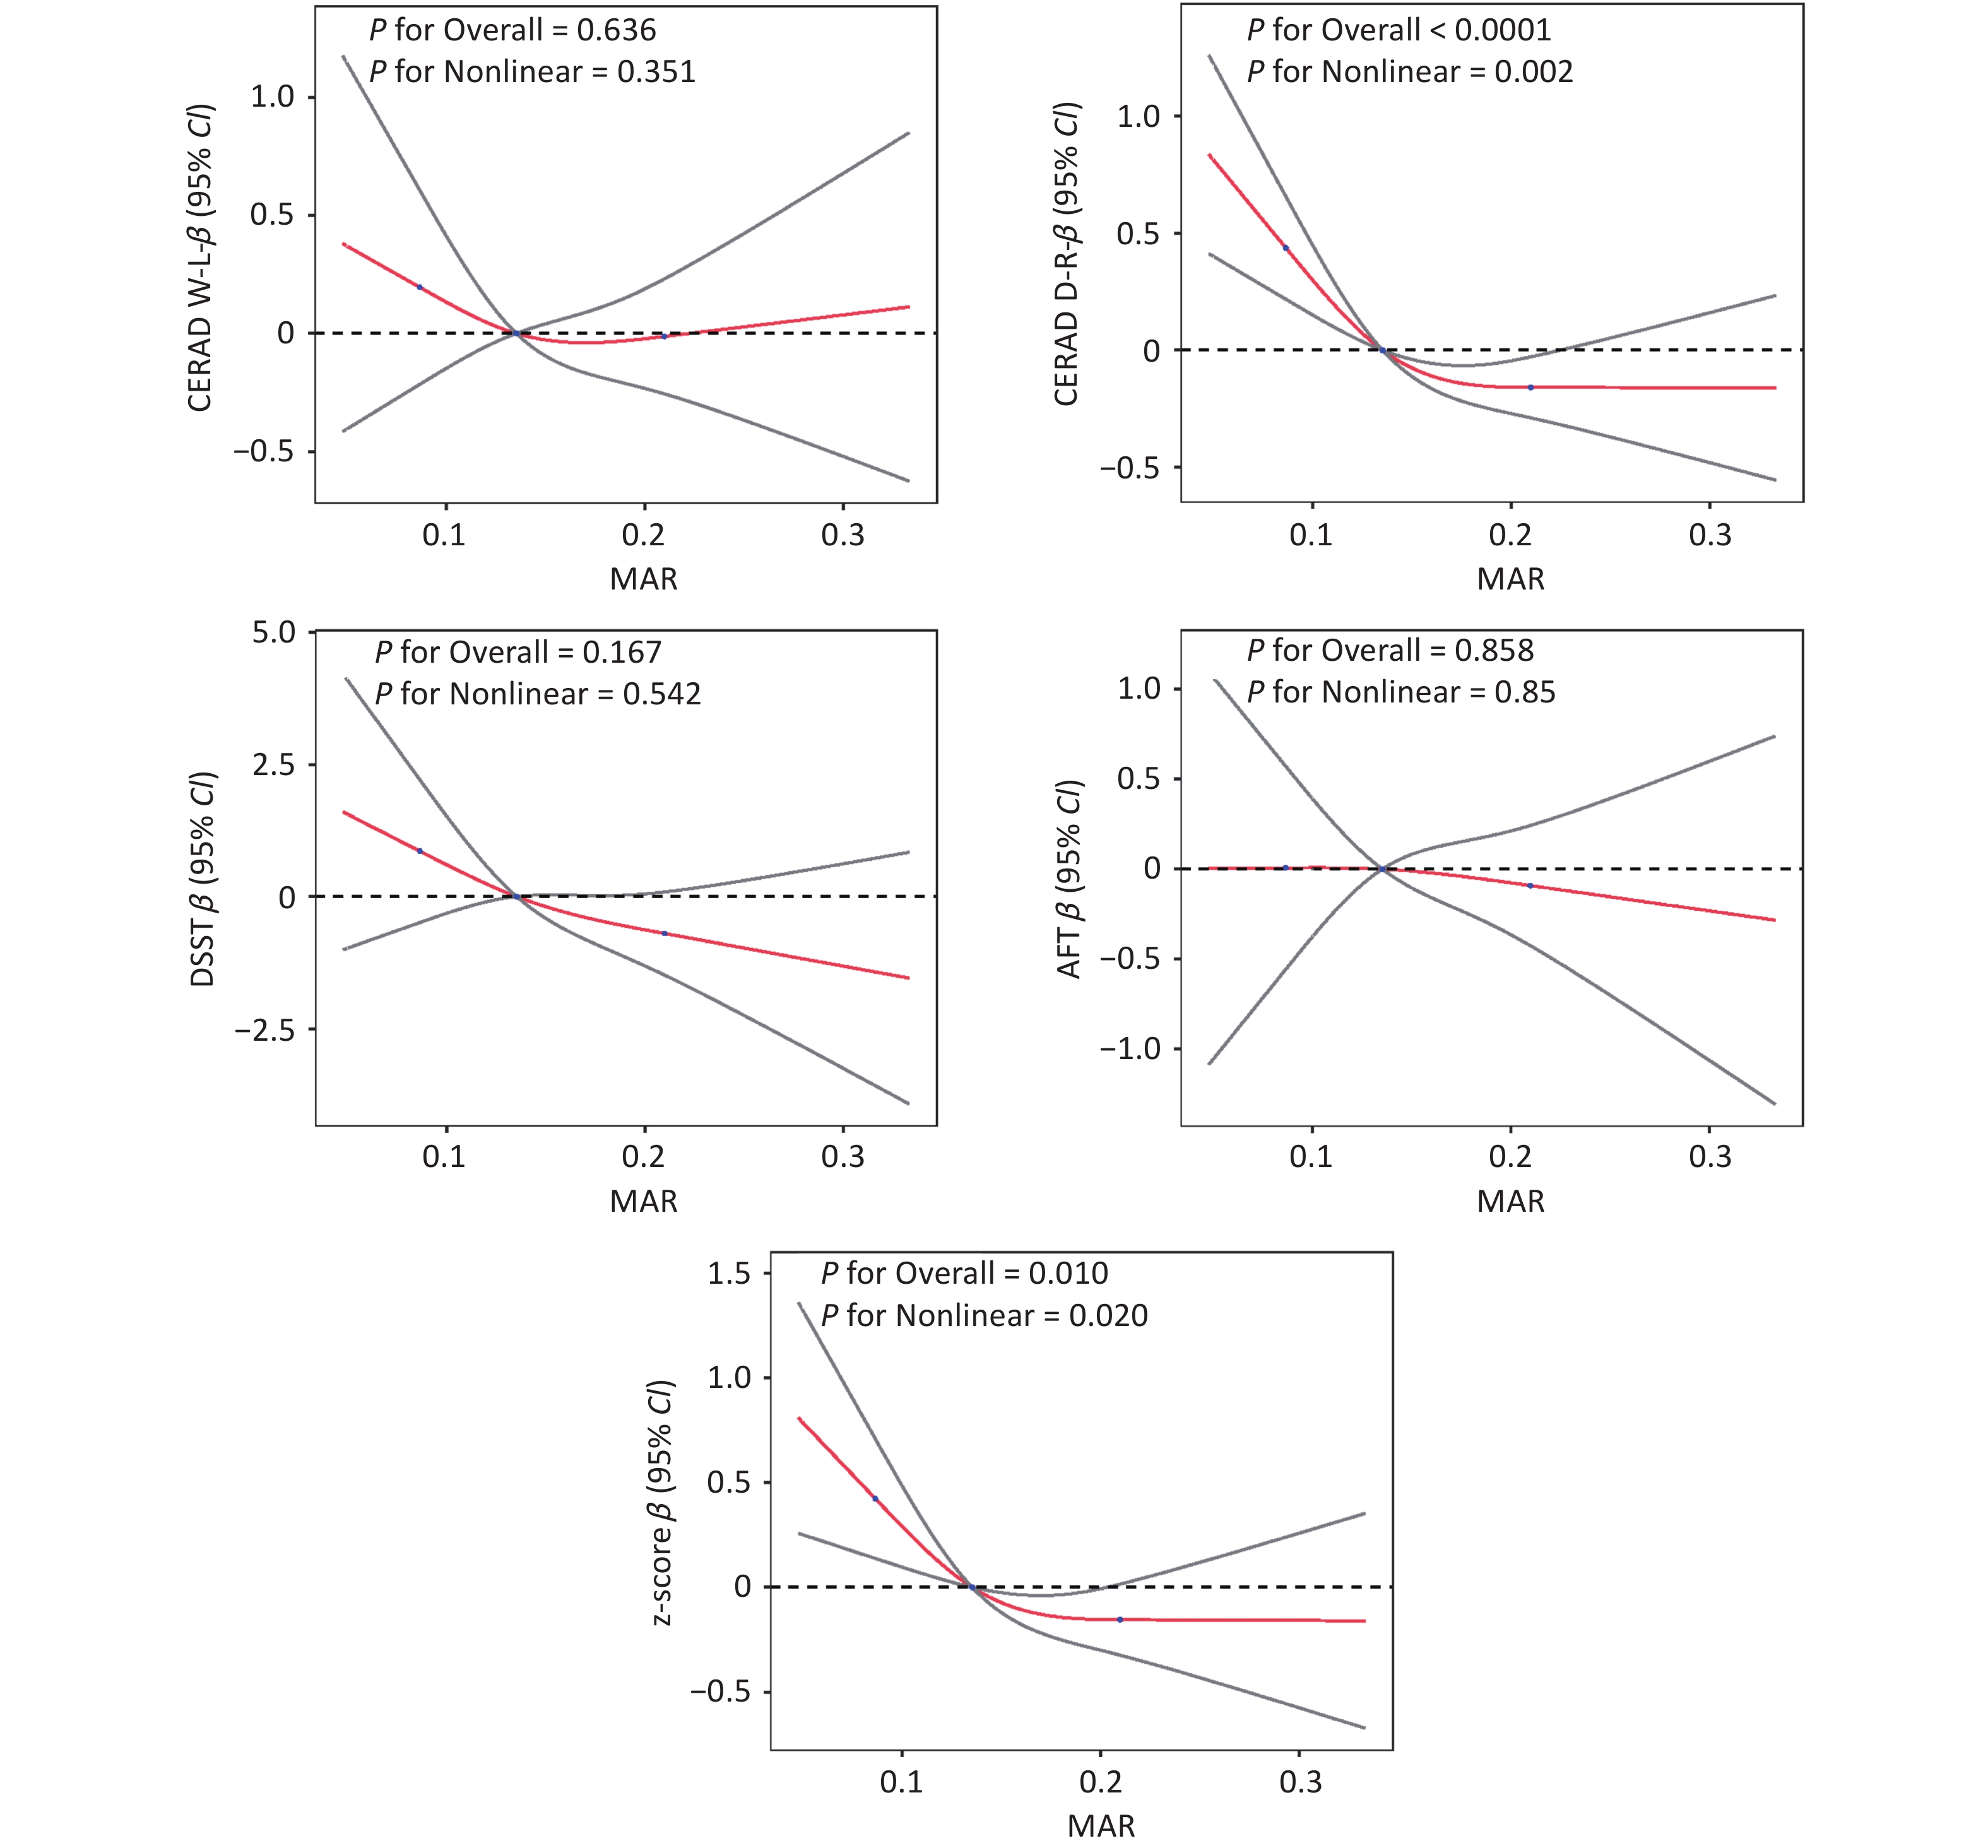
Figure 1 shows the RCS fitting curves of MAR for each cognitive indicator. The results confirmed significant nonlinear dose-response relationships between MAR and CERAD-DR and between MAR and the global z-score (nonlinear P = 0.002 and P = 0.020, respectively). As MAR rose, cognitive performance declined progressively in a gradient pattern rather than in a simple threshold pattern. This finding suggests that the adverse effect of elevated MAR on cognition displayed cumulative incremental features. Such a continuous trend further supports a consistent biological gradient association instead of a random correlation, which underscores the potential utility of MAR as a continuous quantitative marker for cognitive risk stratification.
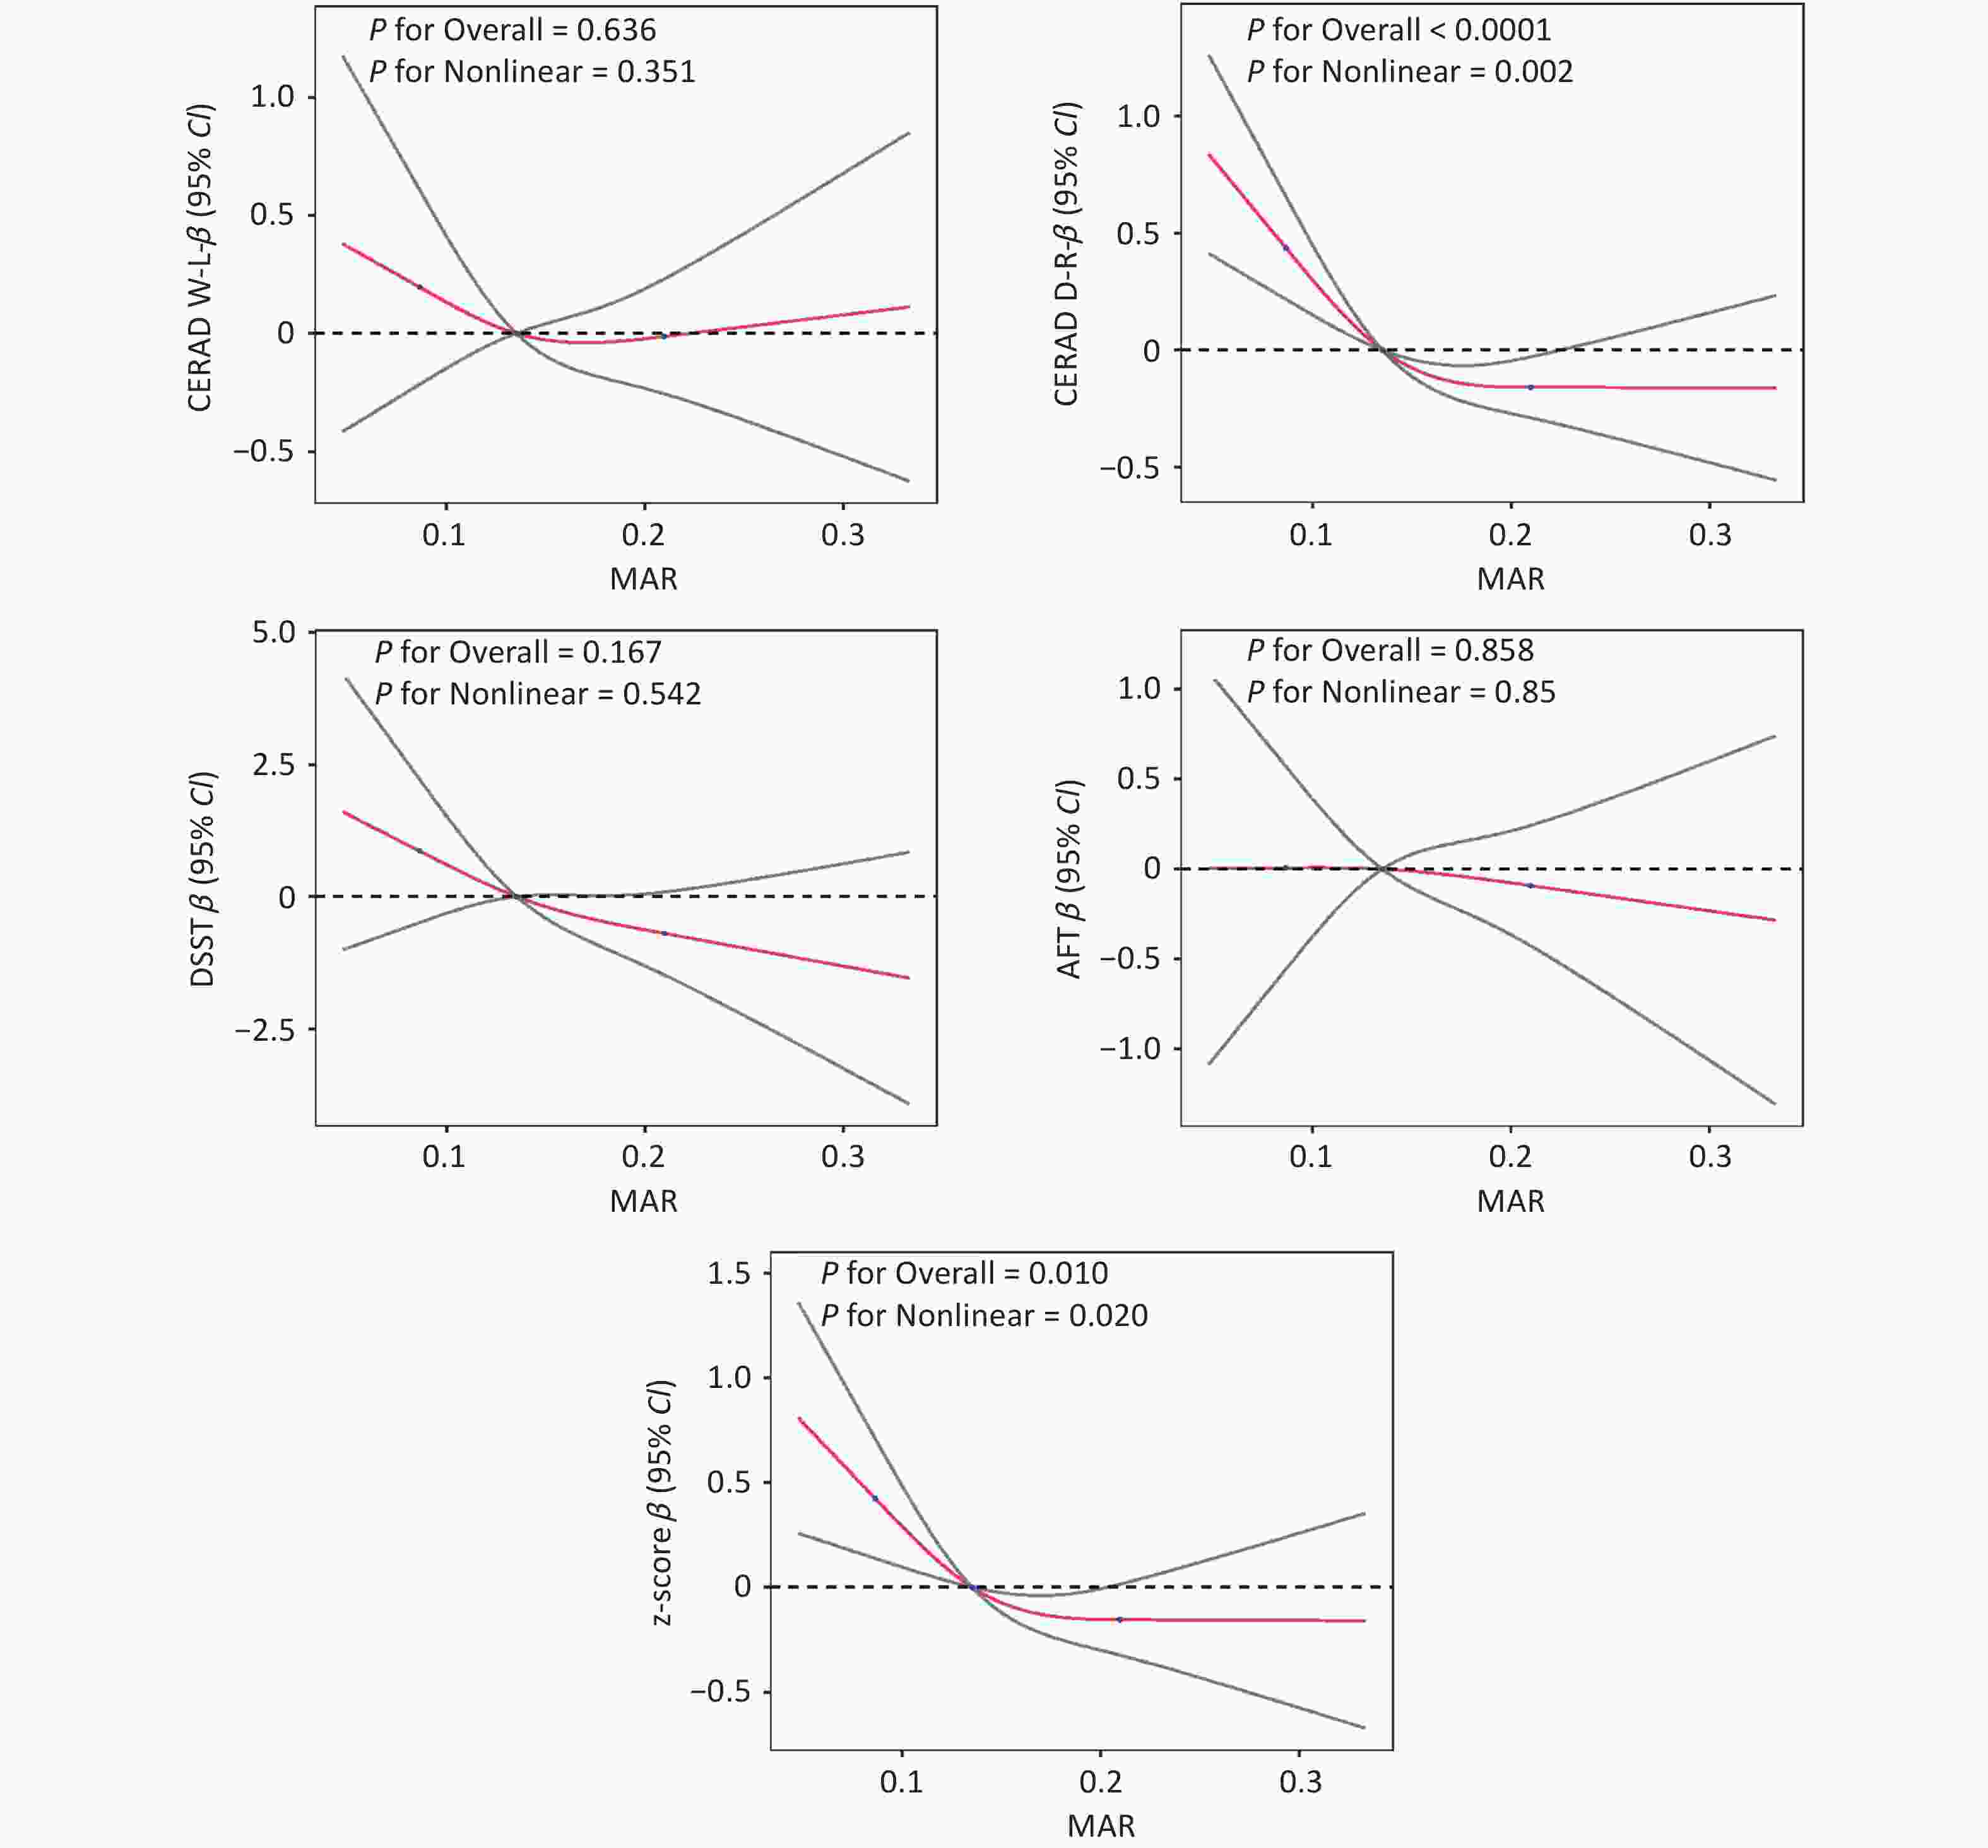
Figure 1. The restricted cubic splines for the associations between MAR and cognitive function scores. CERAD-WL, Consortium to Establish a Registry for Alzheimer’s Disease word learning; DSST, digit symbol substitution test; AFT, animal fluency test; CERAD-DR, Consortium to Establish a Registry for Alzheimer’s Disease delayed recall.
Table 2 summarizes the logistic regression results for the MAR and high risk of cognitive dysfunction. Among all of the participants, 154 were categorized into the high-risk group and 1,080 into the low-risk group. The MAR quartile was positively correlated with high cognitive impairment risk, with a significant trend P value (P for trend = 0.0403). After full adjustment for confounders, the individuals in the highest MAR quartile had a 2.18-fold higher risk of cognitive dysfunction than those in the lowest quartile (OR = 2.18, 95% CI: 1.08–4.40, P < 0.05), confirming that an elevated MAR acts as an independent risk factor for cognitive decline in older adults. The nonlinear curve trend between MAR and cognitive impairment risk is shown in Supplementary Figure S2.
Items OR (95% CI) Model 1 Model 2 Model 3 MAR (continuous) 1.07 (0.94, 1.23) 1.10 (0.93, 1.29) 1.10 (0.87, 1.38) MAR group Quartile 1 Reference Reference Reference Quartile 2 1.77 (0.93, 3.40) 1.28 (0.78, 2.11) 1.33 (0.67, 2.64) Quartile 3 1.89 (1.09, 3.28)* 1.61 (0.82, 3.14) 1.57 (0.66, 3.75) Quartile 4 2.08 (1.08, 3.99)* 2.15 (1.22, 3.80)* 2.18 (1.08, 4.40)* P for trend 0.0039 0.0065 0.0403 Note. Model 1 was unadjusted. Model 2 included adjustments for age, gender, and race. Model 3 was further adjusted for all of the covariates listed in Table 1. CI, confidence interval; MAR, monocyte to albumin ratio. *P < 0.05. Table 2. Association between the MAR and a high risk of cognitive dysfunction.
Subgroup-stratified analyses based on gender, age, education, BMI, chronic diseases, and lifestyle are shown in Supplementary Figure S3. Only age showed a significant interaction effect (P for interaction = 0.006), with the association being markedly stronger in the 70–80-year-old subgroup. This novel finding has important clinical implications: adults aged 70–80 years commonly experience immunosenescence, decreased nutritional reserve, and reduced cognitive compensation capacity, rendering the aging brain more vulnerable to superimposed inflammatory and nutritional insults[8]. Thus, clinical screening should be prioritized for individuals over 70 years of age to achieve precise high-risk identification. In contrast, the association remained stable across other subgroups without significant effect modification (all P >0.05), further confirming the generalizability of the MAR-cognition link and its independence from most individual characteristics.
When compared with conventional inflammatory biomarkers such as CRP, NLR, and PLR, the primary innovation of MAR in this study lies in overcoming the limitation of a single inflammatory dimension by integrating both inflammatory and nutritional pathological information[5], which better fits the multifactorial nature of cognitive aging. For example, CRP levels are easily elevated by acute infections or chronic conditions, leading to poor specificity. NLR and PLR mainly reflect immune cell balance but do not capture nutritional status. In contrast, MAR combines two clinically relevant parameters (monocyte count and albumin level) that are routinely measured, inexpensive, and highly reproducible. Based on a large nationally representative sample, this study has systematically demonstrated the independent association, dose-response pattern, and age-specific effects of MAR on cognitive function, providing a new direction for screening biomarkers of cognitive decline. The MAR is derived from routine laboratory tests without additional medical costs, enabling convenient widespread use and large-scale cognitive risk screening in primary healthcare settings.
This study adopted a cross-sectional design that could not fully establish strict causal temporality. Although extensive covariates were adjusted, potential residual confounding from genetic background (e.g., APOE ε4 status) and other unmeasured factors (e.g., subclinical vascular disease, detailed medication use) could not be completely excluded, and the conclusions require further verification in multi-ethnic prospective cohorts. Additionally, the study population was drawn from the United States; therefore, the generalizability to other ethnic and geographic populations requires confirmation.
In conclusion, an elevated MAR is independently correlated with reduced memory and global cognitive function in adults aged over 60 years, particularly in those aged 70–80 years. As a simple, cost-effective, and comprehensive inflammatory-nutritional biomarker, MAR exhibits promising application prospects for the early screening and risk stratification of cognitive decline, offering new laboratory evidence for the early prevention and intervention of age-related cognitive impairment.
HTML
Competing Interests The authors declare no competing interests.
Ethics This study was conducted according to the guidelines laid down in the Declaration of Helsinki, and all procedures involving research study participants were approved by the institutional review board of the National Center for Health Statistics (NCHS). Written informed consent was obtained from all participants/patients.
Authors' Contributions Topic Design and Article Writing: Congcong Liu, Data Processing: Haixia Ma, Project Guidance: Peichang Wang. All the authors jointly wrote the manuscript and approved the final version.
Data Sharing The supplementary materials will be available in www.besjournal.com.
Reference

 Quick Links
 DownLoad: