
-
The global population is aging at an unprecedented pace. By 2050, the number of people aged 60 years or older is expected to double, reaching approximately 2.1 billion, with the most rapid increases occurring in low- and middle-income countries[1]. This demographic shift has led to a marked rise in the prevalence of age-related neurological disorders, particularly cognitive impairment and dementia, which now pose substantial challenges to healthcare systems, economies, and social support structures worldwide[2,3]. Cognitive impairment, often considered an intermediate clinical state between normal aging and dementia, is characterized by objective deficits in one or more cognitive domains while functional abilities are largely preserved. Notably, individuals with mild cognitive impairment have a two-year progression rate to dementia of approximately 15%, highlighting a critical window for intervention[4,5]. Given the absence of curative treatments for most dementias, identifying modifiable risk factors are essential for designing effective and feasible prevention strategies. Environmental pollution, particularly exposure to environmental metals, is increasingly recognized as a potential contributing factor to neurocognitive disorders[6-8]. Chronic exposure to neurotoxic metals, including lead, mercury and arsenic, has been linked to cognitive decline and dementia through mechanisms such as oxidative stress, neuroinflammation, and mitochondrial dysfunction[9,10].
Manganese (Mn) is both a necessary trace element and a neurotoxic environmental pollutant. Its widespread industrial use leads to accumulation in ecosystems, thereby constituting a health hazard for humans[11]. Mn in the environment arises from natural sources (rock weathering and volcanic activity) and human activities, such as mining, steel manufacturing, and agricultural fungicide use[12]. In recent years, Mn-based materials such as lithium nickel cobalt Mn oxide (NCM) and lithium Mn iron phosphate (LMFP) have been widely adopted as key cathodes for new energy vehicle batteries, substantially increasing the scale of Mn mining, processing, and recycling. Environmental exposure to Mn in the battery supply chain has therefore become an emerging public health concern[13].
Chronic excessive exposure to Mn is well-known for its neurotoxic effects, primarily manifested as manganism, a neurological disorder that resembles Parkinson's disease[14]. The neurotoxic mechanism of Mn involves triggering oxidative stress, impairing mitochondrial function, and damaging dopaminergic neurons[15]. However, it is less clear how low-level Mn exposure affects cognitive function in the broader older adult population. The epidemiological literature on Mn exposure and cognitive outcomes is equivocal, with certain studies suggesting detrimental effects, whereas others have observed null associations[16-20]. Furthermore, most existing studies have been cross-sectional, limiting the ability to establish temporal relationships. In this population-based cohort study, we aimed to evaluate the association between Mn exposure and cognitive impairment in older adults, and to delineate the dose-response pattern underlying this relationship.
-
This research involved individuals aged 60 or above recruited from two cohort studies: the Healthy Ageing and Biomarkers Cohort Study (HABCS, spanning 2017–2024) and the China National Human Biomonitoring program (CNHBM, covering 2017–2024). Comprehensive details regarding the design, methodology, and participant profiles of these cohorts have been reported elsewhere[21,22]. Systematic evaluation of cognitive performance was performed using the MMSE, an extensively established tool. All individuals received physical examinations involving blood sample collection and standardized questionnaires that gathered data on sociodemographic, lifestyle, and clinical information at baseline. The final analysis comprised 6,868 participants after the exclusion of 930 individuals lacking blood Mn measurement, 1,160 who were unable to be followed, and 2,380 who had cognitive impairment at baseline (Supplementary Figure S1). The baseline characteristics of participants included in the final analysis and those excluded due to loss to follow-up were largely comparable (Supplementary Table S1). The National Institute of Environmental Health, Chinese Center for Disease Control and Prevention approved the study protocol ethically (approval no. 201701 and 201922). All individuals or their legal representatives signed written informed consent before participating.
-
Morning fasting blood samples were obtained by trained clinical staff and then stored at 4°C before being analyzed within 2 hours. An aliquot of 1 mL heparin-anticoagulated blood was collected for metal element analysis. A total of 0.5 mL blood sample was digested in 0.1% nitric acid solution supplemented with 0.01% Triton X-100, and the concentration of Mn was determined by inductively coupled plasma mass spectrometry (ICP-MS) (PerkinElmer NexI ON350, Turku, Finland)[23]. To conduct internal quality assurance and control, blank samples and internal quality control samples from reference materials (Seronorm™ Trace Elements Blood L-2, SPEX, USA) were simultaneously analyzed for every 30 unknown samples. The recovery rate of the added standard was between 90% and 100%, and the relative standard deviation (RSD) of metals in the blood was controlled within 10%, indicating that the detection method based on ICP-MS has good accuracy. We established the limit of detection (LOD) at 0.5 µg/L. Concentrations falling below this threshold were assigned as a value of $ \text{LOD}/\sqrt{2} $ for subsequent statistical analyses, following standard methodological protocols[24,25]. The quality control results for Mn concentration measurement are presented in Supplementary Table S2.
-
At enrollment and during each subsequent follow-up appointment, cognitive performance was assessed with a culturally adapted Chinese MMSE in line with standard protocols[26]. The 24 items of the MMSE targeted six cognitive dimensions including language, orientation, recall ability, attention (with calculation), visual construction and naming[26], see Supplementary Table S3. A score of zero was assigned to incorrect or missing responses, while each correct answer earned one point, yielding a top possible score of 30[27]. Using education-stratified MMSE cut-off criteria, participants were categorized as cognitively impaired if their scores were less than 18 (no formal education), 20 (1–6 years of schooling), or 24 (≥ 6 years of education), respectively[26]. In addition, cognitive decline was defined as a decrease of ≥ 3 points from the baseline MMSE score during follow-up.
-
Baseline data collection encompassed sociodemographic, behavioral, and clinical variables. Gender, age, ethnicity (Han vs. minority), education (unschooled vs. schooled), Whether the participant was married or not, residence (urban vs. rural), smoking status, and drinking status use standardized questionnaires. Economic status was evaluated through a self-reported question in which participants compared their economic level with that of local residents and were categorized into three groups: rich, average, and poor. A food frequency questionnaire assessed past year’s dietary habits, including fish, meat, and fruit intake. Body mass index (BMI) was derived from measured height and weight, after which participants were classified according to the following scheme: those with a BMI below 18.5 were considered underweight; those falling between 18.5 and 24 were assigned to the normal weight; individuals with values greater than 24 but less than 28 were classified as overweight; and those with a BMI reaching or surpassing 28 met obesity. Hypertension was systolic and diastolic arterial pressure ≥ 140/90 mmHg, or a previous diagnosis accompanied by antihypertensive medication use. Chronic kidney disease (CKD) was defined as an estimated glomerular filtration rate (eGFR) below 60 mL/min/1.73 m2 by the CKD Epidemiology Collaboration equation[28]. According to the 2016 Chinese guideline on adult disease prevention and treatment, dyslipidemia was identified by the presence of any of the following: total cholesterol of 6.2 mmol/L or greater, low-density lipoprotein cholesterol (LDL-C) of 4.1 mmol/L or higher, high-density lipoprotein cholesterol (HDL-C) below 1.0 mmol/L, or triglycerides reaching or exceeding 2.3 mmol/L. Type 2 diabetes (T2D) was defined by a fasting glucose measurement that reached the threshold of 7 mmol/L or above or the presence of either a previously recorded diagnosis[22]. Multiple imputation via the mice package in R was employed to handle missing covariate values[29].
-
Normally distributed continuous variables were presented as mean ± standard deviation (SD), while non-normally distributed variables were presented as median with interquartile range (IQR). For intergroup comparisons, Student's t-test was used for normally distributed data and the Mann–Whitney U test for non-normally distributed data. Categorical variables were summarized as counts and percentages, with between-group differences assessed via the chi-square test. The effect of Mn exposure on MMSE and six cognitive domains was explored by linear mixed-effects models. The prospective association between baseline blood Mn and risk of cognitive impairment and cognitive decline were assessed using Cox proportional hazards models and no evidence of proportional hazards assumption violations were detected. A stepwise Cox regression approach was used. The initial model (Model 1) accounted for gender and age. Subsequent models sequentially added sociodemographic factors (Model 2), dietary and lifestyle variables (Model 3), and disease history including BMI, CKD, T2D, hypertension, and dyslipidemia (Model 4)[30]. Considering geographic variations in environmental pollutant concentrations and inter-cohort heterogeneity, area and cohort were incorporated as covariates in all statistical models[31]. Mn concentrations were examined both continuously and as quartiles. The RCS model was used to flexibly assess the dose-response association between blood Mn levels and cognitive impairment without imposing a strict linear assumption, thereby allowing us to examine whether the exposure–outcome relationship was linear or non-linear across the observed range of Mn concentrations[32]. To examine potential effect modification, we conducted subgroup analyses testing interactions between blood Mn levels and the following covariates: gender, age group, BMI, educational level, smoking and drinking status, dietary intakes (vegetables, fruits, and meat), and comorbidities including T2D, CKD, hypertension, and dyslipidemia. To account for the potential influence of extreme values of blood Mn concentrations and the fact that lead and mercury are known neurotoxicants that may confound the results[33,34], several sensitivity analyses were undertaken: (1) removing individuals with Mn levels above the 99th percentile; (2) removing individuals with Mn levels < LOD; (3) further controlling for blood lead and mercury concentrations; (4) employing a competing risk regression model, with all-cause mortality as the competing event and cognitive impairment as the primary event of interest, using the Fine and Gray sub distribution hazard approach. All data processing and modeling were conducted by R software, version 4.3.0. Statistical significance was defined as a two-tailed α threshold below 0.05.
-
Table 1 presents Mn concentrations across the overall study sample and main subgroups. The mean blood Mn concentration across all participants was 11.297 ± 3.763 μg/L. Blood Mn levels were slightly higher in females and increased with age (Supplementary Table S4). Table 2 summarizes the baseline characteristics of participants, stratified by cognitive impairment status. A total of 6,868 participants were included in this study, among whom 1,138 were in the cognitive impairment group and 5,730 were in the non-cognitive impairment group. Compared with participants without cognitive impairment, those with cognitive impairment had significantly lower MMSE scores (P < 0.001) and slightly higher blood Mn levels, although the latter difference was not statistically significant (P = 0.760). In terms of demographic and sociological characteristics, participants with cognitive impairment were more often characterized by female, urban residence, non-Han ethnicity, illiteracy, unmarried status, and lower economic level compared with those without cognitive impairment (all P < 0.05). Regarding lifestyle and dietary habits, the cognitive impaired group were more likely to have no alcohol consumption, no vegetable intake, and no fruit intake (all P < 0.05), whereas no significant differences were observed for smoking or meat consumption (P > 0.05). With respect to health status, the cognitive impairment group had higher proportions of underweight and normal weight, while the proportions of overweight and obesity were lower. There were no significant differences in the prevalence of hypertension, diabetes, or dyslipidemia between the two groups (P > 0.05), but the prevalence of chronic kidney disease was significantly higher in the impaired group (P < 0.05).
Subgroup N Detection
rate (%)Geometric mean (95% CI) Mean ± SD P25 P50 P75 P95 Total 6,868 99.8 10.701 (10.613–10.79) 11.297 ± 3.763 8.741 10.81 13.388 18.424 Female 3,440 99.8 11.136 (11.014–11.259) 11.694 ± 3.75 9.088 11.213 13.770 18.620 Male 3,428 99.8 10.282 (10.158–10.408) 10.898 ± 3.735 8.400 10.379 12.961 17.892 60–70 year 2,378 99.8 10.328 (10.179–10.48) 10.95 ± 3.738 8.400 10.529 12.970 17.756 70–80 year 2,026 99.8 10.615 (10.458–10.775) 11.186 ± 3.664 8.664 10.673 13.279 18.319 ≥ 80 year 2,464 99.7 11.148 (11.001–11.298) 11.723 ± 3.828 9.067 11.200 13.865 18.911 Note. Data are presented as number of participants (N), detection rate (%), geometric mean (95% CI), mean ± SD and percentiles (P25, P50 [median], P75, P95). Detection rate is the percentage of measurements above the assay’s limit of quantification (LOQ). Age groups are defined as 60–70 years, 70–80 years, and ≥ 80 years. Mn, manganese; CI, confidence interval; P, percentile; SD, standard deviation. Table 1. Distribution of blood manganese concentrations by gender and age groups
Characteristic Overall No cognitive impairment Cognitive impairment P value Participants, n 6,868 5,730 1,138 Follow-up time, years 4.00 ± 1.76 3.96 ± 1.83 4.19 ± 1.30 < 0.001 Age, years 76.39 ± 11.61 76.34 ± 11.35 76.67 ± 12.85 0.380 Blood Mn (μg/L) 11.30 ± 3.76 11.29 ± 3.75 11.33 ± 3.84 0.760 Blood Hg (μg/L) 1.23 (0.54–2.31) 1.26 (0.57–2.35) 1.06 (0.36–2.11) < 0.001 Blood Pb (μg/L) 24.45 (16.66–37.03) 24.32 (16.51–36.81) 25.25 (17.10–38.73) 0.014 MMSE 28.00 (25.00, 30.00) 28.00 (26.00, 30.00) 27.00 (24.00, 29.00) < 0.001 Sex, n (%) 0.004 Female 3,440 (50.09) 2,825 (49.30) 615 (54.04) Male 3,428 (49.91) 2,905 (50.70) 523 (45.96) Residence, n (%) < 0.001 Urban 1,462 (21.29) 1,159 (20.23) 303 (26.63) Rural 5,406 (78.71) 4,571 (79.77) 835 (73.37) Ethnicity, n (%) < 0.001 Other 394 (5.74) 293 (5.11) 101 (8.88) Han 6,474 (94.26) 5,437 (94.89) 1,037 (91.12) Education level, n (%) < 0.001 Illiteracy 2,623 (38.19) 2,130 (37.17) 493 (43.32) Educated 4,245 (61.81) 3,600 (62.83) 645 (56.68) Marital status, n (%) 0.015 Unmarried 2,372 (34.54) 1943 (33.91) 429 (37.70) Married 4,496 (65.46) 3787 (66.09) 709 (62.30) Economic level, n (%) < 0.001 Poor 946 (13.77) 732 (12.77) 214 (18.80) Average 4,398 (64.04) 3,733 (65.15) 665 (58.44) Rich 1,524 (22.19) 1,265 (22.08) 259 (22.76) Body mass index, n (%) 0.013 Underweight (< 18.5 kg/m²) 536 (7.80) 443 (7.73) 93 (8.17) Normal (18.5-23.9 kg/m²) 3,279 (47.74) 2,690 (46.95) 589 (51.76) Overweight (24.0-27.9 kg/m²) 2,136 (31.10) 1,816 (31.69) 320 (28.12) Obesity (≥ 28.0 kg/m²) 917 (13.35) 781 (13.63) 136 (11.95) Smoking status, n (%) 0.651 No 5,315 (77.39) 4,428 (77.28) 887 (77.94) Yes 1,553 (22.61) 1,302 (22.72) 251 (22.06) Alcohol consumption, n (%) 0.021 No 5,114 (74.46) 4,235 (73.91) 879 (77.24) Yes 1,754 (25.54) 1,495 (26.09) 259 (22.76) Hypertension, n (%) 0.138 No 1,996 (29.06) 1,644 (28.69) 352 (30.93) Yes 4,872 (70.94) 4,086 (71.31) 786 (69.07) Diabetes, n (%) 0.931 No 5,676 (82.64) 4,734 (82.62) 942 (82.78) Yes 1,192 (17.36) 996 (17.38) 196 (17.22) Dyslipidemia, n (%) 0.064 No 4,666 (67.94) 3,897 (68.01) 769 (67.57) Yes 2,202 (32.06) 1,833 (31.99) 369 (32.43) Chronic kidney disease, n (%) < 0.001 No 5,490 (79.94) 4,625 (80.72) 865 (76.01) Yes 1,378 (20.06) 1,105 (19.28) 273 (23.99) Meat consumption, n (%) 0.459 No 475 (6.92) 390 (6.81) 85 (7.47) Yes 6,393 (93.08) 5,340 (93.19) 1,053 (92.53) Vegetable consumption, n (%) 0.003 No 181 (2.64) 136 (2.37) 45 (3.95) Yes 6,687 (97.36) 5,594 (97.63) 1,093 (96.05) Fruit consumption, n (%) 0.015 No 1,714 (24.96) 1,397 (24.38) 317 (27.86) Yes 5,154 (75.04) 4,333 (75.62) 821 (72.14) Note. Continuous variables are presented as mean ± standard deviation (SD) or median (interquartile range [IQR]), as appropriate; categorical variables are presented as number of participants (n) and percentage (%). Mn, manganese; Hg, mercury; Pb, lead; MMSE, Mini-Mental State Examination; SD, standard deviation; IQR, interquartile range; n, number of participants; P, probability value. Table 2. Basic characteristics of the enrolled participants in the study
-
For specific cognitive domains, higher blood Mn levels (per IQR increase) were significantly associated with greater declines in MMSE total score (Model 4: β = −0.033, 95% confidence interval [CI]: −0.048, −0.018) and in multiple domain-specific scores, including orientation, attention and calculation, language, naming, and recall, with the strongest associations observed for naming (β = −0.043, 95% CI: −0.070, −0.015) and recall (β = −0.047, 95% CI: −0.064, −0.030) (Supplementary Table S5).
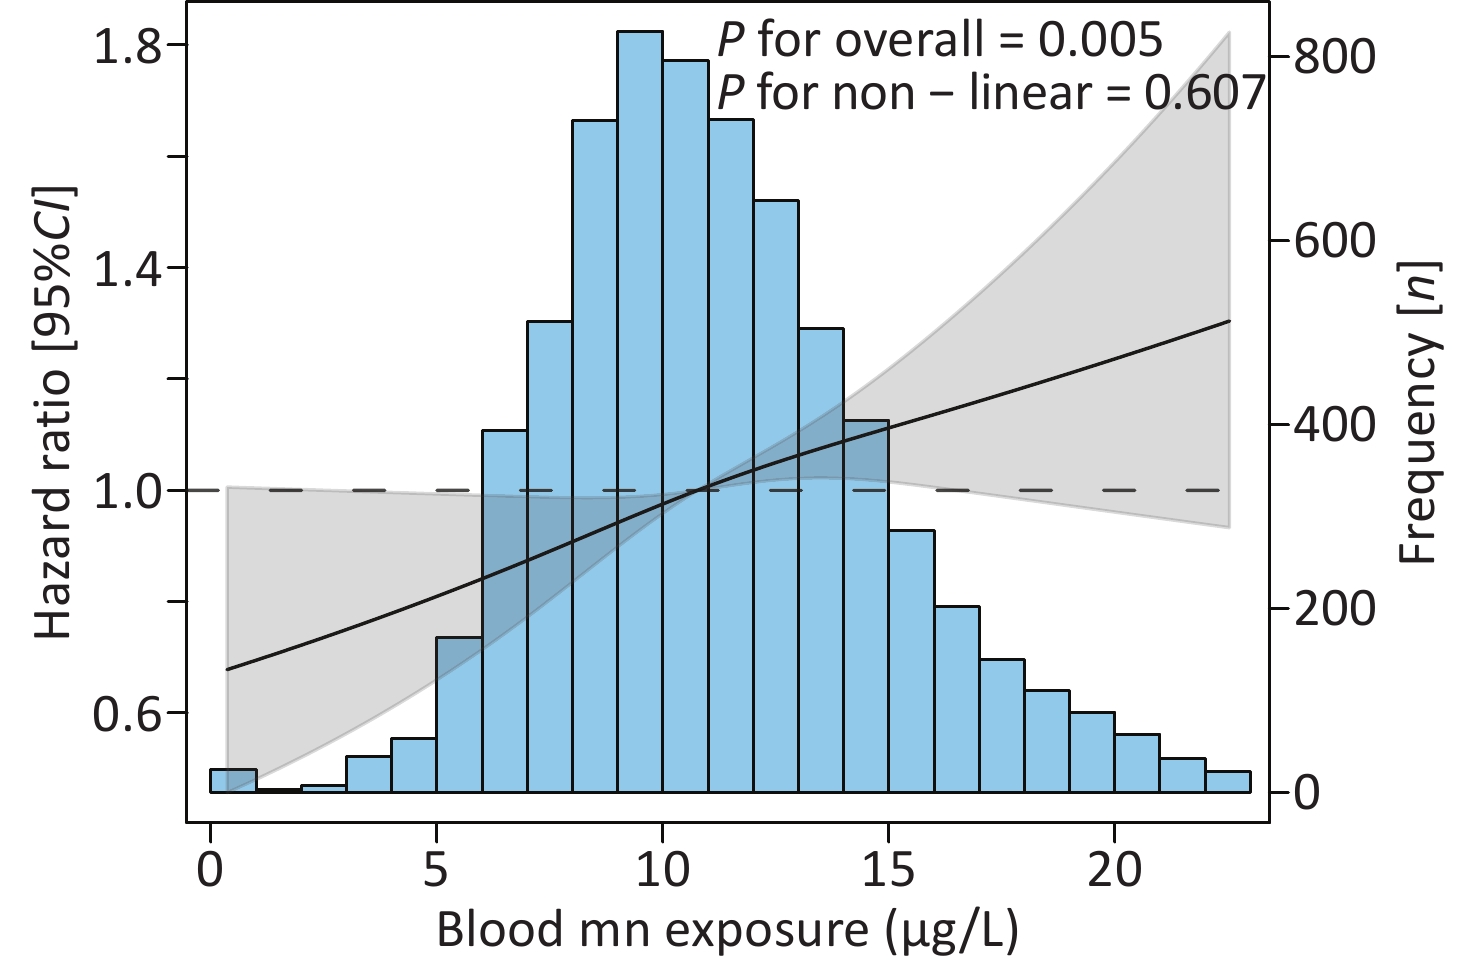
Table 3 presents that higher blood Mn levels were associated with an increased risk of cognitive decline and cognitive impairment. For cognitive decline, participants in the highest quartile had a significantly higher risk of cognitive decline across all models. In the fully adjusted model (Model 4), the hazard ratio (HR) for cognitive decline in Q4 was 1.221 (95% CI: 1.077, 1.384). When modeled as a continuous variable, each IQR increase in blood Mn was associated with a 9.7% higher risk of cognitive decline (HR = 1.097, 95% CI: 1.040, 1.157). For cognitive impairment, each IQR increase was associated with a 13.1% higher risk of cognitive impairment (HR = 1.131, 95% CI: 1.051, 1.217), while participants in Q4 had a 28.5% higher risk than those in Q1 after full adjustment (HR = 1.285, 95% CI: 1.081, 1.526). RCS analysis further supported a positive linear dose–response relationship between blood Mn levels and the risk of cognitive impairment (overall P = 0.005, non-linearity P = 0.607) (Figure 1).
Blood Mn Model 1 Model 2 Model 3 Model 4 HR (95% CI) HR (95% CI) HR (95% CI) HR (95% CI) Cognitive decline Q1 (0.354–8.740) Reference Reference Reference Reference Q2 (8.740–10.810) 1.072 (0.948–1.211) 1.057 (0.935–1.194) 1.046 (0.926–1.182) 1.054 (0.932–1.191) Q3 (10.810–13.387) 1.086 (0.958–1.230) 1.066 (0.941–1.208) 1.069 (0.943–1.211) 1.077 (0.950–1.221) Q4 (13.387–25.440) 1.229 (1.084–1.392) * 1.211 (1.068–1.372) * 1.215 (1.072–1.377) * 1.221 (1.077–1.384) * Per IQR 1.098 (1.042–1.157) * 1.092 (1.036–1.152) * 1.096 (1.039–1.155) * 1.097 (1.040–1.157) * Cognitive impairment Q1 (0.354–8.740) Reference Reference Reference Reference Q2 (8.740–10.810) 1.103 (0.932–1.306) 1.079 (0.912–1.278) 1.083 (0.915–1.283) 1.106 (0.934–1.309) Q3 (10.810–13.387) 1.132 (0.952–1.346) 1.105 (0.929–1.315) 1.122 (0.943–1.335) 1.134 (0.953–1.349) Q4 (13.387–25.440) 1.265 (1.065–1.501) * 1.247 (1.050–1.481) * 1.273 (1.072–1.513) * 1.285 (1.081–1.526) * Per IQR 1.125 (1.046–1.210) * 1.123 (1.043–1.209) * 1.131 (1.051–1.217) * 1.131 (1.051–1.217) * Note. Quartiles (Q1–Q4) are defined by the study-specific distribution (Q1 as reference). “Per IQR” denotes the HR per interquartile-range increase in blood Mn level. Model covariate adjustments: Model 1 adjusted for age, gender, cohort, area; Model 2 further adjusted for ethnicity, marital status, residence, education level, economic level; Model 3 further adjusted for smoking status, drinking status, as well as vegetable, fruit and meat intake. Model 4 further adjusted for body mass index, hypertension, diabetes, chronic kidney disease and dyslipidemia. Mn, manganese; HR, hazard ratio; CI, confidence interval; IQR, interquartile range. *P < 0.05. Table 3. Associations of blood manganese levels with risk of cognitive decline and cognitive impairment
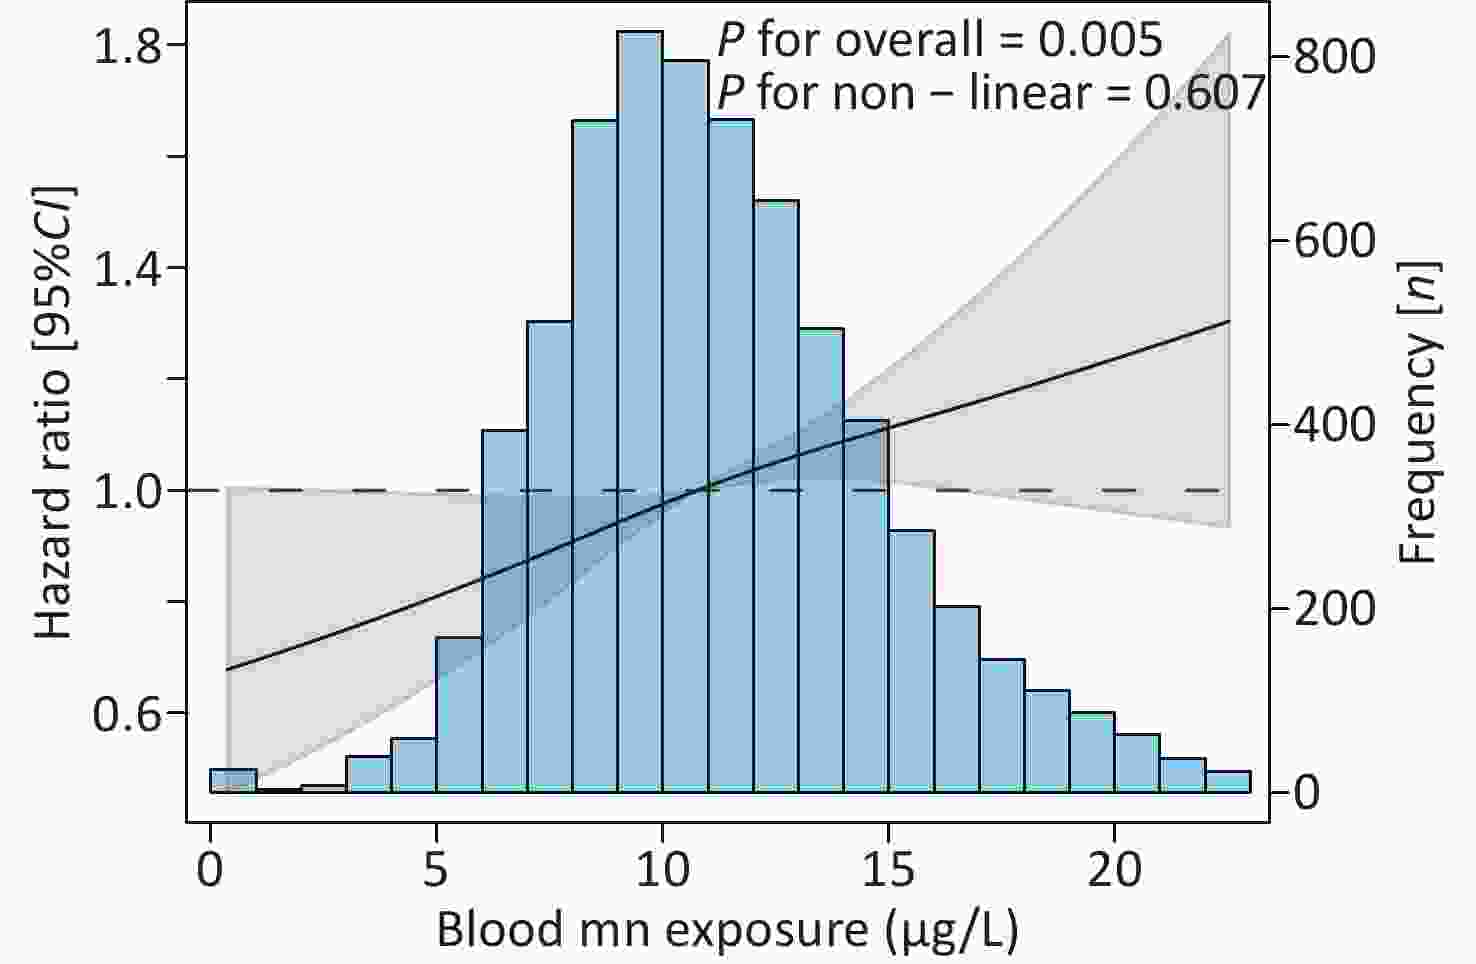
Figure 1. Restricted cubic spline analysis of blood Mn and incident cognitive impairment. Restricted cubic spline (RCS) curves depicting the HR and 95% CI for incident cognitive impairment. Three knots were placed at the default percentiles of the exposure distribution (10th, 50th [median, reference], and 90th). The solid black line represents the estimated HR; the shaded gray band denotes the 95% CI. Model adjusted for: age, sex, cohort, area, race, residence, marital status, education level, economic level, smoking status, alcohol consumption, vegetable/fruit/meat intake, body mass index, hypertension, diabetes, chronic kidney disease, and dyslipidemia. P values for overall association and non-linearity are shown in the upper‐left corner. Mn, manganese; HR, hazard ratio; CI, confidence interval.
-
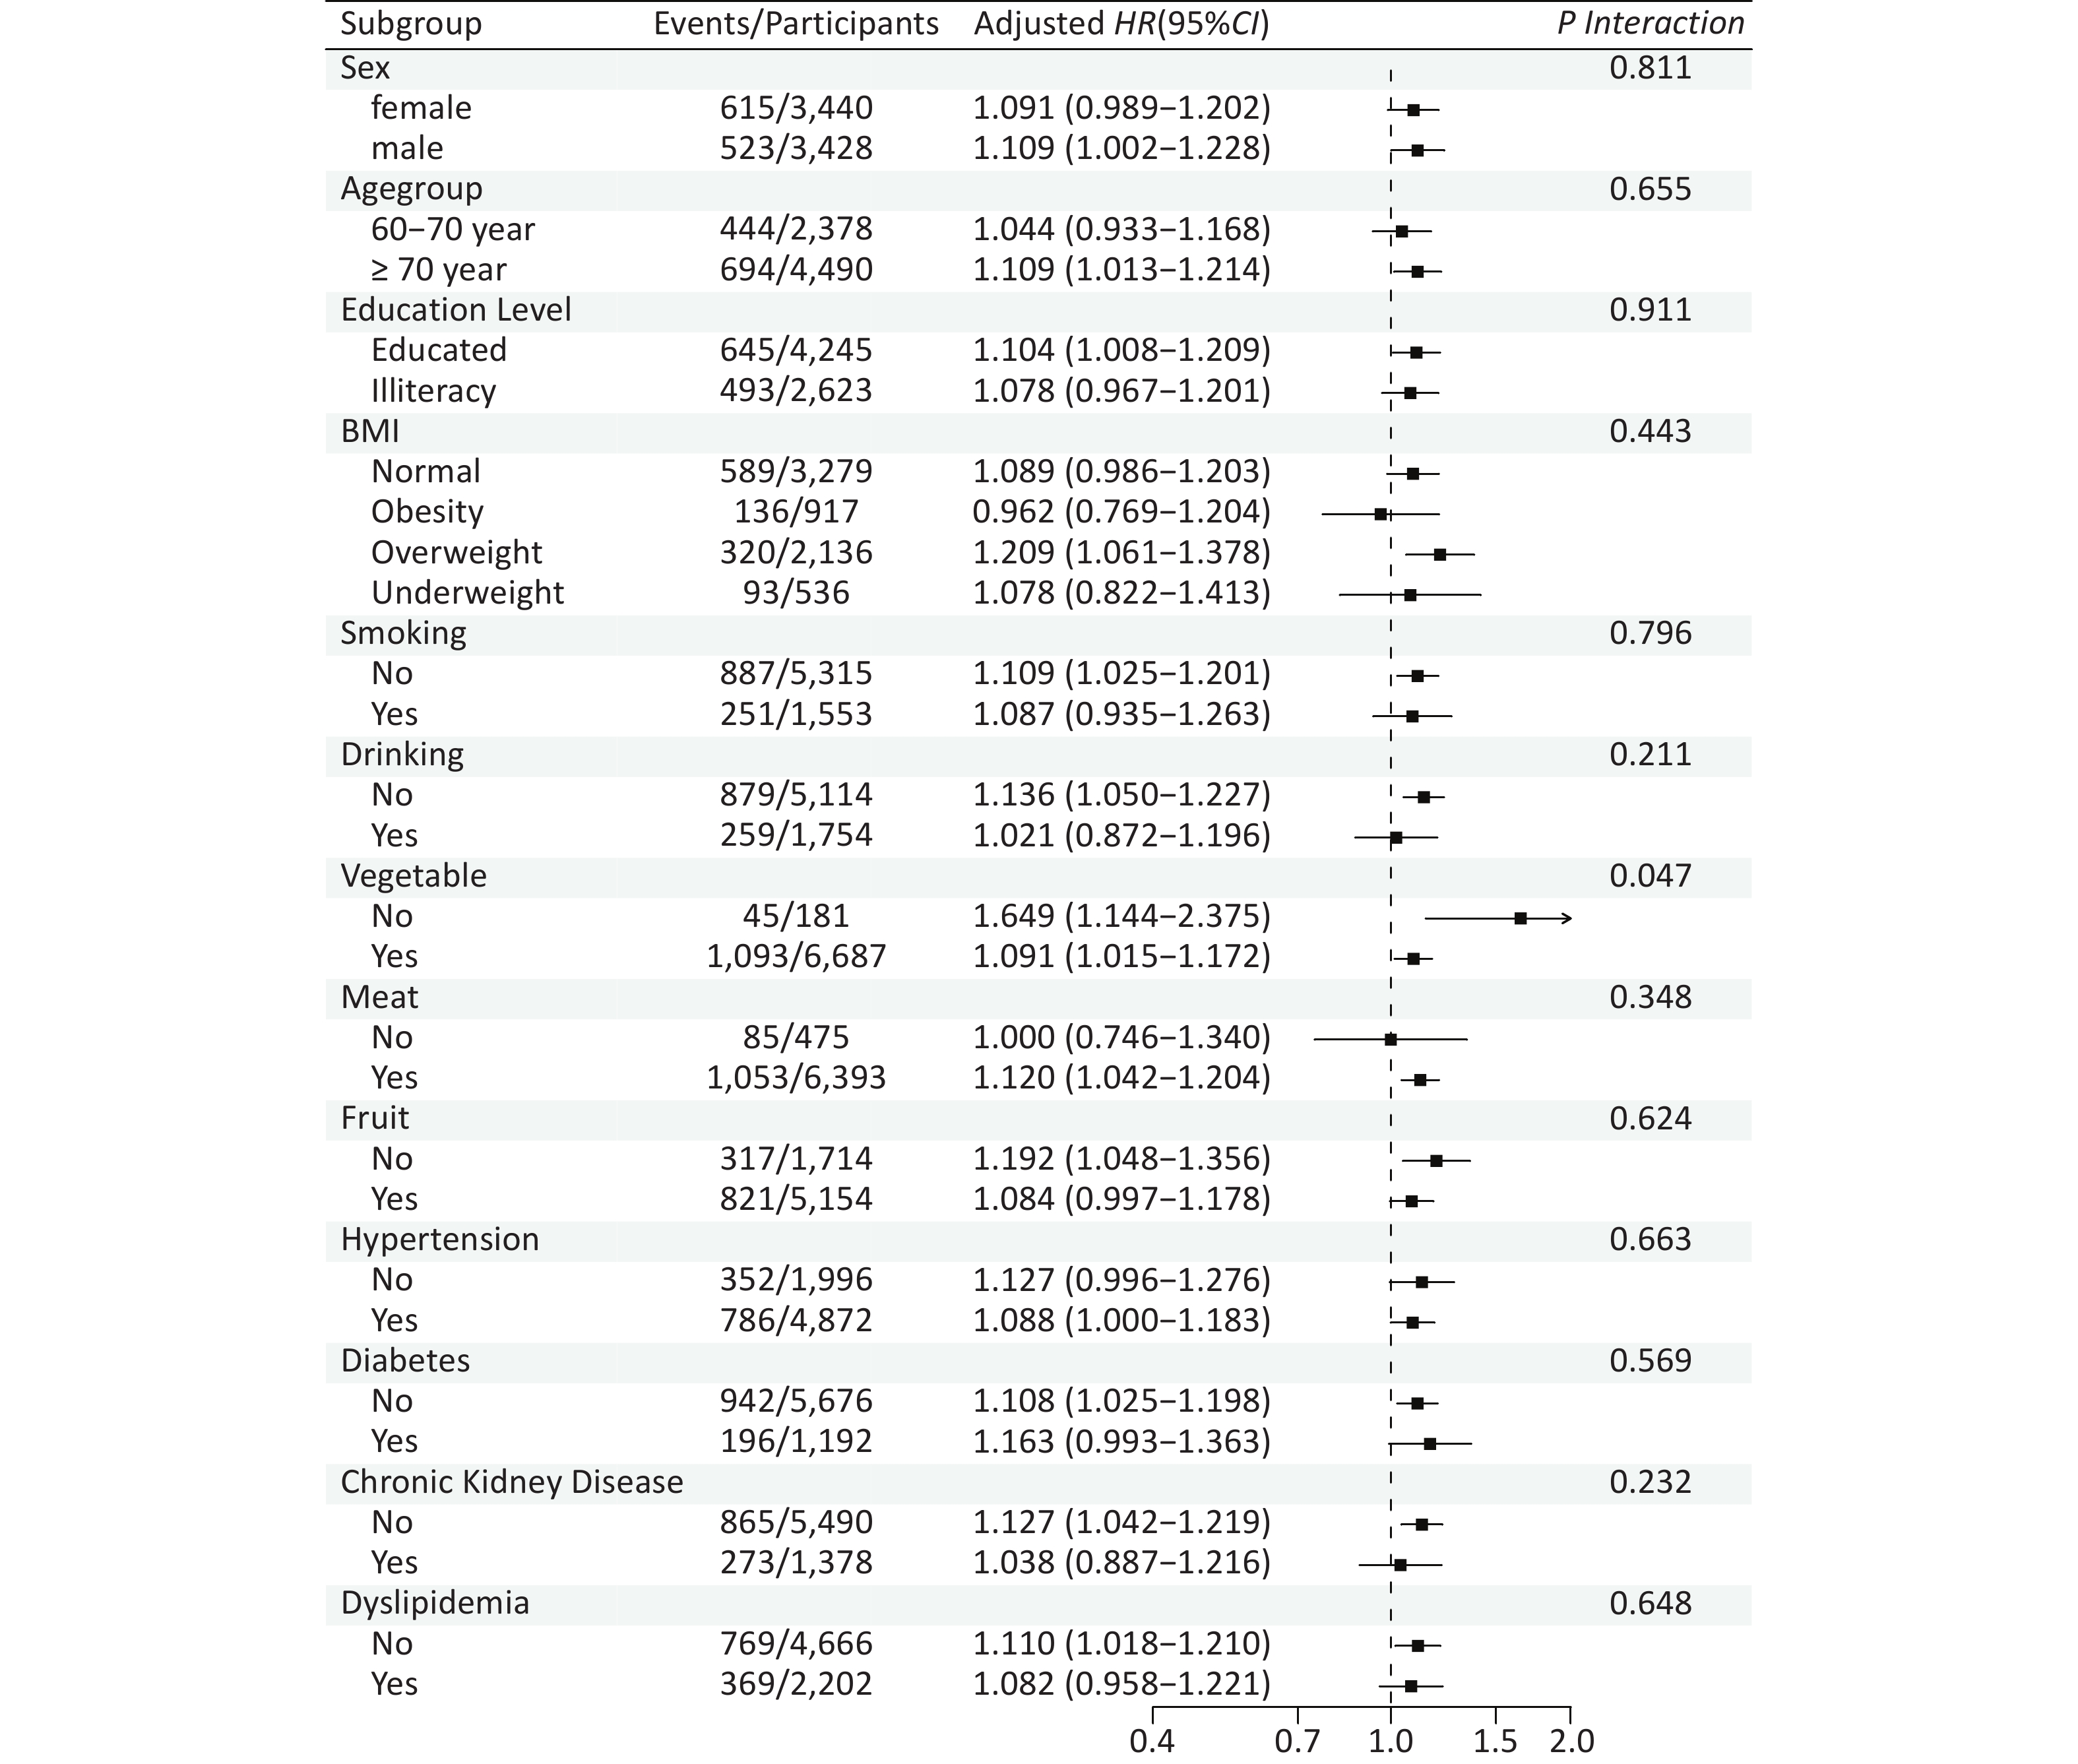
Analysis of effect modification suggested a potential modifying role of vegetable intake on the association between blood Mn exposure and incident cognitive impairment (P for interaction = 0.047), which marginally crossed the conventional statistical threshold of 0.05 (Figure 2). A total of 181 participants reported no vegetable intake, among whom 45 developed cognitive impairment. Among participants who did not consume vegetables, the risk was higher (HR = 1.649, 95% CI: 1.144, 2.375) relative to those who consumed vegetables (HR = 1.091, 95% CI: 1.015, 1.172). The association did not vary significantly by age group, sex educational level, BMI, smoking status, drinking status, meat, fruit, hypertension, T2D, and CKD or dyslipidemia. Although some subgroups, such as males, participants aged ≥ 70 years, overweight individuals, and those without hypertension or diabetes, showed positive associations with elevated blood Mn levels, no significant interactions were found (all P interaction > 0.05).
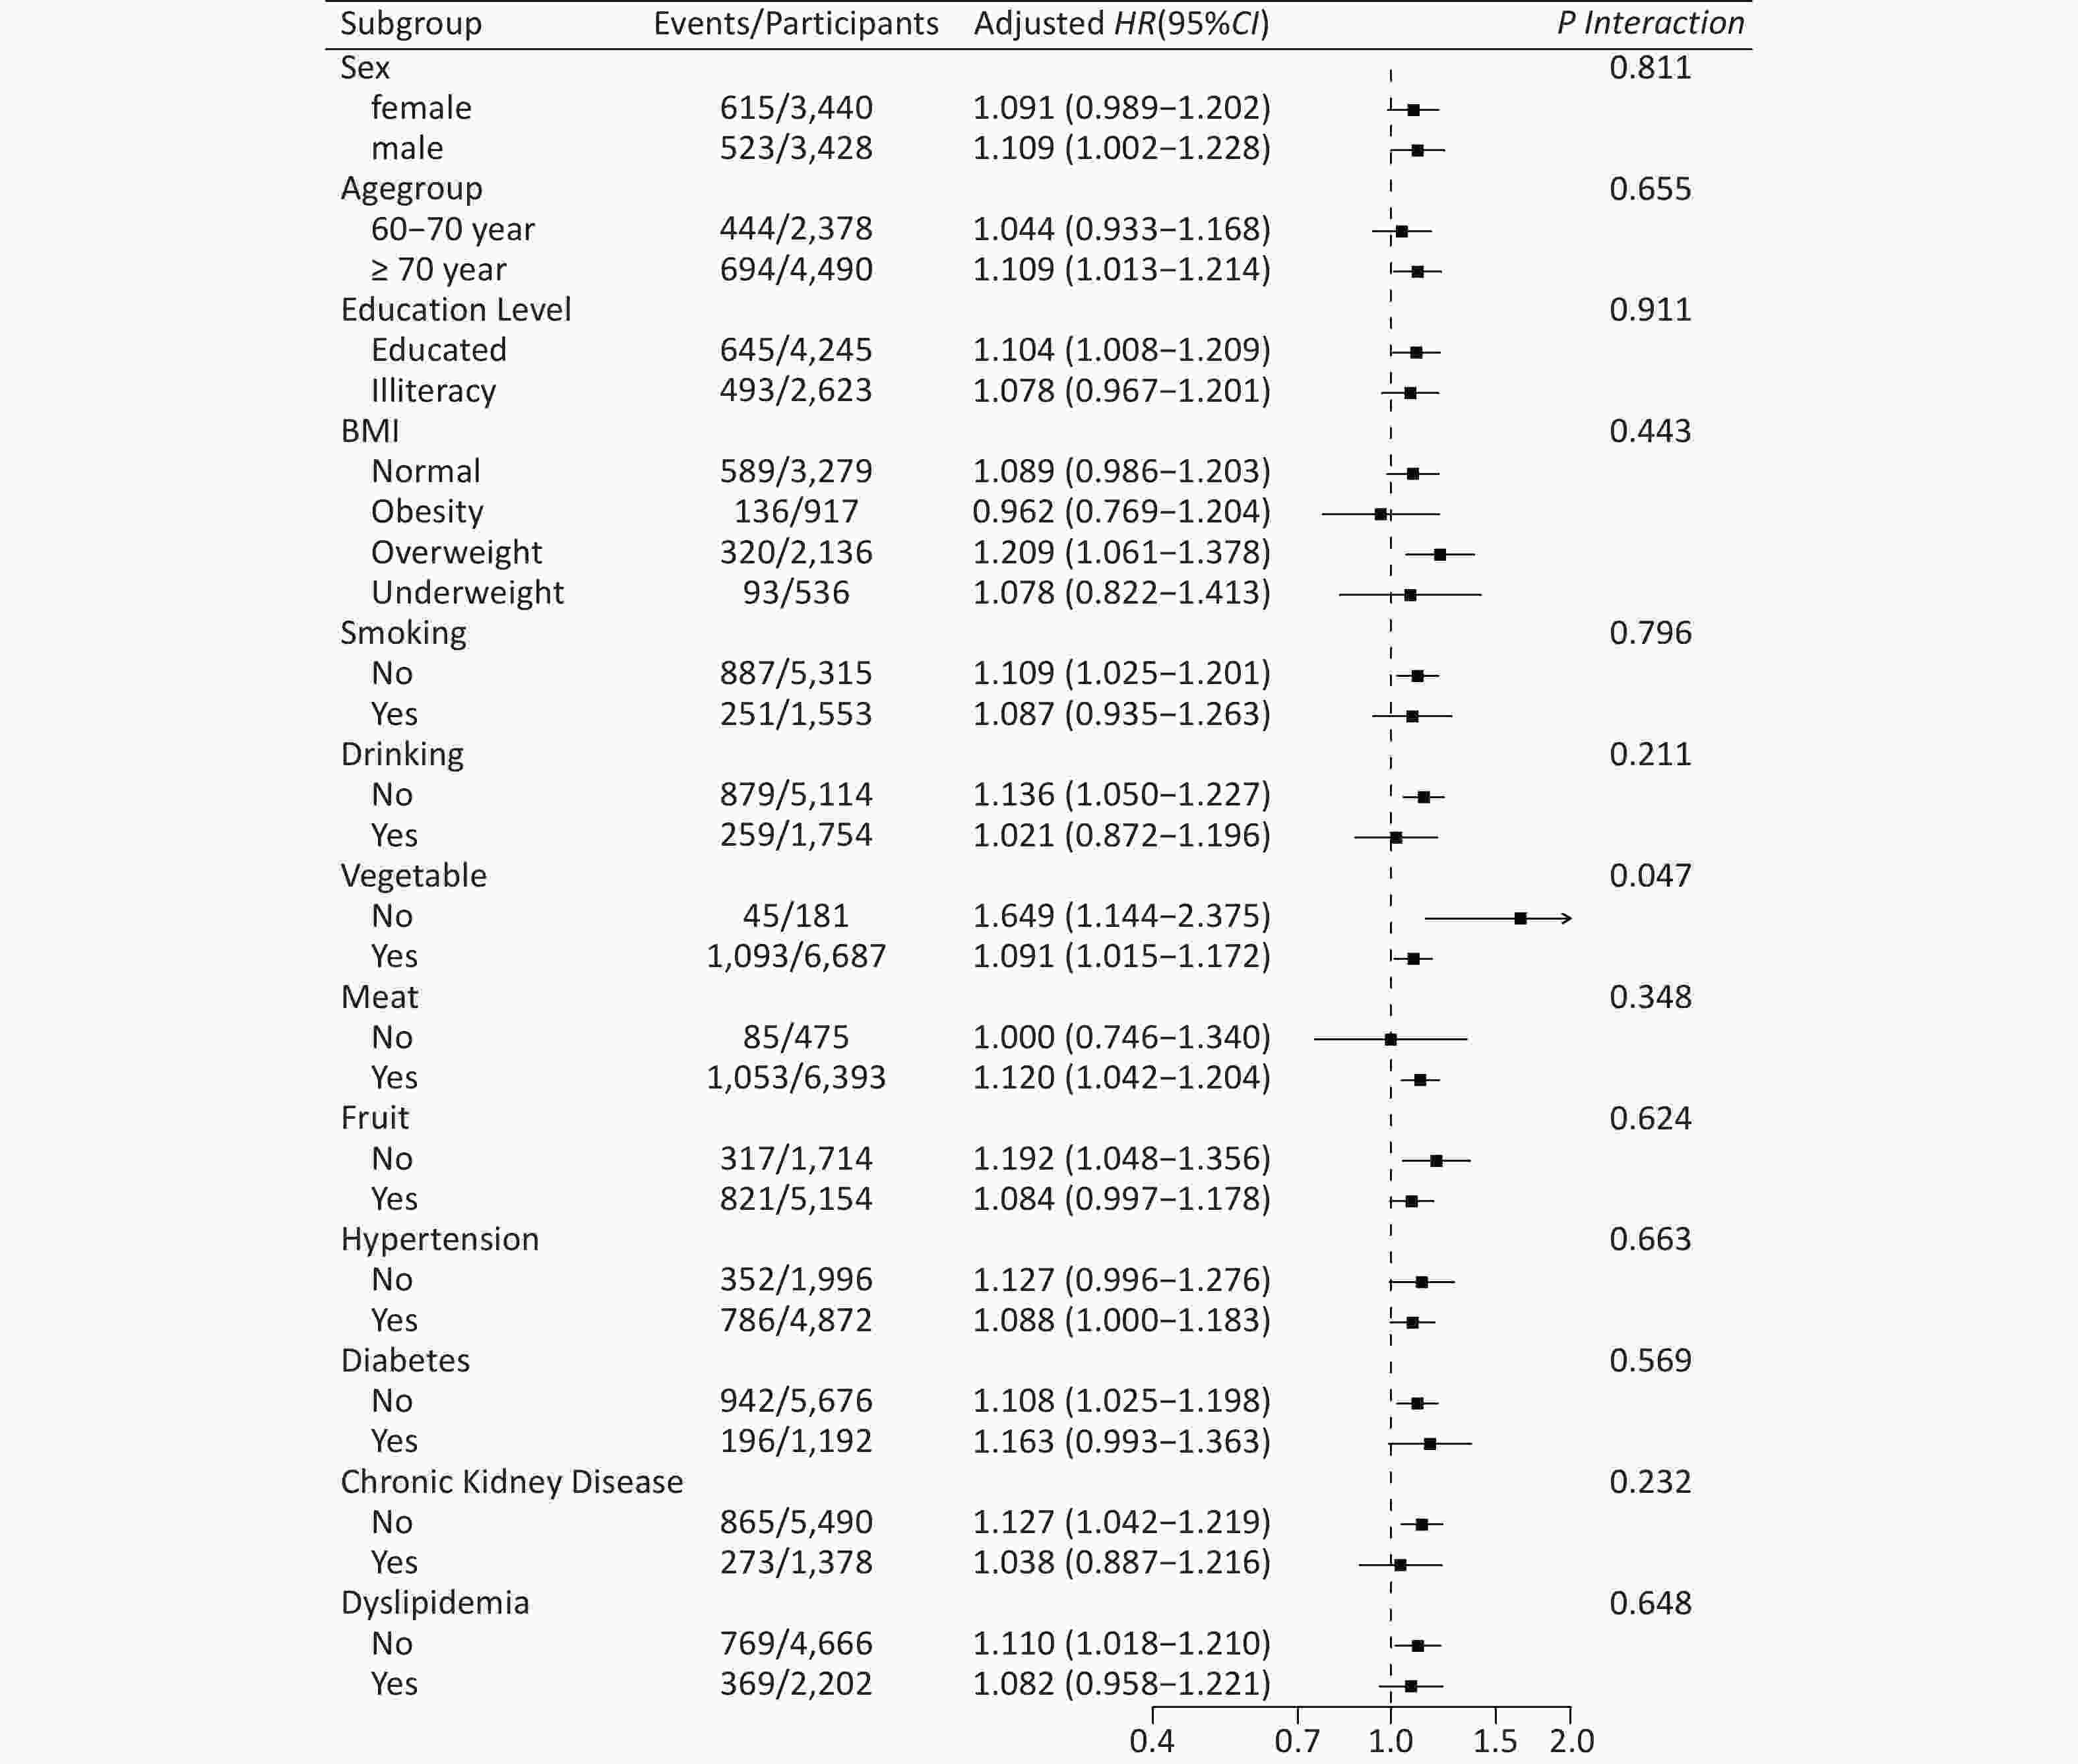
Figure 2. Subgroup analyses of the association between blood manganese and incident cognitive impairment. Forest plot showing adjusted HRs and 95% CIs for incident cognitive impairment per IQR increase in blood manganese concentration across prespecified subgroups. Model were adjusted for age, sex, race, area, marital status, residence, education level, economic status, body mass index, smoking status, alcohol consumption, vegetable/meat/fruit intake, hypertension, diabetes, chronic kidney disease, dyslipidemia and cohort. For each subgroup analysis, the stratification variable itself was omitted from the adjustment set. Numbers to the right of each estimate denote events/participants; The vertical dashed line at HR = 1 represents the null association. Mn, manganese; HR, hazard ratio; CI, confidence interval; IQR, interquartile range.
Sensitivity analyses validated the stability of the link connecting Mn concentrations to the development of cognitive impairment (Supplementary Table S6 and S7). After removing values below the LOD, the positive association remained significant, in the top quartile (Q4) exhibiting a HR of 1.285 (95% CI: 1.082, 1.527) in comparison with the bottom quartile (Q1), and the per IQR increase yielded a HR of 1.131 (95% CI: 1.051, 1.218). Similarly, after removing extreme values above the 99th percentile, the association persisted (Q4: HR = 1.275, 95% CI: 1.072, 1.518; per IQR: HR = 1.139, 95% CI: 1.053, 1.232). Furthermore, after additional adjustment for blood mercury and lead levels, the results remained robust (Q4: HR = 1.378, 95% CI: 1.157, 1.640; per IQR: HR = 1.168, 95% CI: 1.084, 1.258) (Supplementary Table S6). To account for the potential competing risk of death during follow-up, we performed sensitivity analyses using the Fine-Gray sub distribution hazard model, treating death as a competing event. The results were generally consistent with those from the primary Cox regression models. In the fully adjusted Fine-Gray model (Model 4), the per IQR increase in blood Mn was associated with a sub distribution HR of 1.075 (95% CI: 1.002, 1.152), and the highest quartile (Q4) showed an HR of 1.212 (95% CI: 1.026, 1.431) compared with Q1 (Supplementary Table S7).
-
In this population-based prospective cohort study of older adults, higher blood Mn levels were significantly associated with poorer cognitive performance and an increased risk of cognitive decline and cognitive impairment. Specifically, elevated Mn exposure was linked to lower MMSE total scores, with the most pronounced associations observed for naming and recall. In addition, the RCS analysis further indicated a positive linear dose–response relationship. These findings suggest that elevated blood Mn, even within the general population range, may be an independent risk factor for cognitive deterioration, and our study provides novel prospective evidence from a large Chinese elderly cohort linking Mn exposure to neurocognitive health.
Our findings are consistent with an accumulating body of evidence indicating that Mn exposure, even at relatively low levels, is associated with poorer cognitive outcomes, as previous cross-sectional studies have generally demonstrated inverse associations between biological Mn biomarkers and cognitive performance across diverse populations, although the affected cognitive domains have differed[17,19,20,35,36]. Our domain-specific findings further revealed that higher blood Mn levels were not only associated with global cognitive decline but also exerted more pronounced adverse effects on specific cognitive functions, particularly language and memory abilities. These domain-specific patterns suggest that brain regions critically involved in memory and language processing, such as the hippocampus, frontal lobes, and temporal structures, may be particularly vulnerable to Mn-induced neurotoxicity[37]. In contrast, studies relying on dietary Mn intake estimates have failed to find such associations, likely due to recall bias and the homeostatic regulation of essential trace elements[38]. Other study in occupationally exposed found that higher environmental (residential air) Mn exposure was associated with reduced plasma levels of brain-derived neurotrophic factor as well as diminished cognitive performance[39,40]. Notably, while our interaction test for sex was not statistically significant, we observed a stronger risk of cognitive impairment associated with blood Mn in male participants, a pattern also reported in prior research[20]. This sex-specific signal, together with the inconsistency across exposure metrics, highlights the importance of using reliable internal dose measures and prospective designs. Our cohort-based analysis, which is less susceptible to the temporal and recall limitations of cross-sectional studies, provides more robust evidence for a linear relationship between Mn exposure and cognitive decline.
Subgroup analysis further explored the stability of the association between blood Mn levels and cognitive impairment in different demographic and clinical characteristics of the elderly population. In the ≥ 70-year-old age group, an increase in blood Mn levels may increase the risk of cognitive impairment. This trend suggests that older individuals may be more sensitive to the neurotoxic effects of blood Mn. As age increases, the metabolic and detoxification functions of the brain (such as the integrity of the blood-brain barrier and the activity of antioxidant enzymes) may gradually decline, which may exacerbate the accumulation of Mn in the brain and its neurotoxic effects[41]. Therefore, for the elderly with advanced age, maintaining an appropriate blood Mn level may be particularly important for cognitive health. In the elderly population who do not consume vegetables and fruits, the association between blood Mn and cognitive impairment becomes stronger, which has significant intervention implications. Vegetables and fruits are rich in dietary fiber, vitamins, and various phytochemicals, with antioxidant and anti-inflammatory properties, which may buffer the cognitive impairment effects induced by Mn exposure by reducing oxidative stress and neuroinflammation[42]. Therefore, encouraging the elderly to increase their intake of vegetables and fruits may be a simple and effective strategy to reduce the risk of Mn neurotoxicity.
In our Chinese elderly cohort, the geometric mean concentration of blood Mn was 10.701 µg/L. In comparison, a nationwide survey of the general Chinese population (n = 18,120) reported a geometric mean blood Mn level of 8.98 µg/L[43]. By contrast, data from the U.S. National Health and Nutrition Examination Survey (NHANES) 2013–2014 cycle indicated that older adults (≥ 60 years) had a median blood Mn level of 8.76 µg/L[19]. According to the Agency for Toxic Substances and Disease Registry (ATSDR) report, blood Mn in healthy adults has been reported to vary between 4 and 15 μg/L[44], suggest that the Mn exposure levels in our Chinese elderly cohort fall within the low-to-moderate range of general population exposure. In contrast to the prior study that found L-shaped associations linking Mn exposure to cognitive impairment, we observed a significant linear dose-response relationship[45], even though our participants were exposed to Mn levels that are typical for the general population. A possible explanation for this discrepancy is that older adults represent a particularly vulnerable population; age-related declines in physiological functions, including reduced hepatic and renal clearance, impaired blood–brain barrier integrity, and diminished antioxidant capacity[46], may render them more susceptible to the neurotoxic effects of Mn, such that even relatively low levels of exposure confer an increased risk of cognitive impairment.
Multiple potential mechanisms have been postulated to account for the relationship of Mn exposure to cognitive impairment risk. Mn is recognized to accumulate within the basal ganglia, a brain region critical for motor control and cognitive functions[47]. Mn can disrupt dopaminergic and glutamatergic neurotransmission, which are essential for cognitive processes such as attention, executive function, and memory[14]. Mn neurotoxicity results from the interplay of multiple mechanisms, with core processes including oxidative stress, mitochondrial stress response, neuroinflammation, transporter dysregulation, metal imbalance, disrupted signaling pathways, and α-synuclein pathology[48]. These interrelated mechanisms ultimately lead to neurodegenerative changes primarily affecting brain regions including the basal ganglia, hippocampus, and cerebral cortex, manifesting as parkinsonian symptoms and cognitive dysfunction[11].
Our study possesses multiple strengths, such as its prospective design, large cohort, comprehensive evaluation of robust sensitivity analyses, and a wide range of potential confounders. However, several limitations should be acknowledged. First, we only measured Mn exposure level at baseline, which may not adequately represent long-term or cumulative exposure. However, many large prospective cohort studies have employed baseline biomarker measurement as exposure levels[49-53]. Second, the study population consisted of older adults from specific regions in China, which may restrict the extrapolation of our results to other populations. Third, while this study has included many variables, residual confounding factors caused by unmeasured factors (such as iron status, liver function, occupational exposure history and Mn concentrations in drinking water) cannot be completely considered, and they may affect the observed association. Lastly, the potential for reverse causality, although lessened by the prospective design, still exists if subclinical cognitive decline at baseline influenced nutritional intake or metabolism of Mn. However, we excluded individuals with baseline cognitive impairment to minimize this concern.
-
In this population-based prospective cohort of older adults, elevated blood Mn was associated with poorer cognition performance and increased risks of cognitive decline and impairment, with strongest effects on naming and recall, and a linear dose-response relationship. Our findings highlight the importance of monitoring Mn exposure, particularly among older adults, and suggest that reducing unnecessary exposure may offer public health benefits in alleviating the growing burden of cognitive impairment in aging populations.
HTML
Study Population and Design
Evaluation of Mn Exposure Level
Assessment of Cognitive Function Outcomes
Evaluation of Covariates
Statistical Analysis
Baseline Characteristics
Association Between Mn Exposure Levels and Cognitive Function
Subgroup Analysis and Sensitivity Analysis
Competing Interests The authors declare that they have no known competing financial interests or personal relationships that could have appeared to influence the work reported in this paper.
Ethics This study was approved by the Ethics Committee of the National Institute of Environmental Health, Chinese Center for Disease Control and Prevention (protocol code: 201701 and 201922). All participants or their proxy respondents provided informed consent.
Authors’ Contributions Writing - original draft, Investigation, Methodology: Yue Chen; Writing - review & editing, Investigation, Methodology: Wanying Shi; Writing - review & editing, Visualization: Huijie Chang; Writing - review & editing, Formal analysis: Liang Ding; Writing - review & editing, Formal analysis: Chen Chen; Writing - review & editing, Resources, Investigation: Yingli Qu; Writing - review & editing: Zhenyi Yin; Writing - review & editing: Yongmei Wang; Formal analysis, Investigation: Zhanhong Xue; Formal analysis, Investigation: Fanye Long; Writing - review & editing: Luxi Wei; Writing - review & editing: Caihong Jiang; Writing - review & editing: Peipei Dong; Writing - review & editing, Methodology: Ying Zhu; Writing - review & editing, Supervision, Validation, Project administration: Yuebin Lv; Writing - review & editing, Supervision, Validation, Project administration: Xiaoming Shi.
Data Sharing The data underlying this article cannot be shared publicly due to the privacy of individuals who participated in the study. The data will be shared at reasonable requests to the corresponding author. The supplementary materials will be available in www.besjournal.com.
&These authors contributed equally to this work.

 Quick Links
 DownLoad: