
-
Rescue workers, including firefighters, emergency responders, and medical rescue personnel, are repeatedly exposed to traumatic events such as fires, earthquakes, public health emergencies, severe injuries, and death. Because of this sustained occupational exposure to traumatic events, rescue workers are at an increased risk of developing post-traumatic stress disorder (PTSD), which can impair psychological well-being, occupational functioning, and the quality of rescue operations[1-4].
Recent research has described substantial heterogeneity in PTSD prevalence across rescue occupations, settings, and trauma types, with many estimates falling between 8% and 15%, and even higher in some high-risk groups[5]. The risk of PTSD in rescue workers is shaped by multiple domains, including demographic background, trauma exposure, psychiatric history, and psychosocial context[6-8]. Anxiety and depressive symptoms are particularly important because they commonly co-occur with PTSD and may form a tightly connected psychopathological network[9,10]. Health behaviors such as smoking and alcohol use may also be associated with PTSD risk by influencing emotional regulation and neuroendocrine stress responses.
In practice, PTSD assessment relies primarily on self-report scales and clinical interviews. Although these approaches are indispensable, they may be less suitable for rapid, scalable, and standardized risk stratification in large, high-exposure occupational populations[11-13]. Traditional statistical models such as logistic regression, remain interpretable but may be less effective in capturing high-dimensional structures, nonlinear associations, and complex interactions. Therefore, machine-learning methods have become increasingly attractive for psychiatric risk prediction because of their ability to extract latent structures and identify nonobvious predictive patterns[14,15]. Previous studies have used algorithms such as random forest and logistic regression to develop PTSD prediction models with generally satisfactory performance[16,17]. However, studies focusing specifically on rescue workers while simultaneously comparing multiple dimensionality-reduction strategies and multiple algorithms with both internal and external validations remain scarce.
Therefore, several gaps remain in the literature. First, many existing PTSD prediction studies have focused on military personnel or general trauma-exposed populations rather than on rescue workers[18]. Second, many studies rely on a single dimensionality-reduction strategy or a single algorithm, limiting direct comparisons across modeling frameworks[19]. Third, external validation has been insufficiently emphasized, limiting the assessment of generalizability[18]. To address these limitations, the present study used multicenter rescue-worker health-archive data to compare two-dimensional reduction strategies, build nine machine-learning models, perform both internal and external validation, and interpret the key predictors underlying model discrimination.
-
This was a multicenter cross-sectional study based on cluster sampling. Rescue workers from 13 units were included in the model development, and their data were collected from February to November 2025. Eligibility criteria were rescue-related work for at least 1 year, participation in at least one major traumatic rescue event, ability to complete the survey independently, and written informed consent. Participants with severe psychiatric disorders (such as schizophrenia or bipolar disorder), organic brain disease, severe physical illnesses affecting psychological assessments, or incomplete questionnaires were excluded from the study. Rescue workers from two additional units were used as independent external-validation samples under the same inclusion and exclusion criteria, and external-validation data were collected from August 2022 to January 2024.
-
Data were obtained from standardized trauma-stress health archives collected electronically through Wenjuanxing. After cleaning the data, participants with abnormal or incomplete records were excluded. A repeated survey of 100 participants showed 98% response agreement. PTSD symptoms were assessed with the PTSD Checklist for DSM-5 (PCL-5), and a total score of 33 or higher defined PTSD positivity. Sixteen candidate predictors were included: sex, marital status, age, ethnicity, educational level, BMI, monthly family income per capita, recent trauma exposure, previous mental illness, current smoking, passive smoking, alcohol use, family history of mental illness, acute stress disorder score (ASDscore), depression score (SDSscore), and anxiety score (SASscore).
-
Two dimensionality-reduction strategies were used. Principal component analysis (PCA) retained 13 principal components. Exploratory factor analysis (FA) retained six common factors based on a parallel analysis. Nine machine-learning algorithms were trained on each reduced feature set: adaptive boosting (AdaBoost), extreme gradient boosting (XGBoost), multilayer perceptron, kernel support vector machine (SVM), decision tree, logistic regression, random forest, gradient boosting machine (GBM), and linear SVM.
-
The derivation dataset was split by stratified random sampling in a 7:3 ratio into training and internal validation sets while preserving the proportion of PTSD-positive participants. Five-fold cross-validation was used for the hyperparameter tuning of the models. To address class imbalance, a synthetic minority oversampling technique (SMOTE) was applied only to the training data. An independent sample from two additional units was used for external validation, and sample-size adequacy for model development was assessed using events per candidate predictor parameter (EPP), with 229 PTSD-positive events in the training set and 16 candidate predictors; EPP was 14.31, exceeding the commonly used threshold of 10[20].
-
Model performance was evaluated using the area under the curve (AUC), accuracy, balanced accuracy, sensitivity, specificity, positive predictive value (PPV), negative predictive value (NPV), F1-score, Matthews correlation coefficient (MCC), area under the precision-recall curve (AUPRC), Brier score, calibration intercept and slope, Hosmer-Lemeshow goodness-of-fit testing, and decision-curve analysis. DeLong tests were used to compare AUCs between representative models, and Holm correction was applied for multiple comparisons. Because different performance indicators may favor different algorithms, Pareto-front assessment and the sum of ranking differences (SRD) were additionally used for multi-indicator model comparison. These analyses were used to identify candidate models with a relatively balanced performance rather than to define a universally optimal algorithm[21]. For predictor-level interpretability, an original-variable XGBoost-SHAP analysis was performed on the external-validation dataset. Calibration was evaluated using the calibration intercept, calibration slope, Hosmer-Lemeshow goodness-of-fit test, and Brier score. Decision-curve analysis was performed to assess the potential clinical net benefit across the selected threshold probabilities. Detailed results are provided in the Supplementary Materials.
-
Data processing and analyses were performed using R version 4.5.2. Categorical variables were coded as factors and continuous variables were retained as numeric variables. Preprocessing was performed on the training data only and included missing-value imputation, dummy encoding, removal of zero-variance predictors, and standardization; the same parameters were then applied to the internal and external-validation data. Major packages included readxl, dplyr, recipes, caret, pROC, xgboost, psych, and ggplot2.
-
In total, 13,462 rescue workers were included in the derivation sample, including 13,135 PTSD-negative and 327 PTSD-positive participants. The external-validation sample included 8,757 rescue workers. In the derivation dataset, participants with PTSD positivity had significantly higher ASD, SDS, and SAS scores than PTSD-negative participants. Significant between-group differences were also observed in sex, previous mental illness, and passive smoking after Bonferroni correction (Table 1). Age showed a nominal difference between the two groups; however, this difference was no longer statistically significant after Bonferroni correction. Comparisons between the training and internal validation datasets and between the derivation and external-validation datasets are provided in Supplementary Tables S1 and S2.
Characteristic Category/statistic PTSD-negative (n = 13,135),
n (%) or median (IQR)PTSD-positive (n = 327),
n (%) or median (IQR)OR (95% CI) Z/χ² P value Bonferroni P Age, y Median (IQR) 25.00 (23.00, 28.00) 24.00 (22.00, 27.00) 2.508 0.012 0.182 BMI Median (IQR) 22.90 (21.30, 24.50) 22.90 (21.35, 24.25) 0.059 0.953 1.000 ASD score Median (IQR) 19.00 (19.00, 22.00) 57.00 (56.00, 61.50) −34.787 < 0.001 < 0.001 SDS score Median (IQR) 40.00 (31.25, 58.75) 58.75 (41.25, 62.50) −11.934 < 0.001 < 0.001 SAS score Median (IQR) 35.00 (28.75, 43.75) 46.25 (37.50, 56.25) −16.757 < 0.001 < 0.001 Sex Female 299 (2.3%) 20 (6.1%) Reference 20.334 < 0.001 < 0.001 Male 12,836 (97.7%) 307 (93.9%) 0.36 (0.22–0.57) Marital status Unmarried 9,437 (71.8%) 252 (77.1%) Reference 0.063 0.940 Married 3,638 (27.7%) 73 (22.3%) 0.75 (0.58–0.98) Other 60 (0.5%) 2 (0.6%) 1.25 (0.30–5.14) Ethnicity Minority ethnicity 1,322 (10.1%) 26 (8.0%) Reference 1.582 0.244 1.000 Han ethnicity 11,813 (89.9%) 301 (92.0%) 1.30 (0.86–1.94) Education High school or less 3,426 (26.1%) 73 (22.3%) Reference 2.343 0.142 1.000 College or above 9,709 (73.9%) 254 (77.7%) 1.23 (0.94–1.60) Monthly family income per capita, CNY ≤ 2,999 3,407 (25.9%) 78 (23.9%) Reference 2.315 0.510 1.000 3,000–4,999 4,140 (31.5%) 111 (33.9%) 1.17 (0.87–1.57) 5,000–7,999 2,732 (20.8%) 61 (18.7%) 0.98 (0.70–1.37) ≥ 8,000 2,856 (21.7%) 77 (23.5%) 1.18 (0.86–1.62) Recent trauma exposure No 12,788 (97.4%) 313 (95.7%) Reference 3.286 0.101 1.000 Yes 347 (2.6%) 14 (4.3%) 1.65 (0.95–2.85) Previous mental illness No 13,127 (99.9%) 323 (98.8%) Reference < 0.001 0.002 Yes 8 (0.1%) 4 (1.2%) 20.32 (6.09–67.83) Smoking status No 7,119 (54.2%) 189 (57.8%) Reference 1.666 0.217 1.000 Yes 6,016 (45.8%) 138 (42.2%) 0.86 (0.69–1.08) Passive smoking No 11,437 (87.1%) 250 (76.5%) Reference 31.437 < 0.001 < 0.001 Yes 1,698 (12.9%) 77 (23.5%) 2.07 (1.60–2.69) Alcohol use No 12,546 (95.5%) 306 (93.6%) Reference 2.770 0.126 1.000 Yes 589 (4.5%) 21 (6.4%) 1.46 (0.93–2.29) Family history of mental illness No 13,118 (99.9%) 325 (99.4%) Reference 0.077 1.000 Yes 17 (0.1%) 2 (0.6%) 4.75 (1.09–20.64) Note. Continuous variables are presented as medians (IQR), and categorical variables as n (%). Unadjusted ORs were calculated for categorical variables using the indicated reference categories; ORs for continuous variables were not calculated in this descriptive table. Bonferroni-adjusted P values were used for multiple baseline comparisons. PTSD, post-traumatic stress disorder; CI, confidence interval; CNY, Chinese Yuan; IQR, interquartile range; OR, odds ratio; BMI, body mass index; ASD, acute stress disorder; SDS, self-rating depression scale; SAS, self-rating anxiety scale. Table 1. Baseline characteristics and univariable ORs according to PTSD status in the derivation dataset
-
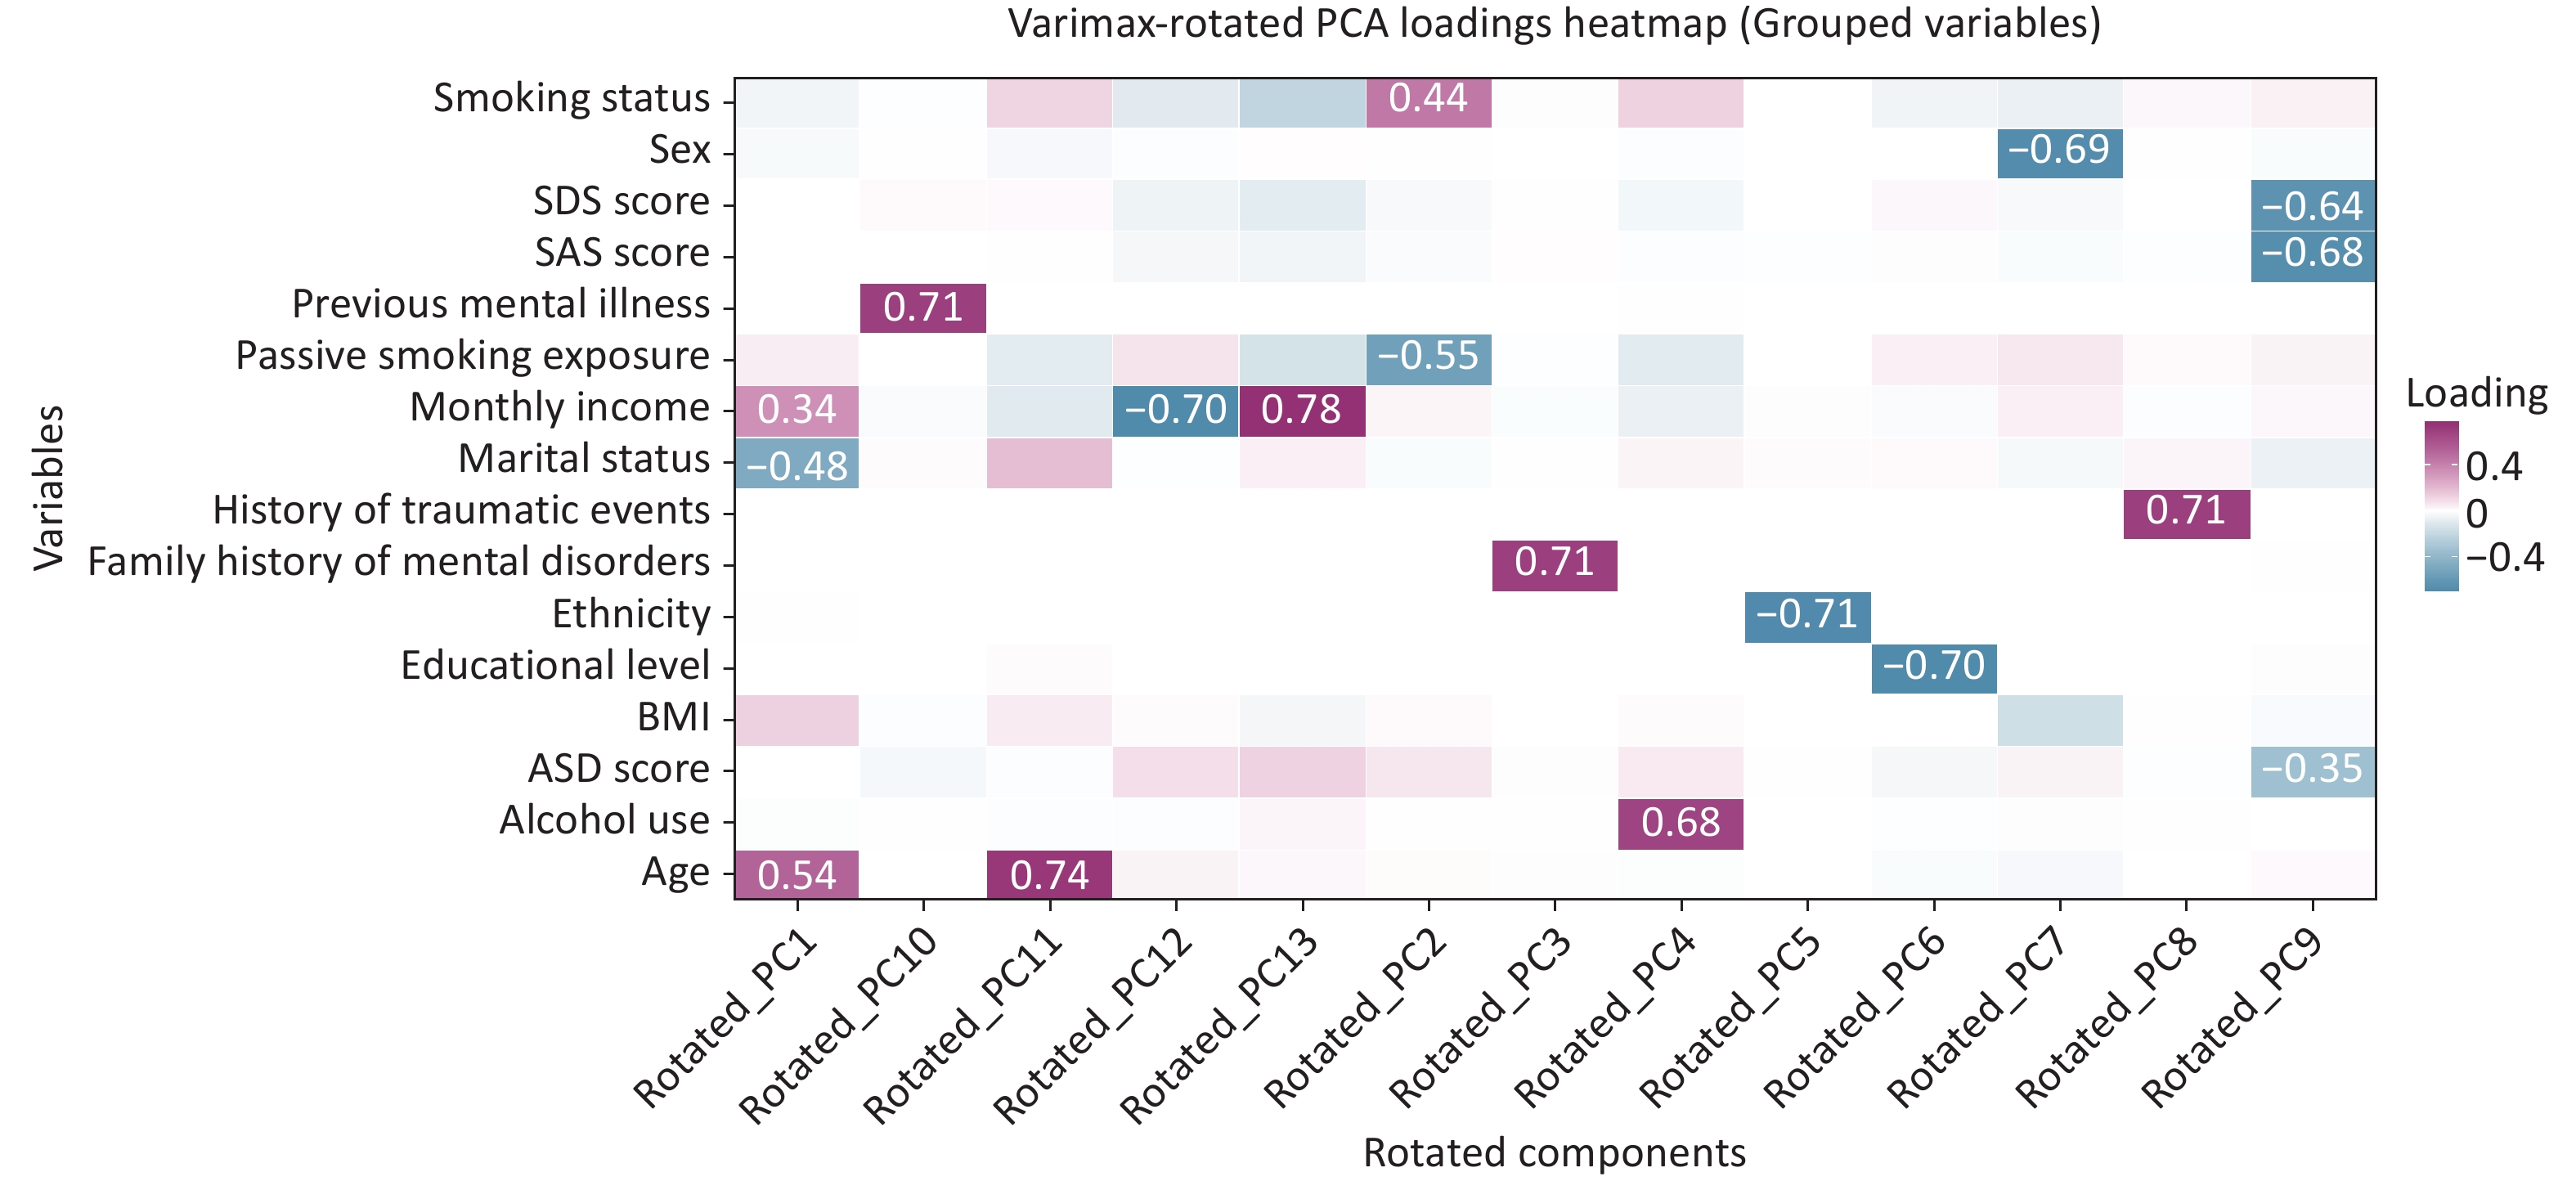
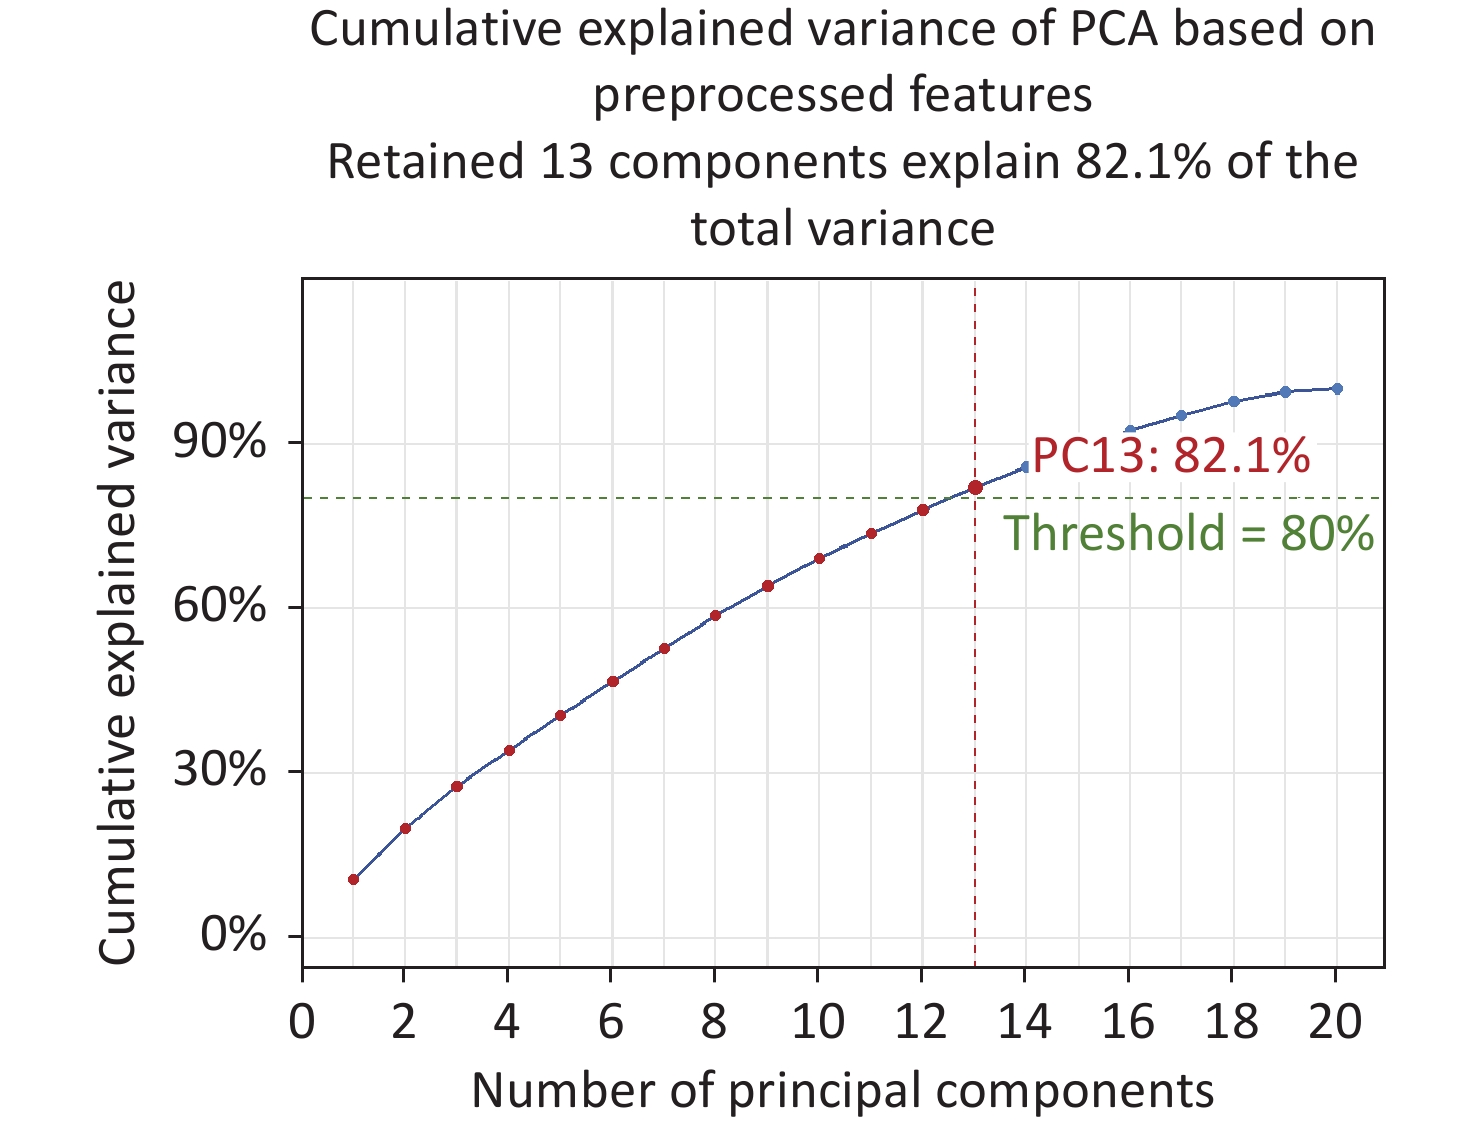
Cumulative explained variance increased steadily as the number of principal components increased, and the first 13 principal components explained 82.1% of the total variance (Figure 1), indicating that most information from the original variables was retained[22]. The Kaiser-Meyer-Olkin (KMO) value was 0.4172, indicating limited sampling adequacy and a weak common structure among the heterogeneous predictors; however, previous large observational studies have shown that PCA may still be used for planned comparisons or feature compression under low KMO values when interpreted cautiously[23]. Bartlett’s test of sphericity performed on the preprocessed training feature matrix was significant (χ2 = 2,541,639.1889, P < 0.001), indicating that the correlation matrix was not an identity matrix and that the variables retained sufficient intercorrelation for dimensionality reduction. After Varimax rotation, a loading heatmap was used to visualize the distribution of the original predictors across the retained principal components (Figure 2). Higher loadings were observed for anxiety, depression, and acute stress disorder scores on principal component 9 (PC9); smoking and passive smoking on PC2; previous mental illness and family history of mental disorders on PC10 and PC3, respectively; trauma-exposure history on PC8; monthly family income per capita on PC12 and PC13; and age and marital status on PC1 and PC11. These loading patterns helped characterize the main variable composition of the retained principal components and provided compact feature inputs for subsequent machine-learning models.
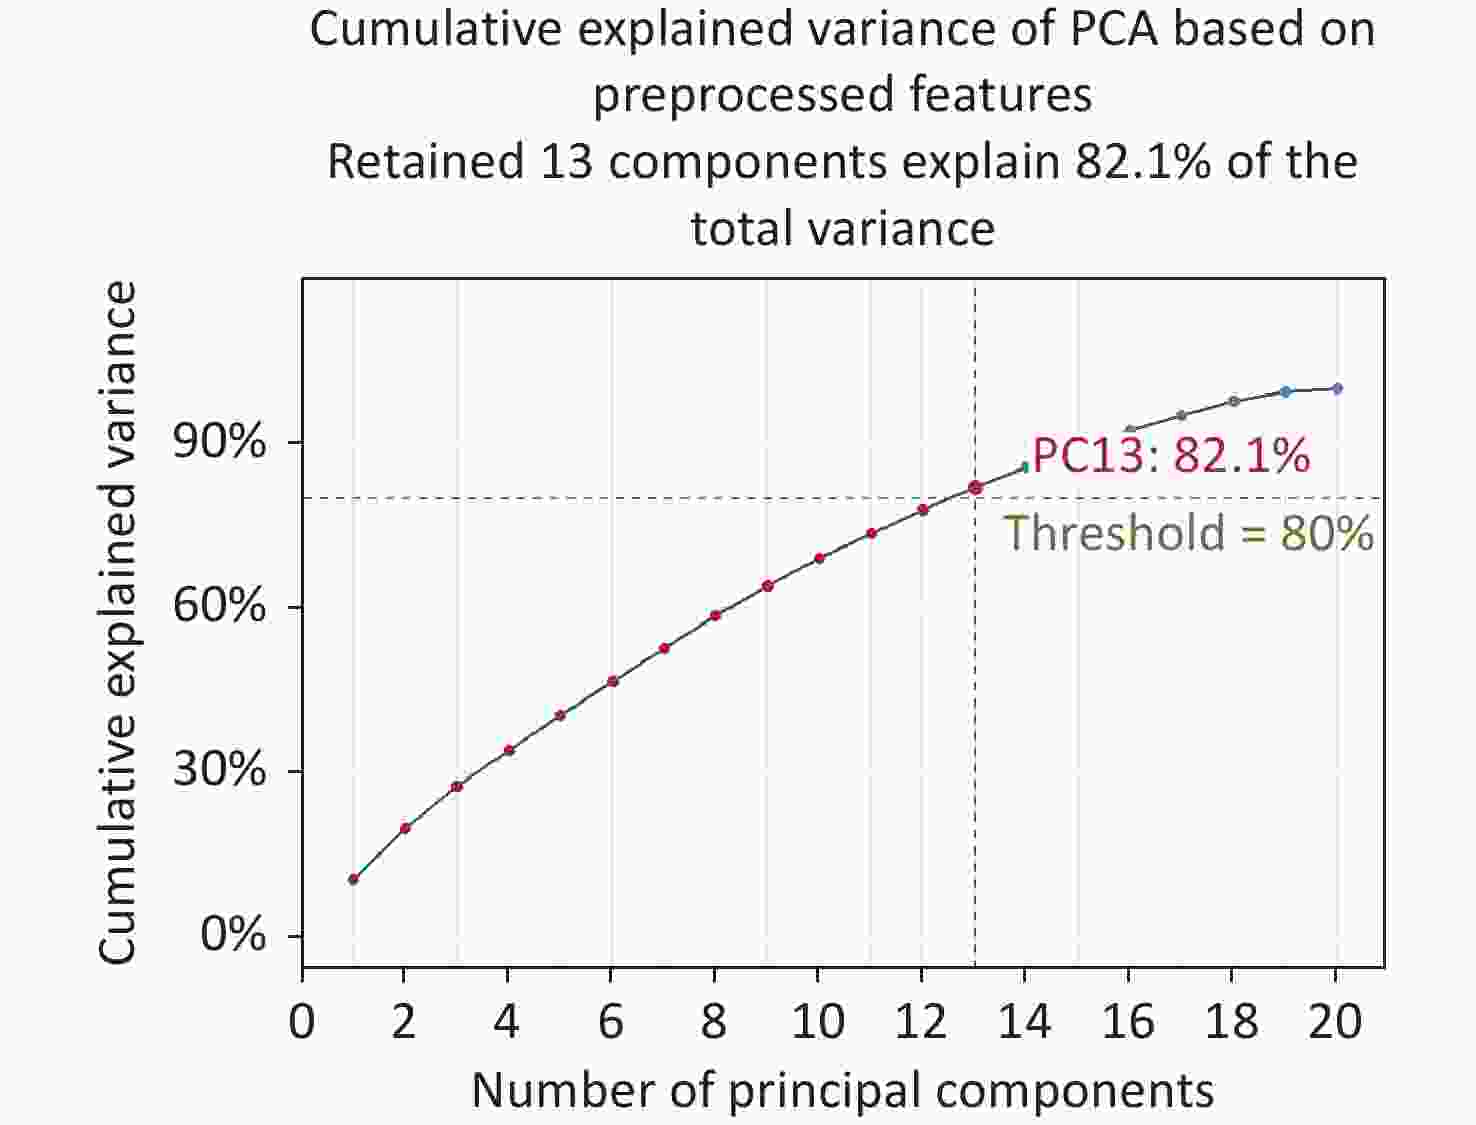
Figure 1. Cumulative explained variance of principal components based on preprocessed features. PCA, principal component analysis; PC, principal component.
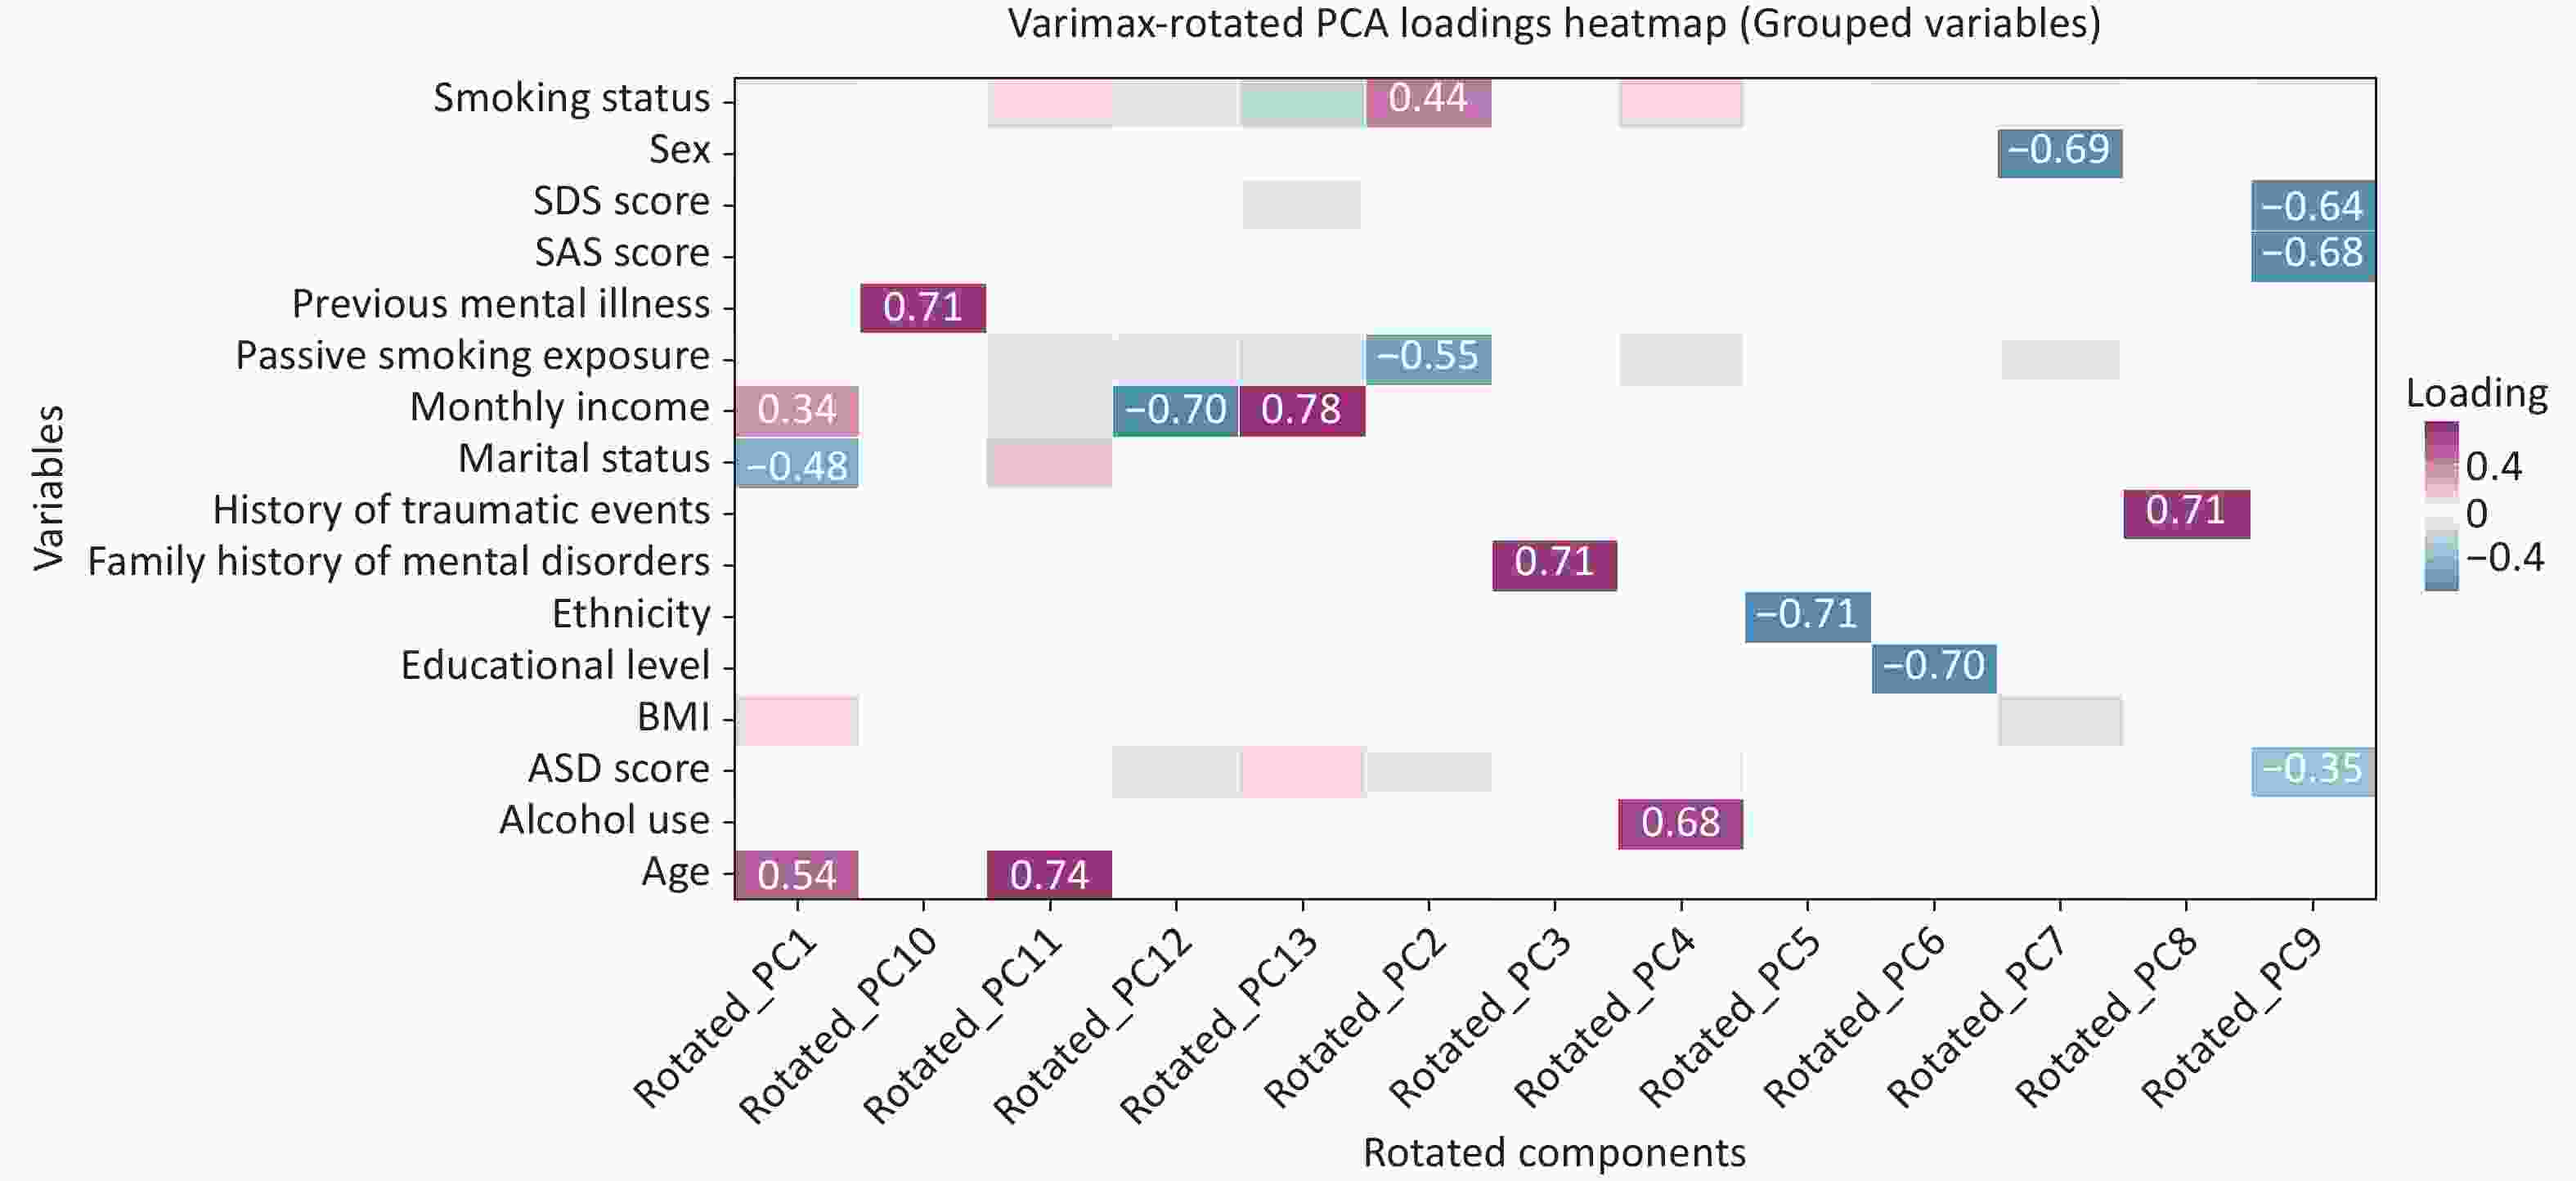
Figure 2. Varimax-rotated loading heatmap of the 13 retained principal components. SDS, self-rating depression scale; SAS, self-rating anxiety scale; BMI, body mass index; ASD, acute stress disorder.
-
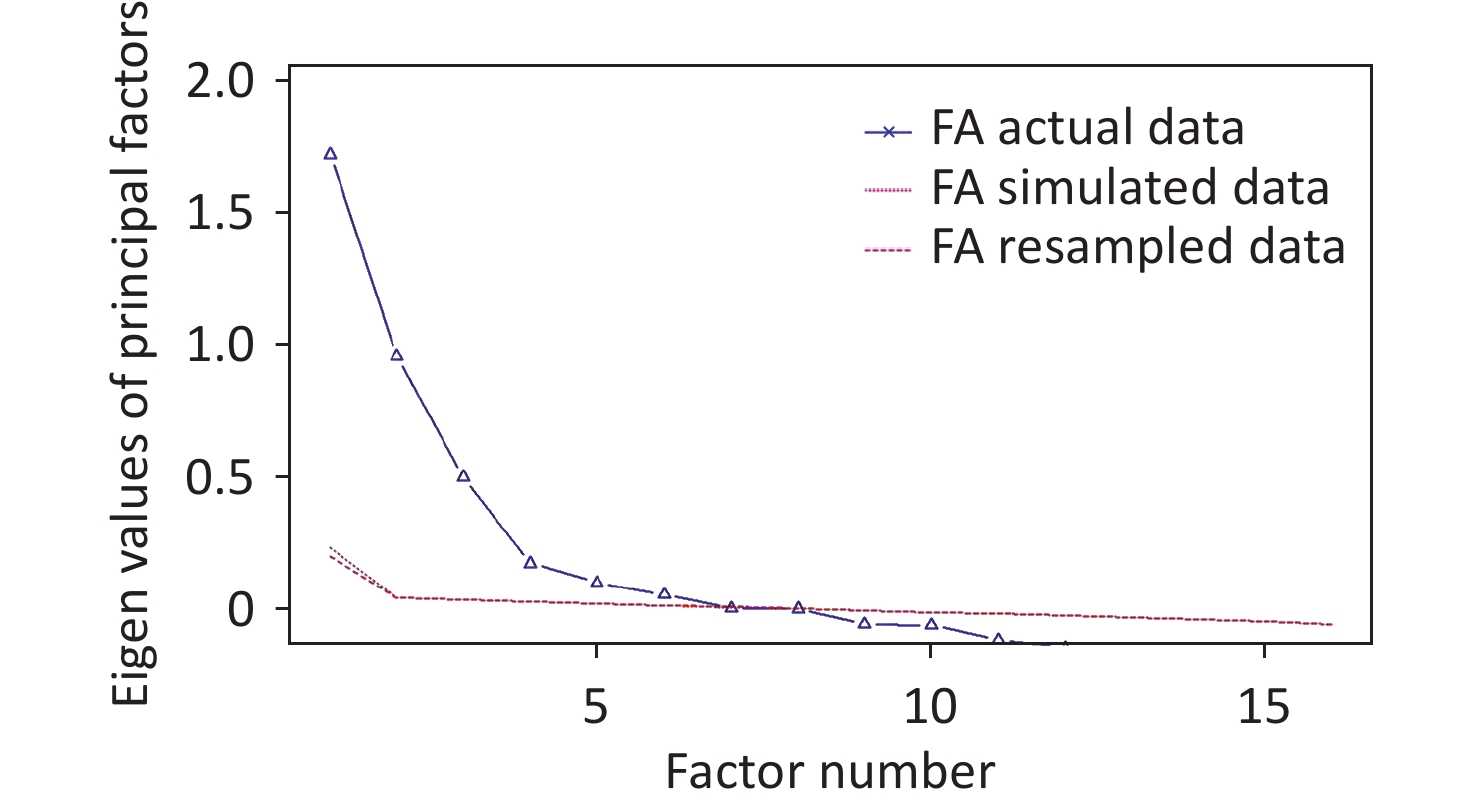
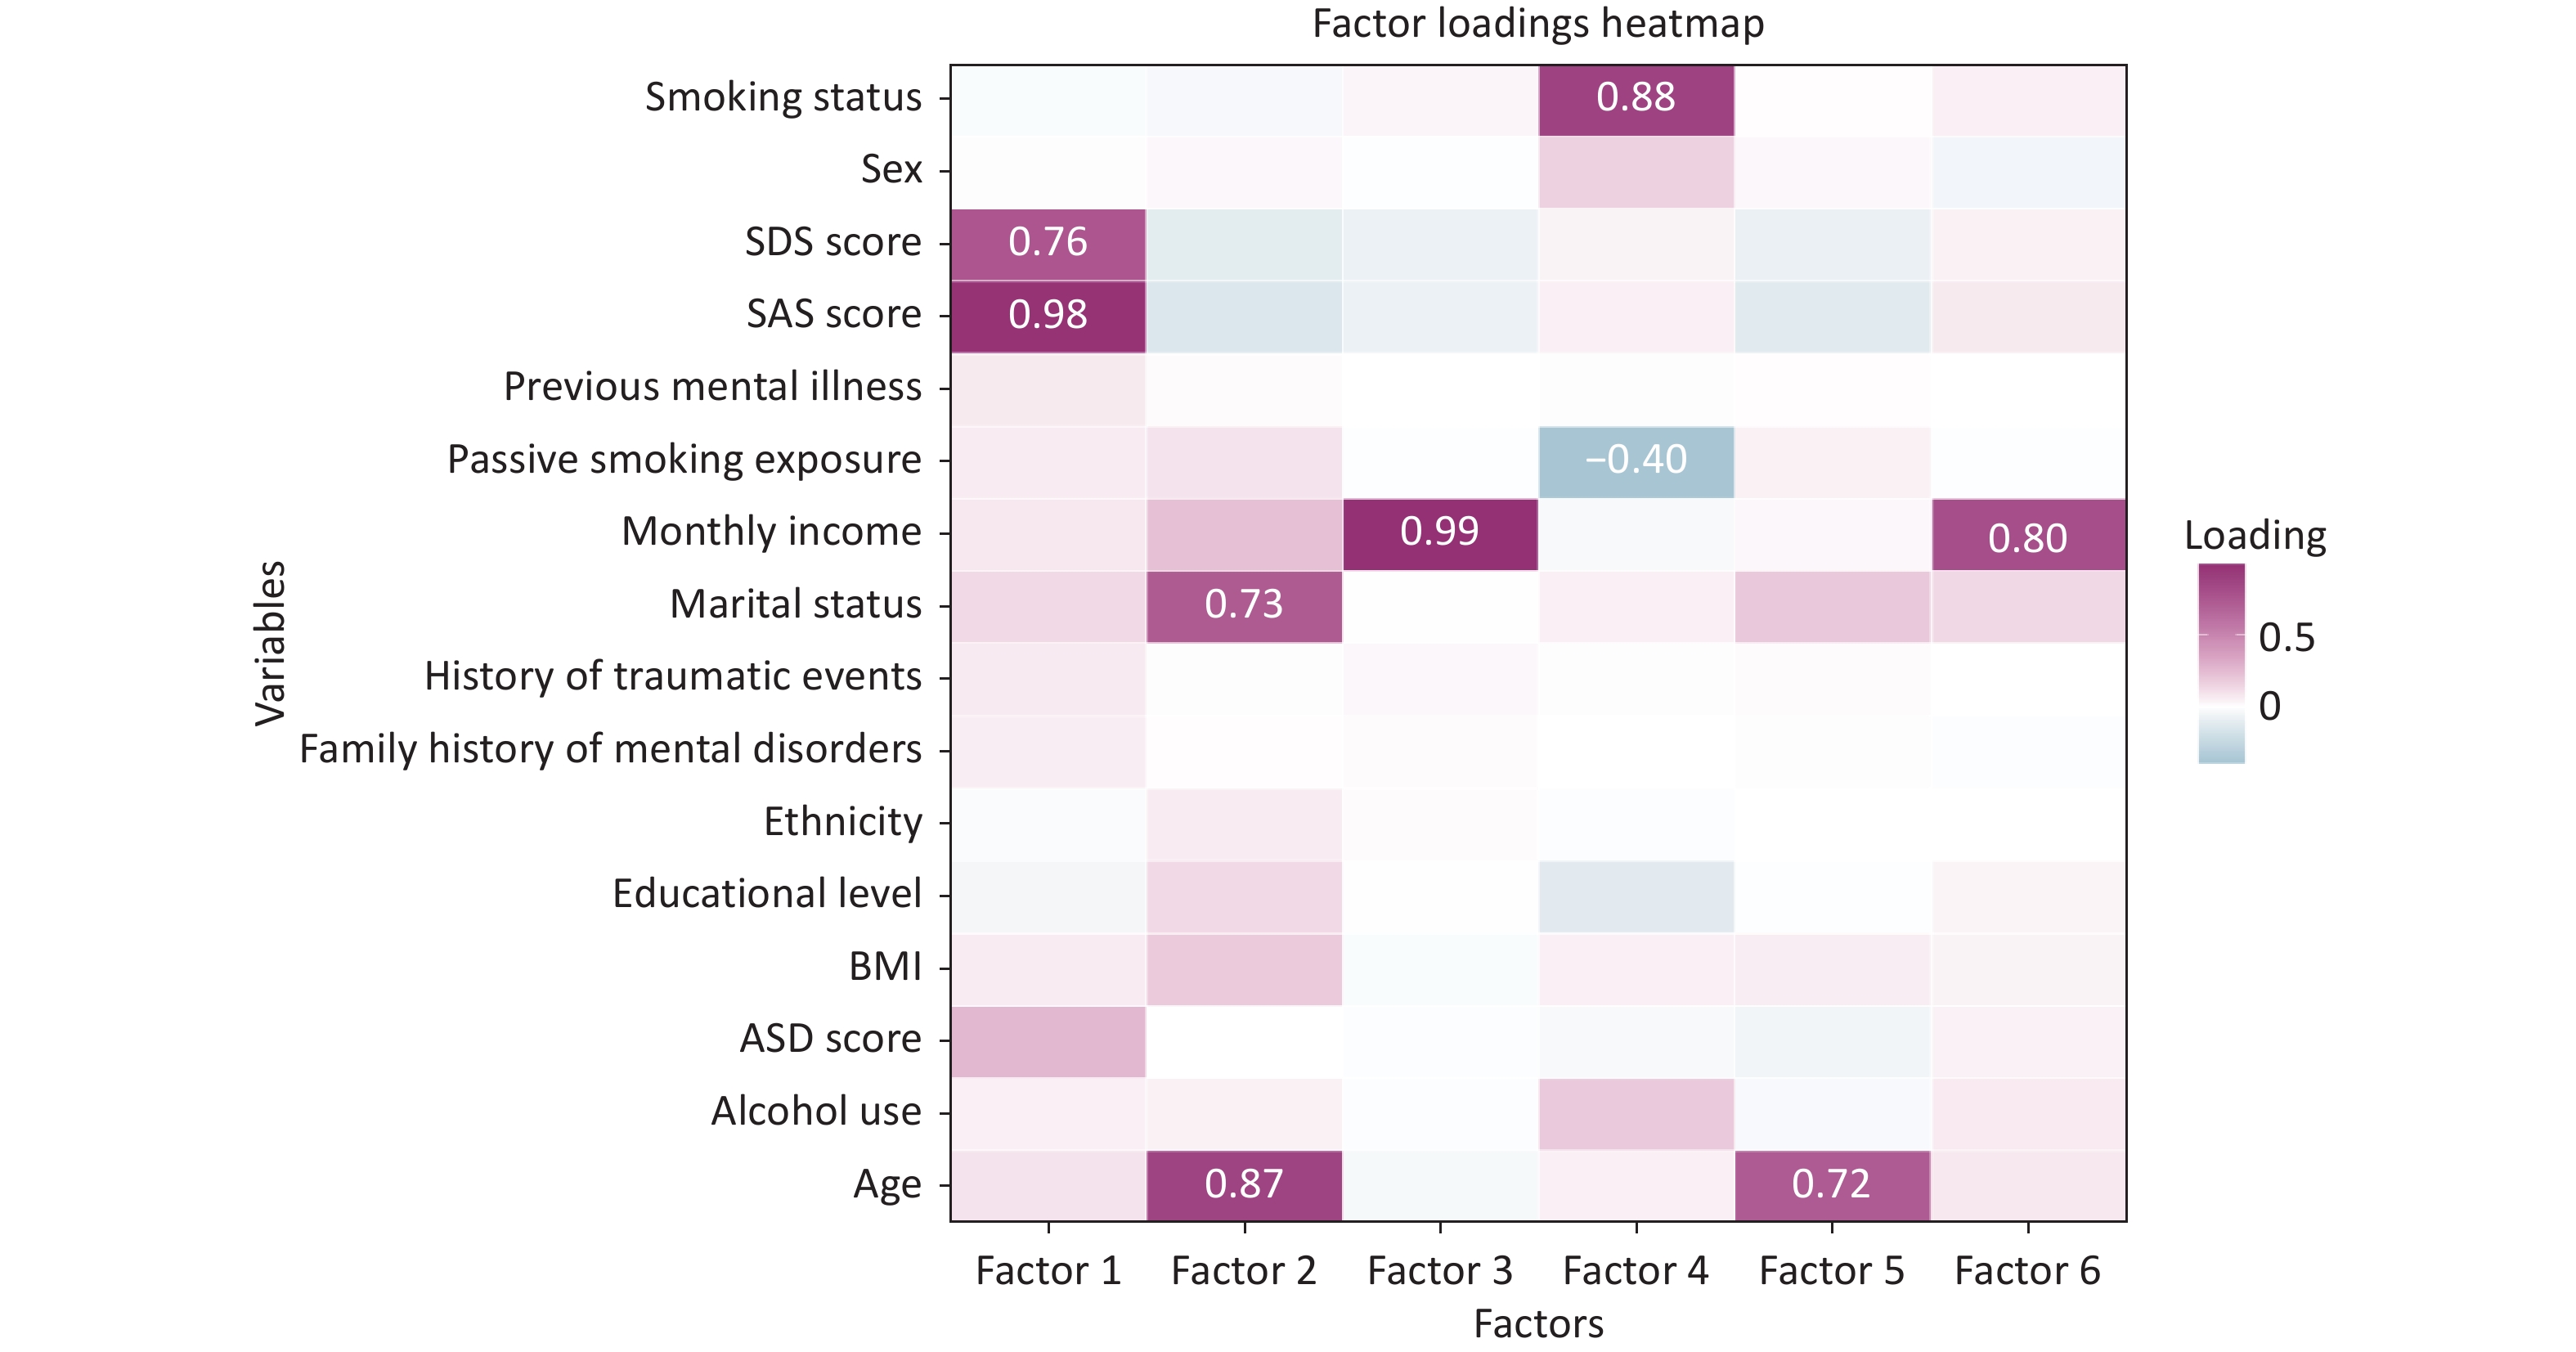
Parallel analysis indicated that six factors should be retained because the observed eigenvalues for the first six factors exceeded those from both the simulated and resampled data, whereas the seventh and subsequent factors no longer showed an obvious advantage (Figure 3). The factor loading heatmap further suggested that PTSD-related risk among rescue workers comprised multiple, relatively independent latent structures (Figure 4). Anxiety and depression scores loaded strongly on the same factor, indicating an emotional symptom dimension, whereas acute stress disorder scores loaded strongly on another factor, supporting an independent acute stress dimension. Smoking status showed the highest loading on its corresponding factor, and passive smoking also contributed to it, highlighting a smoking-related behavioral dimension. Age, marital status, monthly family income per capita, previous mental illness, and family history of mental illness also loaded substantially on different factors, indicating that demographic background and psychiatric vulnerability were closely related to PTSD risk[24,25].
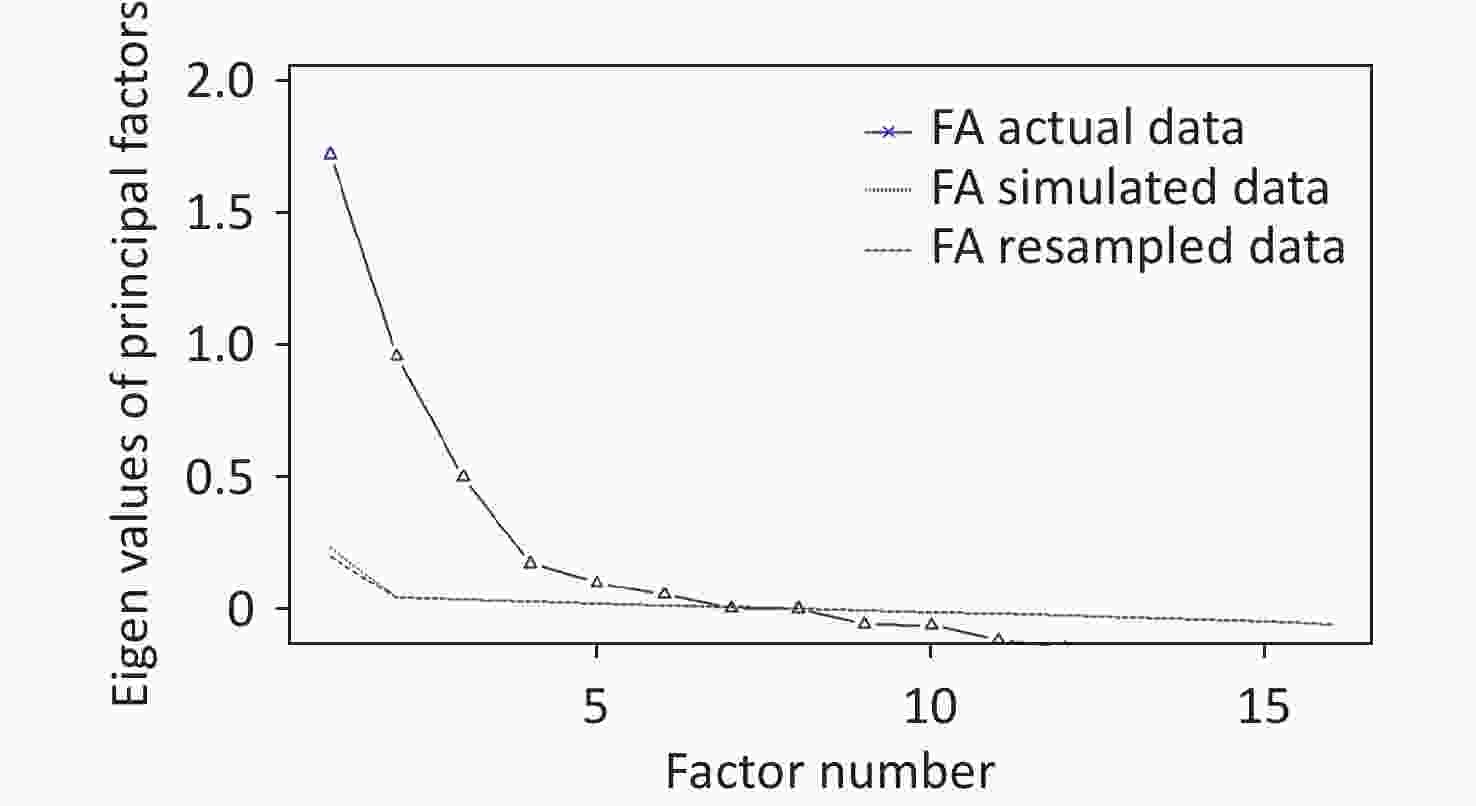
Figure 3. Parallel analysis for factor retention.FA, factor analysis.
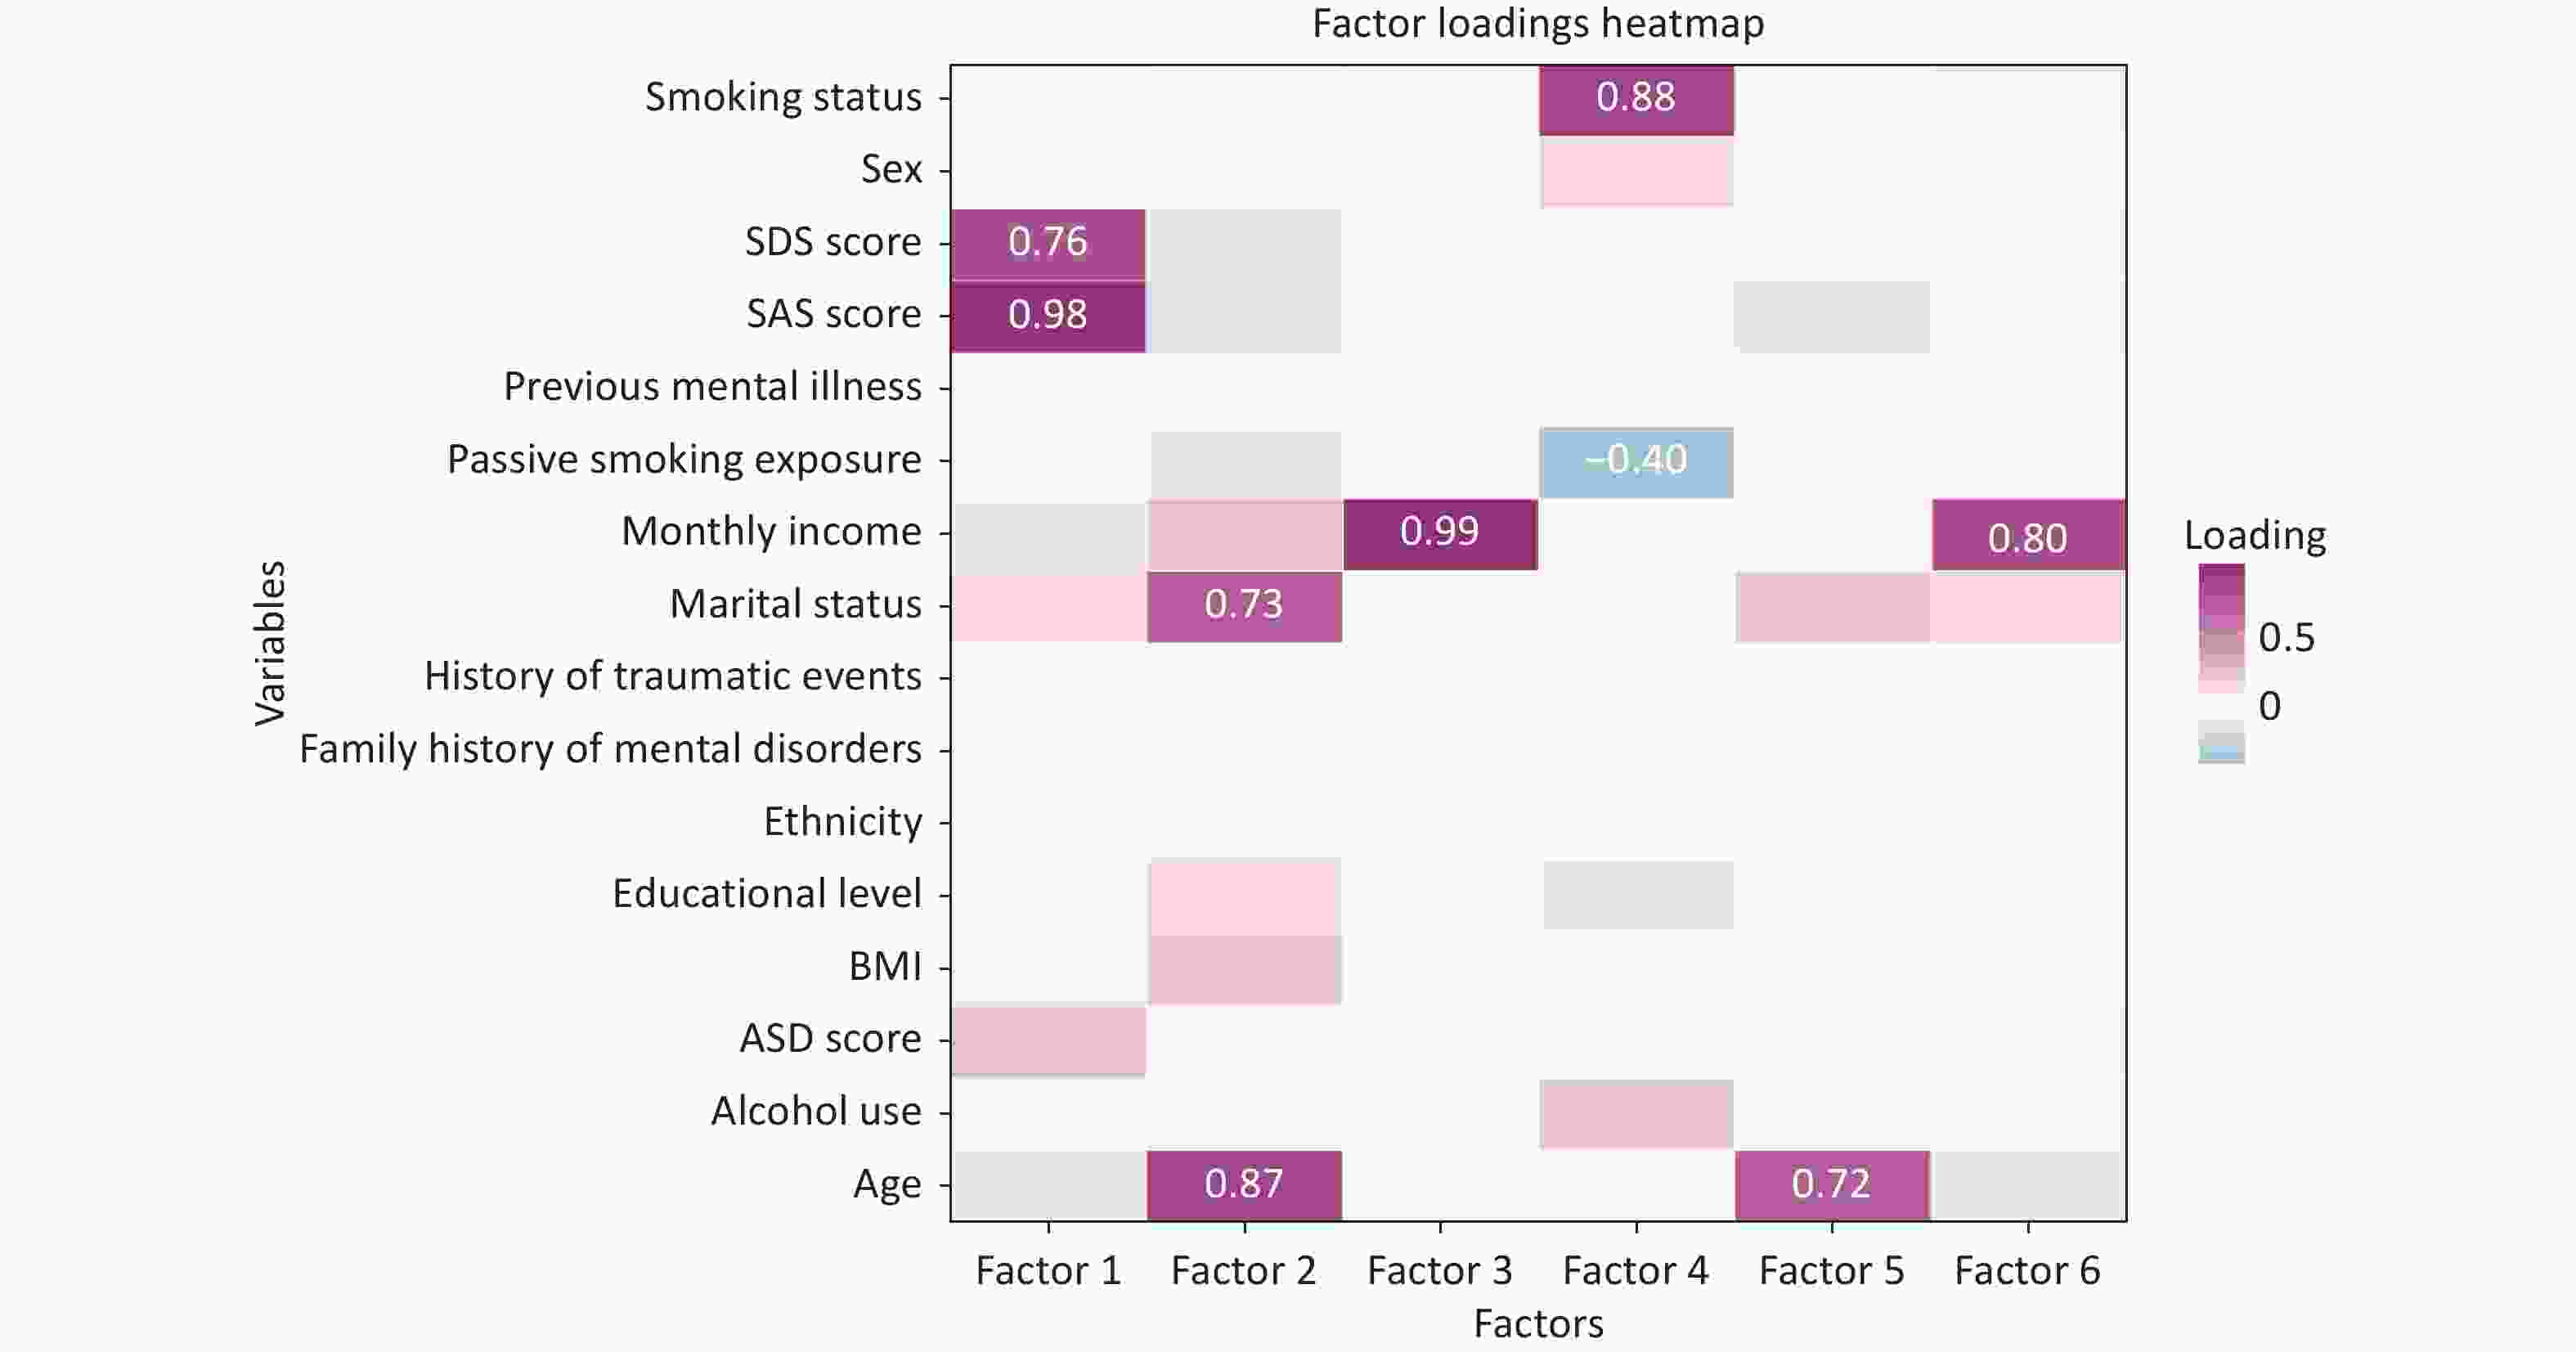
Figure 4. Loading heatmap of the six retained common factors. SDS, self-rating depression scale; SAS, self-rating anxiety scale; BMI, body mass index; ASD, acute stress disorder.
-
In the internal validation, the PCA-based models showed high AUC values, but their rankings differed across performance indicators. Linear SVM had the highest internal validation AUC, followed by XGBoost, random forest, GBM, and multilayer perceptron. In the external validation, PCA-XGBoost achieved the highest AUC among the PCA-based models (AUC = 0.8931), with accuracy of 0.9753, sensitivity of 0.6596, specificity of 0.9788, PPV of 0.2520, and NPV of 0.9962. PCA-GBM and PCA-random forest achieved similar external AUC values (0.8929 and 0.8903, respectively), whereas PCA-random forest showed a higher sensitivity (0.7447) than PCA-XGBoost (Table 2).
Model Internal validation External validation AUC Accuracy Sensitivity Specificity PPV NPV AUC Accuracy Sensitivity Specificity PPV NPV Linear SVM 0.9829 0.8881 0.9796 0.8858 0.1758 0.9994 0.8894 0.9201 0.7234 0.9222 0.0916 0.9968 XGBoost 0.9805 0.9646 0.8571 0.9673 0.3944 0.9963 0.8931 0.9753 0.6596 0.9788 0.2520 0.9962 Multilayer perceptron 0.9662 0.9411 0.9082 0.9419 0.2799 0.9976 0.8390 0.9500 0.6596 0.9531 0.1325 0.9961 Random forest 0.9787 0.9108 0.9490 0.9099 0.2076 0.9986 0.8903 0.9229 0.7447 0.9249 0.0971 0.9970 GBM 0.9694 0.9217 0.9082 0.9221 0.2247 0.9975 0.8929 0.9435 0.6915 0.9462 0.1224 0.9965 Kernel SVM 0.9611 0.8908 0.9082 0.8904 0.1708 0.9974 0.8773 0.9275 0.7128 0.9298 0.0993 0.9967 AdaBoost 0.9619 0.8702 0.9286 0.8688 0.1497 0.9980 0.8780 0.8983 0.7128 0.9003 0.0720 0.9965 Logistic regression 0.9368 0.9361 0.7041 0.9419 0.2315 0.9922 0.8745 0.9614 0.6489 0.9648 0.1667 0.9961 Decision tree 0.9247 0.8576 0.8776 0.8571 0.1325 0.9965 0.8568 0.8546 0.7234 0.8561 0.0517 0.9965 Note. AUC, area under the curve; NPV, negative predictive value; PPV, positive predictive value. Metrics were calculated using the Youden threshold. Table 2. Performance of machine-learning models based on 13 principal components
Overall, PCA-XGBoost showed favorable AUC-based performance and relatively high specificity and PPV in the external validation, whereas PCA-random forest provided higher sensitivity[26]. These findings indicate that the relative performance of PCA-based models varied across evaluation metrics, and that model selection should be aligned with the intended screening objective. Additional related evaluation results, including DeLong tests, calibration indices, Brier scores, and decision-curve analysis, are presented in Supplementary Tables S6–S9. In the PCA route, DeLong tests showed that the external AUC of PCA-XGBoost was not significantly different from those of PCA-GBM, PCA-random forest, or PCA-Linear SVM after Holm correction, indicating that its AUC advantage should be interpreted cautiously. Nevertheless, PCA-XGBoost had the lowest Brier score among the PCA-based models and showed a positive net benefit across the selected threshold range in the decision-curve analysis, supporting its interpretation as a candidate model with a relatively balanced external-validation performance.
-
The factor-analysis route exhibited a performance pattern different from that of the PCA route. In the internal validation, random forest had the highest AUC, followed by XGBoost, multilayer perceptron, and GBM, suggesting that tree-based ensemble models performed well on the common-factor feature set. In the external validation, FA-XGBoost achieved the highest AUC among the factor-analysis-based models (AUC = 0.8832) with an accuracy of 0.9273, sensitivity of 0.7340, specificity of 0.9294, PPV of 0.1013, and NPV of 0.9969. AdaBoost and GBM also maintained relatively high external AUC values, whereas FA-random forest showed the highest sensitivity (0.7447) but a lower AUC than FA-XGBoost (Table 3).
Model Internal validation External validation AUC Accuracy Sensitivity Specificity PPV NPV AUC Accuracy Sensitivity Specificity PPV NPV XGBoost 0.9450 0.9101 0.8776 0.9109 0.1968 0.9967 0.8832 0.9273 0.7340 0.9294 0.1013 0.9969 Random forest 0.9514 0.8814 0.8980 0.8810 0.1580 0.9971 0.8425 0.8937 0.7447 0.8953 0.0716 0.9969 Multilayer perceptron 0.9321 0.8905 0.8469 0.8916 0.1627 0.9957 0.8590 0.9160 0.6702 0.9186 0.0820 0.9961 GBM 0.9297 0.8829 0.9082 0.8822 0.1609 0.9974 0.8705 0.9044 0.7234 0.9064 0.0774 0.9967 AdaBoost 0.9078 0.8658 0.8673 0.8657 0.1384 0.9962 0.8761 0.8903 0.7128 0.8922 0.0669 0.9965 Decision tree 0.8677 0.8903 0.8367 0.8916 0.1611 0.9955 0.8591 0.9150 0.7234 0.9171 0.0865 0.9967 Kernel SVM 0.7741 0.9069 0.5918 0.9147 0.1472 0.9890 0.8404 0.9211 0.5957 0.9246 0.0790 0.9953 Logistic regression 0.7637 0.8331 0.6020 0.8388 0.0850 0.9883 0.8281 0.7843 0.6383 0.7859 0.0313 0.9950 Linear SVM 0.7614 0.9000 0.5612 0.9084 0.1322 0.9881 0.8286 0.8825 0.5957 0.8856 0.0535 0.9951 Note. AUC, area under the curve; PPV, positive predictive value; NPV, negative predictive value. Table 3. Performance of machine-learning models based on six common factors
Together, the factor-analysis-based results suggest that XGBoost provided stronger discrimination in the external-validation dataset, whereas random forest retained an advantage in identifying PTSD-positive individuals[27,28]. This pattern indicates that the common-factor feature space[24,25] did not lead to a single uniformly superior algorithm; instead, the preferred model varied according to whether the evaluation focused on overall discrimination or sensitivity-oriented screening. For the factor-analysis route, DeLong tests showed that FA-XGBoost had significantly higher external AUCs than FA-Linear SVM and FA-Logistic Regression after Holm correction, whereas its differences from FA-AdaBoost, FA-GBM, FA-Decision Tree, FA-Multilayer Perceptron, FA-random forest, and FA-Kernel SVM were not statistically significant. FA-XGBoost also exhibited the lowest Brier score among the factor-analysis-based models and a positive net benefit at low threshold probabilities, suggesting a relatively favorable probability prediction and potential screening value.
-
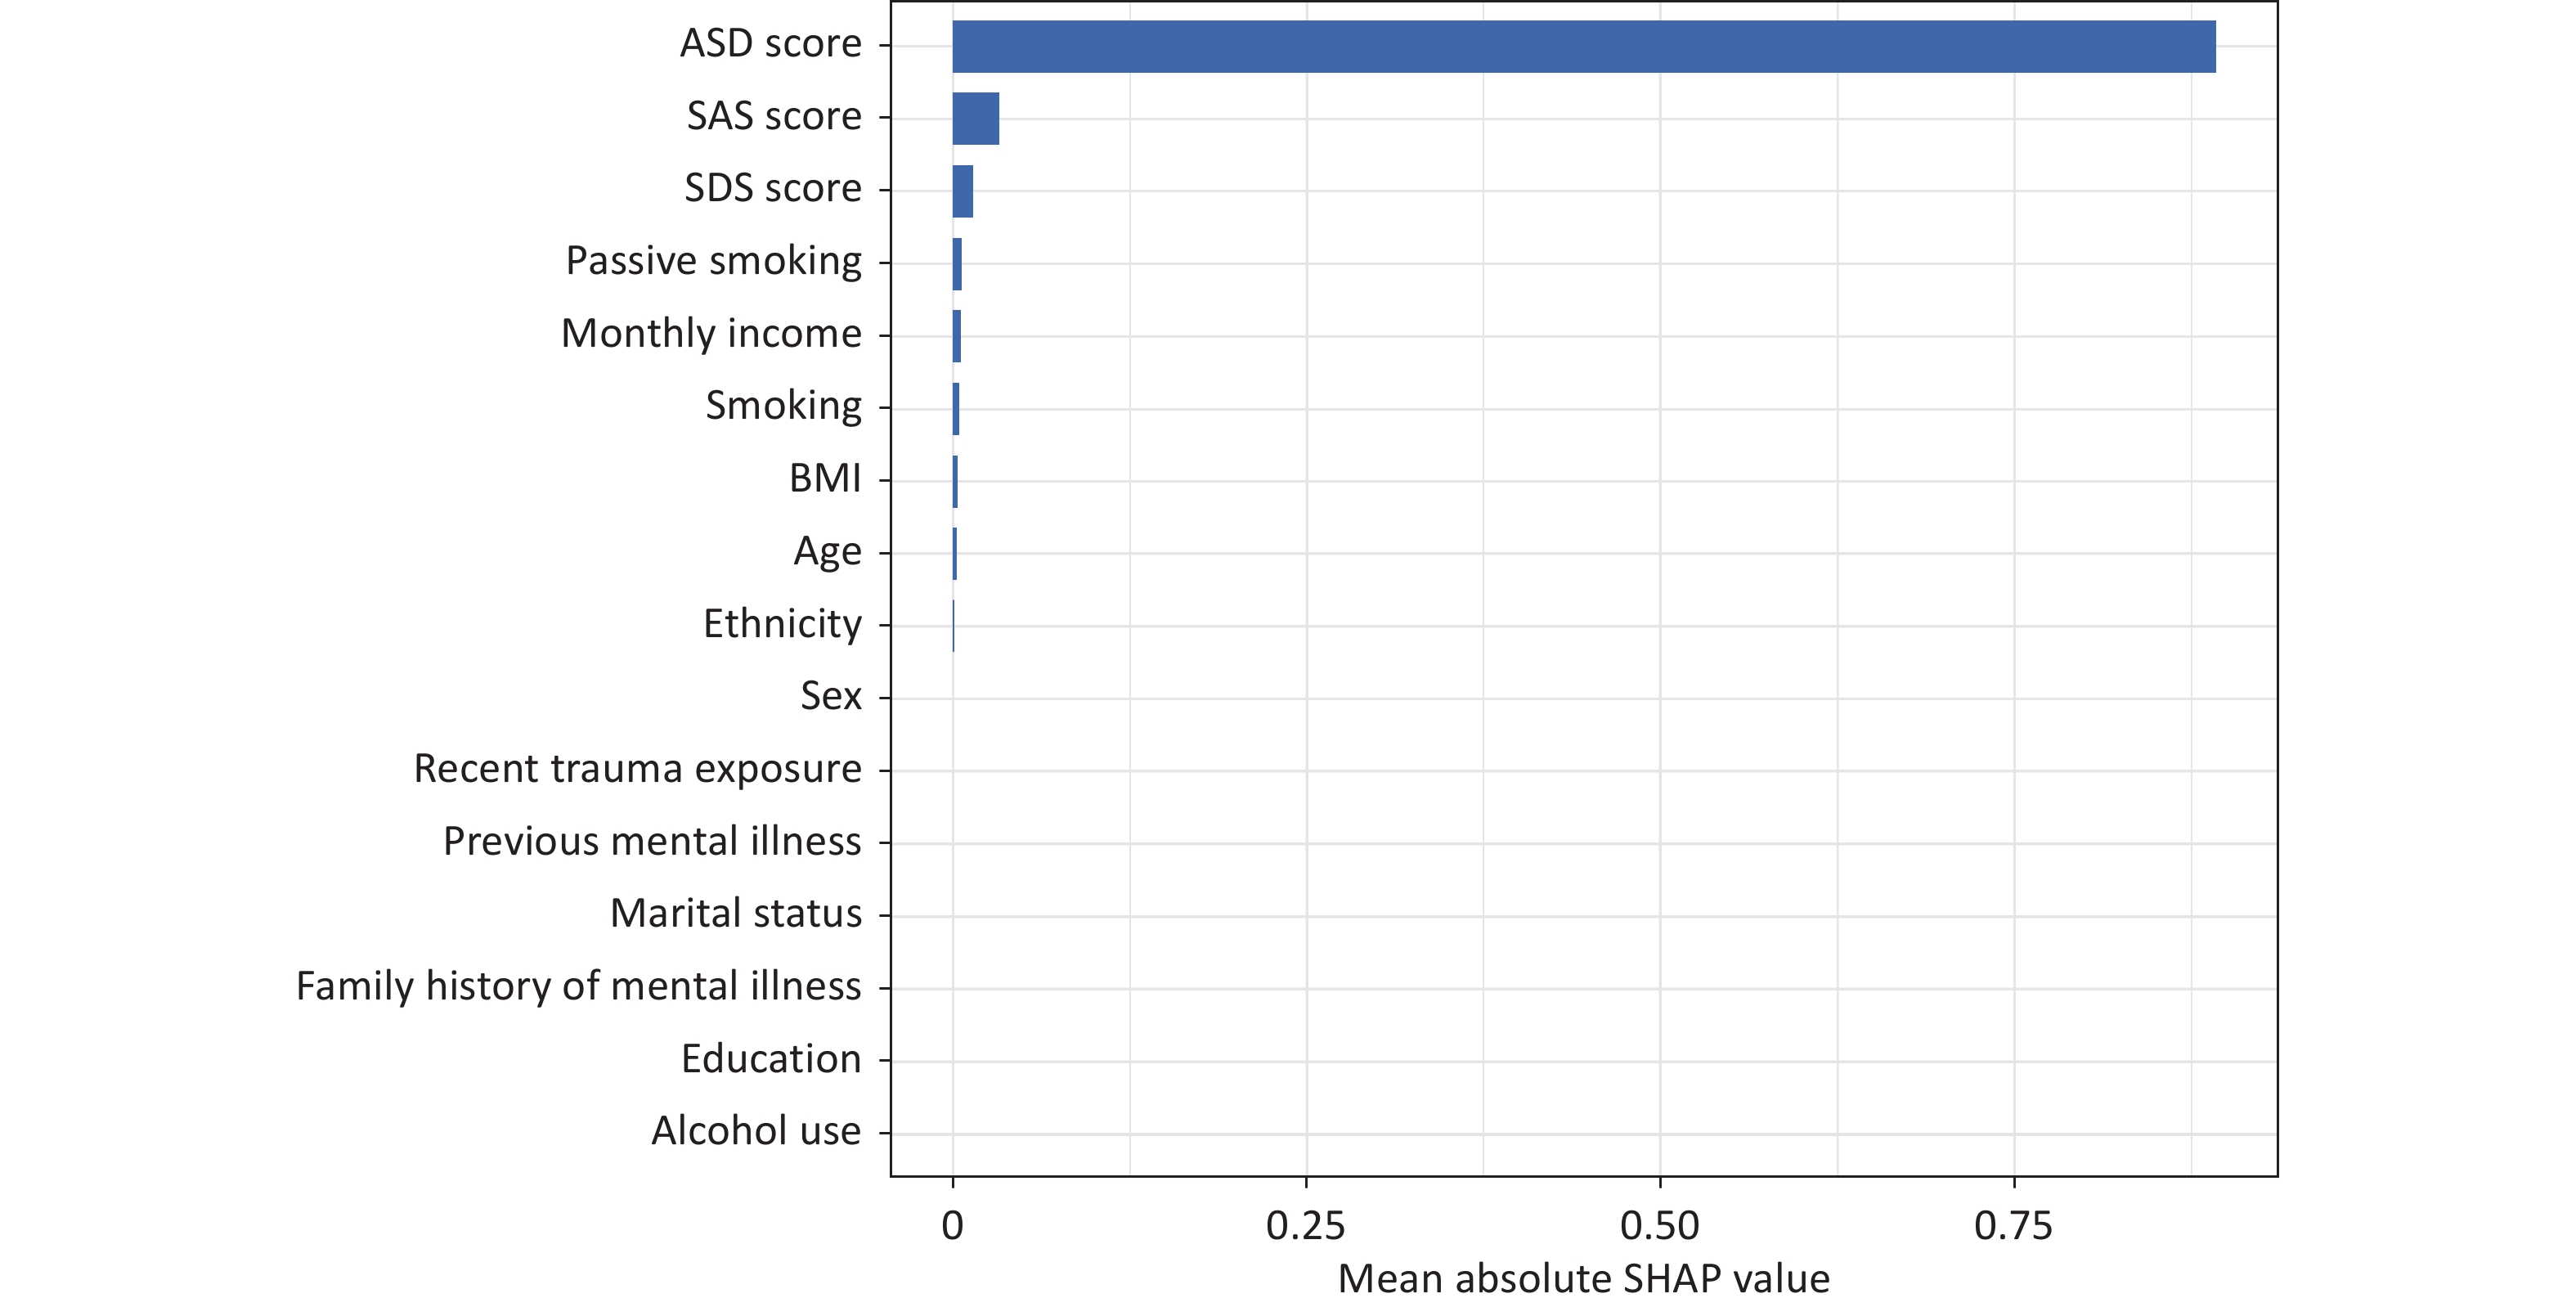
To improve the predictor-level interpretability, SHAP analysis was performed using the original-variable XGBoost model in the external-validation dataset. The mean absolute SHAP values showed that the ASD score was the dominant contributor to model prediction, followed by the SAS score, SDS score, passive smoking, monthly family income, smoking status, BMI, and age (Figure 5). Other variables, including ethnicity, sex, recent trauma exposure, previous mental illness, marital status, family history of mental illness, education, and alcohol use made relatively small contributions to this model. These findings indicate that acute stress symptoms and emotional distress provided the strongest prediction signals, whereas lifestyle and socioeconomic variables provided additional information for PTSD risk recognition. Because the SHAP values quantify predictive contributions rather than causal effects, these results are interpreted as model-based importance patterns.
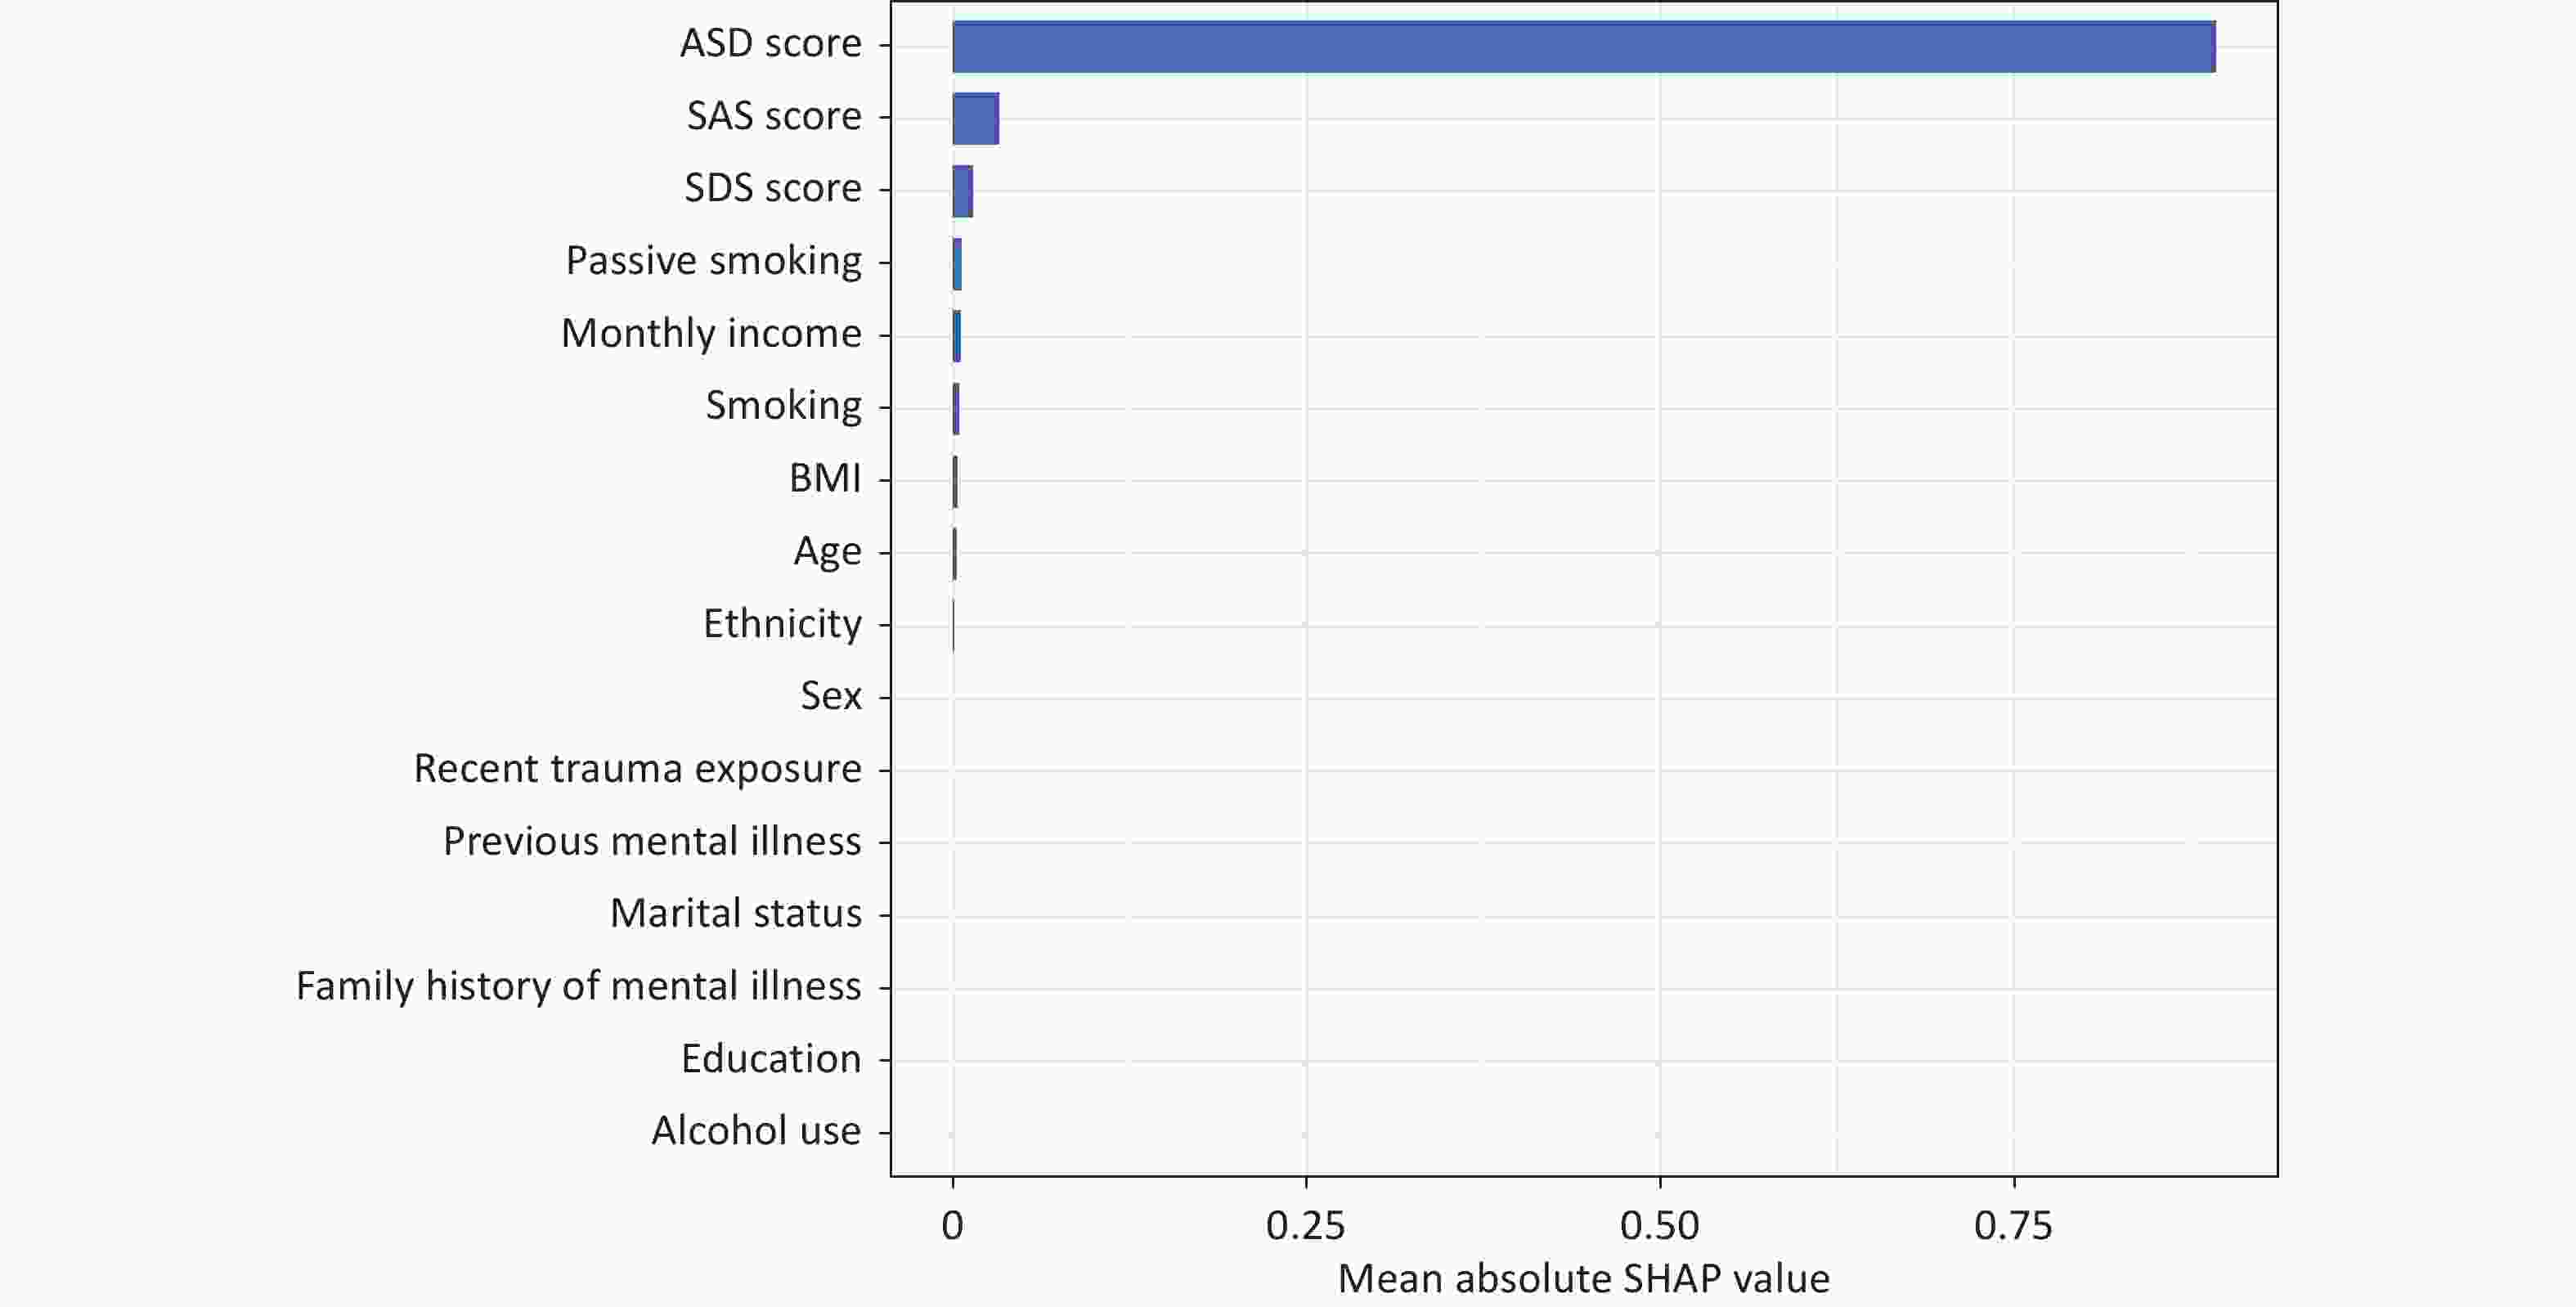
Figure 5. SHAP feature importance of the XGBoost model in external validation. ASD, acute stress disorder; SAS, self-rating anxiety scale; SDS, self-rating depression scale; BMI, body mass index..
-
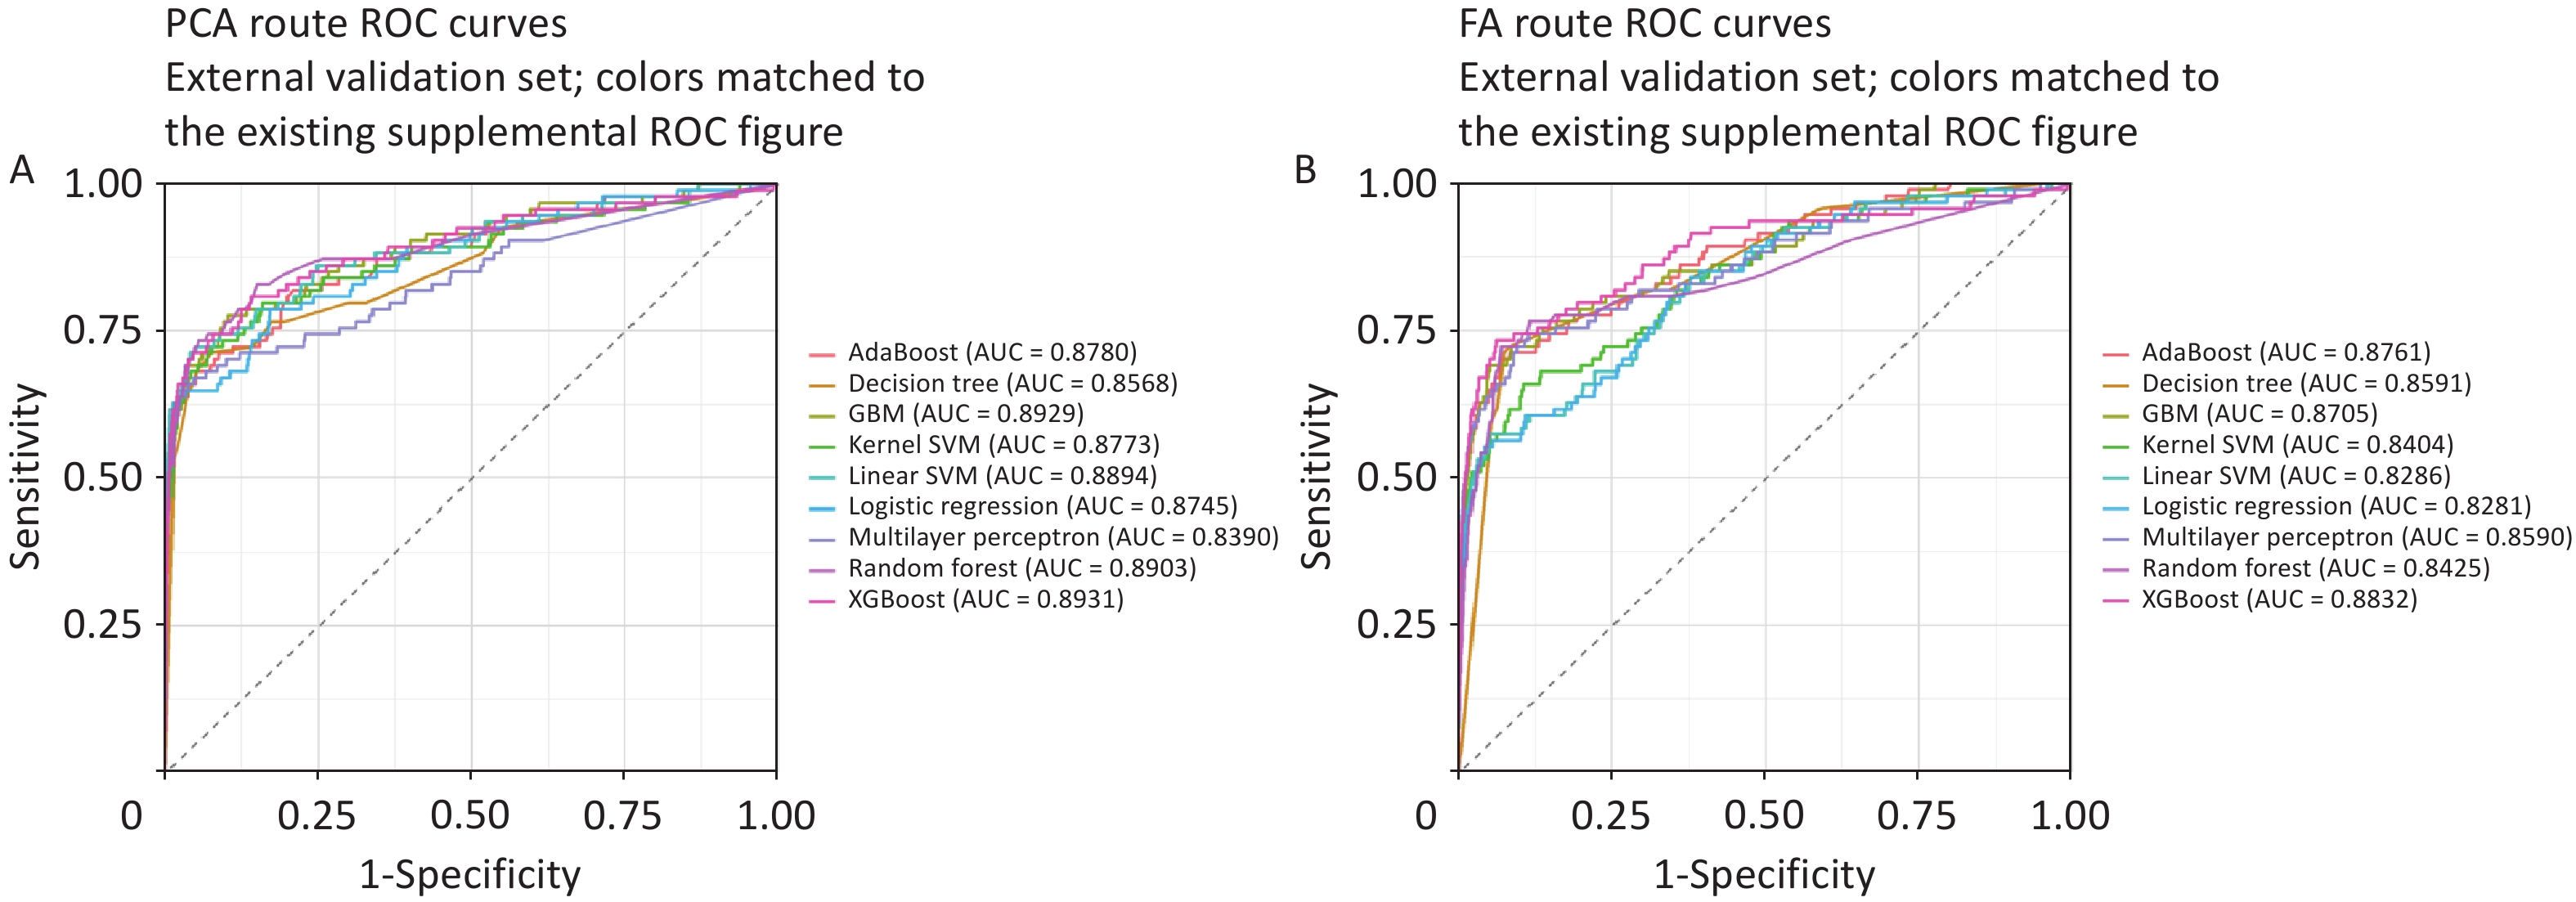
Figure 6 compares the receiver operating characteristic curves of the machine-learning models in the external-validation dataset under the two dimensionality-reduction approaches. All external ROC curves were above the reference diagonal, indicating better discriminatory ability than chance. Under the PCA route, XGBoost, GBM, random forest, and linear SVM showed similarly favorable external ROC performances. Under the factor-analysis route, XGBoost achieved the highest external AUC, followed by AdaBoost and GBM, whereas random forest exhibited a sensitivity-oriented advantage despite a lower external AUC.
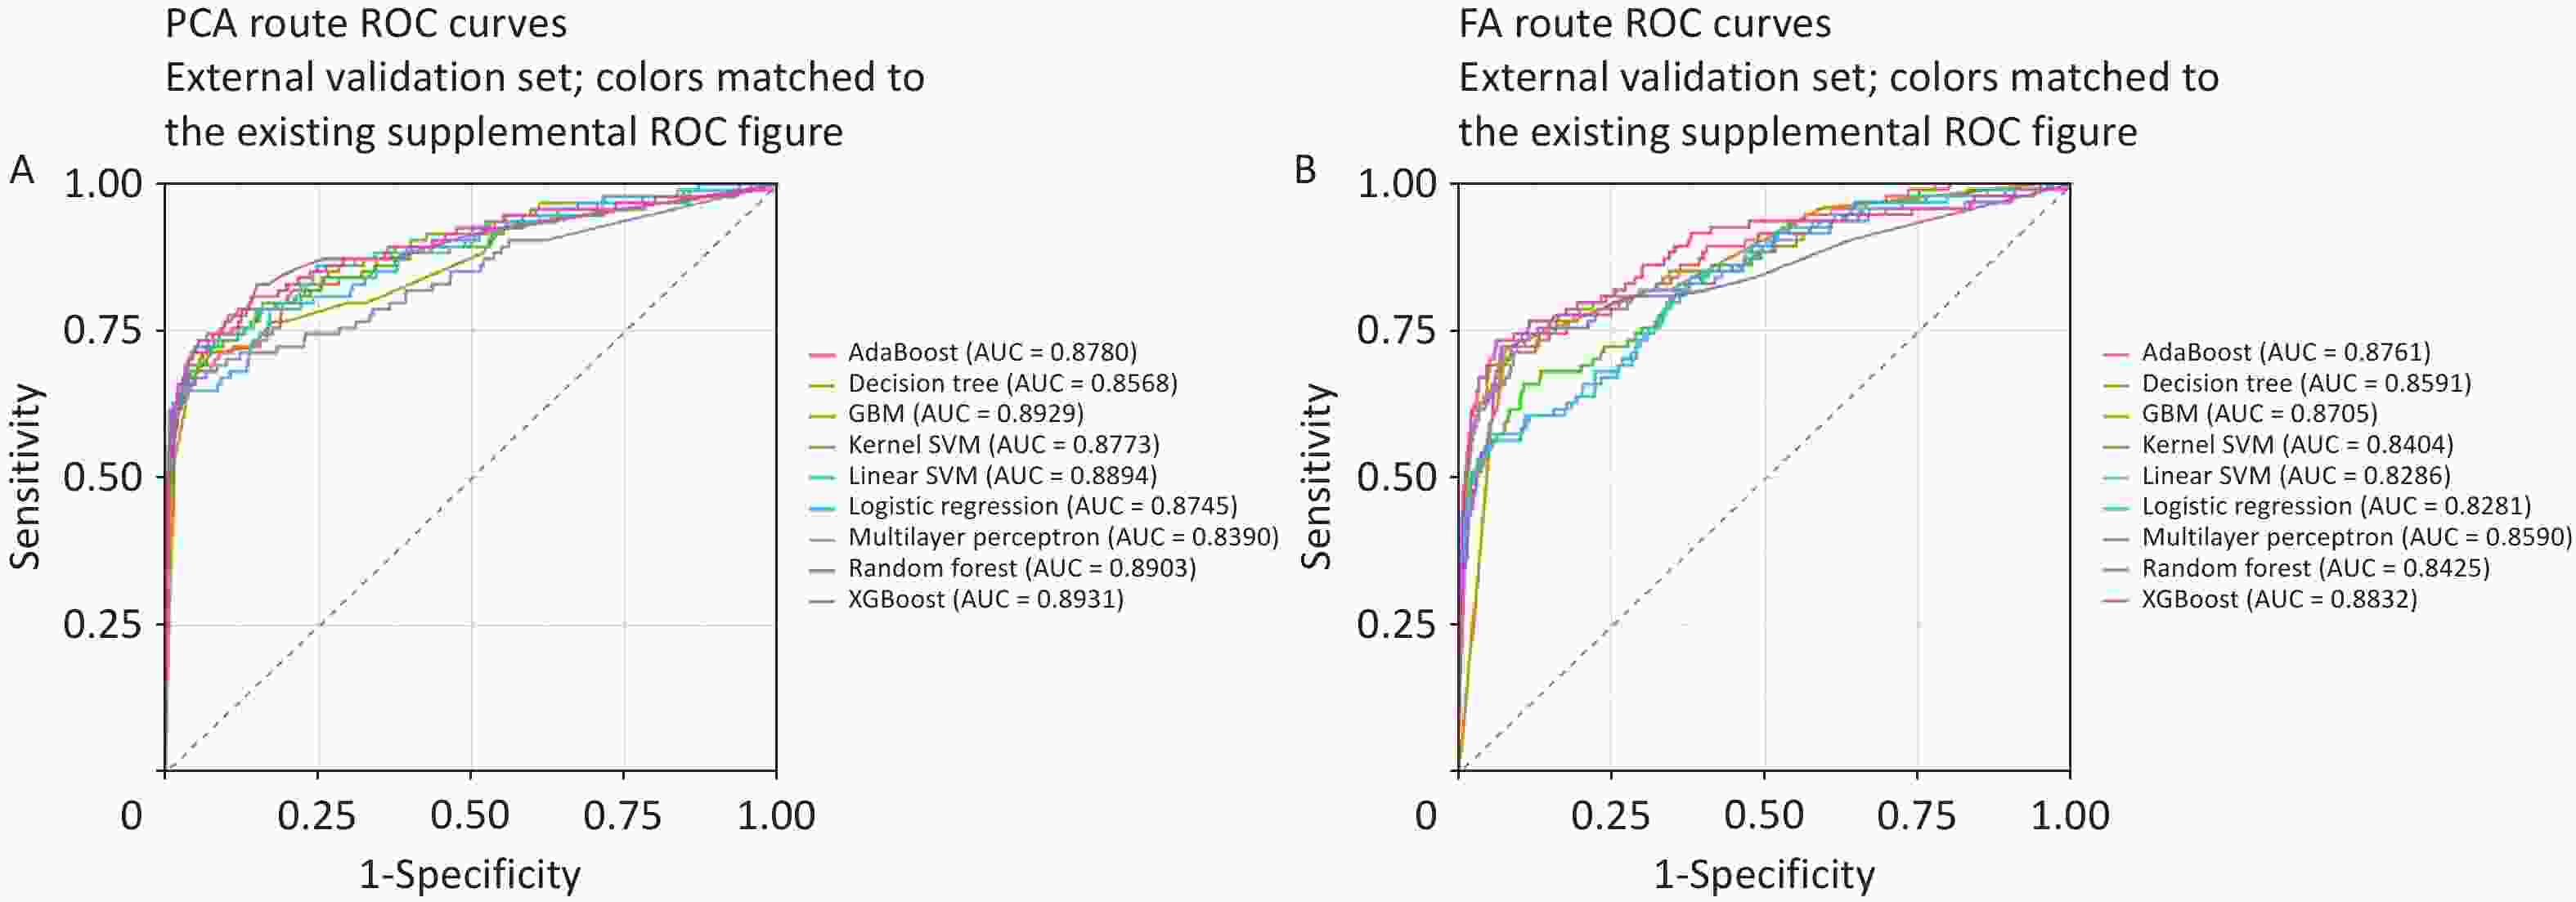
Figure 6. Receiver operating characteristic curves of machine-learning models in external validation. Panel A shows PCA-based models; Panel B shows factor-analysis-based models. AUC, area under the curve; ROC, receiver operating characteristic.
-
Stratification of PTSD risk in rescue workers is important for protecting occupational mental health and maintaining the quality of rescue operations. Using multicenter health-archive data, this study systematically compared nine machine-learning algorithms across two dimensionality-reduction strategies and evaluated their generalizability in both internal and external-validation samples. To the best of our knowledge, few studies have simultaneously compared PCA- and factor-analysis-based feature representations in rescue workers while performing external validation.
Recent evidence further suggests that active first responders continue to face a substantial global burden of PTSD, with heterogeneity across occupational roles and economic settings[29]. A 2025 cross-sectional study of New Zealand firefighters and emergency responders reported a probable PTSD prevalence of 13%, further supporting the persistently high-risk profile of rescue occupations[30].
Both dimensionality-reduction strategies yielded informative low-dimensional representations. PCA retained 13 principal components, explaining 82.1% of the total variance, thereby preserving most of the original information while reducing redundancy and multicollinearity. Factor analysis retained six common factors based on parallel analysis, producing a compact set of latent variables that remained interpretable. The loading patterns from both approaches consistently suggested that the included predictors could be summarized into multiple latent dimensions spanning psychological symptoms, smoking-related exposure, trauma burden, socioeconomic circumstances, and psychiatric vulnerability. Combined with model performance and interpretation analyses, these latent dimensions appeared to contribute differently to PTSD risk recognition[29-32].
These findings are also consistent with previous work suggesting that dimensionality-reduction methods may improve modeling efficiency in trauma-related prediction tasks[31]. In addition, a recent systematic review and meta-analysis reported that machine-learning approaches for PTSD identification generally achieved high overall accuracy and that algorithms such as SVM were widely used[32]. Other reviews have noted that many machine-learning findings are broadly consistent with existing theoretical models; however, reporting quality, bias control, and external validation still require improvement[19].
The optimal models differed according to the feature representation. Under the PCA route, XGBoost showed the best external performance, followed by GBM, random forest, and linear SVM. This pattern suggests that ensemble methods are particularly effective in leveraging independent principal components and capturing nonlinear relationships and interactions. Under the factor-analysis route, XGBoost achieved the highest external AUC, whereas random forest showed a sensitivity-oriented advantage despite a lower external AUC. Additional DeLong tests, calibration indices, Brier scores, and decision-curve analyses further indicated that no single model was uniformly superior across all evaluation dimensions. Therefore, model selection should consider the intended use; XGBoost showed relatively balanced discrimination and probability prediction, whereas random forest provided a sensitivity-oriented alternative for reducing missed PTSD-positive cases, implying that when predictors are condensed into a smaller number of latent common factors, several flexible nonlinear learners may achieve robust performance, but random forest may be particularly stable.
Across analyses, anxiety and depression symptoms emerged as core predictors, consistent with prior evidence that PTSD commonly co-occurs with other negative emotional states in first responders[33,34]. Smoking-related behavior also showed clear importance. Smoking may function as a behavioral marker of distress, an attempted coping strategy, or a correlate of chronic dysregulation, thereby contributing to an elevated risk of PTSD[35]. In addition, a family history of mental disorders, previous mental illness, and trauma exposure also contributed meaningfully, suggesting that screening tools for rescue workers should consider psychiatric vulnerability and occupational stress exposure together rather than focusing on symptoms alone[36].
This study has several strengths. First, it used both internal and independent external validations, allowing for a more realistic assessment of model generalizability. Second, the model-interpretation analyses linked predictive patterns back to clinically meaningful domains, which improved the interpretability of the machine-learning results. Several limitations should also be acknowledged. This study was cross-sectional; therefore, the associations should not be interpreted with causality. Selection bias is possible because some workers experiencing psychological stress may have avoided participating in the study. The set of candidate predictors, although broad, did not include all potentially relevant factors such as detailed smoking and alcohol history, social support, and years of service. Finally, the sample was overwhelmingly male, which may have limited the applicability of the findings to sex-balanced rescue populations.
Future studies should incorporate a longitudinal follow-up, richer occupational exposure indicators, and broader psychosocial variables. Model calibration and prospective updating across institutions would also strengthen its clinical utility. The better-performing XGBoost and random forest models may provide a useful basis for practical screening tools to support early identification, risk stratification, and targeted intervention in rescue workers.Although the leading models showed favorable discrimination in external validation, calibration and decision-curve analyses suggested that their clinical use should be interpreted cautiously. Further recalibration and prospective validation are required before implementation of real-world PTSD screening.
-
Machine-learning models showed measurable discriminatory ability for PTSD risk stratification among rescue workers. In the external validation, PCA-XGBoost achieved the highest AUC among the PCA-based models, and FA-XGBoost achieved the highest AUC among the factor-analysis-based models; however, no model dominated all performance indicators. Random forest models provided sensitivity-oriented alternatives for both routes. Original-variable SHAP analysis identified acute stress symptoms and emotional distress as the strongest predictive signals. These findings highlight the predictive relevance of acute stress symptoms, emotional distress, and selected behavioral and socioeconomic factors for PTSD risk stratification among rescue workers, pending further recalibration, prospective validation, and incorporation of richer trauma-exposure information.
HTML
Study Design and Participants
Data Sources, Outcome, and Candidate Predictors
Dimensionality Reduction and Model Development
Training, Validation, and Class Imbalance Handling
Model Evaluation and Interpretability
Statistical Analysis
Baseline Characteristics
PCA Results
Factor-analysis Results
Performance of PCA-based Models
Performance of Factor-analysis-based Models
Interpretation of the XGBoost Model
ROC Curve Comparison
Competing Interests The authors declare no competing interests.
Ethics The study was approved by the Ethics Committee of the Chinese PLA General Hospital (No. S2023-132-02). All participants provided written informed consent.
Authors’ Contributions Xiaoyong Sai conceived and designed the study. Wei Lu performed the formal analyses and drafted the manuscript. Qiao Wang, Qiongxuan Li, Chunyan Li, Yuning Liu, Meilin Zhu, and Jiayi Deng contributed to data curation, interpretation of findings, and critical revision of the manuscript. Jiayi Deng and Xiaoyong Sai supervised the study. All authors reviewed the final version of the manuscript, ensured its accuracy and integrity, and approved its submission.
Data Sharing The data used in this study were derived from the multicenter rescue-worker health archives. Because the data contain potentially identifiable occupational and health information, they are not publicly available. De-identified data and analytic codes may be available from the corresponding authors on reasonable request, subject to institutional approval, data-use agreements, and privacy restrictions. The supplementary materials will be available in www.besjournal.com.
&These authors contributed equally to this work.

 Quick Links
 DownLoad: