
-
T2DM represents a leading global public health challenge, with its escalating prevalence imposing substantial personal, societal, and economic burdens worldwide[1]. The burden of T2DM is deeply intertwined with social and economic conditions, serving as a critical indicator of population health and health inequality[1]. While established risk factors for T2DM such as age, sex, and obesity are well known[2], a comprehensive understanding of how a cumulative burden of social determinants of health (SDOH) influences long-term trends remains less explored[3]. A deeper analysis focusing on these synergistic effects of multiple social disadvantages is crucial for developing holistic, equity-focused interventions that move beyond individual-level risk modification[4,5].
The coronavirus disease 2019 (COVID-19) pandemic has acted as a global stress test, causing widespread disruptions to health management[6,7], altered dietary patterns[8], and daily life behaviors[9,10], which may have influenced the prevalence and risk of T2DM, particularly among vulnerable populations[11]. Specifically, pandemic-driven restrictions on routine medical services and physical activity have disproportionately burdened vulnerable populations, who face greater barriers to adopting technology-based care and maintaining healthy lifestyles[12,13]. Consequently, while SDOH are associated with T2DM risk[4,5], the pandemic may have exacerbated these existing inequalities[12]. Therefore, a detailed examination is essential to understand the long-term trends in T2DM, the specific impact of cumulative SDOH, and how this relationship may have been intensified by the distinct phases of the pandemic.
Therefore, this study aimed to investigate the long-term trends in T2DM prevalence among Korean adults, using nationally representative data from the Korea National Health and Nutrition Examination Survey (KNHANES) from 2007 to 2024. We examined changes in T2DM prevalence across pre-, intra-, and preliminary post-pandemic periods, and identified key risk factors, with a particular focus on the cumulative impact of SDOH. The findings from this study are expected to provide critical evidence to inform the development of integrated public health strategies and policies aimed at reducing health inequalities in T2DM management.
-
This study utilized data from the KNHANES, a nationally representative survey conducted by the Korea Disease Control and Prevention Agency (KDCA) from 2007 to 2024[14]. The KNHANES employs a multistage, stratified, probability-based cluster sampling design, with survey areas and households as the primary and secondary sampling units, respectively[14]. Sampling weights were applied to ensure national representativeness and to account for differential probabilities of selection and response. The prevalence of T2DM was estimated from a nationally representative sample of 85,695 adults aged 19 years or older in South Korea. We categorized the survey periods into three pandemic-related phases based on the timing of the first confirmed case in South Korea (January 19, 2020), the World Health Organization (WHO)’s pandemic declaration (March 11, 2020), and the official lifting of the pandemic alert by the Korean government in May 2023: pre- (2007–2019), intra- (2020–2022), and preliminary post-pandemic (2023–2024) periods[15].
The research protocol was approved by the Institutional Review Boards of the KDCA (2007-02CON-04-P, 2008-04EXP-01-C, 2009-01CON-03-2C, 2010-02CON-21-C, 2011-02CON-06-C, 2012-01EXP-01-2C, 2013-07CON-03-4C, 2013-12EXP-03-5C, 2018-01-03-P-A, 2018-01-03-C-A, 2018-01-03-2C-A, 2018-01-03-5C-A, 2018-01-03-4C-A, 2022-11-16-R-A, and 2022-11-16-R-03). Written informed consent was obtained from all participants prior to their participation. The study was conducted in accordance with the ethical principles of the Declaration of Helsinki.
-
In this study, T2DM was defined as meeting at least one of the following criteria: a self-reported physician diagnosis, current use of any anti-diabetic medication, a fasting glucose level of 126 mg/dL or higher, or a hemoglobin A1c level of 6.5% or higher. Participants not meeting any of these criteria were classified as the non-diabetic group[16].
-
SDOH refer to the social, economic, and physical factors that influence the environment in which individuals are born, grow up, and live[17]. These factors play a substantial role in shaping health outcomes and have a significant impact on health equity[17]. SDOH in this study included education level (high school graduate or higher and less than high school), marital status (married and single, separated, widowed, or divorced), household income (high [third or highest quartile] and low [lowest or second quartile]), food security (full security and marginal, low, or very low food security), type of health insurance (classified solely by the presence of private health insurance: private and government or none), employment status (employed, student, or retired and unemployed), and home ownership (own home and rent home or other arrangement).
To assess the cumulative burden of SDOH, each of the seven SDOH variables was first dichotomized into either a favorable or unfavorable condition. The unfavorable conditions were defined as: high school or lower education level; single, separated, widowed, or divorced; low household income; marginal, low, or very low food security; having government or no insurance; unemployment; and rent home or other arrangement. A cumulative score was then calculated based on the number of these unfavorable conditions (range, 0–7) for each participant. Due to the small number of participants with a score of 7, scores of 6 and 7 were combined into a single category, resulting in a final score range of 0 to ≥6[18]. Finally, this cumulative score was dichotomized into two groups for analysis: high-burden (more than 2 unfavorable SDOH) vs. low-burden (2 or fewer), using the median value of the score which was 2 as the cut-point[19]. Since there is no universally established clinical cut-off for SDOH burden, a data-driven threshold, which was 2, based on the median was selected. Additionally, to evaluate the dose-response relationship and the graded impact of social disadvantage on T2DM risk, the raw cumulative SDOH score (range, 0 to ≥ 6) was further analyzed as both an ordinal and a continuous variable in our models.
-
The covariates included in this study were sex (male and female), age group (19–39, 40–59, 60–69, and ≥ 70 years) [20], region of residence (urban and rural), body mass index (BMI) group, smoking status (current smoker, ex-smoker, and never-smoker), drinking status (current drinker, ex-drinker, and never-drinker), blood pressure (normal, elevated, stage 1 hypertension, and stage 2 hypertension), and physical activity (sufficient and insufficient). BMI was classified according to the Asia-Pacific guidelines as underweight (< 18.5 kg/m2), normal weight (18.5–22.9 kg/m2), overweight (23.0–24.9 kg/m2), and obese (≥ 25.0 kg/m2)[21]. Blood pressure was classified according to the 2025 American College of Cardiology and the American Heart Association guidelines. Systolic blood pressure (SBP) and diastolic blood pressure (DBP) were used to define categories as follows: normal (SBP < 120 and DBP < 80 mmHg), elevated (120–129 and < 80 mmHg), stage 1 hypertension (130–139 or 80–89 mmHg), and stage 2 hypertension (≥ 140 or ≥ 90 mmHg) [22]. Physical activity was evaluated based on the framework of the WHO’s Global Physical Activity Questionnaire. Participants were considered to have sufficient physical activity if they engaged in ≥ 150 minutes/week of moderate-intensity activity, ≥ 75 minutes/week of vigorous-intensity activity, or an equivalent combination, where one minute of vigorous activity was counted as two minutes of moderate activity [23]. BMI and blood pressure were obtained through direct anthropometric and clinical measurements, whereas all other covariate data were obtained through self-reported questionnaires administered by trained interviewers.
-
The outcomes of this study were presented using qualitative data expressed as proportions or percentages[21]. To ensure accurate population-level estimates, a weighted complex sampling analysis was applied to account for the stratified sampling design and to minimize the influence of differences in participant numbers across survey years. The association between the COVID-19 pandemic period and the prevalence of T2DM was evaluated using weighted linear regression models. We also applied weighted linear regression to assess how the prevalence of T2DM varied across levels of cumulative unfavorable SDOH within each pandemic period. β coefficients with 95% confidence intervals (CIs) were estimated, and differences in β coefficients (βdiff) across pandemic phases were compared to assess temporal changes in both overall prevalence and SDOH-related disparities. To test the statistical significance of these temporal variations, p-values for interaction were calculated. To identify risk factors associated with T2DM, multivariable logistic regression models were employed, and the results were presented as adjusted odds ratios (aORs) along with their corresponding 95% CIs. In addition, age-standardized prevalence and aORs were estimated to account for potential demographic shifts across survey years.
Several sensitivity analyses were performed to ensure robustness. To address potential selection bias, inverse probability weighting (IPW) was performed, with inclusion probabilities estimated via multivariable logistic regression. To further validate the SDOH score, variance inflation factors (VIFs) were derived from weighted multiple linear regression models to assess multicollinearity among SDOH variables. Furthermore, to account for the differential contributions of individual SDOH components, a weighted SDOH score was constructed, with weights assigned based on the log-odds ratios from multivariable logistic regression models. This weighted score was analyzed as both a continuous variable and categorized into quartiles. Additionally, mediation analysis was conducted to evaluate the potential pathways between lifestyle factors (overweight or obesity, current smoking, current drinking, and insufficient physical activity) and T2DM. All statistical analyses were performed using two-sided tests, and a P-value < 0.05 was considered statistically significant, utilizing SAS software (version 9.4; SAS Institute, Cary, NC, USA), with the exception of the mediation analysis, which was performed using R software (version 4.5.2; R Foundation for Statistical Computing, Vienna, Austria).
-
Of the 140,372 participants surveyed during the study period, participants under the age of 19 were excluded (Supplementary Figure S1). Among the remaining 111,381 adults, an additional 25,686 participants were excluded due to missing data on BMI, smoking status, drinking status, blood pressure, physical activity, education level, marital status, household income, food security, type of health insurance, employment status, home ownership, and T2DM status. As a result, the final survey participants consisted of 85,695 individuals (males, 35,392 [41.30%]; 19–39, 23,460 [27.38%]) (Table 1). To minimize selection bias, a comparison of baseline characteristics between included and excluded participants is provided in Supplementary Table S1, and additional IPW analysis did not indicate meaningful selection bias arising from these exclusions (Supplementary Table S2).
Characteristic Total Pre-pandemic Intra-pandemic Preliminarypost-pandemic 2007–2009 2010–2012 2013–2015 2016–2019 2020 2021 2022 2023 2024 Overall, n (%) 85,695
(100.00)13,841
(16.15)15,328
(17.89)13,290
(15.51)20,108
(23.46)4,077
(4.76)4,249
(4.96)4,426
(5.16)5,140
(6.00)5,236
(6.11)Crude rate, n (%) Sex, n (%) Male 35,392
(41.30)5,439
(6.35)6,140
(7.16)5,390
(6.29)8,436
(9.84)1,769
(2.06)1,821
(2.13)1,924
(2.25)2,224
(2.60)2,249
(2.62)Female 50,303
(58.70)8,402
(9.80)9,188
(10.72)7,900
(9.22)11,672
(13.62)2,308
(2.69)2,428
(2.83)2,502
(2.92)2,916
(3.40)2,987
(3.49)Age group (years), n (%) 19– 23,460
(27.38)4,393
(5.13)4,399
(5.13)3,713
(4.33)5,401
(6.30)1,103
(1.29)964
(1.12)1,097
(1.28)1,168
(1.36)1,222
(1.43)40– 31,300
(36.52)5,039
(5.88)5,607
(6.54)4,998
(5.83)7,462
(8.71)1,482
(1.73)1,502
(1.75)1,518
(1.77)1,874
(2.19)1,818
(2.12)60– 16,076
(18.76)2,359
(2.75)2,733
(3.19)2,375
(2.77)3,617
(4.22)808
(0.94)878
(1.02)983
(1.15)1,186
(1.38)1,137
(1.33)≥ 70 14,859
(17.34)2,050
(2.39)2,589
(3.02)2,204
(2.57)3,628
(4.23)684
(0.80)905
(1.06)828
(0.97)912
(1.06)1,059
(1.24)Region of residence, n (%) Urban 38,840
(45.32)5,870
(6.85)6,991
(8.16)6,153
(7.18)9,368
(10.93)1,805
(2.11)1,999
(2.33)1,908
(2.23)2,291
(2.67)2,455
(2.86)Rural 46,855
(54.68)7,971
(9.30)8,337
(9.73)7,137
(8.33)10,740
(12.53)2,272
(2.65)2,250
(2.63)2,518
(2.94)2,849
(3.32)2,781
(3.25)BMI group, n (%)* Underweight 3,673
(4.29)658
(0.77)701
(0.82)558
(0.65)775
(0.90)135
(0.16)183
(0.21)181
(0.21)236
(0.28)246
(0.29)Normal 33,254
(38.81)5,525
(6.45)6,225
(7.26)5,274
(6.15)7,789
(9.09)1,477
(1.72)1,515
(1.77)1,648
(1.92)1,923
(2.24)1,878
(2.19)Overweight 19,902
(23.22)3,324
(3.88)3,564
(4.16)3,129
(3.65)4,624
(5.40)925
(1.08)1,001
(1.17)1,007
(1.18)1,155
(1.35)1,173
(1.37)Obese 28,866
(33.68)4,334
(5.06)4,838
(5.65)4,329
(5.05)6,920
(8.08)1,540
(1.80)1,550
(1.81)1,590
(1.86)1,826
(2.13)1,939
(2.26)Smoking status, n (%) Never smoker 52,753
(61.56)8,377
(9.78)9,383
(10.95)8,325
(9.71)12,410
(14.48)2,502
(2.92)2,632
(3.07)2,671
(3.12)3,157
(3.68)3,296
(3.85)Ex-smoker 18,259
(21.31)2,671
(3.12)3,141
(3.67)2,648
(3.09)4,402
(5.14)915
(1.07)983
(1.15)1,085
(1.27)1,189
(1.39)1,225
(1.43)Current smoker 14,683
(17.13)2,793
(3.26)2,804
(3.27)2,317
(2.70)3,296
(3.85)660
(0.77)634
(0.74)670
(0.78)794
(0.93)715
(0.83)Drinking status, n (%) Never drinker 10,895
(12.71)2,129
(2.48)2,243
(2.62)1,740
(2.03)2,283
(2.66)455
(0.53)525
(0.61)440
(0.51)571
(0.67)509
(0.59)Ex-drinker 14,619
(17.06)2,121
(2.48)2,343
(2.73)2,258
(2.63)3,418
(3.99)784
(0.91)923
(1.08)854
(1.00)933
(1.09)985
(1.15)Current drinker 60,181
(70.23)9,591
(11.19)10,742
(12.54)9,292
(10.84)14,407
(16.81)2,838
(3.31)2,801
(3.27)3,132
(3.65)3,636
(4.24)3,742
(4.37)Blood pressure, n (%) Normal 37,774
(44.08)6,365
(7.43)6,514
(7.60)6,185
(7.22)8,636
(10.08)1,717
(2.00)1,877
(2.19)1,940
(2.26)2,337
(2.73)2,203
(2.57)Elevated 5,409
(6.31)725
(0.85)839
(0.98)829
(0.97)1,239
(1.45)255
(0.30)362
(0.42)350
(0.41)404
(0.47)406
(0.47)Stage 1 hypertension 14,831
(17.31)2,588
(3.02)2,831
(3.30)2,198
(2.56)3,651
(4.26)824
(0.96)561
(0.65)637
(0.74)728
(0.85)813
(0.95)Stage 2 hypertension 27,681
(32.30)4,163
(4.86)5,144
(6.00)4,078
(4.76)6,582
(7.68)1,281
(1.49)1,449
(1.69)1,499
(1.75)1,671
(1.95)1,814
(2.12)Physical activity, n (%) Insufficient 38,895
(45.39)3,631
(4.24)5,026
(5.87)5,845
(6.82)11,497
(13.42)2,336
(2.73)2,502
(2.92)2,378
(2.78)2,766
(3.23)2,914
(3.40)Sufficient 46,800
(54.61)10,210
(11.91)10,302
(12.02)7,445
(8.69)8,611
(10.05)1,741
(2.03)1,747
(2.04)2,048
(2.39)2,374
(2.77)2,322
(2.71)Education level, n (%) High 60,323
(70.39)9,889
(11.54)9,721
(11.34)8,956
(10.45)14,345
(16.74)3,072
(3.58)3,075
(3.59)3,341
(3.90)3,946
(4.60)3,978
(4.64)Low 25,372
(29.61)3,952
(4.61)5,607
(6.54)4,334
(5.06)5,763
(6.73)1,005
(1.17)1,174
(1.37)1,085
(1.27)1,194
(1.39)1,258
(1.47)Marital status, n (%) Married 60,567
(70.68)10,172
(11.87)11,485
(13.40)9,486
(11.07)14,073
(16.42)2,703
(3.15)2,809
(3.28)2,958
(3.45)3,471
(4.05)3,410
(3.98)Single, separated, widowed, or divorced 25,128
(29.32)3,669
(4.28)3,843
(4.48)3,804
(4.44)6,035
(7.04)1,374
(1.60)1,440
(1.68)1,468
(1.71)1,669
(1.95)1,826
(2.13)Household income, n (%) High 47,576
(55.52)7,290
(8.51)8,262
(9.64)7,359
(8.59)11,272
(13.15)2,426
(2.83)2,406
(2.81)2,475
(2.89)2,989
(3.49)3,097
(3.61)Low 38,119
(44.48)6,551
(7.64)7,066
(8.25)5,931
(6.92)8,836
(10.31)1,651
(1.93)1,843
(2.15)1,951
(2.28)2,151
(2.51)2,139
(2.50)Food security, n (%) Full security 45,951
(53.62)5,527
(6.45)6,688
(7.80)6,441
(7.52)11,136
(12.99)2,568
(3.00)2,749
(3.21)3,078
(3.59)3,646
(4.25)4,118
(4.81)Marginal, low, or very low security 39,744
(46.38)8,314
(9.70)8,640
(10.08)6,849
(7.99)8,972
(10.47)1,509
(1.76)1,500
(1.75)1,348
(1.57)1,494
(1.74)1,118
(1.30)Type of health insurance, n (%) Private 64,538
(75.31)9,053
(10.56)10,715
(12.50)9,829
(11.47)15,690
(18.31)3,395
(3.96)3,377
(3.94)3,647
(4.26)4,328
(5.05)4,504
(5.26)Government or none 21,157
(24.69)4,788
(5.59)4,613
(5.38)3,461
(4.04)4,418
(5.16)682
(0.80)872
(1.02)779
(0.91)812
(0.95)732
(0.85)Employment status, n (%) Employed, student, or retired 50,525
(58.96)7,837
(9.15)8,800
(10.27)7,637
(8.91)12,024
(14.03)2,418
(2.82)2,556
(2.98)2,724
(3.18)3,218
(3.76)3,311
(3.86)Unemployed 35,170
(41.04)6,004
(7.01)6,528
(7.62)5,653
(6.60)8,084
(9.43)1,659
(1.94)1,693
(1.98)1,702
(1.99)1,922
(2.24)1,925
(2.25)Home ownership, n (%) Own home 60,394
(70.48)9,703
(11.32)11,512
(13.43)9,103
(10.62)13,945
(16.27)2,756
(3.22)2,889
(3.37)3,067
(3.58)3,618
(4.22)3,801
(4.44)Rent home or other arrangement 25,301
(29.52)4,138
(4.83)3,816
(4.45)4,187
(4.89)6,163
(7.19)1,321
(1.54)1,360
(1.59)1,359
(1.59)1,522
(1.78)1,435
(1.67)SDOH burden score, n (%) 0 10,037
(11.71)1,129
(1.32)1,356
(1.58)1,245
(1.45)2,557
(2.98)553
(0.65)628
(0.73)710
(0.83)856
(1.00)1,003
(1.17)1 18,739
(21.87)2,690
(3.14)3,126
(3.65)2,787
(3.25)4,591
(5.36)1,004
(1.17)956
(1.12)1,027
(1.20)1,253
(1.46)1,305
(1.52)2 19,216
(22.42)3,069
(3.58)3,501
(4.09)3,075
(3.59)4,415
(5.15)908
(1.06)908
(1.06)976
(1.14)1,201
(1.40)1,163
(1.36)3 15,138
(17.67)2,679
(3.13)2,819
(3.29)2,420
(2.82)3,389
(3.95)694
(0.81)696
(0.81)770
(0.90)847
(0.99)824
(0.96)4 11,300
(13.19)2,030
(2.37)2,231
(2.60)1,870
(2.18)2,534
(2.96)492
(0.57)533
(0.62)514
(0.60)549
(0.64)547
(0.64)5 6,693
(7.81)1,314
(1.53)1,428
(1.67)1,068
(1.25)1,502
(1.75)265
(0.31)324
(0.38)265
(0.31)274
(0.32)253
(0.30)≥6 4,572
(5.34)930
(1.09)867
(1.01)825
(0.96)1,120
(1.31)161
(0.19)204
(0.24)164
(0.19)160
(0.19)141
(0.16)Cumulative unfavorable SDOH, n (%) Low-burden (≤ 2) 47,992
(56.00)6,888
(8.04)7,983
(9.32)7,107
(8.29)11,563
(13.49)2,465
(2.88)2,492
(2.91)2,713
(3.17)3,310
(3.86)3,471
(4.05)High-burden (> 2) 37,703
(44.00)6,953
(8.11)7,345
(8.57)6,183
(7.22)8,545
(9.97)1,612
(1.88)1,757
(2.05)1,713
(2.00)1,830
(2.14)1,765
(2.06)Weighted rate (95% CI) Sex, weighted % (95% CI) Male 49.56
(49.15 to 49.97)48.95
(48.11 to 49.79)49.35
(48.51 to 50.19)48.92
(48.06 to 49.79)49.54
(48.86 to 50.22)49.98
(48.44 to 51.52)49.70
(48.09 to 51.31)49.83
(48.29 to 51.37)49.34
(48.09 to 50.60)50.25
(49.02 to 51.48)Female 50.44
(50.03 to 50.85)51.05
(50.21 to 51.89)50.65
(49.81 to 51.49)51.08
(50.21 to 51.94)50.46
(49.78 to 51.14)50.02
(48.48 to 51.56)50.30
(48.69 to 51.91)50.17
(48.63 to 51.71)50.66
(49.40 to 51.91)49.75
(48.52 to 50.98)Age group (years), weighted % (95% CI) 19- 35.48
(34.81 to 36.16)42.30
(40.72 to 43.87)40.01
(38.61 to 41.40)38.19
(36.80 to 39.57)35.47
(34.26 to 36.67)34.99
(32.33 to 37.66)33.45
(31.03 to 35.86)32.75
(30.20 to 35.30)32.39
(30.01 to 34.76)31.56
(29.20 to 33.93)40- 39.30
(38.71 to 39.90)39.13
(37.81 to 40.44)40.11
(38.98 to 41.25)40.77
(39.57 to 41.96)40.38
(39.33 to 41.42)40.37
(38.01 to 42.74)38.99
(36.88 to 41.09)38.36
(35.97 to 40.75)38.17
(36.29 to 40.05)37.67
(35.49 to 39.85)60- 13.70
(13.31 to 14.09)10.40
(9.76 to 11.04)10.67
(10.02 to 11.33)11.28
(10.61 to 11.94)12.28
(11.67 to 12.90)13.69
(12.24 to 15.15)14.60
(13.29 to 15.91)16.26
(14.60 to 17.92)16.84
(15.49 to 18.20)16.26
(14.74 to 17.78)≥70 11.51
(11.10 to 11.93)8.18
(7.57 to 8.79)9.21
(8.57 to 9.85)9.77
(9.09 to 10.45)11.87
(11.17 to 12.58)10.94
(9.15 to 12.74)12.97
(11.26 to 14.68)12.63
(10.97 to 14.29)12.60
(11.20 to 14.01)14.51
(12.85 to 16.18)Region of residence, weighted % (95% CI) Urban 47.04
(45.83 to 48.25)48.03
(45.82 to 50.23)48.43
(46.15 to 50.70)48.05
(45.98 to 50.12)49.36
(47.03 to 51.69)46.55
(38.96 to 54.15)48.39
(41.26 to 55.53)44.01
(37.16 to 50.86)45.41
(38.74 to 52.07)45.49
(38.73 to 52.25)Rural 52.96
(51.75 to 54.17)51.97
(49.77 to 54.18)51.57
(49.30 to 53.85)51.95
(49.88 to 54.02)50.64
(48.31 to 52.97)53.45
(45.85 to 61.04)51.61
(44.47 to 58.74)55.99
(49.14 to 62.84)54.59
(47.93 to 61.26)54.51
(47.75 to 61.27)BMI group, weighted % (95% CI)* Underweight 4.50
(4.30 to 4.70)4.99
(4.50 to 5.47)4.84
(4.41 to 5.28)4.43
(3.98 to 4.87)4.14
(3.79 to 4.48)3.63
(2.86 to 4.40)4.55
(3.81 to 5.29)4.47
(3.77 to 5.16)4.83
(4.19 to 5.47)4.71
(4.05 to 5.38)Normal 37.52
(37.05 to 37.99)39.82
(38.81 to 40.82)40.58
(39.51 to 41.64)40.10
(39.08 to 41.12)38.77
(37.92 to 39.63)35.59
(33.75 to 37.43)35.80
(34.12 to 37.48)36.22
(34.44 to 37.99)36.75
(35.24 to 38.26)34.95
(33.49 to 36.40)Overweight 22.65
(22.27 to 23.04)23.86
(22.99 to 24.72)22.63
(21.81 to 23.46)22.89
(22.05 to 23.73)22.59
(21.91 to 23.28)23.08
(21.58 to 24.59)21.88
(20.45 to 23.31)22.75
(21.36 to 24.15)22.21
(20.96 to 23.45)22.21
(21.14 to 23.27)Obese 35.33
(34.83 to 35.83)31.34
(30.31 to 32.37)31.95
(30.91 to 32.98)32.58
(31.58 to 33.58)34.49
(33.67 to 35.32)37.70
(35.92 to 39.49)37.77
(35.81 to 39.73)36.57
(34.55 to 38.59)36.22
(34.59 to 37.84)38.13
(36.59 to 39.68)Smoking status, weighted % (95% CI) Never smoker 56.96
(56.46 to 57.46)53.08
(52.09 to 54.06)54.27
(53.33 to 55.20)57.55
(56.60 to 58.51)57.43
(56.61 to 58.24)57.37
(55.48 to 59.26)57.99
(56.17 to 59.81)56.73
(54.92 to 58.53)58.34
(56.71 to 59.98)59.10
(57.40 to 60.80)Ex-smoker 23.12
(22.72 to 23.52)20.43
(19.65 to 21.21)20.58
(19.76 to 21.39)20.28
(19.49 to 21.07)22.52
(21.89 to 23.15)24.07
(22.65 to 25.49)24.05
(22.61 to 25.49)26.45
(24.89 to 28.00)23.64
(22.41 to 24.87)25.14
(23.69 to 26.58)Current smoker 19.92
(19.47 to 20.37)26.50
(25.50 to 27.50)25.16
(24.16 to 26.16)22.17
(21.18 to 23.16)20.05
(19.27 to 20.84)18.56
(16.86 to 20.27)17.96
(16.44 to 19.48)16.83
(15.04 to 18.61)18.02
(16.62 to 19.41)15.76
(14.35 to 17.18)Drinking status, weighted % (95% CI) Never drinker 8.88
(8.60 to 9.16)11.28
(10.63 to 11.92)10.56
(9.88 to 11.23)9.76
(9.13 to 10.39)8.42
(7.94 to 8.90)8.16
(7.04 to 9.27)9.11
(7.92 to 10.29)7.43
(6.45 to 8.41)8.42
(7.46 to 9.39)7.38
(6.47 to 8.29)Ex-drinker 15.79
(15.42 to 16.17)12.70
(12.01 to 13.38)12.89
(12.17 to 13.60)14.55
(13.80 to 15.29)14.76
(14.17 to 15.35)17.07
(15.51 to 18.62)18.89
(17.43 to 20.35)17.52
(16.16 to 18.89)16.18
(14.95 to 17.41)16.70
(15.54 to 17.86)Current drinker 75.33
(74.84 to 75.82)76.03
(75.10 to 76.96)76.56
(75.60 to 77.51)75.69
(74.72 to 76.66)76.82
(76.04 to 77.59)74.77
(72.72 to 76.83)72.00
(70.11 to 73.89)75.05
(73.28 to 76.81)75.40
(73.68 to 77.12)75.92
(74.25 to 77.59)Blood pressure, weighted % (95% CI) Normal 47.98
(47.36 to 48.60)49.80
(48.38 to 51.23)47.40
(46.12 to 48.68)51.37
(50.12 to 52.61)46.74
(45.67 to 47.82)45.64
(43.21 to 48.06)48.55
(46.37 to 50.72)47.37
(44.78 to 49.97)49.96
(47.78 to 52.14)45.58
(43.61 to 47.55)Elevated 6.74
(6.47 to 7.00)4.24
(3.83 to 4.65)5.21
(4.76 to 5.67)5.75
(5.26 to 6.24)5.69
(5.31 to 6.07)6.05
(5.05 to 7.05)8.88
(7.83 to 9.92)8.36
(7.36 to 9.36)8.06
(7.31 to 8.80)7.75
(6.87 to 8.62)Stage 1 hypertension 18.00
(17.62 to 18.39)20.81
(19.78 to 21.84)20.04
(19.15 to 20.94)18.26
(17.39 to 19.13)20.20
(19.46 to 20.94)21.78
(20.29 to 23.27)15.06
(13.75 to 16.37)15.04
(13.68 to 16.40)14.75
(13.63 to 15.87)16.76
(15.76 to 17.76)Stage 2 hypertension 27.28
(26.75 to 27.82)25.15
(24.07 to 26.24)27.34
(26.27 to 28.41)24.62
(23.62 to 25.63)27.37
(26.49 to 28.24)26.53
(24.47 to 28.60)27.52
(25.54 to 29.49)29.23
(27.00 to 31.45)27.24
(25.38 to 29.09)29.91
(28.05 to 31.77)Physical activity, weighted % (95% CI) Insufficient 46.30
(45.71 to 46.88)24.56
(23.35 to 25.77)30.79
(29.66 to 31.92)40.10
(38.81 to 41.40)53.04
(52.02 to 54.06)55.25
(53.15 to 57.35)54.76
(52.80 to 56.71)49.97
(47.81 to 52.13)50.57
(48.58 to 52.57)52.32
(50.16 to 54.48)Sufficient 53.70
(53.12 to 54.29)75.44
(74.23 to 76.65)69.21
(68.08 to 70.34)59.90
(58.61 to 61.19)46.96
(45.94 to 47.98)44.75
(42.65 to 46.85)45.24
(43.29 to 47.20)50.03
(47.87 to 52.19)49.43
(47.43 to 51.42)47.68
(45.52 to 49.84)Education level, weighted % (95% CI) High 80.82
(80.24 to 81.40)81.68
(80.65 to 82.71)73.07
(71.72 to 74.41)77.04
(75.84 to 78.23)79.83
(78.77 to 80.89)83.18
(80.65 to 85.70)82.33
(79.98 to 84.67)83.45
(81.04 to 85.86)83.29
(81.28 to 85.30)82.62
(80.55 to 84.70)Low 19.18
(18.60 to 19.76)18.32
(17.29 to 19.35)26.93
(25.59 to 28.28)22.96
(21.77 to 24.16)20.17
(19.11 to 21.23)16.82
(14.30 to 19.35)17.67
(15.33 to 20.02)16.55
(14.14 to 18.96)16.71
(14.70 to 18.72)17.38
(15.30 to 19.45)Marital status, weighted % (95% CI) Married 65.26
(64.57 to 65.95)69.88
(68.50 to 71.26)68.46
(67.26 to 69.66)67.65
(66.30 to 69.01)66.28
(65.13 to 67.42)63.80
(60.98 to 66.62)63.27
(60.64 to 65.90)63.66
(60.96 to 66.36)63.02
(60.69 to 65.36)62.55
(59.81 to 65.29)Single, separated, widowed, or divorced 34.74
(34.05 to 35.43)30.12
(28.74 to 31.50)31.54
(30.34 to 32.74)32.35
(30.99 to 33.70)33.72
(32.58 to 34.87)36.20
(33.38 to 39.02)36.73
(34.10 to 39.36)36.34
(33.64 to 39.04)36.98
(34.64 to 39.31)37.45
(34.71 to 40.19)Household income, weighted % (95% CI) High 62.11
(61.25 to 62.97)58.84
(57.02 to 60.67)57.00
(55.41 to 58.59)61.00
(59.24 to 62.76)61.67
(60.18 to 63.17)65.21
(61.59 to 68.82)64.42
(61.02 to 67.82)62.68
(59.41 to 65.95)63.67
(60.73 to 66.60)63.48
(60.32 to 66.64)Low 37.89
(37.03 to 38.75)41.16
(39.33 to 42.98)43.00
(41.41 to 44.59)39.00
(37.24 to 40.76)38.33
(36.83 to 39.82)34.80
(31.18 to 38.41)35.58
(32.18 to 38.98)37.32
(34.05 to 40.59)36.33
(33.40 to 39.27)36.52
(33.36 to 39.68)Food security, weighted % (95% CI) Full security 61.24
(60.41 to 62.06)41.67
(39.99 to 43.34)43.16
(41.66 to 44.67)49.19
(47.56 to 50.81)56.90
(55.45 to 58.36)64.94
(61.74 to 68.13)66.99
(63.67 to 70.31)70.76
(68.28 to 73.25)71.59
(69.02 to 74.17)80.02
(77.68 to 82.36)Marginal, low, or very low security 38.76
(37.94 to 39.59)58.33
(56.66 to 60.01)56.84
(55.33 to 58.34)50.81
(49.19 to 52.44)43.10
(41.64 to 44.55)35.06
(31.87 to 38.26)33.01
(29.69 to 36.33)29.24
(26.75 to 31.72)28.41
(25.83 to 30.98)19.98
(17.64 to 22.32)Type of health insurance, weighted % (95% CI) Private 82.63
(82.16 to 83.09)72.23
(71.01 to 73.45)75.09
(73.97 to 76.21)79.65
(78.59 to 80.71)82.57
(81.68 to 83.47)86.11
(84.33 to 87.89)83.62
(81.81 to 85.43)86.34
(84.84 to 87.84)86.98
(85.40 to 88.55)88.52
(87.25 to 89.79)Government or none 17.37
(16.91 to 17.84)27.77
(26.55 to 28.99)24.91
(23.79 to 26.03)20.35
(19.29 to 21.41)17.43
(16.53 to 18.32)13.89
(12.11 to 15.67)16.38
(14.57 to 18.19)13.66
(12.16 to 15.16)13.02
(11.45 to 14.60)11.48
(10.21 to 12.75)Employment status, weighted % (95% CI) Employed, student, or retired 64.16
(63.61 to 64.71)60.40
(59.18 to 61.61)64.19
(63.06 to 65.31)62.63
(61.54 to 63.72)63.82
(62.85 to 64.79)62.98
(60.78 to 65.17)63.65
(61.72 to 65.57)64.89
(62.80 to 66.98)66.68
(64.95 to 68.41)67.45
(65.64 to 69.26)Unemployed 35.84
(35.29 to 36.39)39.60
(38.39 to 40.82)35.81
(34.69 to 36.94)37.37
(36.28 to 38.46)36.18
(35.21 to 37.15)37.02
(34.83 to 39.22)36.35
(34.43 to 38.28)35.11
(33.02 to 37.20)33.32
(31.59 to 35.05)32.55
(30.74 to 34.36)Home ownership, weighted % (95% CI) Own home 67.76
(66.71 to 68.81)66.17
(64.08 to 68.26)68.66
(66.96 to 70.36)65.73
(63.69 to 67.77)67.34
(65.67 to 69.01)67.48
(63.39 to 71.56)66.56
(61.79 to 71.32)68.65
(65.04 to 72.27)68.35
(64.87 to 71.83)70.50
(66.97 to 74.02)Rent home or other arrangement 32.24
(31.19 to 33.29)33.83
(31.74 to 35.92)31.34
(29.64 to 33.04)34.27
(32.23 to 36.31)32.66
(30.99 to 34.33)32.52
(28.44 to 36.61)33.44
(28.68 to 38.21)31.35
(27.73 to 34.96)31.65
(28.17 to 35.13)29.50
(25.98 to 33.03)SDOH burden score, weighted % (95% CI) 0 14.87
(14.28 to 15.46)9.43
(8.59 to 10.27)9.06
(8.35 to 9.76)10.57
(9.71 to 11.42)13.72
(12.82 to 14.62)15.53
(13.23 to 17.83)17.12
(14.79 to 19.46)17.96
(15.63 to 20.29)17.51
(15.60 to 19.41)21.09
(18.79 to 23.40)1 24.42
(23.86 to 24.99)21.25
(20.21 to 22.29)20.96
(20.02 to 21.91)23.17
(22.09 to 24.26)24.74
(23.82 to 25.67)26.90
(24.53 to 29.28)24.48
(22.13 to 26.83)25.15
(23.05 to 27.24)26.02
(24.17 to 27.88)26.24
(24.41 to 28.07)2 23.67
(23.21 to 24.13)24.10
(23.19 to 25.02)24.70
(23.69 to 25.70)24.47
(23.46 to 25.47)23.28
(22.54 to 24.02)22.92
(21.09 to 24.75)23.24
(21.63 to 24.85)23.33
(21.60 to 25.06)24.36
(22.95 to 25.76)22.88
(21.40 to 24.37)3 16.90
(16.45 to 17.34)19.44
(18.57 to 20.32)19.15
(18.30 to 19.99)18.32
(17.41 to 19.22)17.05
(16.34 to 17.76)16.18
(14.54 to 17.83)15.46
(13.66 to 17.25)16.37
(14.61 to 18.14)16.12
(14.61 to 17.62)14.74
(13.23 to 16.25)4 11.14
(10.77 to 11.51)13.32
(12.47 to 14.16)13.72
(12.91 to 14.54)12.61
(11.82 to 13.40)11.55
(10.87 to 12.24)10.44
(8.95 to 11.93)10.71
(9.28 to 12.14)10.15
(8.79 to 11.52)9.48
(8.33 to 10.63)8.98
(7.75 to 10.20)5 5.76
(5.49 to 6.03)7.89
(7.22 to 8.55)8.01
(7.44 to 8.59)6.72
(6.05 to 7.38)5.91
(5.45 to 6.37)5.40
(4.18 to 6.62)5.52
(4.53 to 6.50)4.68
(3.76 to 5.60)4.24
(3.45 to 5.03)4.12
(3.29 to 4.95)≥ 6 3.24
(3.05 to 3.44)4.57
(4.09 to 5.05)4.41
(3.98 to 4.83)4.15
(3.58 to 4.72)3.74
(3.35 to 4.13)2.62
(1.94 to 3.31)3.47
(2.60 to 4.35)2.36
(1.70 to 3.02)2.28
(1.72 to 2.85)1.95
(1.49 to 2.41)Cumulative unfavorable SDOH, weighted % (95% CI) Low-burden (≤ 2) 62.96
(62.10 to 63.82)54.78
(53.13 to 56.43)54.72
(53.33 to 56.11)58.21
(56.46 to 59.95)61.75
(60.31 to 63.19)65.35
(61.79 to 68.92)64.84
(61.15 to 68.53)66.43
(63.17 to 69.69)67.88
(65.12 to 70.65)70.21
(67.11 to 73.32)High-burden (> 2) 37.04
(36.18 to 37.90)45.22
(43.57 to 46.87)45.28
(43.89 to 46.67)41.79
(40.05 to 43.54)38.25
(36.81 to 39.69)34.65
(31.08 to 38.21)35.16
(31.47 to 38.85)33.57
(30.31 to 36.83)32.12
(29.35 to 34.88)29.79
(26.68 to 32.89)Note. *According to Asian-Pacific guidelines, BMI is divided into four groups: underweight (< 18.5 kg/m2), normal weight (18.5–22.9 kg/m2), overweight (23.0–24.9 kg/m2), and obese (≥ 25.0 kg/m2); BMI, body mass index; CI: confidence interval; KNHANES, Korea National Health and Nutrition Examination Survey; SDOH, social determinants of health. Table 1. General characteristics of Korean adults based on data obtained from the KNHANES, 2007–2024 (n=85,695)
-
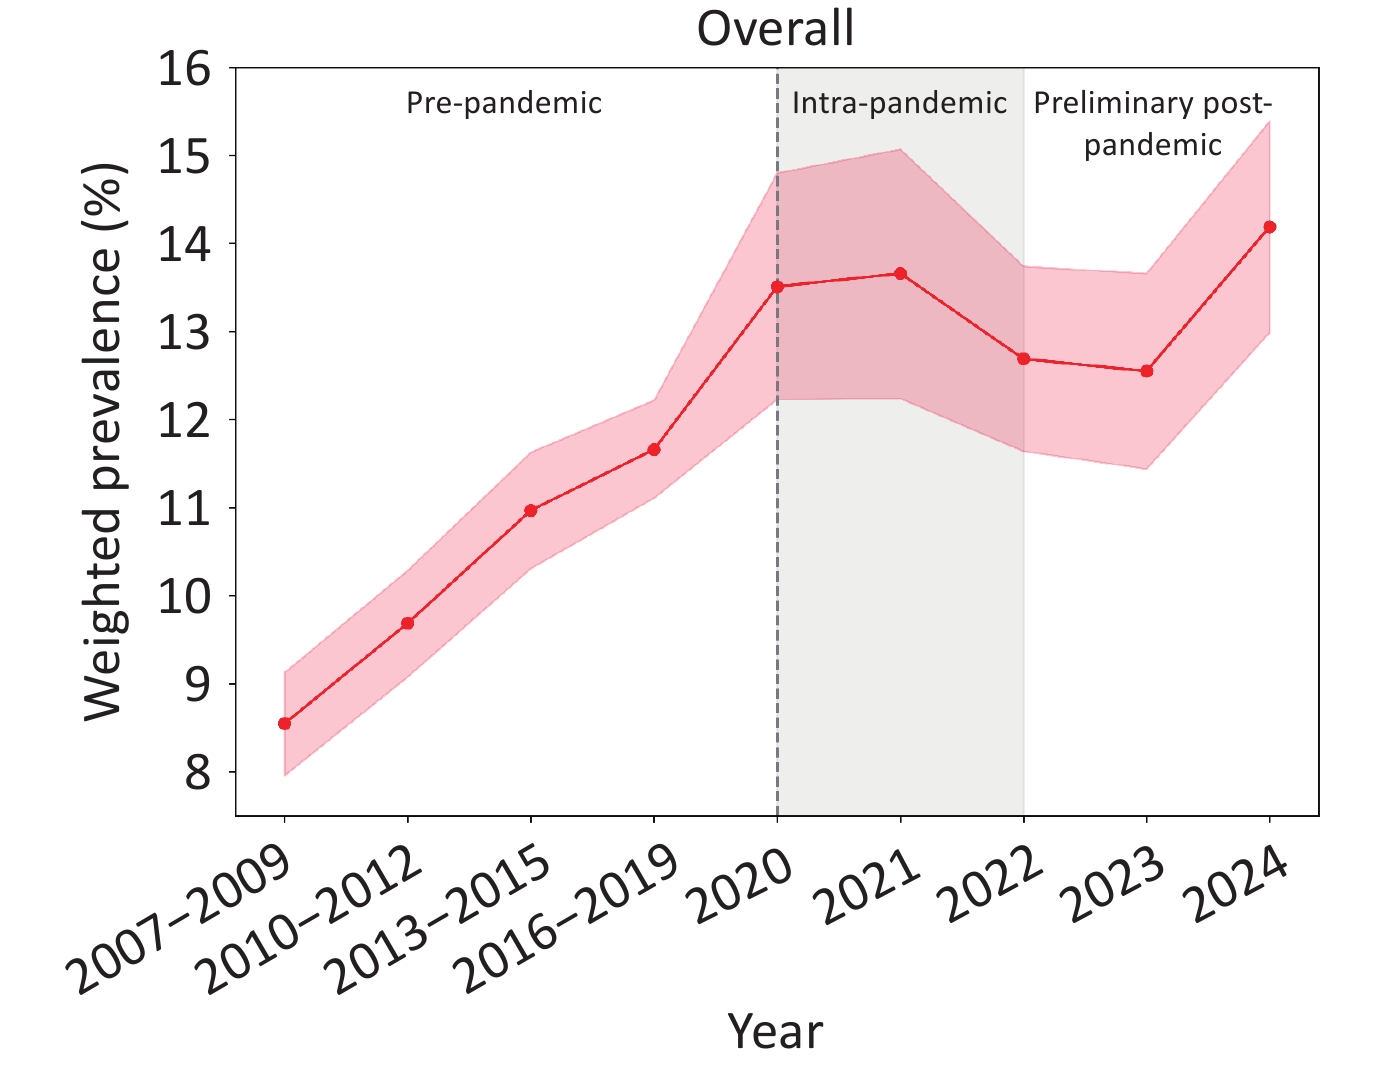
Figure 1 and Table 2 present the weighted prevalence of T2DM across the pre-, intra-, and preliminary post-pandemic periods. The overall prevalence of T2DM showed a consistent increasing trend, rising from 8.55% (95% CI: 7.96 to 9.13) in 2007–2009 to a peak of 13.66% (12.24 to 15.07) in 2021. Notably, the onset of the COVID-19 pandemic marked a significant surge in prevalence, with the odds of having T2DM in 2020 being higher than in the 2016–2019 period (aOR = 1.18, 95% CI: 1.04 to 1.35) (Supplementary Table S3); however, the rate of increase was significantly decelerated at the transition from the pre- to intra-pandemic period prevalence (βdiff, -0.051 [95% CI: -0.097 to -0.004]; P for interaction <0.05) (Supplementary Table S4). Furthermore, following the peak of 2021, prevalence declined through 2022–2023 before rebounding to 14.19% (12.99 to 15.39) in 2024. These trends remained consistent generally when age-standardized prevalence was calculated (Supplementary Tables S5).
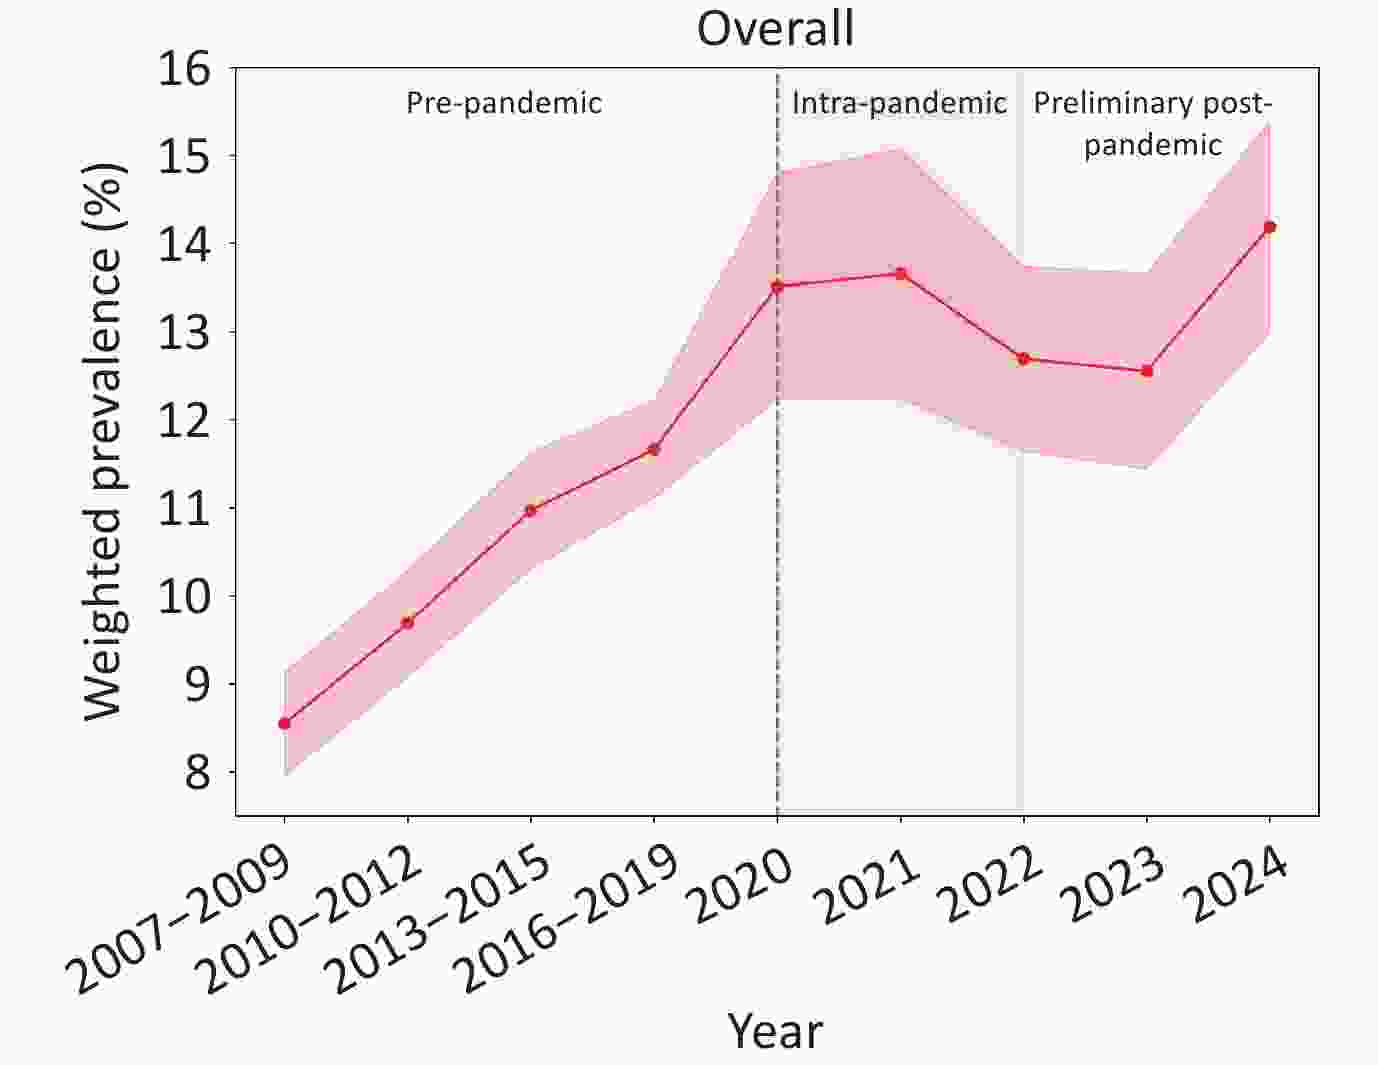
Figure 1. Trends in T2DM prevalence during the pre-, intra-, and preliminary post-pandemic periods from 2007 to 2024 (n=85,745), and shaded regions indicate 95% CIs. Abbreviations: CI: confidence intervals; T2DM, type 2 diabetes mellitus.
Group Pre-pandemic Intra-pandemic Preliminary post-pandemic 2007–2009 2010–2012 2013–2015 2016–2019 2020 2021 2022 2023 2024 Overall 8.55 (7.96 to 9.13) 9.69 (9.08 to 10.29) 10.97 (10.31 to 11.63) 11.66 (11.11 to 12.22) 13.51 (12.23 to 14.80) 13.66 (12.24 to 15.07) 12.69 (11.64 to 13.74) 12.55 (11.44 to 13.66) 14.19 (12.99 to 15.39) Sex Male 9.49 (8.59 to 10.39) 10.73 (9.82 to 11.64) 12.33 (11.37 to 13.29) 13.17 (12.35 to 13.98) 15.79 (13.86 to 17.72) 15.85 (13.77 to 17.93) 15.23 (13.56 to 16.90) 15.12 (13.50 to 16.73) 16.55 (14.90 to 18.20) Female 7.64 (6.97 to 8.32) 8.67 (7.93 to 9.41) 9.67 (8.91 to 10.43) 10.19 (9.52 to 10.85) 11.24 (9.82 to 12.67) 11.49 (9.91 to 13.07) 10.16 (8.85 to 11.46) 10.05 (8.83 to 11.26) 11.81 (10.35 to 13.27) Age group (years) 19– 1.87 (1.39 to 2.35) 2.02 (1.51 to 2.53) 1.71 (1.26 to 2.16) 2.09 (1.68 to 2.51) 2.19 (1.27 to 3.10) 1.87 (0.82 to 2.91) 2.23 (1.27 to 3.20) 2.18 (1.24 to 3.11) 2.70 (1.51 to 3.90) 40– 9.52 (8.56 to 10.49) 10.60 (9.58 to 11.61) 11.14 (10.13 to 12.16) 11.35 (10.51 to 12.19) 14.07 (11.92 to 16.23) 12.72 (10.72 to 14.72) 13.12 (11.13 to 15.11) 11.67 (10.08 to 13.26) 12.23 (10.84 to 13.62) 60– 22.84 (20.78 to 24.91) 22.09 (20.28 to 23.91) 25.89 (23.74 to 28.04) 22.55 (20.98 to 24.13) 26.94 (23.02 to 30.85) 25.68 (22.48 to 28.89) 21.84 (18.94 to 24.74) 23.56 (20.92 to 26.20) 26.21 (23.32 to 29.11) ≥ 70 20.23 (17.85 to 22.61) 24.65 (22.52 to 26.77) 29.23 (26.90 to 31.56) 30.05 (28.24 to 31.85) 30.87 (26.85 to 34.90) 33.34 (29.45 to 37.23) 26.71 (23.68 to 29.74) 27.13 (24.04 to 30.23) 30.78 (27.58 to 33.98) Region of residence Urban 8.67 (7.79 to 9.55) 8.12 (7.32 to 8.92) 10.99 (9.99 to 11.98) 11.20 (10.39 to 12.00) 12.06 (10.02 to 14.11) 12.39 (10.27 to 14.51) 11.81 (10.28 to 13.33) 11.81 (10.30 to 13.33) 13.76 (11.83 to 15.68) Rural 8.44 (7.66 to 9.21) 11.15 (10.26 to 12.05) 10.96 (10.07 to 11.84) 12.12 (11.33 to 12.90) 14.78 (13.17 to 16.39) 14.84 (12.93 to 16.75) 13.38 (11.93 to 14.83) 13.16 (11.56 to 14.77) 14.55 (13.04 to 16.06) BMI group* Underweight 2.66 (1.42 to 3.91) 3.51 (1.96 to 5.06) 2.68 (1.34 to 4.02) 3.10 (1.72 to 4.49) 2.92 (0.00 to 6.73) 2.19 (0.70 to 3.68) 4.61 (1.38 to 7.84) 7.05 (3.66 to 10.44) 3.29 (0.67 to 5.90) Normal 4.90 (4.22 to 5.58) 6.39 (5.66 to 7.12) 7.25 (6.46 to 8.04) 6.98 (6.37 to 7.59) 8.07 (6.48 to 9.66) 9.39 (7.60 to 11.18) 8.49 (7.16 to 9.83) 7.71 (6.45 to 8.97) 8.56 (7.19 to 9.94) Overweight 8.26 (7.21 to 9.30) 9.55 (8.41 to 10.68) 11.62 (10.40 to 12.85) 11.70 (10.70 to 12.70) 14.71 (12.06 to 17.36) 12.20 (9.93 to 14.46) 11.37 (9.39 to 13.35) 13.20 (11.22 to 15.17) 14.93 (12.82 to 17.04) Obese 14.34 (13.08 to 15.59) 14.91 (13.63 to 16.18) 16.22 (14.96 to 17.48) 17.93 (16.90 to 18.96) 18.94 (16.79 to 21.09) 19.92 (17.43 to 22.41) 18.65 (16.50 to 20.80) 17.79 (15.99 to 19.59) 20.26 (18.23 to 22.29) Smoking status Never smoker 7.80 (7.12 to 8.48) 8.35 (7.63 to 9.07) 9.59 (8.82 to 10.35) 10.06 (9.42 to 10.70) 11.51 (10.09 to 12.92) 11.33 (9.75 to 12.91) 10.24 (9.01 to 11.46) 10.55 (9.29 to 11.81) 11.75 (10.29 to 13.22) Ex-smoker 11.53 (10.08 to 12.97) 12.97 (11.52 to 14.42) 13.74 (12.25 to 15.23) 15.47 (14.30 to 16.64) 16.67 (14.11 to 19.22) 18.22 (15.59 to 20.85) 15.29 (13.05 to 17.52) 15.64 (13.25 to 18.02) 19.03 (16.69 to 21.38) Current smoker 7.75 (6.65 to 8.85) 9.88 (8.68 to 11.08) 12.04 (10.63 to 13.44) 11.98 (10.78 to 13.18) 15.63 (12.61 to 18.66) 15.05 (11.44 to 18.66) 16.87 (14.05 to 19.68) 14.97 (12.47 to 17.47) 15.60 (12.84 to 18.36) Drinking status Never drinker 13.44 (11.65 to 15.22) 16.59 (14.70 to 18.48) 19.68 (17.46 to 21.90) 21.52 (19.63 to 23.42) 22.66 (17.30 to 28.02) 21.91 (17.75 to 26.07) 21.38 (16.92 to 25.84) 18.78 (15.34 to 22.23) 23.77 (19.44 to 28.09) Ex-drinker 14.36 (12.68 to 16.05) 13.34 (11.56 to 15.12) 14.12 (12.53 to 15.71) 15.72 (14.28 to 17.15) 17.32 (14.44 to 20.19) 19.23 (16.08 to 22.38) 17.83 (14.91 to 20.75) 18.59 (15.97 to 21.21) 18.51 (15.85 to 21.16) Current drinker 6.85 (6.23 to 7.47) 8.12 (7.45 to 8.79) 9.24 (8.57 to 9.92) 9.80 (9.22 to 10.39) 11.65 (10.28 to 13.02) 11.15 (9.74 to 12.56) 10.63 (9.42 to 11.83) 10.55 (9.36 to 11.75) 12.31 (11.05 to 13.56) Blood pressure Normal 3.39 (2.89 to 3.89) 4.05 (3.51 to 4.60) 4.59 (4.01 to 5.18) 4.86 (4.35 to 5.37) 5.86 (4.53 to 7.19) 5.72 (4.49 to 6.95) 5.30 (4.33 to 6.28) 5.05 (4.15 to 5.95) 5.75 (4.68 to 6.82) Elevated 10.01 (7.48 to 12.55) 10.04 (7.70 to 12.38) 13.37 (10.88 to 15.86) 14.60 (12.34 to 16.85) 14.35 (10.28 to 18.42) 11.69 (8.06 to 15.32) 9.25 (6.37 to 12.13) 11.71 (8.51 to 14.90) 11.31 (8.20 to 14.42) Stage 1 hypertension 7.54 (6.22 to 8.86) 8.38 (7.11 to 9.65) 10.12 (8.70 to 11.54) 8.13 (7.17 to 9.10) 10.94 (8.70 to 13.19) 11.82 (9.03 to 14.62) 12.42 (9.24 to 15.61) 10.50 (8.32 to 12.68) 10.31 (8.11 to 12.51) Stage 2 hypertension 19.34 (17.87 to 20.80) 20.34 (18.99 to 21.70) 24.35 (22.70 to 25.99) 25.28 (24.02 to 26.54) 28.59 (25.48 to 31.70) 29.30 (26.57 to 32.03) 25.77 (23.17 to 28.38) 27.66 (25.37 to 29.95) 29.96 (27.45 to 32.48) Physical activity Insufficient 9.00 (7.95 to 10.05) 11.32 (10.29 to 12.34) 13.28 (12.28 to 14.29) 13.72 (12.95 to 14.48) 14.77 (12.99 to 16.55) 16.79 (14.91 to 18.67) 15.43 (13.79 to 17.07) 15.29 (13.89 to 16.69) 17.51 (15.90 to 19.13) Sufficient 8.40 (7.75 to 9.05) 8.96 (8.24 to 9.69) 9.42 (8.64 to 10.21) 9.34 (8.66 to 10.03) 11.96 (10.27 to 13.65) 9.86 (8.24 to 11.48) 9.95 (8.61 to 11.28) 9.75 (8.34 to 11.15) 10.54 (8.95 to 12.13) Education level High 6.20 (5.65 to 6.75) 6.02 (5.43 to 6.60) 7.44 (6.82 to 8.06) 8.21 (7.70 to 8.73) 10.47 (9.29 to 11.64) 10.34 (9.04 to 11.65) 10.13 (9.05 to 11.21) 9.85 (8.73 to 10.96) 11.13 (10.07 to 12.19) Low 19.02 (17.41 to 20.64) 19.64 (18.32 to 20.96) 22.80 (21.23 to 24.38) 25.31 (23.97 to 26.65) 28.58 (25.25 to 31.90) 29.08 (26.03 to 32.13) 25.57 (22.61 to 28.54) 26.02 (23.38 to 28.66) 28.73 (25.65 to 31.81) Marital status Married 9.60 (8.85 to 10.35) 10.65 (9.91 to 11.39) 11.94 (11.15 to 12.74) 12.85 (12.17 to 13.53) 15.50 (13.76 to 17.25) 15.36 (13.46 to 17.26) 14.03 (12.62 to 15.45) 14.39 (12.88 to 15.89) 16.57 (15.07 to 18.07) Single, separated, widowed, or divorced 6.11 (5.28 to 6.94) 7.59 (6.68 to 8.50) 8.94 (7.94 to 9.93) 9.34 (8.51 to 10.17) 10.00 (8.40 to 11.61) 10.72 (8.94 to 12.49) 10.33 (8.63 to 12.03) 9.41 (7.89 to 10.94) 10.21 (8.50 to 11.93) Household income High 6.22 (5.57 to 6.87) 7.49 (6.75 to 8.23) 7.89 (7.21 to 8.57) 8.47 (7.89 to 9.05) 10.95 (9.55 to 12.35) 9.28 (7.91 to 10.65) 9.70 (8.52 to 10.89) 10.10 (8.86 to 11.34) 11.99 (10.73 to 13.26) Low 11.88 (10.90 to 12.86) 12.60 (11.72 to 13.48) 15.79 (14.67 to 16.90) 16.80 (15.87 to 17.74) 18.33 (16.10 to 20.55) 21.58 (19.33 to 23.83) 17.70 (15.84 to 19.56) 16.84 (15.05 to 18.63) 18.00 (15.61 to 20.39) Food security Full security 7.45 (6.68 to 8.22) 8.85 (7.96 to 9.75) 10.14 (9.30 to 10.97) 10.57 (9.88 to 11.25) 12.85 (11.29 to 14.41) 12.43 (10.74 to 14.11) 11.46 (10.34 to 12.58) 11.57 (10.34 to 12.81) 13.43 (12.25 to 14.62) Marginal, low, or very low security 9.33 (8.55 to 10.12) 10.32 (9.52 to 11.12) 11.78 (10.85 to 12.71) 13.11 (12.29 to 13.93) 14.74 (12.81 to 16.67) 16.15 (14.19 to 18.11) 15.66 (13.25 to 18.07) 15.01 (13.05 to 16.97) 17.21 (14.56 to 19.86) Type of health insurance Private 6.29 (5.73 to 6.86) 7.01 (6.39 to 7.63) 8.34 (7.69 to 8.99) 9.41 (8.87 to 9.95) 11.91 (10.73 to 13.08) 11.36 (10.02 to 12.69) 11.37 (10.26 to 12.49) 11.27 (10.13 to 12.42) 12.93 (11.72 to 14.14) Government or none 14.41 (13.09 to 15.74) 17.75 (16.34 to 19.17) 21.29 (19.59 to 22.98) 22.34 (20.88 to 23.80) 23.48 (20.01 to 26.95) 25.39 (21.97 to 28.82) 21.00 (18.12 to 23.87) 21.06 (18.26 to 23.85) 23.89 (20.40 to 27.38) Employment status Employed, student, or retired 7.15 (6.42 to 7.88) 8.34 (7.59 to 9.09) 9.14 (8.40 to 9.89) 10.01 (9.39 to 10.63) 11.82 (10.35 to 13.28) 11.57 (10.10 to 13.04) 10.67 (9.28 to 12.06) 11.47 (10.29 to 12.65) 12.52 (11.28 to 13.76) Unemployed 10.68 (9.71 to 11.65) 12.10 (11.14 to 13.05) 14.04 (12.92 to 15.15) 14.58 (13.63 to 15.53) 16.40 (14.43 to 18.37) 17.31 (14.96 to 19.65) 16.42 (14.59 to 18.25) 14.71 (12.87 to 16.55) 17.64 (15.39 to 19.90) Home ownership Own home 9.22 (8.50 to 9.93) 10.23 (9.52 to 10.95) 11.63 (10.86 to 12.40) 11.99 (11.35 to 12.63) 14.31 (12.84 to 15.78) 13.07 (11.34 to 14.80) 12.72 (11.40 to 14.04) 13.50 (12.16 to 14.84) 14.80 (13.51 to 16.10) Rent home or other arrangement 7.24 (6.30 to 8.18) 8.49 (7.46 to 9.51) 9.71 (8.66 to 10.75) 10.99 (10.02 to 11.96) 11.86 (9.68 to 14.04) 14.82 (12.74 to 16.90) 12.62 (10.82 to 14.41) 10.48 (8.78 to 12.19) 12.72 (10.50 to 14.95) SDOH burden score 0 7.02 (5.34 to 8.70) 7.83 (5.89 to 9.78) 7.74 (6.02 to 9.46) 9.04 (7.77 to 10.30) 12.98 (9.81 to 16.15) 9.28 (6.49 to 12.07) 9.49 (6.85 to 12.13) 11.22 (9.10 to 13.33) 13.25 (11.03 to 15.48) 1 6.64 (5.58 to 7.71) 6.55 (5.53 to 7.58) 7.88 (6.72 to 9.04) 8.78 (7.84 to 9.73) 11.36 (9.27 to 13.45) 9.68 (7.22 to 12.15) 9.49 (7.62 to 11.35) 9.67 (7.67 to 11.66) 11.99 (10.09 to 13.89) 2 5.70 (4.75 to 6.65) 6.98 (5.96 to 8.01) 8.17 (7.13 to 9.20) 8.86 (7.96 to 9.75) 9.89 (7.51 to 12.28) 10.71 (8.46 to 12.95) 12.31 (10.03 to 14.59) 11.91 (9.90 to 13.91) 10.94 (8.92 to 12.97) 3 8.12 (6.86 to 9.38) 8.91 (7.65 to 10.17) 10.33 (9.08 to 11.59) 10.93 (9.77 to 12.09) 13.85 (10.74 to 16.96) 16.21 (12.96 to 19.46) 14.19 (11.43 to 16.94) 12.72 (10.50 to 14.94) 15.49 (12.34 to 18.65) 4 10.42 (8.81 to 12.04) 13.27 (11.59 to 14.94) 15.24 (13.27 to 17.22) 16.67 (15.01 to 18.33) 18.24 (14.19 to 22.28) 19.25 (15.44 to 23.06) 14.04 (10.42 to 17.65) 16.44 (13.26 to 19.62) 21.37 (16.81 to 25.93) 5 14.72 (12.34 to 17.10) 16.01 (13.59 to 18.43) 21.30 (18.45 to 24.15) 21.10 (18.89 to 23.32) 20.81 (15.60 to 26.01) 28.97 (22.79 to 35.14) 22.82 (17.39 to 28.25) 23.45 (18.17 to 28.73) 25.17 (18.47 to 31.88) ≥ 6 21.27 (17.97 to 24.58) 24.29 (20.67 to 27.90) 26.12 (22.61 to 29.62) 30.81 (27.64 to 33.98) 34.48 (26.29 to 42.66) 30.01 (23.53 to 36.49) 38.56 (30.75 to 46.37) 24.82 (18.12 to 31.52) 25.81 (17.83 to 33.79) Cumulative unfavorable SDOH Low-burden (≤ 2) 6.29 (5.62 to 6.97) 6.96 (6.23 to 7.69) 7.98 (7.29 to 8.67) 8.87 (8.28 to 9.46) 11.23 (9.78 to 12.69) 9.94 (8.48 to 11.41) 10.48 (9.26 to 11.70) 10.87 (9.61 to 12.14) 12.03 (10.87 to 13.19) High-burden (> 2) 11.28 (10.31 to 12.25) 12.98 (12.07 to 13.90) 15.14 (14.07 to 16.22) 16.18 (15.24 to 17.12) 17.82 (15.70 to 19.94) 20.50 (18.28 to 22.72) 17.06 (15.11 to 19.01) 16.09 (14.27 to 17.92) 19.28 (16.56 to 21.99) Note. *According to Asian-Pacific guidelines, BMI is divided into four groups: underweight (< 18.5 kg/m2), normal weight (18.5–22.9 kg/m2), overweight (23.0–24.9 kg/m2), and obese (≥ 25.0 kg/m2). BMI, body mass index; CI: confidence interval; KNHANES, Korea National Health and Nutrition Examination Survey; SDOH, social determinants of health; T2DM, type 2 diabetes mellitus. Table 2. Weighted trends in the prevalence of T2DM pre-, intra-, preliminary post-pandemic (weighted % [95% CI]) based on data obtained from the KNHANES
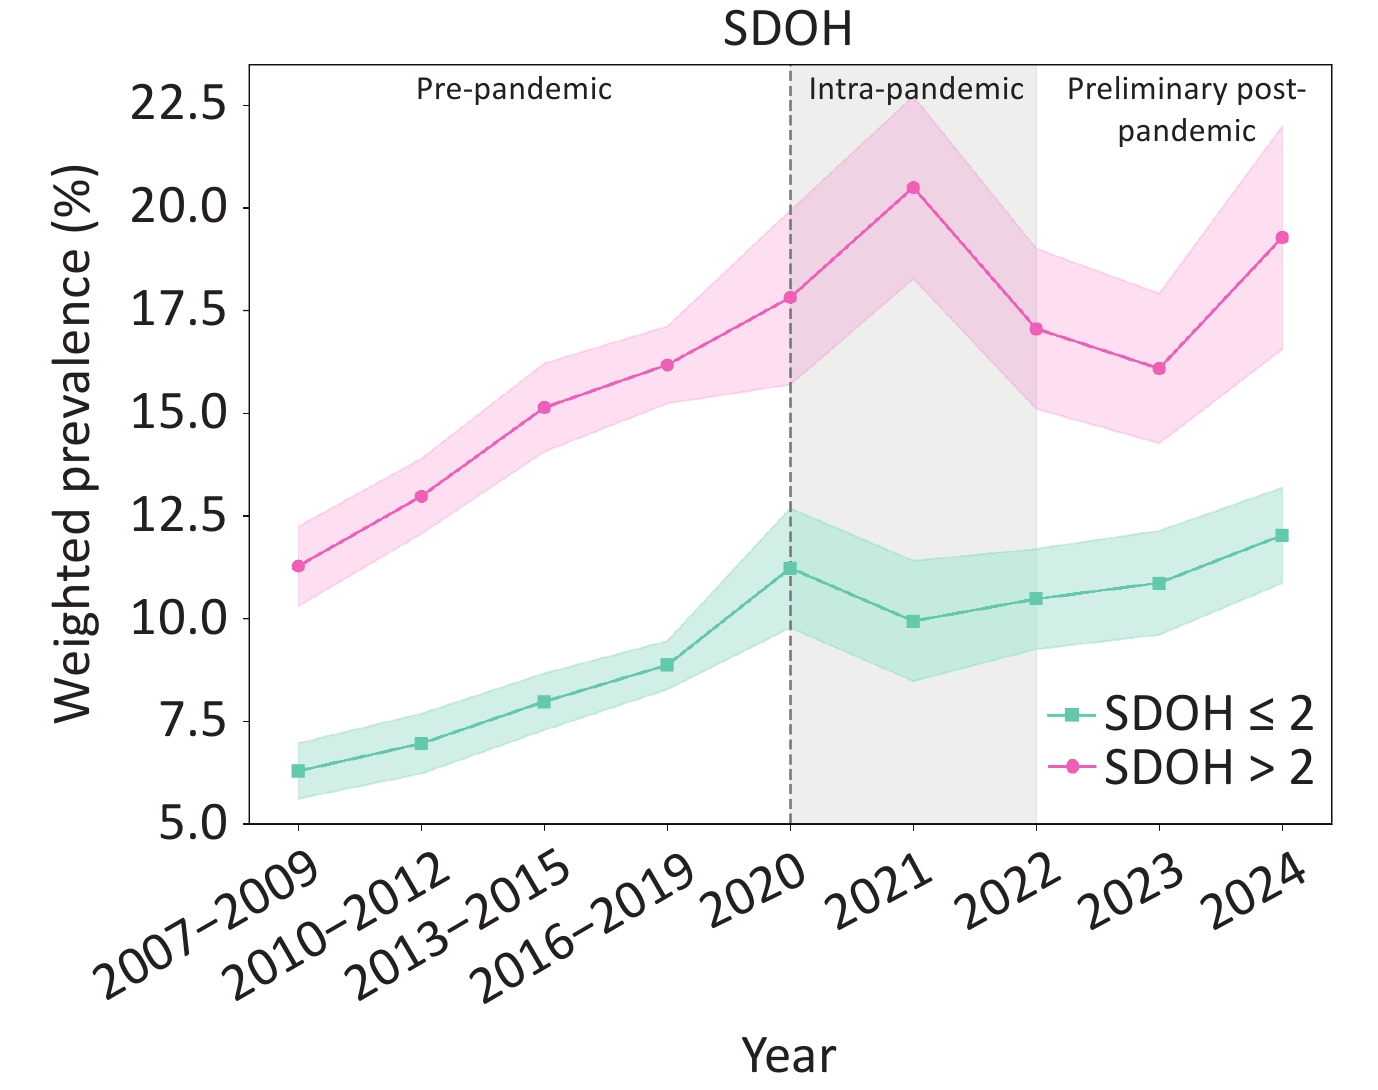
Consistent with these overall trends, the burden of T2DM was disproportionately higher among socially disadvantaged groups. When stratified by cumulative unfavorable SDOH (Figure 2), both low- and high-burden groups exhibited the same overarching pattern of rising T2DM prevalence across periods. However, individuals with a cumulative SDOH score greater than 2 consistently showed substantially higher prevalence levels than those with lower SDOH burden across all time points. Furthermore, a clear dose-response relationship was observed, with T2DM prevalence increasing progressively with higher SDOH burden scores across all survey periods.
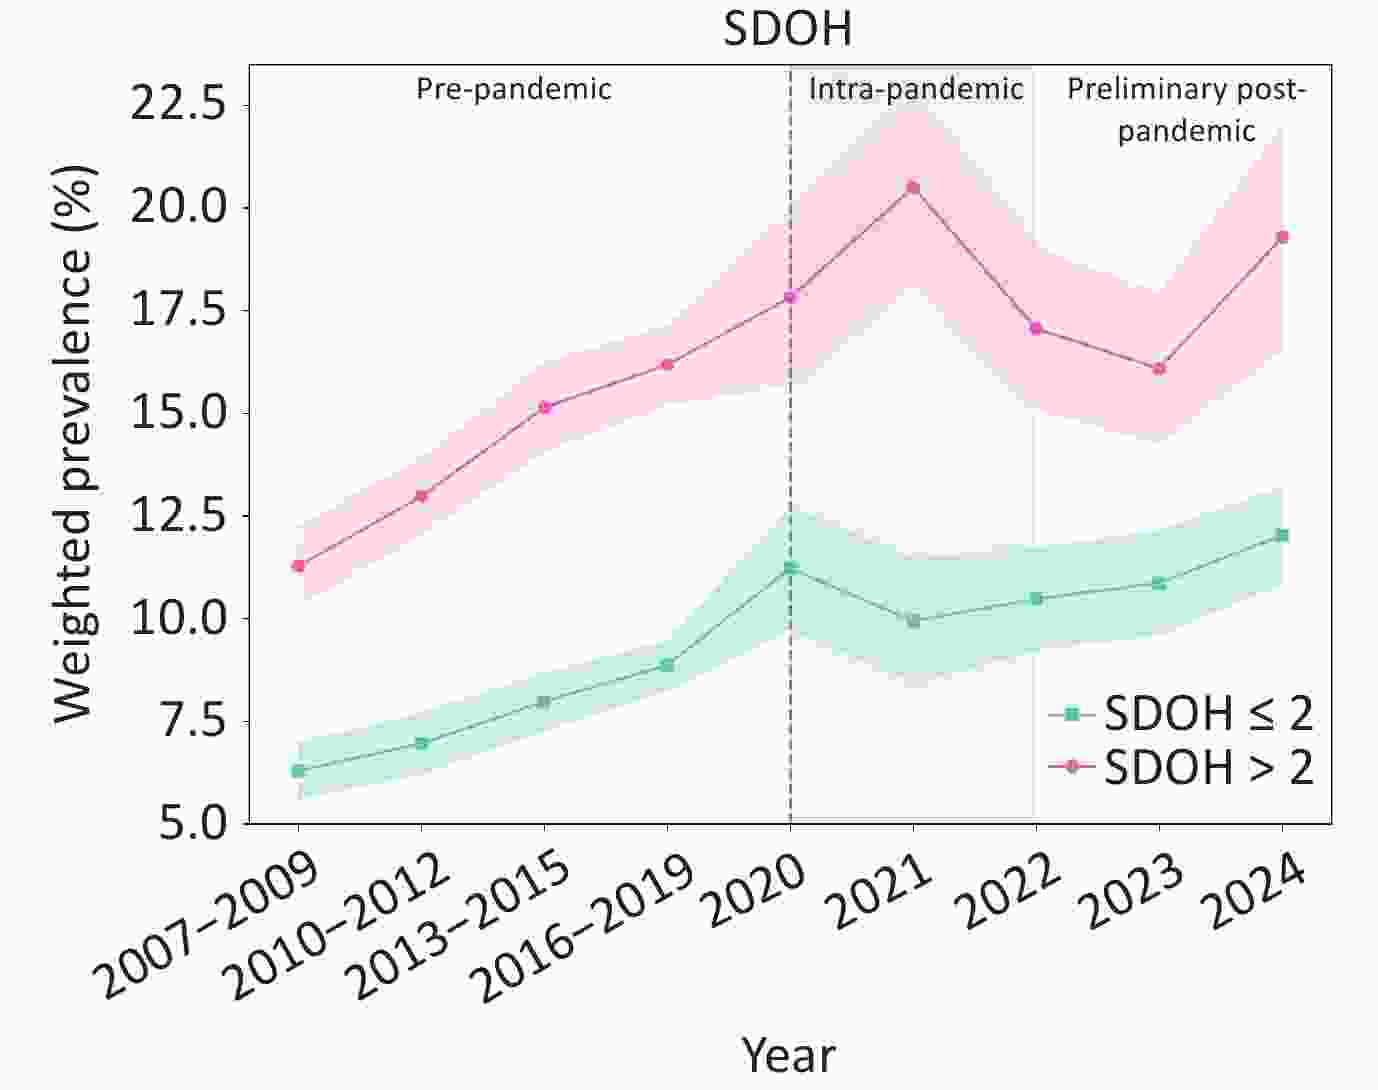
Figure 2. Cumulative SDOH-specific trends in T2DM prevalence during pre-, intra-, preliminary post-pandemic periods from 2007 to 2024, and shaded regions indicate 95% CIs. Groups were categorized based on the cumulative count of adverse SDOH factors: low burden (≤ 2) and high burden (> 2). Abbreviations: CIs, confidence intervals; SDOH, social determinants of health; T2DM, type 2 diabetes mellitus.
-
Table 3 summarizes the aOR for sociodemographic factors associated with T2DM prevalence. Individuals with high-burden group had a higher likelihood of T2DM compared to those with low-burden group (aOR, 1.33 [95% CI: 1.25 to 1.41]), highlighting the cumulative influence of social disadvantage on T2DM risk. This association exhibited a significant graded impact, where the risk of T2DM progressively escalated with increasing raw SDOH scores (continuous value: aOR, 1.11 [95%CI: 1.09 to 1.13]). Specifically, compared to a score of 0, the risk significantly increased starting from a score of 3 (aOR, 1.30 [95% CI: 1.17 to 1.45]) and peaking at a score of ≥ 6 (1.79 [1.58 to 2.04]). Age-standardized aORs for the cumulative SDOH score and burden group yielded consistent associations (Supplementary Table S6). A similar graded pattern was also observed using the weighted SDOH score, both as a continuous variable and across quartiles (Supplementary Table S7). Further mediation analysis suggested that lifestyle factors may not fully account for the observed association between SDOH burden and T2DM risk. Overweight or obesity and insufficient physical activity showed no significant mediating effects, while smoking and drinking status showed only minimal indirect effects (Supplementary Table S8).
Variables Overall (2007–2024) Pre-pandemic (2007–2019) Intra-pandemic (2020–2022) Preliminary post-pandemic (2023–2024) aOR (95% CI)a P-value aOR (95% CI) P-value aOR (95% CI) P-value aOR (95% CI) P-value Sex Female 1.00 (ref) 1.00 (ref) 1.00 (ref) 1.00 (ref) Male 1.29 (1.20 to 1.39) < 0.001 1.26 (1.15 to 1.38) < 0.001 1.27 (1.14 to 1.41) < 0.001 1.39 (1.18 to 1.63) < 0.001 Age group (years) 19- 1.00 (ref) 1.00 (ref) 1.00 (ref) 1.00 (ref) 40- 4.73 (4.21 to 5.31) < 0.001 4.65 (4.07 to 5.32) <0.001 5.04 (4.20 to 6.05) < 0.001 4.22 (3.22 to 5.53) < 0.001 60- 9.71 (8.61 to 10.95) < 0.001 9.68 (8.40 to 11.15) <0.001 9.55 (7.92 to 11.52) < 0.001 8.12 (6.15 to 10.73) < 0.001 ≥70 10.78 (9.53 to 12.19) < 0.001 10.79 (9.34 to 12.48) <0.001 11.65 (9.62 to 14.10) < 0.001 8.68 (6.47 to 11.64) < 0.001 Region of residence Urban 1.00 (ref) 1.00 (ref) 1.00 (ref) 1.00 (ref) Rural 0.99 (0.94 to 1.05) 0.746 0.99 (0.93 to 1.05) 0.682 1.00 (0.92 to 1.09) 0.954 0.96 (0.86 to 1.08) 0.068 BMI group* Underweight 1.00 (ref) 1.00 (ref) 1.00 (ref) 1.00 (ref) Normal 1.65 (1.35 to 2.03) < 0.001 1.72 (1.34 to 2.22) < 0.001 1.94 (1.34 to 2.81) < 0.001 1.20 (0.81 to 1.79) 0.005 Overweight 2.12 (1.73 to 2.62) < 0.001 2.23 (1.72 to 2.88) < 0.001 2.46 (1.70 to 3.56) < 0.001 1.53 (1.03 to 2.27) < 0.001 Obese 3.41 (2.78 to 4.19) < 0.001 3.57 (2.78 to 4.59) < 0.001 4.11 (2.85 to 5.93) < 0.001 2.47 (1.66 to 3.65) < 0.001 Smoking status Never smoker 1.00 (ref) 1.00 (ref) 1.00 (ref) 1.00 (ref) Ex-smoker 1.17 (1.08 to 1.27) < 0.001 1.17 (1.06 to 1.29) 0.003 1.20 (1.07 to 1.35) 0.002 1.16 (0.98 to 1.38) < 0.001 Current smoker 1.46 (1.34 to 1.59) < 0.001 1.43 (1.29 to 1.59) < 0.001 1.54 (1.35 to 1.77) < 0.001 1.52 (1.25 to 1.84) < 0.001 Drinking status Never drinker 1.00 (ref) 1.00 (ref) 1.00 (ref) 1.00 (ref) Ex-drinker 0.98 (0.91 to 1.07) 0.693 0.98 (0.89 to 1.08) 0.718 0.90 (0.78 to 1.03) 0.109 0.97 (0.80 to 1.19) 0.041 Current drinker 0.72 (0.67 to 0.78) < 0.001 0.72 (0.66 to 0.79) < 0.001 0.68 (0.60 to 0.77) < 0.001 0.69 (0.58 to 0.83) < 0.001 Blood pressure Normal 1.00 (ref) 1.00 (ref) 1.00 (ref) 1.00 (ref) Elevated 1.59 (1.43 to 1.78) < 0.001 1.71 (1.49 to 1.96) < 0.001 1.59 (1.35 to 1.87) < 0.001 1.38 (1.10 to 1.72) < 0.001 Stage 1 hypertension 1.33 (1.22 to 1.45) < 0.001 1.34 (1.21 to 1.48) < 0.001 1.24 (1.09 to 1.41) 0.001 1.32 (1.09 to 1.60) < 0.001 Stage 2 hypertension 2.46 (2.29 to 2.64) < 0.001 2.41 (2.22 to 2.63) < 0.001 2.44 (2.19 to 2.73) < 0.001 2.65 (2.26 to 3.10) < 0.001 Physical activity Sufficient 1.00 (ref) 1.00 (ref) 1.00 (ref) 1.00 (ref) Insufficient 1.18 (1.12 to 1.24) < 0.001 1.15 (1.09 to 1.23) < 0.001 1.12 (1.03 to 1.21) 0.009 1.18 (1.06 to 1.33) < 0.001 Education level High 1.00 (ref) 1.00 (ref) 1.00 (ref) 1.00 (ref) Low 1.25 (1.17 to 1.33) < 0.001 1.33 (1.23 to 1.43) < 0.001 1.28 (1.16 to 1.41) < 0.001 1.17 (1.02 to 1.34) 0.027 Marital status Married 1.00 (ref) 1.00 (ref) 1.00 (ref) 1.00 (ref) Single, separated, widowed, or divorced 1.09 (1.03 to 1.16) 0.005 1.04 (0.97 to 1.13) 0.293 1.17 (1.06 to 1.28) 0.001 1.14 (1.01 to 1.30) 0.042 Household income High 1.00 (ref) 1.00 (ref) 1.00 (ref) 1.00 (ref) Low 1.25 (1.18 to 1.32) < 0.001 1.30 (1.21 to 1.39) < 0.001 1.34 (1.23 to 1.47) < 0.001 1.12 (0.98 to 1.27) 0.090 Food security Full security 1.00 (ref) 1.00 (ref) 1.00 (ref) 1.00 (ref) Marginal, low, or very low security 1.05 (0.99 to 1.10) 0.083 1.07 (1.00 to 1.14) 0.045 1.06 (0.98 to 1.15) 0.122 1.15 (1.02 to 1.30) 0.028 Type of health insurance Private 1.00 (ref) 1.00 (ref) 1.00 (ref) 1.00 (ref) Government or none 1.30 (1.22 to 1.39) < 0.001 1.40 (1.29 to 1.51) < 0.001 1.31 (1.19 to 1.44) < 0.001 1.10 (0.96 to 1.27) 0.173 Employment status Employed, student, or retired 1.00 (ref) 1.00 (ref) 1.00 (ref) 1.00 (ref) Unemployed 1.25 (1.18 to 1.33) < 0.001 1.27 (1.18 to 1.36) < 0.001 1.26 (1.15 to 1.38) < 0.001 1.17 (1.04 to 1.33) 0.012 Home ownership Own home 1.00 (ref) 1.00 (ref) 1.00 (ref) 1.00 (ref) Rent home or other arrangement 1.14 (1.08 to 1.21) < 0.001 1.11 (1.03 to 1.19) 0.005 1.25 (1.14 to 1.36) < 0.001 1.16 (1.02 to 1.31) 0.022 SDOH burden score 0 1.00 (ref) 1.00 (ref) 1.00 (ref) 1.00 (ref) 1 1.08 (0.98 to 1.19) 0.141 1.08 (0.95 to 1.24) 0.244 1.15 (0.99 to 1.34) 0.062 1.11 (0.92 to 1.34) 0.272 2 1.13 (1.02 to 1.26) 0.019 1.13 (0.99 to 1.30) 0.074 1.26 (1.08 to 1.47) 0.004 1.27 (1.04 to 1.55) 0.021 3 1.30 (1.17 to 1.45) < 0.001 1.34 (1.17 to 1.54) < 0.001 1.43 (1.22 to 1.68) < 0.001 1.27 (1.03 to 1.56) 0.027 4 1.48 (1.32 to 1.65) < 0.001 1.59 (1.38 to 1.85) < 0.001 1.62 (1.37 to 1.93) < 0.001 1.32 (1.04 to 1.67) 0.022 5 1.62 (1.43 to 1.83) < 0.001 1.68 (1.43 to 1.96) < 0.001 1.77 (1.47 to 2.13) < 0.001 1.68 (1.30 to 2.17) < 0.001 ≥ 6 1.79 (1.58 to 2.04) < 0.001 1.92 (1.63 to 2.26) < 0.001 2.26 (1.87 to 2.72) < 0.001 1.66 (1.24 to 2.23) < 0.001 Continuous value 1.11 (1.09 to 1.13) < 0.001 1.12 (1.10 to 1.15) < 0.001 1.13 (1.10 to 1.16) < 0.001 1.09 (1.05 to 1.13) < 0.001 Cumulative unfavorable SDOH Low-burden (≤ 2) 1.00 (ref) 1.00 (ref) 1.00 (ref) 1.00 (ref) High-burden (> 2) 1.33 (1.25 to 1.41) < 0.001 1.39 (1.29 to 1.50) < 0.001 1.38 (1.26 to 1.51) < 0.001 1.19 (1.05 to 1.35) 0.007 Note. *According to Asian-Pacific guidelines, BMI is divided into four groups: underweight (< 18.5 kg/m2), normal weight (18.5–22.9 kg/m2), overweight (23.0–24.9 kg/m2), and obese (≥ 25.0 kg/m2). The figures in bold indicate statistical significance (P-value < 0.05). aThis model was adjusted for all sociodemographic variables. aOR, adjusted odds ratio; BMI, body mass index; CI: confidence interval; KNHANES, Korea National Health and Nutrition Examination Survey; SDOH, social determinants of health; T2DM, type 2 diabetes mellitus. Table 3. Adjusted odds ratios for vulnerable groups with T2DM (aOR [95% CI]) based on data obtained from the KNHANES
Examining the contribution of each component underlying this cumulative burden, unfavorable conditions across all individual SDOH indicators were consistently associated with higher odds of T2DM compared to their more advantaged counterparts. Among the individual SDOH indicators, government or no health insurance coverage showed the strongest association with T2DM (aOR, 1.30 [95% CI: 1.22 to 1.39]), followed by unemployment (1.25 [1.18 to 1.33]), lower household income (1.25 [1.18 to 1.32]), and lower education level (1.25 [1.17 to 1.33]). In addition, all VIFs were below 2.0, confirming that the estimates were not influenced by multicollinearity among SDOH variables (Supplementary Table S9). These findings emphasize the important role of socioeconomic and structural disadvantages in shaping vulnerability to T2DM.
-
This study examined the long-term trends in T2DM prevalence according to SDOH among Korean adults from 2007 to 2024, utilizing nationally representative data. The prevalence of T2DM continued to rise through the early intra-pandemic period, reaching its peak in 2021, followed by a modest decline during 2022–2023 before rebounding in 2024. T2DM prevalence was higher among individuals with a high-burden of SDOH group, with government or no health insurance coverage emerging as the most prominent individual risk factor. Similar patterns were observed in groups defined as having unfavorable levels of employment status, household income, education level, home ownership, and marital status. These associations remained consistent across multiple sensitivity analyses, including age-standardized estimates and weighted SDOH scores. Other major risk factors included older age, male, obesity, and smoking status. These findings highlight the necessity of an integrated public health strategy that simultaneously addresses both structural inequalities and individual-level risk factors to effectively manage the growing burden of T2DM in South Korea.
-
Our findings indicate that a higher burden of unfavorable SDOH is associated with an increased prevalence of T2DM[24]. This association was evident both in the cumulative SDOH burden and in several individual sociodemographic indicators, suggesting that social disadvantage plays a central role in shaping T2DM risk. The cumulative effects of socioeconomic adversity can manifest through chronic psychosocial stress. This stress stimulates the release of glucocorticoids and catecholamines, activates pro-inflammatory pathways (i.e., interleukin-6, tumor necrosis factor-α), and disrupts glucose homeostasis[25]. Together, these biological responses might contribute to insulin resistance and increase the likelihood of developing T2DM[25,26].
Among all SDOH domains examined, government or no health insurance emerged as the greatest predictor of T2DM prevalence. Individuals without adequate insurance coverage may face barriers to timely diagnosis, routine screening, and ongoing disease management, potentially contributing to undetected or poorly controlled T2DM[27]. Lower education level also showed a substantial association[28], as it influences a wide range of downstream factors—including health literacy, self-management behaviors, preventive care utilization, and the ability to interpret health information—which collectively affect an individual’s capacity to maintain metabolic health[4]. A lower education level is also closely tied to broader structural disadvantages—such as unstable employment, food insecurity, lack of health insurance coverage, and limited access to environments that support healthy dietary patterns or physical activity—which may help explain the higher T2DM prevalence observed in the high-burden group[29].
The pandemic may have intensified these disparities through a diagnostic delay followed by an increase during the preliminary post-pandemic period. In our data, T2DM prevalence increased through 2021, showed a modest decline in 2022–2023, and rose again in 2024, a pattern that may reflect delayed detection followed by accumulated metabolic burden. This trend may reflect not only accumulated metabolic debt but also the virus’s potential effect, where direct pancreatic injury and persistent insulin resistance can facilitate new-onset T2DM[12,30]. These biological risks, combined with limited access to technology-based care, potentially imposed a disproportionate burden populations with unfavorable SDOH, leading to the long-term metabolic consequences observed in our study[12,13].
-
Contrary to previous small-cohort studies, our study analyzed a large, nationally representative sample of 81,065 adults, ensuring sufficient statistical power and generalizability (n=60,098, 2011–2020[31]; n=79,753, 1998–2018[32] vs. n=85,695, 2007–2024). A key strength is our extended timeframe, which captures the entire trajectory of the COVID-19 pandemic up to 2024, including the preliminary post-pandemic period. This allowed for a more nuanced interpretation of the pandemic's long-term consequences on T2DM management, distinguishing immediate shocks from persistent effects, in contrast to prior studies limited to the pandemic's initial phase (2019–2022[6], 2011–2022[33] vs. 2007–2024). Furthermore, this is one of the first long-term studies in South Korea to investigate the association between a cumulative count of unfavorable SDOH and T2DM prevalence. While previous studies focused on individual socioeconomic factors[3], our approach using a cumulative SDOH score reveals the synergistic and graded impact of social disadvantages on T2DM risk.
-
T2DM results from a complex interplay between individual lifestyle factors and powerful structural determinants[5,10]. The profound impact of cumulative burden of social disadvantage on T2DM prevalence requires a paradigm shift from individual behavioral modifications to structural transformations[34]. From a clinical perspective, lack of health insurance coverage represents a critical access barrier that may be associated with delayed diagnosis and reduced continuity of care. Expanding coverage and reducing out-of-pocket costs for high-risk populations should therefore be prioritized as a frontline clinical strategy[35]. Lower educational attainment may further be associated with lower health literacy, potentially limiting health literacy and limiting effective engagement with both conventional and digital health interventions[36,37]. Digital health interventions must move beyond merely expanding technological access and instead embed equity through digital literacy support and user-centered design that accommodates diverse levels of health literacy[38,39]. At the policy level, addressing upstream drivers like food insecurity and unemployment demands a "Health in All Policies" approach. This includes incorporating health equity impact assessments across non-health sectors such as urban planning and labor market policies[40,41]. Despite South Korea's near-universal health insurance system, individuals who remain underserved by this infrastructure may face disproportionate barriers to timely diabetes screening and management[42]. With respect to insurance coverage, South Korea's National Health Insurance Service could consider expanding its targeted outreach programs, such as the Community Health Care Center initiative, to actively identify and enroll uninsured or underinsured individuals in high-risk SDOH burden groups, coupled with waived or reduced copayments for diabetes screening and management[35]. Furthermore, systemic solutions to obesogenic environments should include fiscal policies, specifically taxation on sugar-sweetened beverages combined with subsidies for fresh produce. These integrated strategies are critical for dismantling the structural roots of T2DM inequalities in the post-pandemic era.
-
This study has several limitations. First, given the multifactorial nature of T2DM and the interrelated structure of the covariates, interpreting the effect of any single variable in isolation requires caution. To mitigate this limitation, we adopted a cumulative risk approach based on constructing an index of unfavorable SDOH. This allowed us to capture the synergistic burden of multiple interconnected social disadvantages, rather than relying solely on the isolated associations of individual variable. Second, because KNHANES data are derived from self-reported questionnaires, they are inherently subject to response bias, and the results may vary depending on the participant's recall. To mitigate these limitations, we attempted to include variables defined by objective measures, such as experience with a diagnosis from a physician, a fasting glucose level, and a hemoglobin A1c level, whenever possible. Third, because this study used only Korean data, the applicability of the results to other ethnic groups or countries may be limited. Therefore, similar follow-up studies using data from other countries are needed. Fourth, the cross-sectional design of our study precludes the establishment of causal relationships between the cumulative burden of unfavorable SDOH and T2DM[43]. Nevertheless, this design is effective for identifying significant associations and generating hypotheses for future longitudinal research. Fifth, the cross-sectional nature of the data prevented longitudinal follow-up of the same individuals. As a result, direct within-person changes associated with the evolving pandemic context could not be assessed. Nevertheless, this limitation was partially mitigated by the use of nationally representative samples collected with consistent survey methodology across survey years and by adjustment for a comprehensive set of sociodemographic and health-related covariates to enhance comparability between survey cycles. Finally, many of the SDOH variables were measured using categorized or simplified indicators; household income was grouped into quartiles, and food security was a binary measure. Such categorization, while necessary for large-scale survey analysis, may not fully capture the complex and continuous nature of these social constructs, potentially leading to some loss of information.
Despite these limitations, to the best of our knowledge, this study is among the first in South Korea to investigate the association between the cumulative number of unfavorable SDOH and the prevalence of T2DM using a large, nationally representative sample over an extended period. This approach moves beyond analyzing individual socioeconomic factors in isolation to reveal the synergistic and graded impact of social disadvantages on T2DM risk, providing a more holistic view of health inequality.
-
This study analyzed long-term trends in T2DM prevalence and its association with SDOH in South Korea using nationally representative data from 2007 to 2024. The prevalence of T2DM continued to rise through the intra-pandemic period and was closely associated with a greater cumulative burden of unfavorable SDOH. Among the individual SDOH indicators, government or no health insurance showed the strongest association. These findings highlight the need for proactive, integrated public health strategies that target both individual risk factors and social inequalities to manage the growing T2DM burden.
HTML
Data Source
Ascertainment of T2DM
Definition of Social Determinants of Health
Covariates
Statistical Analysis
Baseline Characteristics
Trends in T2DM Prevalence across Pandemic Periods and Cumulative SDOH
Association Between SDOH and T2DM Prevalence
Key Findings
Plausible Underlying Mechanisms
Comparison to Previous Studies
Clinical and Policy Implications
Strengths and Limitations
Conflict of Interest Statement The authors have no conflicts of interest to declare.
Ethics The research protocol was approved by the Institutional Review Boards of the KDCA (2007-02CON-04-P, 2008-04EXP-01-C, 2009-01CON-03-2C, 2010-02CON-21-C, 2011-02CON-06-C, 2012-01EXP-01-2C, 2013-07CON-03-4C, 2013-12EXP-03-5C, 2018-01-03-P-A, 2018-01-03-C-A, 2018-01-03-2C-A, 2018-01-03-5C-A, 2018-01-03-4C-A, 2022-11-16-R-A, and 2022-11-16-R-03). Written informed consent was obtained from all participants prior to their participation. The study was conducted in accordance with the ethical principles of the Declaration of Helsinki.
Authors’ Contributions Dr. Dongkeon Yon had full access to all of the data in the study and took responsibility for the integrity of the data and the accuracy of the data analysis. All authors approved the final version of the manuscript before submission. Study concept and design: Jihu Im, Juyeong Kim, and Dongkeon Yon; acquisition, analysis, or interpretation of data: Jihu Im, Juyeong Kim, and Dongkeon Yon; drafting of the manuscript: Jihu Im, Juyeong Kim, and Dongkeon Yon; critical revision of the manuscript for important intellectual content: all authors; statistical analysis: Jihu Im, Juyeong Kim, and Dongkeon Yon; study supervision: Dongkeon Yon. Dongkeon Yon supervised the study and served as a guarantor. Jihu Im and Juyeong Kim contributed equally as first authors. Dongkeon Yon contributed as corresponding author. The corresponding author attests that all listed authors meet the authorship criteria and that no one meeting the criteria has been omitted. All authors had full access to the study data and had final responsibility for the decision to submit for publication.
Data Availability Statement Data are publicly available on legal and ethical grounds from the KDCA as open data (https://www.kdca.go.kr/yhs/home.jsp).
&These authors contributed equally to this work.

 Quick Links
 DownLoad: